Environmental Management Accounting (EMA): Empirical Evidence ...

Electronic copy available at: http://ssrn.com/abstract=2021993
Online Poker in North America:Empirical Evidence on its Complementary
Effect on the Offline Gambling Market
Kahlil Philander*Ingo Fiedler**
Abstract
The relationship between online gambling and offline gambling is still an unset-tled question: Is online poker mainly a new way of distribution, substituting theoffline gambling products? Or does it add to the portfolio of gambling productsas a complement, increasing not only the total volume of revenues but also therevenues of each product? This paper is first to shed light on this issue, usinga cross-section of online poker revenue and offline gambling revenue in all U.S.states and Canadian provinces. The main finding is that online poker and offlinegambling are complementary goods, which suggests that the presence of onlinepoker may increase demand of offline gambling overall. These findings suggestthat the offline gambling industry should not generally be adverse to the expansionof Internet poker. This study also reveals the most accurate estimates to date of theonline poker market size in 2010 in U.S. states and Canadian provinces/territories.
* Kahlil Philander is a doctoral candidate at the University of Nevada, Las Vegas.** Ingo Fiedler is a research associate at the Institute of Law & Economics at theUniversity of Hamburg

Electronic copy available at: http://ssrn.com/abstract=2021993
Introduction
The introduction of a new medium to provide an existing product is an issue that
has been observed in many industries. The overall impact is generally the balance
of stimulated growth in the market from the new medium less the loss of the in-
cumbents’ share in the old medium. Much in the way that the automobile replace
the horse and buggy, many industry observers feel that growth in online gaming
may come at the expense of offline (or brick and mortar) casinos. [21, 22] Under-
standing the nature of this relationship is quite important from a policy perspec-
tive. If the relationship is substitutionary as many believe, then the introduction
of widespread legal online gaming may come at the expense of casino operators,
and tax revenue generated from those operations. However, if the relationship is
complementary there should be fewer direct economic concerns about the spread
of online poker, but more focus on the epidemiological risks of more gambling
through both mediums.
In this study, we seek to empirically estimate the relationship between traditional
offline gaming revenue and one specific form of online gaming that has received
much attention for regulation in the U.S.1 and Canada2, Internet poker. We use
data from the Online Poker Database of the Univeristy of Hamburg (OPD-UHH)
1See the discussions during the last years in the Gaming Law Review and Economics as well aslots of media coverage on this issue.
2The regulation of online poker is quite different in Canada with Quebec and British Columbiaintroducing a state-owned online poker provider, while being not regulated and/or forbidden inother provinces.
2

to estimate the market sizes of online poker in each state of the U.S. and Canadian
provinces. The data covers 87% of the online poker market in the U.S. and 65% of
the Canadian market and applies to 2010 and falls into the relatively stable post-
UIGEA/pre-Black Friday period.3 Extrapolated to the whole market, we use this
data to provide a cross-sectional analysis of its relationship to the offline gambling
revenues in the respective states and provinces.
This article is structured as follows: In the literature section we provide an
overview of the limited research on the online poker market and the relationship
between online and offline gaming. In the subsequent two sections we provide
accurate estimates of prevalence and size of the online poker market in North
America in 2010, sub-divided by U.S. states and Canadian provinces/territories.
We then turn to the question of whether online poker and offline gaming are gross
substitutes (whose consumption reduces demand for the other product) or gross
complements (whose consumption increases demand for the other product). We
answer this question with the help of ordinary least squares regression models.
Afterwards, we describe the limitations of our study and provide a discussion of
the results.3Specifically, the data was gathered between October 2009 and March 2010.
3

Literature
To the authors’ knowledge, the studies using the OPD-UHH are are the only aca-
demic research on the prevalence and market size of online poker. The total mar-
ket size of online poker is estimated at 3.6 billion USD in worldwide revenue
per year, with the U.S. representing the largest market with nearly $1 billion in
revenue. [8] An important variable to explain the market size of online poker in
a country was found to be income per capita. However, when investigating the
homogenous countries of the European Union, Internet activity was found to have
the strongest correlation with the prevalence of online poker. [9] Another study
of the data of the OPD-UHH found that legal status does not seem to have any
influence on prevalence at the national level.4 [7].
To date, no peer-reviewed study has empirically examined the relationship be-
tween online poker and offline gaming, however there is some evidence that the
overall relationship between all of online gaming and casino gaming is substitu-
tionary. [18] That study did not examine poker specifically, and instead aggregated
all forms of online gaming. Walker and Jackson estimate the relationship between
several offline gaming industries, finding some complementary relationships and
some substitutionary relationships. They find that casino gaming is positively re-
lated to in-state tribal casino gaming, but negatively related to lottery gaming. [26]
They also reinforce the earlier finding by Siegel and Anders of a negative relation-
4Note that data in that study precedes the pre-Black Friday period.
4

ship between lottery gaming and tribal casino gaming. [20] Elliot and Navin find
that an additional dollar in casino tax revenue is offset by an estimated $0.83
reduction in lottery revenue, however, Fink and Rork revise these estimates by
providing a remedy of the potential selection bias in states with casino gaming
and provide a revised reduction estimate of $0.56. [5, 11]
Regarding the determinants of gaming revenue, Philander reinforced earlier
findings from Morgan and Vasche, Suits, and Thalheimer and Ali that in-
come/economic output are important to demand. [15, 18, 23, 25] Logically, those
studies also found that the availability of gaming (in various forms) will positively
affect gross gaming revenues. In online poker, availability is primarily determined
by Internet access rates, but also can be affected by regulation.5 This suggests that
Canadian provinces may have different output levels than U.S. states since their
financial transactions are not inhibited by the UIGEA. Also, Washington state on-
line poker revenue may be affected by its specific regulation that makes online
gaming illegal. During this study’s data collection period, the World’s largest on-
line poker room, Pokerstars, did not allow wagers from players located in Wash-
ington state.
5Technically, an online poker player only needs to have a computer with a stable internet connectionto participate in the games. However, legal constraints can form another barrier, e.g. when it isillegal to take part in online poker. The regulation may seen as a continuum from a free market,over a regulated market with advertisment restrictions to a complete and enforced ban. Hence,online poker has a higher availability in a jurisdiction where it is legal than in a jurisdiction whereit is prohibited.
5

The US Online Poker Market
Data from the OPD-UHH shows that in the period from September 2009 to March
2010, 1,429,943 Americans (.46% of the population) played online poker for real
money.6 Overall, 981 million USD in gross gaming revenue flows from the U.S.
to foreign site operators. The number of players, the prevalence of play in the
population, and the market size for each state, as well as the District of Columbia
and Puerto Rico, is shown in Table 1. The largest market for online poker is Cal-
ifornia, with roughly 178,000 active players and $155 million in playing volume,
which translates to a market share of 16%. It is followed by New York where
83,000 players generate revenue of $72 million for the poker sites and Texas with
108,000 players and a playing volume of $62 million. The states with the high-
est proportion of online poker players per capita are New Hampshire and Nevada
with .97% and .96%. As the column “Prevalence region/country” shows it is
twice as likely for a person from these states to play online poker as compared to
the country average. Alaska follows with .79% of the population gambling on-
line on poker, along with North Dakota and Massachusetts with .77% and .72%
respectively. Maryland, Hawaii, West Virginia have an average prevalence of on-
line poker. Interestingly, although the most famous poker form is called Texas
Hold’em7, the proportion of online poker players in Texas is less than the national
6For a detailed description of the data see [7] or [9].759% of all online poker players play No Limit Hold’em, 17% play Fixed Limit Hold’em and 5%Pot Limit Hold’em [6]. Of the many other poker forms, Pot Limit Omaha is the most famous witha 9% player share.
6

average.
Rank State Population Players8 Prevalence population Prevalence region/country Revenue in mil. U.S.$ Market share
U.S. Total 310.973.838 1,429,943 0,46% 1.00 981.01 100%
1 California 36,961,664 178,350 .48% 1.05 154.59 15.88%2 New York 19,541,453 82,824 .42% .92 71.52 7.35%3 Texas 24,782,302 107,746 .43% .95 62.36 6.41%4 Illinois 12,910,409 68,210 .53% 1.15 56.21 5.78%5 Florida 18,537,969 80,289 .43% .94 47.57 4.89%6 Nevada 2,643,085 25,484 .96% 2.10 37.58 3.86%7 Massachusetts 6,593,587 47,425 .72% 1.56 35.62 3.66%8 Pennsylvania 12,604,767 51,880 .41% .90 32.72 3.36%9 Ohio 11,542,645 60,558 .52% 1.14 32.11 3.30%10 New Jersey 8,707,739 38,095 .44% .95 29.13 2.99%11 Michigan 9,969,727 47,512 .48% 1.04 26.88 2.76%12 Virginia 7,882,590 34,229 .43% .94 23.90 2.46%13 Minnesota 5,266,214 32,726 .62% 1.35 22.87 2.35%14 Maryland 5,699,478 26,573 .47% 1.01 21.60 2.22%15 Georgia 9,829,211 34,985 .36% .77 21.38 2.20%16 North Carolina 9,380,884 33,496 .36% .78 20.49 2.11%17 Washington 6,664,195 27,604 .41% .90 20.37 2.09%18 Wisconsin 5,654,774 26,798 .47% 1.03 19.99 2.05%19 Colorado 5,024,748 29,674 .59% 1.28 17.98 1.85%20 Arizona 6,595,778 28,651 .43% .94 17.50 1.80%21 Missouri 5,987,580 26,908 .45% .98 16.76 1.72%22 Indiana 6,423,113 33,074 .51% 1.12 16.34 1.68%23 Oregon 3,825,657 21,183 .55% 1.20 14.76 1.52%24 Connecticut 3,518,288 19,189 .55% 1.19 11.58 1,19%25 Tennessee 6,296,254 22,262 .35% .77 10.51 1.08%26 Arkansas 2,889,450 18,135 .63% 1.36 9.15 .94%27 Kentucky 4,314,113 16,467 .38% .83 8.81 .90%28 Iowa 3,007,856 15,986 .53% 1.16 8.46 .87%29 Alabama 4,708,708 17,030 .36% .79 8.40 .86%30 South Carolina 4,561,242 13,104 .29% .62 7.06 .73%31 Oklahoma 3,687,050 15,297 .41% .90 6.29 .69%32 Kansas 2,818,747 13,516 .48% 1.04 6.34 .65%33 New Hampshire 1,324,575 12,785 .97% 2.10 6.24 .64%34 Maine 1,318,301 9,116 .69% 1.50 5.54 .61%35 West Virginia 1,819,777 8,203 .45% .98 5.58 .57%36 Nebraska 1,796,619 8,812 .49% 1.07 5.52 .57%37 North Dakota 646,844 5,002 .77% 1.68 4.98 .51%38 Mississippi 2,951,996 9,969 .34% .73 4.96 .51%39 Louisiana 4,492,076 13,369 .30% .65 4.92 .51%40 Alaska 698,473 5,522 .79% 1.72 4.90 .50%41 New Mexico 2,009,671 7,118 .35% .77 4.53 .47%42 Hawaii 1,295,178 6,017 .46% 1.01 4.51 .46%43 Montana 974,989 5,570 .57% 1.24 3.68 .38%44 Idaho 1,545,801 7,398 .48% 1.04 3.67 .38%45 Utah 2,784,572 8,640 .31% .67 3.46 .36%46 Rhode Island 1,053,209 6,149 .58% 1.27 3.38 .35%47 District of Columbia 599,657 2,454 .41% .89 2.51 .26%48 South Dakota 812,383 4,590 .57% 1.23 2.13 .22%49 Vermont 621,760 3,870 .62% 1.35 1.93 .20%50 Delaware 885,122 3,501 .40% .86 1.44 .15%51 Puerto Rico 3,967,288 2,509 .06% .14 .99 .10%52 Wyoming 544,270 2,990 .55% 1.19 .85 .09%
n.a.9 1,095
Source population data: U.S. Census Bureau, 2009.
Table 1: The U.S. Online Poker Market in 2010.
7

The Canadian Online Poker Market
Although the absolute size of the market is smaller in Canada with 220 million
USD, the prevalence of online poker is nearly twice as high as in the U.S.: roughly
307,000 Canadians, or .90%, of Canada plays poker online for real money (see ta-
ble 2). Ontario’s 110,000 players generate the largest share of activity represent-
ing 37.7% of the total market. Quebec and British Columbia follow with 18.7%
and 17.3%, which is interesting in so far as Quebec has a much higher population
than British Columbia. The highest share of players per capita can be found in
the low populated regions of the Northwest Territories, Nunavut, Yukon Territory,
and Prince Edward Island. The prevalence of online poker in those jurisdictions
is 1.6 to 2.7 times higher than over the whole country. The Northwest Territories
has a prevalence rate over five times the prevalence rate in the overall U.S..
Rank Region Population Players10 Prevalence population Prevalence region/country Revenue in mil. US$ Market share
Canada Total 34,108,800 306,596 0,90% 1.00 219.63 100%
1 Ontario 13,210,700 110,159 .83% .92 84.15 37.72%2 Quebec 7,907,400 66,912 .85% .94 41.66 18.67%3 British Columbia 4,531,000 42,299 .93% 1.03 38.67 17.33%4 Alberta 3,720,900 40,918 1.10% 1.22 36.47 16.35%5 Manitoba 1,235,400 13,356 1.08% 1.20 7.17 3.22%6 Saskatchewan 1,045,600 12,303 1.18% 1.31 6.74 3.02%7 New Brunswick 751,800 6,859 .91% 1.01 2.74 1.23%8 Nova Scotia 942,500 6,373 .68% .76 2.63 1.18%9 Newfoundland and Labrador 509,700 3,045 0.60% .67 1.38 .62%10 Prince Edward Island 142,300 1,990 1.40% 1.56 0.74 .33%11 Yukon Territory 34,500 647 1.88% 2.09 0.31 .14%12 Northwest Territories 43,800 1,075 2.45% 2.72 0.26 .12%13 Nunavut 33,200 660 1.99% 2.21 0.16 .07%
Source: population data: Statistics Canada, CANSIM, Population by year, by province and territory, 2010.
Table 2: The Canadian Online Poker Market in 2010.
8

The Relationship to the Offline Gaming Market
Methodology
In order to estimate the relationship of the 1.2 billion USD North American on-
line poker market and the offline gaming market, several ordinary least squares re-
gression models with different specifications to test for variable significance were
developed. The dependent variable of this empirical analysis is the estimated an-
nual online poker revenue for each U.S. state, the District of Columbia, and each
Canadian province. As there are no empirical studies that the authors are aware
of that have clearly defined the determinants of the demand for online gaming,
this study draws on literature of offline gaming demand and socio-demographics
characteristics of online gamblers, to define a set of potential control variables.
The variable of interest, casino revenue, was compiled from a number of sources.
U.S. commercial casino revenue, along with racetrack casino revenue, casino
counts, and gaming machine counts were obtained from the 2010 American Gam-
ing Association State of the States Report [2]. Since U.S. tribal casino revenue
is not publically reported in all U.S. states where tribal gaming occurs, estimates
of its revenue were obtained from Meister’s annual report on tribal gaming [13].
11 U.S. lottery revenue was obtained from the Tax Foundation. [24] Canadian
11For confidentiality reasons, gaming and non-gaming revenue figures for Alabama, Alaska, Col-orado, Mississippi, Nebraska, Nevada, North Carolina, Texas, and Wyoming are aggregatedby [13] into “Other States with Indian Gaming.” To address this issue a log-log regression modelusing number of slot machines and number of tribal casino locations as independent variables was
9
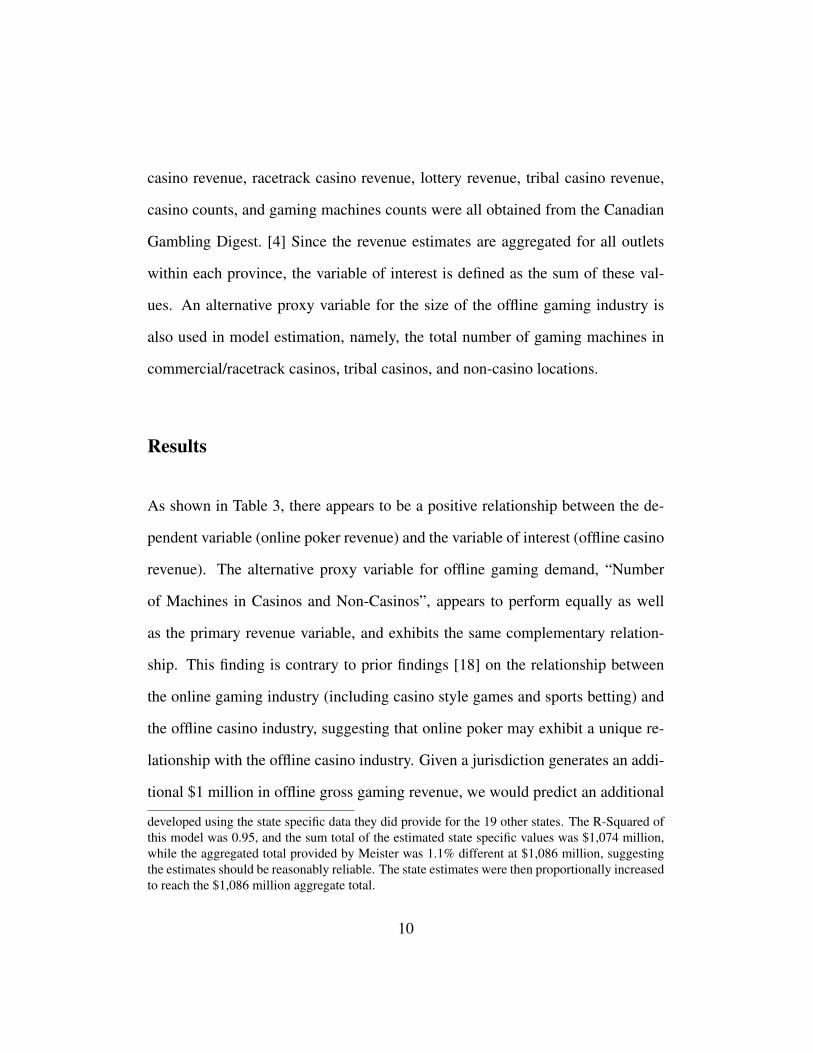
casino revenue, racetrack casino revenue, lottery revenue, tribal casino revenue,
casino counts, and gaming machines counts were all obtained from the Canadian
Gambling Digest. [4] Since the revenue estimates are aggregated for all outlets
within each province, the variable of interest is defined as the sum of these val-
ues. An alternative proxy variable for the size of the offline gaming industry is
also used in model estimation, namely, the total number of gaming machines in
commercial/racetrack casinos, tribal casinos, and non-casino locations.
Results
As shown in Table 3, there appears to be a positive relationship between the de-
pendent variable (online poker revenue) and the variable of interest (offline casino
revenue). The alternative proxy variable for offline gaming demand, “Number
of Machines in Casinos and Non-Casinos”, appears to perform equally as well
as the primary revenue variable, and exhibits the same complementary relation-
ship. This finding is contrary to prior findings [18] on the relationship between
the online gaming industry (including casino style games and sports betting) and
the offline casino industry, suggesting that online poker may exhibit a unique re-
lationship with the offline casino industry. Given a jurisdiction generates an addi-
tional $1 million in offline gross gaming revenue, we would predict an additional
developed using the state specific data they did provide for the 19 other states. The R-Squared ofthis model was 0.95, and the sum total of the estimated state specific values was $1,074 million,while the aggregated total provided by Meister was 1.1% different at $1,086 million, suggestingthe estimates should be reasonably reliable. The state estimates were then proportionally increasedto reach the $1,086 million aggregate total.
10

2,700 USD in online poker revenue. Although this effect may appear to be rela-
tively small, the finding is robust across many model specifications, suggesting a
stronger argument for validity. Potential explanations for this relationship are pro-
vided in the Discussion and Perspectives section. Contrary to the offline casino
finding, the coefficient on lottery sales was not found to be significantly related
to online poker revenue. This suggests that the presence of a larger offline casino
market will positively affect online poker activity, but that the lottery market has
no impact on online poker demand.
A few other results from the empirical analysis are worth noting. As expected,
the population size and Internet user rates are both found to be positively related
to online poker revenue. As the population in a jurisdiction increases, and as an
increasing proportion of the population has access to the Internet, online poker ac-
tivity increases. Both regional dummy variables, depicting Washington state and
Canadian province, are significant. Canada is found to have higher comparative
online poker revenue than the U.S.. In part, this may be the case since financial
transactions with operators are much less restricted in Canada than in the U.S.,
where the UIGEA has inhibited the ability for players to deposit/withdraw money
to/from their accounts. Washington state is found to have a significantly smaller
market size than the other jurisdictions. Washington was the only jurisdiction
during the estimation period where regional legislation made wagering online ex-
plicitly illegal, and where Pokerstars did not accept wagers. Finally, disposable
income is found to be statistically significant in only Model 7. Multicollinearity
11

does not seem to be the cause of the lack of robust estimates, as all variables’
variance inflation factors are less than 1.5. A Shapiro-Wilk test did not reveal a
significant departure from normality in the model residuals, z=1.067, p=0.143.
We therefore find the required assumptions to fit an OLS model do not appear to
be violated. The adjusted R2 of the full model was 0.92, suggesting a well-fitted
model. In general, the direction of coefficients for the explanatory variables in
Table 3 are consistent with results in prior studies and/or economic theory, with
exception to the relatively unrobust income coefficient estimates.
Other model specifications were estimated in order to test for variable signifi-
cance. Where these variables were found to be insignificant in the fully specified
models (6 & 7), they were generally dropped from the final specification in or-
der to reduce inference issues from multicollinearity. However, Model 8 includes
the lottery revenue variable to illustrate the statistically insignificant relationship.
Variables tested, but excluded from the results in Table 3 because of insignifi-
cance, include smoking prevalence rates, heavy drinking prevalence rates, higher
education levels, unemployment rates, and gross domestic product.
12

Dependent Variable: Online Poker Market Size (USD)Coefficients Model (1) Model (2) Model (3) Model (4) Model (5) Model (6) Model (7) Model (8)
Casino Revenue (Millions of USD) 2544.61*** 2584.04*** 2548.90*** 2588.46*** 2701.09*** 2749.99***(4.28) (3.58) (4.30) (4.41) (4.66) (4.65)
Lottery Revenue (Millions of USD) 2613.61(0.58)
Number of Machines in Casinos and Non-Casinos 158.50*** 176.19***(6.39) (7.38)
Internet Users per 1,000,000 78.03*** 83.05** 82.41** 89.53** 65.42** 63.70** 65.57***(3.84) (3.26) (3.13) (3.40) (3.67) (3.57) (3.74)
Disposable Income per Capita (Thousands USD) 240.23 -104.62 -64.52 -103.88 224.79 283.38* 201.10(1.42) (-0.52) (-0.33) (-0.51) (1.49) (2.04) (1.35)
Population 3.31*** 3.29*** 3.32*** 3.49*** 3.32*** 3.39*** 3.57*** 3.25***(12.08) (10.66) (11.97) (11.46) (12.09) (12.89) (12.60) (7.16)
Washington State Dummy −1.24x10⁷*** −9.63x10⁶*** −9.72x10⁶*** −8.86x10⁶**(-4.44) (-5.07) (-5.51) (-3.69)
Canadian Province Dummy 1.32x10⁷*** 1.38x10⁷*** 1.26x10⁷***(4.53) (4.40) (4.58)
Constant −6.21x10⁷*** −1.03x10⁷ −6.23x10⁷*** −6.37x10⁷*** −6.72x10⁷*** −6.29x10⁷*** −6.43x10⁷*** −6.24x10⁷***(-3.96) (-1.71) (-3.92) (-3.92) (-4.06) (-4.72) (-4.81) (-4.67)
Adjusted R-square 0.882 0.857 0.880 0.880 0.882 0.915 0.917 0.914
*Denotes significance at the 0.05α level; **denotes significance at the 0.01α level; ***denotes significance at the 0.001α level. Numbers in brackets denote t-values. N=61
Table 3: Estimation Results of Ordinary Least Squares Regression.13

Limitations
Although the relationship between the two revenue variables appears to be con-
sistent across many model specifications, it would be inappropriate to infer any
direction of impact or a specific causal relationship from this non-experimental
design. For example, it may be the case that the presence of increased advertising
from online poker operators caused an increase in demand for all gaming. Alter-
natively (or in addition) it may be the case that residents in states with widespread
offline gaming will be more receptive to online poker gaming, thereby producing
the positive association.
Further, the direction of relationship does not necessarily need to be consistent
across all jurisdictions to produce this average finding. It may be the case that
behavior in a state with many offline gaming options, like Nevada, would be quite
different than in a state with no legal gaming options like Hawaii. For example,
many Las Vegas poker rooms anecdotally observed immediate increases in pa-
tronage after Black Friday restricted access to online poker sites, suggesting some
substitutionary activity (though the long-term marginal effect remains unknown).
Finally, there are some variables that may be important determinants of online
poker demand that are not included in this study. For example, advertisements are
widely used by online poker operators, but there are no reliable means to control
for this variable in this study. Any correlation between online poker advertising
and the offline revenue figure may produce some bias the results. In any case, the
14

findings from this study certainly have some importance for policy debates over
the introduction of legal Internet poker. Offline casino stakeholders can be less
concerned that the widespread introduction of legal online poker will significantly
cannibalize existing demand.
Discussion and Perspectives
This paper described the prevalence and market size of the North American online
poker market and the relationship between online poker and offline gambling. We
used data from the Online Poker Database of the University of Hamburg (OPD-
UHH) on revenue during the stable post-UIGEA/pre-Black Friday period in all
U.S. states and Canadian provinces. We found that there were approximately
1.4 million U.S. players who played poker for real money over the Internet during
this period. They paid $981 million dollars in rake to site operators. The Canadian
market is smaller with $220 million, but given the country’s smaller population the
prevalence of 307,000 players is nearly twice as high as the rate in the U.S. (0.9%
of the population compared to 0.46%). Although the reason for this difference
likely depends on several factors, one important factor may be that in Canada
the financial transactions between players and operators were not limited by the
UIGEA. The importance of regulation on poker activity is further supported by
the empirical finding that Washington state has a significantly lower online poker
revenue level, given its other characteristics.
15

The other main objective of this paper was to investigate the relationship of this
billion-dollar market to the offline gaming industry. Existing literature [18] sug-
gests that these products are substitutes that compete with each other for gaming
revenue. We used ordinary least square models to test this relationship in North
America, controlling for potential explanatory variables like income per capita,
population, and Internet prevalence rates. The results are surprising: overall, on-
line poker and offline gaming do not compete for an identical market and can-
nibalize each other’s revenue. Rather, we found a small but significant positive
relationship between those variables. This indicates that the markets reinforce
each other and the goods are gross complements and not gross substitutes. De-
pending on the model, we found that in a market with an additional $1 million
in casino revenue, we would predict an additional $2.7 thousand in online poker
revenue. That means that the larger the online poker market, the larger the offline
gambling market and vice versa. On the other hands that means that a reduced
online poker market has a negative effect on the size of the offline gaming indus-
try. We further found no significant effects of the size of the lottery industry on
online poker revenue. That is counterevidence to the argument for state-owned
lottery monopolies, like in Germany, to “cannibalize” the demand for gambling
from highly addictive products to a product with low risks of creating gambling
problems. This implies taht lotteries are different from other gambling forms like
slot machines.
This result has major implications for gaming operators, regulators, and addiction
16

stakeholders. Brick and mortar casinos can be less wary of competition from on-
line poker, and should be more receptive to this new form of gaming as it appears
to be positively related to their own revenue. Should legalization of online poker
occur in more North American jurisdictions, further collaboration between online
and offline operators would be expected to lead to synergistic effects, increasing
the complementary relationship and profit on both sides. 12 While the comple-
mentary effect appears to be positive for these offline and online operators, it leads
to the common double-edged sword for regulators. In support of legalization is the
incentive to accrue the benefits of tax revenue on this product as well as increased
taxes on offline gaming. Conversely, legalization leads to higher availibility of
this product and and a larger market size, which may lead to more gambling prob-
lems. [17, pp.30], [1], [12], [19], [28]. Hence, finance departments’ interest in the
complementary effect between online poker and offline gaming, as an argument
to legalize online poker, must be balanced against health departments’ concerns
around the very same finding.
Future research may try to replicate these results in a different setting and inves-
tigate why online poker is complementary towards offline gaming. This could be
done by examining the effect of online poker on offline casinos using a causal
model design. That is, as more data become available and allows for a large sam-
12For example, Caesars Entertainment Corporation has noted in their IPO filing information: “Webelieve that the expansion of online gaming offerings, for real money, ‘for fun’ and social andmobile games, will benefit our land-based portfolio due to further brand enhancement, customeracquisition in new channels, and marketing arrangements including incorporating our Total Re-wards and cash-back for points programs into our online gaming offerings.”
17

ple to be analyzed, researchers may wish to apply methods on a data set with of-
fline revenue as the dependent variable. An endogenous selection model could be
used to correct for states without casino gaming, and Internet user rates could be
used as an instrument for online poker revenue. An investigation of a jurisdiction
with more tightly controlled regulation, such as Sweden with government-owned
Svenka-Spel, may allow for reasonable estimation of the amount of money spent
on advertising and promotion, to infer the order of magnitude of those effects.
Another starting point may be the finding that online poker shows a significant
positive correlation with casino games and slot machines but not with lotteries. A
potential reason could be the much lower addictive potential of lotteries in com-
parison to other games like slot machines.13 Expansion of the scope of the study
into other forms of gaming, such as horse racing, may also be warranted.
13The higher addictive potential of slot machines compared to other gambling forms can be shownquantitavely by the corresponding prevalence rates of gambling problems as well as qualitativelyby comparing criteria like frequency of events which are linked to gambling problems. Regardingthe quantitative approach: in Germany, for example, the lifetime prevalence of gambling prob-lems among slot machine gamblers was found to be between 18.9% and 33.5% (depending onwhether the slot machines are located inside or outside of casinos) compared to 4.6% for lotterygamblers [14]. The 12-months prevalence rates of gambling problems were found to be 13% forslot machines compared to 0.6% for lotteries [3]. Similar numbers were also found in the UnitedKingdom (11.2% compared to 1%) [27]. Regarding the qualitative approach: whether the Assess-ment Tool to Measure and Evaluate the Risk Potential of Gambling Products (Asterig) [16] or theweighted list of criteria from Fiedler [10] is used, slot machines have high scores regarding theiraddictive potential.
18

References
[1] Max W. Abbott. Situational factors that affect gambling behavior. In
Garry Smith, David C. Hodgins, and Robert J. Williams, editors, Research
and Measurement Issues in Gambling Studies, Burlington, 2007. Academic
Press.
[2] American Gaming Association. State of the states: The AGA survey of
casino entertainment, 2010.
[3] S. Buth and H. Stöver. Glücksspielteilnahme und Glücksspielprobleme
in Deutschland: Ergebnisse einer bundesweiten Repräsentativbefragung.
Suchttherapie, 9:3–11, 2008.
[4] Canadian Partnership for Responsible Gambling. Canadian gambling digest
2009-2010, March 2011.
[5] Donald S. Elliott and John C. Navin. Has riverboat gambling reduced state
lottery revenue? Public Finance Review, 30:235–247, 2002.
[6] Ingo Fiedler. The playing habits of online poker players. Journal of Gam-
bling Business and Economics, 2012.
[7] Ingo Fiedler and Ann-Christin Wilcke. Der Markt fur Onlinepoker: Spieler-
herkunft und Spielerverhalten. Books on Demand, 2011.
[8] Ingo Fiedler and Ann-Christin Wilcke. The market for online poker. avail-
able at http://papers.ssrn.com/sol3/papers.cfm?abstract _id=1747646, 2012.
19

[9] Ingo Fiedler and Ann-Christin Wilcke. Online poker in the European Union.
Gaming Law Review and Economics, 16 (1/2):21–27, 2012.
[10] Ingo C. Fiedler. Das Gefährdungspotential von Glücks- und Geschick-
lichkeitsspielen. Books on Demand, Norderstedt, 2008.
[11] S. Fink and J. Rork. The importance of self-selection in casino cannibaliza-
tion of state lotteries. Economics Bulletin, 8(10):1–8, 2003.
[12] D. Lester. Access to gambling opportunities and compulsive gambling. In-
ternational Journal of the Addictions, 29:1611–1616, 1994.
[13] Alan Meister. Casino City’s Indian gaming industry report. Technical report,
Casino City Press, 2011.
[14] Christian Meyer, Hans-Juergen Rumpf, Anja Kreuzer, Susana de Brito,
Sonja Glorius, Christine Jeske, Nadin Kastirke, Sarah Porz, Daniela Schoen,
Anja Westram, Diana Klinger, Christian Goeze, Gallus Bischof, and Ulrich
John. Pathologisches glücksspielen und epidemiologie (page): Entste-
hung, komorbiditaet, remission und behandlung. Technical report, Institut
für Epidemiologie und Sozialmedizin and Klinik für Psychiatrie und
Psychotherapie, 2011.
[15] D. W. Morgan and J. D. Vasche. A note on the elasticity of demand for
wagering. Applied Economics, 14(5):469–474, 1982.
20

[16] Franz W. Peren. Assessment tool to measure and evaluate the risk poten-
tial of gambling products: Asterig. The Journal of Gambling Business and
Economics, 5 (2):54–66, 2011.
[17] Nancy M. Petry. Pathological gambling. etiology, comorbidity, and treat-
ment. United Book Press, Washington, 2005.
[18] Kahlil S. Philander. The effect of online gaming on commercial casino rev-
enue. UNLV Research & Review Journal, 15(2):23–34, 2011.
[19] Howard J. Shaffer. Internet gambling & addiction. Division on Addictions,
page 27 Seiten, 2004.
[20] Donald Siegel and Gary Anders. The impact of indian casinos on state lot-
teries: A case study of Arizona. Public Finance Review, 29(2):139–147,
March 2001.
[21] Chris Sieroty. Indian tribes worried about state online poker, 2012.
[22] Scott Sonner. Smaller nev. casinos say online poker will hurt, 2010.
[23] D. B. Suits. The elasticity of demand for gambling. The Quarterly Journal
of Economics, 93(1):155–162, 1979.
[24] Tax Foundation. State implicit lottery tax revenue per capita, fiscal year
2009, 2011.
[25] R. Thalheimer and M. A. Mukhtar. The demand for casino gaming. Applied
Economics, 35:907–918, 2003.
21

[26] D. M. Walker and J. D. Jackson. Do US gambling industries cannibalize
each other? Public Finance Review, 36:308–333, 2008.
[27] H. Wardle, K. Sproston, J. M. Orford, B. Erens, M. Griffiths, and R. Constan-
tine. British gambling prevalence survey 2007. Technical report, National
Center for Social Research, London, 2007.
[28] J. W. Welte, G. M. Barnes, W. F. Wieczorek, M.-C. O. Tidwell, and J. C.
Parker. Risk factors for pathological gambling. Addictive Bahaviors,
29:323–335, 2004.
22