online food company The definitive
32
1 Deliveroo The definitive online food company H1 2021 Results
Transcript of online food company The definitive

1
DeliverooThe definitiveonline food company
H1 2021 Results

Contents
1. Business highlights
2. H1 financial results
3. Post-lockdown trading
4. On demand grocery update
5. Rider proposition
6. Guidance
2

3
Business highlights | Key takeaways
Strong growth fueled by new consumers, and encouraging consumer engagement post-reopening1
Continued traction in on demand grocery and step change in selection of restaurants2
Strong rider retention and satisfaction, despite surge in vacancies elsewhere in the economy3
Investing for the long-term, with a well-capitalised balance sheet4

4
Orders:
GTV:
Gross profit:
Adjusted EBITDA:
Highly engaged marketplace
Business highlights | Strong results from relentless focus on all sides of our marketplace
Strong group financial performance in H1
Consumers:7.8 million average monthly active consumers in Q2 20211
Riders: 85% global rider satisfaction2 and strong retention and applications rates despite reopenings Restaurants: c.137,000 partner sites3 and now largest selection of food merchants in the UK
Grocers: >9,000 partner sites3 including continued rapid expansion with major partners
149m +100%YoY
£3.4bn +102%YoY
Source: Management data. GTV growth rate is shown at constant FX. Notes: (1) MACs are monthly average for Q2. (2) Rider satisfaction figures as at end of Q2. (3) Restaurant and grocer figures refer to number of sites active in June 2021.
£264m 7.8%of GTV
£(27)m (0.8)%of GTV
Contents
1. Business highlights
2. H1 financial results
3. Post-lockdown trading
4. On demand grocery update
5. Rider proposition
6. Guidance
5

6
Group H1 results | Strong growth despite easing of lockdown restrictions
Ordersm, global
GTV£m, global
x% Year-over-year growth
Source: Management accounts. All figures excluding Germany and Taiwan discontinued operations. GTV growth rates are shown at constant FX.
27% 45% 65% 77% 114% 28% 59% 74% 90% 131% 81%88%

7
Group H1 results | Consistent increase in average monthly active consumers driving growth
Average monthly active consumersm, global
Average monthly order frequency#, global
Source: Management accounts. All figures excluding Germany and Taiwan discontinued operations
x% Year-over-year growth
28% 36% 52% 62% 95% 81%
8Source: Management accounts, management data. GTV growth rates are shown at constant FX. Notes: (1) Quarter on quarter (Q2 2021 vs Q1 2021). (2) Waitrose, Co-op, Morrisons, Sainsbury’s, Aldi, Nisa, Whole Foods, One Stop. (3) Refers to largest selection out of the 3 main online food delivery platforms
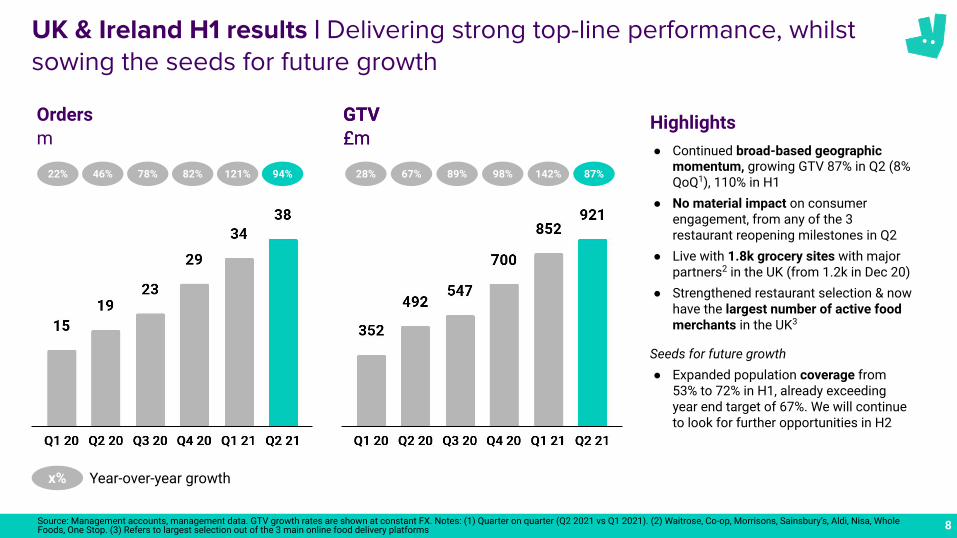
UK & Ireland H1 results | Delivering strong top-line performance, whilst sowing the seeds for future growth
Ordersm
GTV£m
Highlights
x% Year-over-year growth
22% 46% 78% 82% 121% 28% 67% 89% 98% 142%
Ordersm
GTV£m
94% 87%
● Continued broad-based geographic momentum, growing GTV 87% in Q2 (8% QoQ1), 110% in H1
● No material impact on consumer engagement, from any of the 3 restaurant reopening milestones in Q2
● Live with 1.8k grocery sites with major partners2 in the UK (from 1.2k in Dec 20)
● Strengthened restaurant selection & now have the largest number of active food merchants in the UK3
Seeds for future growth● Expanded population coverage from
53% to 72% in H1, already exceeding year end target of 67%. We will continue to look for further opportunities in H2

9
● Continued strong GTV growth: 75% in Q2, 95% in H1 YoY
● Results reflect a mixture of different dynamics across International markets - for example based on timing of restrictions
● Some moderate impact of reopening seen in Europe, more so than UK - but difficult to separate this from normal Q2 seasonality
● Strengthened restaurant selection with c.10k restaurant partners added in Q2 and key strategic deals signed
Seeds for future growth● Continued rollout with key grocery partners,
such as Carrefour in France, Italy, Belgium; Casino in France, and signed Park N Shop in Hong Kong; live with c.900 sites of major brands vs c.400 at end of 20201
Source: Management accounts. All figures excluding Germany and Taiwan discontinued operations. GTV growth rates are shown at constant FX. Notes: (1) Brands include Carrefour, Casino Group, Park N Shop, Giant, Shell, Cold Storage, Conad, M&S, and Don Don Donki.
International H1 results | Strong growth in Q2, whilst strengthening restaurant selection & rolling out with key grocery partners
Highlights
x% Year-over-year growth
Ordersm
GTV£m
32% 43% 54% 72% 108% 28% 52% 60% 81% 121%83% 75%
10
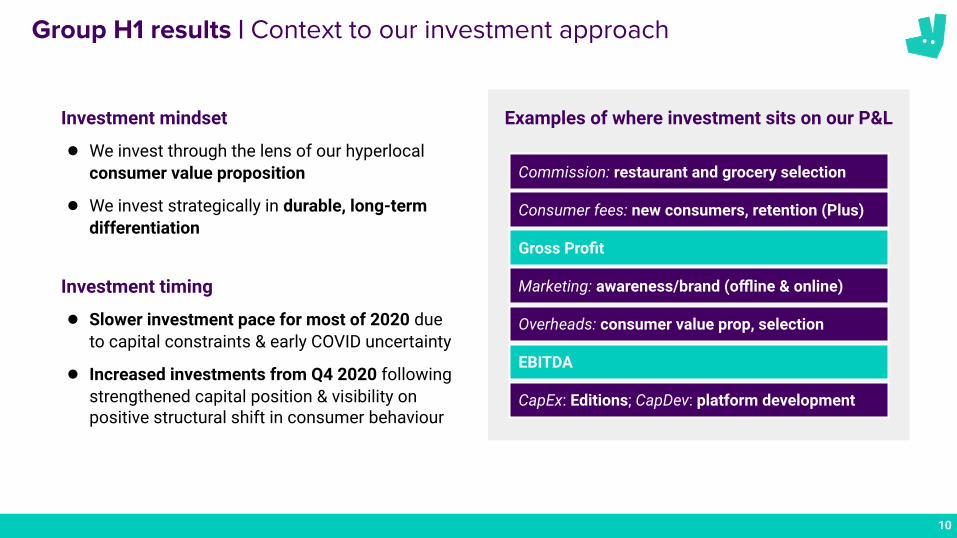
Group H1 results | Context to our investment approach
Investment mindset
● We invest through the lens of our hyperlocal consumer value proposition
● We invest strategically in durable, long-term differentiation
Investment timing
● Slower investment pace for most of 2020 due to capital constraints & early COVID uncertainty
● Increased investments from Q4 2020 following strengthened capital position & visibility on positive structural shift in consumer behaviour
Examples of where investment sits on our P&L
Gross Profit
Commission: restaurant and grocery selection
Consumer fees: new consumers, retention (Plus)
Marketing: awareness/brand (offline & online)
Overheads: consumer value prop, selection
EBITDA
CapEx: Editions; CapDev: platform development

11Source: Interim financial statements
Group H1 results | Attractive gross profit growth with accelerated investments for future growth
UK&I gross profit£m
Highlights
x% % of GTV
● Step up in investments from Q4 2020 above gross profit, in particular in selection and new consumer acquisition and retention
International gross profit£m
Group gross profit£m
11.1% 9.9% 9.4% 6.6% 7.3% 6.1% 8.8% 8.7% 7.8%

12
Group H1 results | Increased investments to build long-term assets
Source: Interim financial statements
● Increased investments in marketing and overheads as we are capitalising on the strong momentum in the business
● Investing to build long-term valuable assets, including in our Engineering team, acquiring new consumers and building our brand equity
Marketing and overheads£m
10.6% 7.9% 8.6%
x%
Adjusted EBITDA£m
(1.8%) 0.8% (0.8%)
% of GTV

13
● We have a well-capitalised balance sheet with £1.6bn of cash and cash equivalents, plus the ability to draw on an RCF if needed
● Change in net working capital was positively impacted by an increase in payables of £132 million related to the timing of employee tax and social security payments on share options exercised on IPO, which unwinds in H2 2021
Group H1 results | Healthy balance sheet and liquidity
Source: Interim financial statement. Notes: (1) Equity issuance proceeds excluding overallotment and net of fees and IPO expenses. (2) Includes exceptional items
Cash and cash equivalents£m
£132m positive impact related to
share options exercised on IPO,
which unwinds in H2
21

Contents
1. Business highlights
2. H1 financial results
3. Post-lockdown trading
4. On demand grocery update
5. Rider proposition
6. Guidance
14

15
UK performance through reopening | Order volume has remained robust through reopening, with slight declines seen in AOV
AOV, by week, £
Order volume, by week, m Commentary
● Our business has remained resilient in the UK despite the easing of lockdown restrictions during Q2
● Average weekly order volume has remained robust throughout the period
● AOV has declined slightly due to mix shift to smaller party sizes, but remains solidly above 2019 levels
12 Apr: Non-essential retail and outdoor
dining open
AugJulJunMayAprMar
AugJulJunMayAprMar
1 2 3
1
17 May: Indoor dining open 2
19 July: Social distancing restrictions
lifted3
1 2 3
15Source: Company data

16
UK performance through reopening | Consistent increases in order frequency for our consumers
Monthly average order frequency, by acquisition cohort#, UK
Commentary
● Our cohorts have consistently increased their average order frequency over time
● This has continued in June 2021 in the UK despite lockdown restrictions easing and tough prior year comparables with full lockdowns
● Cohorts in International markets are experiencing similar patterns of order frequency
Jan-16 cohort
Jun-19 Jun-20 Jun-21
Jan-18 cohort
Jun-19 Jun-20 Jun-21
Jan-20 cohort
Jun-20 Jun-21
Y4 Y5 Y6 Y2 Y3 Y4 Y1 Y2
One-time disclosure for illustrative purposes
Source: Company data

17
France and Italy performance through reopening | Orders moderately down from peak, partly due to reopenings but also normal Q2 seasonality
Commentary
● In Q1 and early Q2, lockdowns in Italy & France drove very strong order volume performance - we have since seen a series of reopening events in each country
● France experienced moderate decline in orders through reopening (more impact than seen in UK) - this appears to be an industry-wide effect
● Impact of reopening coincides with normal seasonal slowdown at end of Q2, so difficult to separate the two effects at this stage
● In Italy, reopenings have also caused a degree of slowdown in order growth - but to a lesser extent than in France
● In both cases, order volumes in the month following reopenings are still very significantly ahead of the same periods in 2020 - and underlying consumer engagement remains strong
France order volume, by week, m
AugJulJunMayAprMar
2 3 4 5
4 Apr: National lockdown 2
19 May: outdoordining open, curfew
extended to 9pm 3
9 June: Indoor dining open, curfew extended
to 11pm4
20 June: Curfew and most restrictions lifted5
AugJulJunMayAprMar
2 31
7 Apr: National lockdown1
1 June: Indoor dining open2
21 June: Curfew and most restrictions lifted3
Italy order volume, by week, m
1
18 March: Curfew extended from 6pm to
7pm1
17Source: Company data

18Source: Company data
UAE and Hong Kong performance through reopening | Consistent growth through different stages of reopening
● UAE and Hong Kong have been under much lighter Covid restrictions in H1, compared to our European markets
● UAE has effectively been without any major restrictions since the start of 2021 - effectively operating as a “post-covid” market for 6 months, and showing very strong acceleration in growth
● Hong Kong performance has been positive as we have seen growth through the different stages of reopening
UAE order volume, by week, m
Hong Kong order volume, by week, m
3 4 6
12 Apr: Start of Ramadan3
17 Apr: Dining restrictions relaxed in Dubai 4
18 Feb: Some easing to dining restrictions4
5 12 Feb: Chinese New Year33
2
1 Feb: 50% capacity cap introduced in Dubai2
4
29 Apr: Vaccine bubble introduced5
17 July: 50% capacity cap introduced in Abu Dhabi5
5
Mar Apr May Jun Jul AugFebJanDecNovOct
2020 2021
Mar Apr May Jun Jul AugFebJanDecNovOct
2020 2021
19 July: Start of Eid6
21
8 Dec: Restaurants close at 6pm, max parties of 22
30 Oct: Restaurants close at 2am, max parties of 61
6
30 June: Further easing of restrictions under
vaccine bubble6
1
9 Oct: Dubai maximum dining party limited to 81
18
Commentary

Contents
1. Business highlights
2. H1 financial results
3. Post-lockdown trading
4. On demand grocery update
5. Rider proposition
6. Guidance
19

20
Key partners in selected markets
Source: Management accounts.
On demand grocery | Contribution to overall business increasing as global selection expands
Hong Kong
France
UAEFood market
Italy
UK&I
On demand grocery GTV% of total
H1 20: initial spike as lockdown
initiated
H1 21: sustained growth through
expansion

21
Grocery population coverageUK, major partners1
Source: Management accounts. Notes: (1) Waitrose, Co-op, Morrisons, Sainsbury’s, Aldi, Nisa, Whole Foods, One Stop
On demand grocery | Rapid expansion with major partners, now covering >70% of UK population
Sites live with major grocery partners1
UK
+4.4x+2x

22
On demand grocery | Attractive long-term economics as model scales
Solid building blocks for long-term economics
Source: Management accounts. Notes: (1) Only logistics orders in Q2 2021, excludes non-transactional revenue and costs
Higher basket sizes from improving
selection and inventory
management
Powerful synergies with core platform
100% incremental demand to restaurants &
drives flywheel
Effective consumer acquisition channel
Grocery economics relative to restaurantGross profit per order, UK & Ireland1
Same consumer and rider base as
restaurants
Potential for non-commission
revenue (e.g. FMCG advertising)
One-time disclosure for illustrative purposes

Contents
1. Business highlights
2. H1 financial results
3. Post-lockdown trading
4. On demand grocery update
5. Rider proposition
6. Guidance
23

Our Rider Proposition - true two-way flexibility Our riders:
✔ Choose when and where to work
✔ Are free to work with multiple apps at the same time
✔ Have unlimited freedom to reject any order
✔ Get paid per delivery completed
✔ Have full visibility of fees for each delivery upfront
✔ Can track customer demand in each area
85% of riders globally are satisfied or very satisfied working with Deliveroo
>14,000 rider applications received per week in UKI in H1
The #1 reason for working with Deliveroo is flexibility - the ability to choose when and where to work
Rider proposition | Deliveroo’s flexible rider model delivers high levels of satisfaction and retention
24

● Across the UK economy in April to June 2021 job vacancies were estimated to grow c.40% quarter-on-quarter, in particular in retail (40+%) and hospitality (250+%)
● Despite the increase in employment vacancies, there is high demand for flexible work and number of monthly active riders has increased by 12%
● Rider retention has also been strong. 90% of riders working with the company in May or June were working in July
Rider proposition | Rider retention has remained strong, as employment vacancies have opened up in the UK
Total UK job vacancies1 vs. Deliveroo’s monthly active riders2 in the UK000s
Highlights
Source: ONS, Management data. Notes: (1) 3-months rolling average of UK employment vacancies; x-axis shows average at the end of the period. (2) Number of UK riders who logged into the rider app in a given month.
Total vacancies for all UK sectors+42%
Deliveroo’s monthly active UK riders+12%
25

Key regulatory developments concerning rider status | H1 2021 update
UK
● Jun: UK Court of Appeal confirmed for 4th time that Deliveroo riders are self-employed
France
● Apr: Paris Court of Appeal confirmed that Deliveroo offers self-employment to riders
● Jul: French Government consulting on how to give self-employed platform workers greater security; not considering reclassification to employment
Spain
● Aug: Royal Decree aiming to reclassify riders as employees comes into force
● No read across to other markets
Italy
● Challenges to historic model in Italy (under appeal)
26

Contents
1. Business highlights
2. H1 financial results
3. Post-lockdown trading
4. On demand grocery update
5. Rider proposition
6. Guidance
27

28Source: Management accounts, Historical Financial Information. All figures excluding Germany and Taiwan discontinued operations. Notes: (1) Given in March 2021 (2) Given at trading update on 8 July 2021
Guidance
2019A
Original2021
Guidance1 2020A
GTV growth
Gross profit % GTV
59% 64% 30-40%
7.6% 8.8% 7.5-8.0%
Revised 2021
Guidance2
50-60%
7.5-7.75%

29
Summary | Key takeaways
Strong growth fueled by new consumers, and encouraging consumer engagement post-reopening1
Continued traction in on demand grocery and step change in selection of restaurants2
Strong rider retention and satisfaction, despite surge in vacancies elsewhere in the economy3
Investing for the long-term, with a well-capitalised balance sheet4

3030

31
Appendix
32Source: Historical Financial Information, Management accounts. All figures excluding Germany and Taiwan discontinued operations
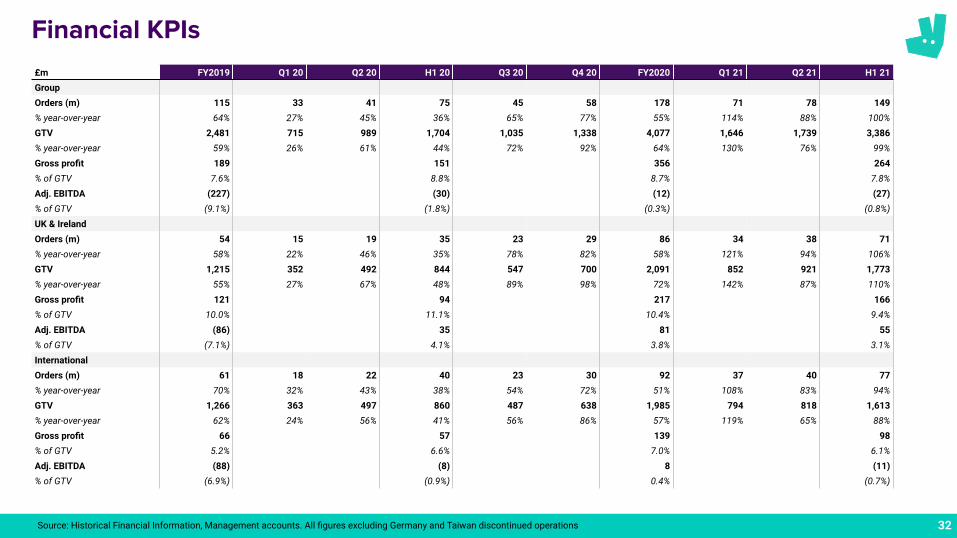
Financial KPIs£m FY2019 Q1 20 Q2 20 H1 20 Q3 20 Q4 20 FY2020 Q1 21 Q2 21 H1 21GroupOrders (m) 115 33 41 75 45 58 178 71 78 149% year-over-year 64% 27% 45% 36% 65% 77% 55% 114% 88% 100%GTV 2,481 715 989 1,704 1,035 1,338 4,077 1,646 1,739 3,386% year-over-year 59% 26% 61% 44% 72% 92% 64% 130% 76% 99%Gross profit 189 151 356 264% of GTV 7.6% 8.8% 8.7% 7.8%Adj. EBITDA (227) (30) (12) (27)% of GTV (9.1%) (1.8%) (0.3%) (0.8%)UK & IrelandOrders (m) 54 15 19 35 23 29 86 34 38 71% year-over-year 58% 22% 46% 35% 78% 82% 58% 121% 94% 106%GTV 1,215 352 492 844 547 700 2,091 852 921 1,773% year-over-year 55% 27% 67% 48% 89% 98% 72% 142% 87% 110%Gross profit 121 94 217 166% of GTV 10.0% 11.1% 10.4% 9.4%Adj. EBITDA (86) 35 81 55% of GTV (7.1%) 4.1% 3.8% 3.1%InternationalOrders (m) 61 18 22 40 23 30 92 37 40 77% year-over-year 70% 32% 43% 38% 54% 72% 51% 108% 83% 94%GTV 1,266 363 497 860 487 638 1,985 794 818 1,613% year-over-year 62% 24% 56% 41% 56% 86% 57% 119% 65% 88%Gross profit 66 57 139 98% of GTV 5.2% 6.6% 7.0% 6.1%Adj. EBITDA (88) (8) 8 (11)% of GTV (6.9%) (0.9%) 0.4% (0.7%)