
ONLINE FIRST - lcp.mit.edu · ONLINE FIRST This is an Online ... We identified 1,776 mechanically...
37
ONLINE FIRST This is an Online First, unedited version of this article. The final, edited version will appear in a numbered issue of CHEST and may contain substantive changes. We encourage readers to check back for the final article. Online First papers are indexed in PubMed and by search engines, but the information, including the final title and author list, may be updated on final publication. http://journal.publications.chestnet.org/ Online First articles are not copyedited prior to posting. ©American College of Chest Physicians. Reproduction of this article is prohibited without written permission from the American College of Chest Physicians. See online for more details. Page 1 of 37 Downloaded From: http://journal.publications.chestnet.org/ by a Francis A Countway User on 11/02/2015
Transcript of ONLINE FIRST - lcp.mit.edu · ONLINE FIRST This is an Online ... We identified 1,776 mechanically...

ONLINE FIRST
This is an Online First, unedited version of this article. The final, edited
version will appear in a numbered issue of CHEST and may contain substantive changes. We encourage readers to check back for the final
article. Online First papers are indexed in PubMed and by search engines, but the information, including the final title and author list,
may be updated on final publication.
http://journal.publications.chestnet.org/
Online First articles are not copyedited prior to posting.
©American College of Chest Physicians. Reproduction of this article is prohibited without written permission from the
American College of Chest Physicians. See online for more details.
Page 1 of 37
Downloaded From: http://journal.publications.chestnet.org/ by a Francis A Countway User on 11/02/2015

Word Count: 2259
Abstract: 248
The Association Between Indwelling Arterial Catheters and Mortality in
Hemodynamically Stable Patients With Respiratory Failure: A Propensity Score
Analysis
Douglas J. Hsu, MD* (1), Mengling Feng, PhD* (2, 4), Rishi Kothari, MD (3), Hufeng
Zhou, PhD (5), Kenneth P. Chen MD (1), Leo A. Celi, MD MS MPH (1, 2)
1. Department of Medicine, Beth Israel Deaconess Medical Center, Boston, MA
2. Laboratory of Computational Physiology, Massachusetts Institute of Technology,
Cambridge, MA
3. Department of Anesthesia, Mount Sinai Hospital, New York, NY
4. Institute for Infocomm Research, Singapore
5. Department of Medicine, Brigham and Women's Hospital, and Department of
Microbiology and Immunobiology, Harvard University, Cambridge, MA.
* These authors contributed equally in this work.
Corresponding Author
Douglas Hsu
330 Brookline Avenue, KSB-23
Boston, MA 02215
Disclosure: The authors report that no potential conflicts of interest exist with any
companies/organizations whose products or services may be discussed in this article.
Sources of Support: National Institute of Biomedical Imaging and Bioengineering grant
(R01 EB001659). Dr. Feng is supported by an A*STAR Graduate Scholarship.
Running title: Arterial Catheters in Respiratory Failure
Page 2 of 37
Downloaded From: http://journal.publications.chestnet.org/ by a Francis A Countway User on 11/02/2015
ABSTRACT
Background: Indwelling arterial catheters (IAC) are used extensively in the Intensive
Care Unit (ICU) for hemodynamic monitoring and for blood gas analysis. IAC use also
poses potentially serious risks, including blood stream infections and vascular
complications. The purpose of this study was to assess whether IAC use was associated
with mortality in mechanically ventilated patients who do not require vasopressor
support.
Methods: This study utilized the Multiparameter Intelligent Monitoring in Intensive Care
II database, consisting of over 24,000 patients admitted to the Beth Israel Deaconess
Medical Center ICU between 2001 – 2008. Patients requiring mechanical ventilation who
did not require vasopressors or have a diagnosis of sepsis were identified, and the
primary outcome was 28-day mortality. A model based on patient demographics, co-
morbidities, vital signs, and laboratory results was developed to estimate the propensity
for IAC placement. Patients were then propensity-matched, and McNemar’s test was
used to evaluate the association of IAC with 28-day mortality.
Results: We identified 1,776 mechanically ventilated patients that met inclusion criteria.
There were no differences in the covariates included in the final propensity model
between the IAC and non-IAC propensity-matched groups. For the matched cohort, there
was no difference in 28-day mortality between the IAC group and the non-IAC group
(14.7% vs 15.2%, OR 0.96, 95% CI [0.62, 1.47]).
Conclusions: In hemodynamically stable mechanically ventilated patients, the presence
of an IAC is not associated with a difference in 28-day mortality. Validation in other
datasets, as well as further analyses in other subgroups is warranted.
Page 4 of 37
Downloaded From: http://journal.publications.chestnet.org/ by a Francis A Countway User on 11/02/2015

ABBREVIATIONS LIST
IAC = Indwelling arterial catheter
ICD-9-CM = International Classification of Diseases, 9th revision, Clinical Modification
ICU = Intensive care unit
IQR = Interquartile Range
LOS = Length-of-stay
MIMIC-II = Multiparameter Intelligent Monitoring in Intensive Care – II
ROC = Receiver operating characteristic
SOFA = Sequential Organ Failure Assessment score
PAC = Pulmonary arterial catheter
Page 3 of 37
Downloaded From: http://journal.publications.chestnet.org/ by a Francis A Countway User on 11/02/2015

INTRODUCTION
Indwelling arterial catheters (IAC) are used in the Intensive Care Unit (ICU)
setting for continuous hemodynamic monitoring and for arterial blood sampling for blood
gas analysis. IAC use in the ICU setting is widespread, occurring in approximately 30%
of all ICU patients, with relatively stable IAC use over time.1-3
Despite widespread IAC use, there are rare but potentially serious complications
that may arise. IAC-associated blood stream infections have been reported at a rate that,
while not to the level of central venous catheters, is significantly higher than peripheral
venous access. A systematic review of the risk of blood stream infections associated with
intravascular catheters reports a pooled point estimate of 1.6 per 1,000 device days (95%
CI 1.2, 2.3) for IAC compared with 0.5 (95% CI 0.2, 0.7) for peripheral venous access,
and 2.7 (95% CI 2.6, 2.9) for central venous catheters.4 Additionally, vascular
complications associated with IAC use are more common than previously thought,
including thrombosis, ischemia, hematoma, bleeding, and pseudoaneurysm.5 The
presence of IAC may promote an increased frequency of blood draws and laboratory
testing, including arterial blood gas sampling.6,7
In the context of increased IAC-associated utilization and complications, there are
scant outcomes data to support their widespread use. The purpose of this study was to
examine the association between IAC use and outcomes in a large cohort of
hemodynamically stable intensive care patients with respiratory failure undergoing
mechanical ventilation.
Page 5 of 37
Downloaded From: http://journal.publications.chestnet.org/ by a Francis A Countway User on 11/02/2015

MATERIALS AND METHODS
Study Population
We conducted a longitudinal, single center, retrospective cohort study of patients
from the Multi Parameter Intelligent Monitoring of Intensive Care (MIMIC-II) database,
which includes patients admitted between 2001- 2008. The database contains data from
24,581 ICU patients and includes physiologic information from bedside monitors and
hospital information systems in the adult ICUs at Beth Israel Deaconess Medical Center,
a tertiary care university academic medical center located in Boston, Massachusetts.8 The
data in MIMIC-II has been previously de-identified, and the Institutional Review Boards
of the Massachusetts Institute of Technology (No. 0403000206) and Beth Israel
Deaconess Medical Center (2001-P-001699/14) both approved the use of the database for
research.
The MIMIC-II database was queried to identify adult patients requiring
mechanical ventilation within the first 24 hours of medical or surgical ICU admission and
lasting for at least 24 hours. The presence of an IAC was defined as placement of an
invasive arterial catheter at any point in time after initiation of mechanical ventilation.
Patients were excluded if they had a diagnosis of sepsis based on the Angus criteria9 or
required vasopressors while in the ICU, as well if IAC placement was performed prior to
endotracheal intubation and initiation of mechanical ventilation (including pre-ICU
admission IAC placement). As the majority of patients in the cardiac surgery recovery
unit had an IAC placed prior to ICU arrival, all patients from the cardiac surgery ICU
were also excluded from this analysis. Additionally, to ensure the independence of data,
only the first ICU admission was included in patients that had multiple ICU admissions.
Page 6 of 37
Downloaded From: http://journal.publications.chestnet.org/ by a Francis A Countway User on 11/02/2015

Co-incident diseases were obtained based on International Classification of
Diseases, 9th revision, Clinical Modification (ICD-9-CM). The Sequential Organ Failure
Assessment score (SOFA) was obtained at the time of ICU admission, and laboratory
values immediately preceding onset of mechanical ventilation were used.
Outcome Measures:
The primary outcome was 28-day mortality. Secondary outcomes included ICU
and hospital length-of-stay (LOS), duration of mechanical ventilation, and mean number
of arterial and venous blood gas measurements performed per day while admitted to the
ICU.
Statistical Analysis
A propensity score model was created to match baseline patient characteristics. 29
pre-IAC placement features including patient demographics, co-morbidities, vital signs,
and pre-intervention laboratory results were selected from 53 available candidate
variables (those without significant missing data) to estimate propensity for IAC insertion
using a genetic algorithm (See Appendix).10 Patients with or without IAC placement were
then matched based on the estimated propensity scores using one-to-one matching
without replacement with a caliper of 0.01. To ensure the robustness of the propensity
score model and to avoid over-fitting, the goodness-of-fit of the prediction model was
evaluated based on the average area under receiver operating characteristic (ROC) curve
using 10-fold cross-validation, and the predictive model was also evaluated with the
Hosmer–Lemeshow test.
Page 7 of 37
Downloaded From: http://journal.publications.chestnet.org/ by a Francis A Countway User on 11/02/2015
The success of the propensity score model was evaluated by assessment of the
differences in baseline covariates between IAC and non-IAC groups. As continuous
variables were not normally distributed, median values and Interquartile Range (IQR)
were used to summarize distributions. The Fisher’s exact test and Wilcoxon rank-sum
test were applied to statistically assess the differences in categorical and continuous
variables between the unmatched IAC and non-IAC groups. Measures of association for
baseline covariates in the propensity-matched cohorts were performed using either
McNemar’s test for categorical variables or Wilcoxon Signed Rank Test for continuous
variables. The distributions of the propensity score before and after matching were also
compared to further assess the degree of balance.
In univariate analyses, a McNemar’s test was performed for binary outcomes, and
paired t-tests for continuous outcomes. As mortality is a competing risk for ICU LOS,
total LOS, and duration of mechanical ventilation, we used the cumulative incidence
function to estimate the probability of the secondary outcome over 28 days while
allowing for the possibility of alternative outcomes (e.g. death) to occur.11
Sensitivity Analyses
Sensitivity analyses were performed to evaluate the effects of varying both the
inclusion criteria of time to mechanical ventilation (to include all patients undergoing
endotracheal intubation at any point during their ICU course) and the caliper level for
propensity matching on the association between IAC placement and 28-day mortality. 10
different caliper levels between 0.01 – 0.1 at 0.01 increments were used to match the
positive and negative controls. We also performed a sensitivity analysis utilizing
Page 8 of 37
Downloaded From: http://journal.publications.chestnet.org/ by a Francis A Countway User on 11/02/2015

propensity score weights to create an alternative propensity score model for IAC
placement. This method optimizes post-weighting balance of covariates between groups,
and a weighted regression model including any imbalanced covariates between the
matched groups was estimated for 28-day mortality (see appendix).
RESULTS
Propensity Score Matching
Of the 24,581 MIMIC-II admissions reviewed, 24,443 patients remained after
eliminating multiple admissions. A total of 1,776 patients met inclusion criteria (Figure
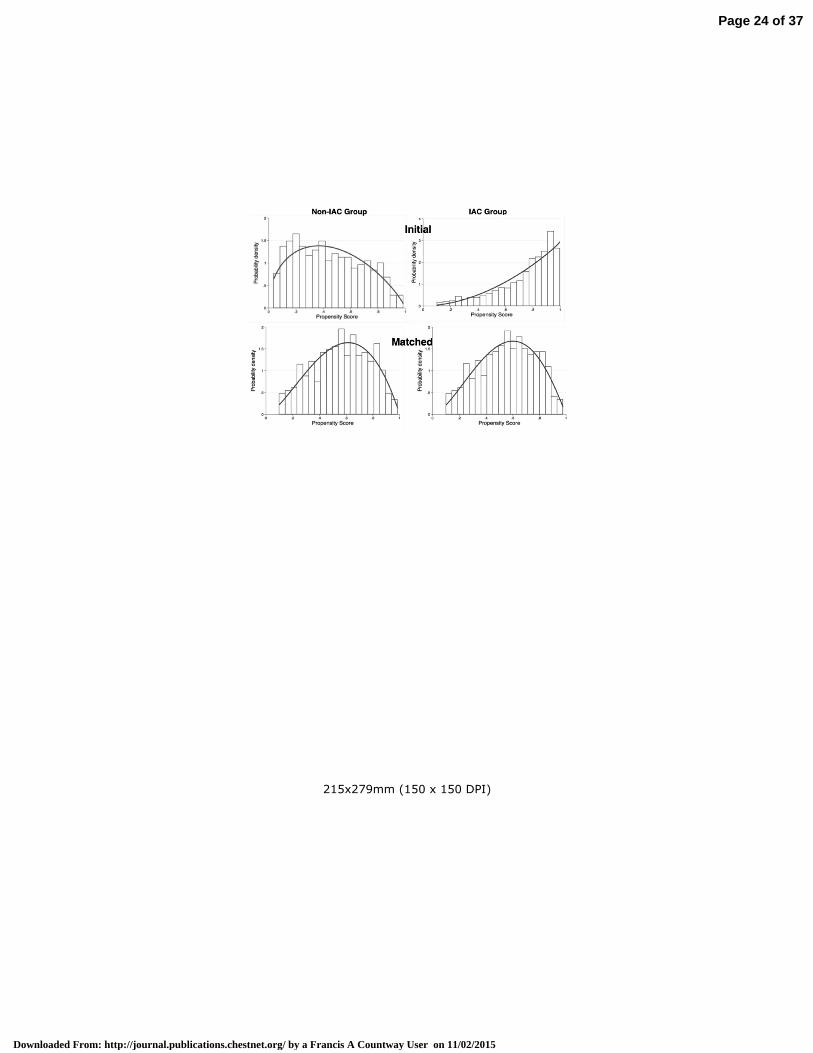
1), of which 44.6% had an IAC. Figure 2 shows the distribution of the propensity score of
the IAC and the non-IAC groups before and after matching. The propensity score model
for IAC placement yielded 0.79 for the area under ROC curve (over 10-fold cross-
validation) and a p-value of 0.83 for the Hosmer–Lemeshow test. After 1:1 matching, the
propensity-matched sample consisted of 696 patients (348 patients with respiratory
failure who underwent IAC placement matched to 348 patients with respiratory failure
who do no have an IAC placed). In the matched cohort, the median age for the IAC and
non-IAC groups were 54 (IQR 38-73) and 53 (IQR 35-72), respectively. There were no
differences between the IAC and non-IAC propensity-matched groups for covariates
included in the final propensity score model, including chronic co-morbidities and acute
respiratory diagnoses such as acute respiratory distress syndrome and pneumonia (Table
1, eFigure 1).
Primary & Secondary Outcomes
Page 9 of 37
Downloaded From: http://journal.publications.chestnet.org/ by a Francis A Countway User on 11/02/2015

After propensity score matching, there was no difference in 28-day mortality in
the IAC (14.7%) versus non-IAC (15.2%) groups (OR 0.96, 95% CI [0.62, 1.47]; Table
2). Patients with an IAC had a significantly lower likelihood for discharge from the ICU
(sub-hazard ratio 0.72, p<0.0001, 95% CI [0.61, 0.86]) or from the hospital (sub-HR
0.71, p<0.0001, 95% CI [0.6, 0.84]) at 28 days. Likewise, IAC patients had a lower
likelihood of successful ventilator removal (sub-HR 0.74, p<0.0001, 95% CI [0.63, 0.87])
at 28 days. When survivors were separately analyzed, ICU LOS, hospital LOS, and
duration of mechanical ventilation were significantly shorter among non-IAC patients
(Table 2). Patients with an IAC had a mean difference of 1.44 more blood gas
measurements performed per day (p<0.0001).
Sensitivity Analyses
The study cohort only included patients who were intubated within 24 hours of
admission to the ICU. We performed a sensitivity analysis that included all patients who
were intubated regardless of timing. No significant difference in 28-day mortally between
the IAC and non-IAC group (p=0.4) was observed in this expanded cohort. Figure 3
summarizes the results of the sensitivity analyses using various matching caliper levels.
As shown in Part A, the odds ratios for IAC placement and 28-day mortality are around
1.0 for all caliper levels. As shown in part B, measures of association for all caliper
levels did not reach statistical significance (p>0.05). Utilizing the propensity score weight
methodology, there remained no difference in 28-day mortality between the IAC and
non-IAC groups (see appendix).
DISCUSSION
Page 10 of 37
Downloaded From: http://journal.publications.chestnet.org/ by a Francis A Countway User on 11/02/2015

In this propensity-matched cohort analysis of hemodynamically stable
mechanically ventilated patients, we report no association between the placement of an
invasive arterial catheter and 28-day mortality. Placement of IAC was, however,
associated with a longer duration of mechanical ventilation, ICU and hospital LOS, and
an increased frequency of blood gas sampling after matching patients for propensity to
receive an IAC.
There are several potential explanations for the lack of association between IAC
use and mortality in our analysis. First, the blood gas data and hemodynamic
measurements obtained from IAC do not provide valuable clinical data that lead to
changes in management that translate into a measurable impact on mortality.
Alternatively, the results of this analysis may be attributed to unmeasured confounding,
which we attempted to account for by using a propensity-matched cohort. Our findings
from the MIMIC-II database are consistent with a recent study using the Project
IMPACT database, which reported no association between IAC and mortality in ICU
patients.12 Our findings support the need for replication in additional large critical care
databases, as well as future randomized controlled trials to investigate causation between
IAC and patient outcomes.
The care of critically ill patients is an excellent case study in the adoption of
technological advancement within healthcare. An example of this is the use of pulmonary
arterial catheters (PAC) in critically ill patients, which was a widely accepted and used
monitoring device before 13 subsequent randomized clinical trials and repeated meta-
analyses demonstrated no improvement in patient outcomes13,14
led to subsequent
declines in PAC utilization over time.15,16
Despite lessons learned, IAC use remains
Page 11 of 37
Downloaded From: http://journal.publications.chestnet.org/ by a Francis A Countway User on 11/02/2015

common, and in recent years the development and utilization of other invasive and non-
invasive modalities of hemodynamic monitoring has increased to include arterial
waveform analysis, bedside echocardiography, esophageal Doppler, non-invasive
bioimpedance/bioreactance, all with limited to no demonstrated benefit in patient
outcomes. RCTs to investigate causal relationships between these monitoring devices and
outcomes within specific patient subsets and clinical contexts are warranted, although
there are often cost and logistical challenges to performing RCTs in the ICU. Research
using highly granular databases such as MIMIC-II should be explored to identify sub-
populations of critically ill patients that may benefit from specific technology application,
thus allowing for more focused RCTs and more parsimonious application of technology.
Additionally, the MIMIC-II database contains comprehensive electronic health
record data throughout the hospital course. Our analysis leverages the availability of
time-stamped vital signs, laboratory results, and interventions to build a propensity score
model by including predictors and confounders available at the time the clinical decision
was made. Such granularity is important in creating propensity score models at the time
when the decisions are made, especially in a highly dynamic setting such as the ICU. The
granularity of these data are also particularly useful for decision analysis, evaluation of
information gain, personalized dosage calculation,17 or comparative effectiveness
studies,18 which have been traditionally performed using low-resolution data.
There are several limitations, however, that should be noted. First, as this is a
single-center study from an academic tertiary care center, our findings may not be
generalizable to other institutions. Residual confounding may also mar our findings,
although we attempted to account for this through propensity matching. Potential
Page 12 of 37
Downloaded From: http://journal.publications.chestnet.org/ by a Francis A Countway User on 11/02/2015

unmeasured confounders not accounted for in this analysis include relevant past medical
history such as prior episodes of respiratory failure or prolonged mechanical ventilation,
as well as treating physician(s). This raises the possibility that there may be negative
confounding that contributed to our findings of no association between IAC placement
and mortality. Additionally, the potential for immortal time bias and indication bias is
present, as in all observational studies. We attempted to minimize interaction or effect
modification by limiting our primary analysis to patients admitted to the ICU with acute
respiratory failure without hemodynamic compromise requiring vasopressor support or
concomitant sepsis, which are alternative reasons IAC placement may be considered. By
limiting our study sample to a single indication for IAC placement, we are also
attempting to optimize our propensity score model for assessment of IAC placement and
28-day mortality. There will be different relationships between covariates, IAC
placement, and 28-day mortality based on indication for IAC placement, which will have
effects on bias, variance, and mean squared error of the estimated exposure effect.19 Of
note, we plan on performing subsequent analyses in MIMIC-II and larger EHR-derived
datasets for other ICU sub-groups with different indications for IAC placement. We are
unable to report potential adverse events associated with IAC placement and use,
including catheter-associated bloods stream infections or vascular complications, as these
were not consistently captured in MIMIC-II. Finally, while our findings do not support an
association between IAC use and mortality, only randomized controlled trials can
establish a causal relationship.
CONCLUSIONS
Page 13 of 37
Downloaded From: http://journal.publications.chestnet.org/ by a Francis A Countway User on 11/02/2015

In this single center, retrospective study of hemodynamically stable patients requiring
mechanical ventilation, the placement of invasive arterial catheters was not associated
with a change in mortality as compared to propensity-matched patients without invasive
arterial catheters. Invasive arterial catheters were associated with an increased ICU
length-of-stay, total length-of-stay, duration of mechanical ventilation, and increased
blood gas measurements.
Page 14 of 37
Downloaded From: http://journal.publications.chestnet.org/ by a Francis A Countway User on 11/02/2015

ACKNOWLEDGEMENTS
Author Contributions:
LAC was the principal investigator and is the guarantor of this study; he takes full
responsibility for the integrity of the submission as a whole, from inception to published
article, including the data and analysis.
Conception and Design: DJH, LAC, MF
Analysis, data collection, and interpretation: DJH, MF, RK, HZ, KPC, LAC
Drafting Manuscript: DJH, MF, RK, HZ, KPC, LAC
Financial/non-financial disclosures: The authors report that no potential conflicts of
interest exist with any companies/organizations whose products or services may be
discussed in this article.
Role of sponsors: The sponsors had no role in the design of the study, the collection, and
analysis of the data, or the preparation of the manuscript.
Page 15 of 37
Downloaded From: http://journal.publications.chestnet.org/ by a Francis A Countway User on 11/02/2015
References
1. Angus DC, Shorr AF, White A, et al. Critical care delivery in the United States:
distribution of services and compliance with Leapfrog recommendations. Critical
Care Medicine 2006;34(4):1016–1024.
2. Gershengorn HB, Garland A, Kramer A, Scales DC, Rubenfeld G, Wunsch H.
Variation of arterial and central venous catheter use in United States intensive care
units. Anesthesiology 2014;120(3):650–664.
3. Traoré O, Liotier J, Souweine B. Prospective study of arterial and central venous
catheter colonization and of arterial- and central venous catheter-related
bacteremia in intensive care units. Critical Care Medicine 2005;33(6):1276–1280.
4. Maki DG, Kluger DM, Crnich CJ. The risk of bloodstream infection in adults with
different intravascular devices: a systematic review of 200 published prospective
studies. Mayo Clin Proc 2006;81(9):1159–1171.
5. Scheer B, Perel A, Pfeiffer UJ. Clinical review: complications and risk factors of
peripheral arterial catheters used for haemodynamic monitoring in anaesthesia and
intensive care medicine. Crit Care 2002;6(3):199–204.
6. Low LL, Harrington GR, Stoltzfus DP. The effect of arterial lines on blood-
drawing practices and costs in intensive care units. Chest 1995;108(1):216–219.
7. Zimmerman JE, Seneff MG, Sun X, Wagner DP, Knaus WA. Evaluating
laboratory usage in the intensive care unit: patient and institutional characteristics
that influence frequency of blood sampling. Critical Care Medicine
1997;25(5):737–748.
8. Scott DJ, Lee J, Silva I, et al. Accessing the public MIMIC-II intensive care
relational database for clinical research. BMC Medical Informatics and Decision
Making 2013;13:9.
9. Angus DC, Linde-Zwirble WT, Lidicker J, Clermont G, Carcillo J, Pinsky MR.
Epidemiology of severe sepsis in the United States: analysis of incidence,
outcome, and associated costs of care. Critical Care Medicine 2001;29(7):1303–
1310.
10. Diamond A, Sekhon JS. Genetic Matching for Estimating Causal Effects: A
General Multivariate Matching Method for Achieving Balance in Observational
Studies. The Review of Economics and Statistics 2013;95(3):932–945.
11. Kalbfleisch JD, Prentice RL. The Statistical Analysis of Failure Time Data.
Hoboken, New Jersey: John Wiley & Sons, Ltd; 2002.
12. Gershengorn HB, Wunsch H, Scales DC, Zarychanski R, Rubenfeld G, Garland A.
Association Between Arterial Catheter Use and Hospital Mortality in Intensive
Page 16 of 37
Downloaded From: http://journal.publications.chestnet.org/ by a Francis A Countway User on 11/02/2015

Care Units. JAMA Intern Med 2014;174(11):1746.
13. Shah MR, Hasselblad V, Stevenson LW, et al. Impact of the pulmonary artery
catheter in critically ill patients: meta-analysis of randomized clinical trials. JAMA
2005;294(13):1664–1670.
14. Rajaram SS, Desai NK, Kalra A, et al. Pulmonary artery catheters for adult
patients in intensive care. Cochrane Database Syst Rev 2013;2:CD003408.
15. Wiener RS, Welch HG. Trends in the use of the pulmonary artery catheter in the
United States, 1993-2004. JAMA 2007;298(4):423–429.
16. Gershengorn HB, Wunsch H. Understanding changes in established practice:
pulmonary artery catheter use in critically ill patients. Critical Care Medicine
2013;41(12):2667–2676.
17. Ghassemi MM, Richter SE, Eche IM, Chen TW, Danziger J, Celi LA. A data-
driven approach to optimized medication dosing: a focus on heparin. Intensive
Care Medicine 2014;40(9):1332–1339.
18. Ghassemi M, Celi LA, Stone DJ. State of the Art Review: The Data Revolution in
Critical Care. Springer International Publishing; 2015.
19. Brookhart MA, Schneeweiss S, Rothman KJ, Glynn RJ, Avorn J, Stürmer T.
Variable selection for propensity score models. Am J Epidemiol
2006;163(12):1149–1156.
Page 17 of 37
Downloaded From: http://journal.publications.chestnet.org/ by a Francis A Countway User on 11/02/2015

Table 1. Baseline covariates between IAC and non-IAC groups in unmatched cohorts and propensity-matched cohorts
Entire Cohort (1776) Matched Cohort (696)
Variables Non-IAC (n=984) IAC (n=792) p-value Non-IAC (n=348) IAC (n=348) p-value
Age (year)
51 (35-72) 56 (40-73) 0.009 53 (35-72) 54 (38-73) 0.8
Female 344 (43.5%) 406 (41.3%) 0.36 205 (58.9%) 192 (55.2%) 0.6
SOFA 5 (4-6) 6 (5-8) <0.0001 5 (4-7) 6 (4-7) 0.5
Service Unit <0.0001 0.3
MICU 504 (63.6%) 290 (29.5%) 184 (52.9%) 192 (55.2%)
SICU 288 (26.4%) 694 (70.5) 164 (47.1%) 156 (44.8%)
Co-incident
Diseases
Chronic
obstructive
pulmonary
disease
81 (10.23%) 76 (7.72%) 0.07 32 (9.2%) 39 (11.2%) 0.8
Respiratory
disease (non-
COPD)1
278 (35.1%) 287 (29.2%) 0.008 121 (34.7%) 125 (35.9%) 0.5
Pneumonia 147 (18.6%) 152 (15.5%) 0.005 67 (20%) 68 (20.3%) 0.7
Congestive
heart failure
97 (12.5%) 116 (11.8%) 0.7 44 (12.6%) 36 (10.3%) 0.6
Atrial
fibrillation
82 (10.4%) 125 (12.7%) 0.1 36 (10.3%) 32 (9.2%) 1
Chronic
kidney
28 (3.5%) 32 (3.3%) 0.8 13 (3.8%) 10 (2.9%) 1
Page 18 of 37
Downloaded From: http://journal.publications.chestnet.org/ by a Francis A Countway User on 11/02/2015

disease
Chronic liver
disease
28 (4.8%) 61 (6.2%) 0.2 14 (4%) 18 (5.2%) 0.7
Coronary
artery disease
51 (6.4%) 72 (7.32%) 0.5 23 (6.6%) 21 (6%) 0.2
Stroke 70 (8.8%) 152 (15.5%) 0.0001 32 (9.2%) 33 (9.5%) 0.9
Malignancy 92 (11.6%) 164 (16.7%) 0.003 44 (12.6%) 51 (14.7%) 0.4
Laboratory
Tests
WBC 10.6 (7.8-14.3) 11.8 (8.5-15.9) <0.0001 10.7 (8-14.8) 11.5 (8.4-14.7) 0.8
Hemoglobin 13 (11.3-14.4) 12.6 (11-14.1) 0.003 12.8 (11.2 -14.2) 12.7 (11-14.1) 0.8
Platelet 246 (190-304) 237 (177-294) 0.01 238 (184-303) 238 (186-289) 0.8
Sodium 140 (138-143) 140 (137-142) 0.007 140 (138-143) 140 (137-142) 0.6
Potassium 4 (3.6-4.5) 4 (3.7-4.4) 0.77 4 (3.6-4.5) 4 (3.7-4.4) 0.9
Bicarbonate 24 (22-27) 24 (21-27) 0.05 24 (22-27) 24 (21-27) 0.3
Chloride 104 (100-107) 104 (101-108) 0.0003 104 (100-107) 104 (100-107) 0.3
BUN 15 (11-21) 16 (12-22) 0.02 15 (11-22) 16 (12-22) 0.7
Creatinine 0.9 (0.7-1.1) 0.9 (0.7-1.1) 0.6 0.9 (0.7-1.2) 0.9 (0.7-1.1) 0.6
PO2 206 (96-375) 200 (108-337) 0.5 180 (104-340) 187 (106-300) 0.8
PCO2 42 (37-50) 41 (36-48) 0.02 41.5 (37-47) 40 (35-46.5) 0.6
DNR at
Admission
65 (8.2%) 39 (4%) <0.0001 20 (5.8%) 12 (3.5%) 0.6
Page 19 of 37
Downloaded From: http://journal.publications.chestnet.org/ by a Francis A Countway User on 11/02/2015

Change in
code status
during ICU
admission2
41 (5.2%) 95 (9.7%) <0.0001 35 (10.4%) 34 (10.1%) 0.9
1 ICD-9-CM code 518*, which includes acute respiratory distress syndrome (ARDS).
2 Defined as code status change to Do Not Resuscitate or Comfort Measures Only
Page 20 of 37
Downloaded From: http://journal.publications.chestnet.org/ by a Francis A Countway User on 11/02/2015

Table 2: Primary and secondary outcomes for propensity-matched IAC and non-IAC groups
Primary Outcome Non-IAC IAC p-value
Odds Ratio
(95% CI)
28-day mortality 15.20% 14.70% 0.83 0.96 (0.62, 1.47)
Secondary
Outcomes Non-IAC IAC p-value
Mean Difference
(95% CI)
ICU LOS (survivors) 2.2 (1.4)1
3.7 (3.1) <0.0001 1.65 (1.24, 2.07)
Hospital LOS
(survivors) 5.7 (4.8) 9.4 (7.5) <0.0001 3.47 (2.34, 4.59)
Mechanical
ventilation time
(survivors)
1 (1) 2.1 (2.6) <0.0001 1.1 (0.76, 1.42)
Blood gas
measurements (per
24 hours)
1 (0.8) 2.4 (1.4) <0.0001 1.44 (1.27, 1.62)
1 All continuous variables reported as mean with standard deviation
Page 21 of 37
Downloaded From: http://journal.publications.chestnet.org/ by a Francis A Countway User on 11/02/2015

Figure 1. Flowchart of patient inclusion.
Figure 2. Propensity score distribution plot comparing IAC and non-IAC groups before
and after matching.
Figure 3. Sensitivity analyses of various matching caliper levels.
Page 22 of 37
Downloaded From: http://journal.publications.chestnet.org/ by a Francis A Countway User on 11/02/2015

215x279mm (150 x 150 DPI)
Page 23 of 37
Downloaded From: http://journal.publications.chestnet.org/ by a Francis A Countway User on 11/02/2015
215x279mm (150 x 150 DPI)
Page 24 of 37
Downloaded From: http://journal.publications.chestnet.org/ by a Francis A Countway User on 11/02/2015

279x215mm (150 x 150 DPI)
Page 25 of 37
Downloaded From: http://journal.publications.chestnet.org/ by a Francis A Countway User on 11/02/2015

Appendix: The Association Between Indwelling Arterial Catheters and Mortality in Hemodynamically Stable Patients With Respiratory Failure: A Propensity Score Analysis
A. Construction of Propensity Score Model
In this study, a propensity score model was developed to estimate likelihood of getting an IAC placement. To construct the model, we first identified an initial set of 53 covariates that potentially influence the decision for IAC placement. We then employed a Genetic Algorithm (GA) based method to shortlist a subset of covariates that optimize the performance of the propensity score model.
A.1 Covariates Identification based on Clinical Knowledge
The initial set of 53 covariates is as follows.
Demographic: Admission age, gender, race, daytime admission (7am to 7pm), day of admission and service unit (medical or surgical ICU), and admission Sequential Organ Failure Assessment (SOFA) score.
Co-morbidities (ICD-9): Congestive Heart Failure 398.91 428.0 428.1 428.20 428.21 428.22 428.23 428.30 428.31 428.32 428.33 428.40 428.41 428.42, 428, 428.2, 428.3, 428.4, 428.43, 428.9; Atrial fibrillation 427.3*; Chronic renal disease 585.*; Chronic liver disease 571*; Chronic Obstructive Pulmonary Disease 490-496; Coronary Artery Disease 414.*; Stroke 440-434; Malignancy 140-239; non-COPD lung disease (including acute respiratory distress syndrome) 518*, and Pneumonia 482*.
Vital sign/Hemodynamic variables: Data include weight, mean arterial pressure (MAP), temperature, heart rate, oxygen saturation (SpO2) and central venous pressure (CVP).
Laboratory test results: White blood cell (WBC) count, hemoglobin, platelet count, sodium, potassium, bicarbonate, chloride, blood urea nitrogen (BUN), creatinine, glucose, calcium, magnesium, phosphate, aspartate Aminotransferase (AST), alanine Aminotransferase (ALT), lactic acid dehydrogenase (LDH), total bilirubin, alkaline phosphatase, albumin, troponin T, creatinine kinase, brain natriuretic peptide (BNP), lactate, pH, central venous oxygen saturation (ScVO2), arterial partial pressure of oxygen (PaO2) and arterial partial pressure of carbon dioxide (PCO2).
Sedative medication use, including midazolam, fentanyl, and propofol.
A.2 Genetic Algorithm-based Covariate Selection and Model Optimization
A GA-based algorithm was employed to select the subset of covariates that optimizes the performance of the propensity score model.
The genetic algorithm (GA) is a heuristic algorithm inspired by a natural “survival of the fittest” selection process [1]. The GA is commonly adopted for optimization and variable selection problems, and has a wide application in computational biology, engineering, economics, manufacturing, physicals, and mathematics. This method starts with a population of candidate solutions to an optimization problem, and then gradually evolves towards better solutions through an iterative process. Through the iterative process, the “fitness” of all candidate solutions or variable subsets is evaluated based on optimization criteria, and “fitter” solutions will be selected to remain and contribute to the next generation of solutions. The selected solutions based on the fitness function then randomly “mutate” (change a variable) or “breed” (exchange smaller subsets of variables with one another) to generate a new set of candidate solutions for the next iteration. The evolution/optimization process stops when the maximum numbers of iterations or best possible solution has been achieved.
Page 26 of 37
Downloaded From: http://journal.publications.chestnet.org/ by a Francis A Countway User on 11/02/2015

In our study, the GA R package was used to implement the optimization method [2]. We allowed the GA algorithm to evolve over 3000 iterations with 50 candidate solution sets. The GA-based optimization was guided by the following criteria:
• Maximize the average area under the receiver operating characteristic (ROC) curves of the model over a 10-fold cross validation.
• Select a minimum set of covariates for the optimum performance
• Covariates with large amount of missing data are less favorable
A.3 Final Propensity Score Model
The final propensity score model consists of 29 covariates as shown in eTable 1. Covariates used in the propensity model building process in pre- and post- matched IAC and non-IAC groups are displayed in eTable 2 and eFigure 1. eFigure 2 demonstrates that, over a 10-fold cross validation, the average area under the ROC curve of the final model is 0.81. This indicates a stable performance of the final model.
eTable 1. Final Propensity Score Model
Odds Ratio [95% Conf. Interval] p-value
Age 0.997 0.988 1.005 0.426
Weight 1.001 0.995 1.007 0.761
SOFA 1.591 1.469 1.723 0.000
MICU (ref) vs CSRU 7.216 5.310 9.805 < 0.0001
ICU Admission Day (Reference – Sunday)
Monday 1.504 0.923 2.450 0.101
Tuesday 1.183 0.737 1.899 0.486
Wednesday 1.575 0.970 2.558 0.066
Thursday 1.492 0.922 2.415 0.104
Friday 1.904 1.151 3.148 0.012
Saturday 1.128 0.710 1.793 0.611
Co-incident Diseases
Congestive Heart Failure 1.780 1.091 2.904 0.021
Atrial fibrillation 0.978 0.623 1.535 0.922
Chronic Renal Disease 1.537 0.703 3.360 0.281
End-stage Liver Disease 0.360 0.192 0.676 0.001
Chronic obstructive pulmonary disease 0.784 0.488 1.259 0.314
Coronary artery disease 0.958 0.544 1.688 0.883
Stroke 1.382 0.873 2.189 0.168
Malignancy 1.160 0.785 1.713 0.456
Page 27 of 37
Downloaded From: http://journal.publications.chestnet.org/ by a Francis A Countway User on 11/02/2015

Respiratory Failure (non-COPD)1
1.016 0.746 1.385 0.918
Vital Signs
Mean Arterial Pressure 1.007 1.000 1.015 0.054
Heart Rate 1.006 0.999 1.014 0.098
SpO2 0.974 0.947 1.001 0.063
Temperature 1.000 0.972 1.029 0.988
Laboratory Tests
White Blood Cell 1.032 1.009 1.056 0.006
Hemoglobin 0.954 0.888 1.024 0.191
Platelet 1.000 0.998 1.001 0.726
Sodium 0.930 0.892 0.969 0.001
Potassium 1.022 0.863 1.211 0.799
Bicarbonate 1.023 0.990 1.058 0.177
Chloride 1.055 1.018 1.093 0.003
BUN 1.006 0.993 1.019 0.376
Creatinine 0.763 0.637 0.915 0.003
PO2 1.001 1.000 1.002 0.134
PCO2 0.996 0.984 1.007 0.462
1 ICD-9-CM code 518*, which includes acute respiratory distress syndrome (ARDS)
Page 28 of 37
Downloaded From: http://journal.publications.chestnet.org/ by a Francis A Countway User on 11/02/2015

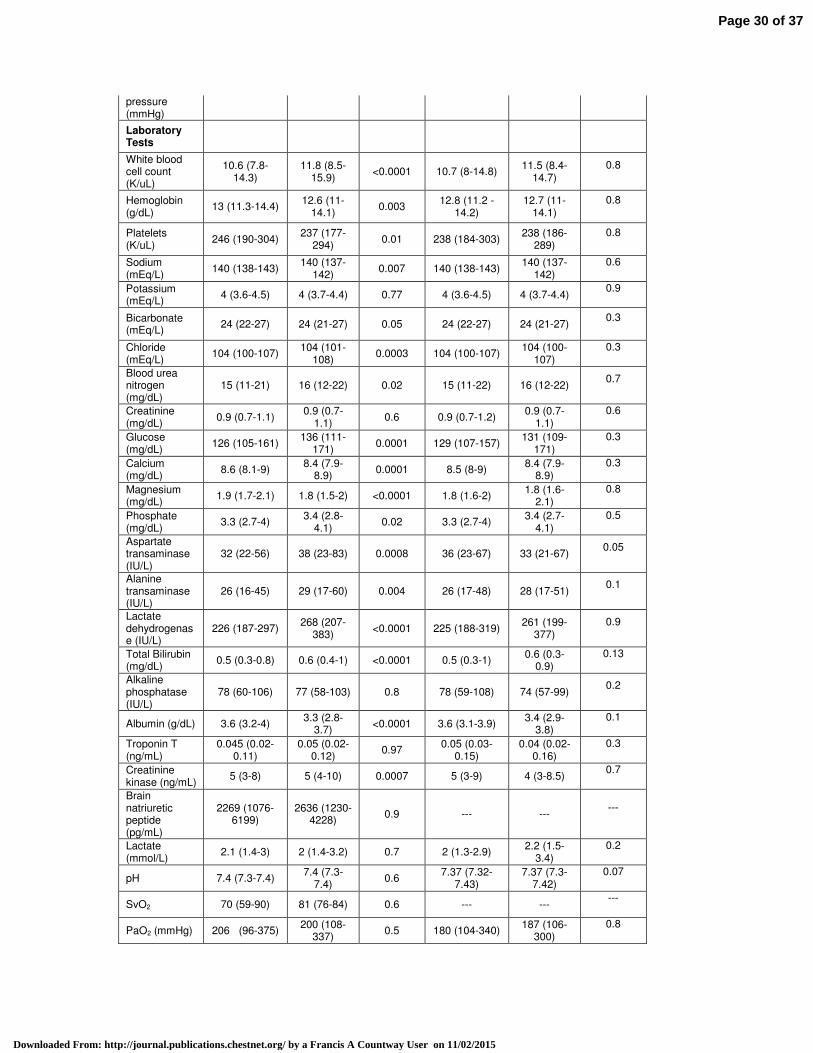
eTable 2. Candidate covariates considered in propensity model building
Variables
Entire Cohort (1776) Matched Cohort (696)
Non-IAC (n=984)
IAC (n=792)
p-value Non-IAC (n=348)
IAC (n=348)
p-value
Age (year) 51 (35-72) 56 (40-73) 0.009 53 (35-72) 54 (38-73) 0.8
Female 344 (43.5%) 406
(41.3%) 0.36 205 (58.9%)
192 (55.2%)
0.6
White race 558 (70.5%) 690
(70.1%) 0.9 225 (64.7%)
234 (67.3%)
0.5
Daytime admission (7am-7pm)
240 (30.3%) 287
(29.2%) 0.6 92 (26.4%) 97 (27.9%)
0.7
Weekend admission
252 (31.8%) 256 (26%) 0.008 112 (32.2%) 95 (27.3%) 0.2
SOFA Score 5 (4-6) 6 (5-8) <0.0001 5 (4-7) 6 (4-7) 0.5
Service Unit
<0.0001
MICU 504 (63.6%) 290
(29.5%) 184 (52.9%)
192 (55.2%) 0.3
SICU 288 (26.4%) 694 (70.5) 164 (47.1%) 156
(44.8%)
Co-incident Diseases
Congestive heart failure
97 (12.5%) 116
(11.8%) 0.7 44 (12.6%) 36 (10.3%)
0.6
Atrial fibrillation
82 (10.4%) 125
(12.7%) 0.1 36 (10.3%) 32 (9.2%)
1.0
Chronic kidney disease
28 (3.5%) 32 (3.3%) 0.8 13 (3.8%) 10 (2.9%) 1.0
Liver Disease 28 (4.8%) 61 (6.2%) 0.2 14 (4%) 18 (5.2%) 0.7
Chronic obstructive pulmonary disease
81 (10.23%) 76 (7.72%) 0.07 32 (9.2%) 39 (11.2%) 0.8
Coronary artery disease
51 (6.4%) 72 (7.32%) 0.5 23 (6.6%) 21 (6%) 0.2
Stroke 70 (8.8%) 152
(15.5%) 0.0001 32 (9.2%) 33 (9.5%)
0.9
Malignancy 92 (11.6%) 164
(16.7%) 0.003 44 (12.6%) 51 (14.7%)
0.4
Respiratory disease (non-COPD)
278 (35.1%)
287 (29.2%)
0.008 121 (34.7%) 125
(35.9%) 0.5
Pneumonia 147 (18.6%) 152
(15.5%) 0.005 67 (20%) 68 (20.3%)
0.9
Vital Signs
Weight (Kg) 76 (65-90) 78 (67-90) 0.08 76 (76-90) 78 (65-90) 0.4
Mean arterial pressure (mmHg)
86 (77-98) 88 (76-100) 0.2 87 (77-98) 87 (75-98) 0.8
Temperature (F)
98 (97-99) 98 (97-99) 0.6 98 (97-99) 98 (97-99) 0.6
Heart Rate 87 (75-100) 88 (74-99) 0.5 86 (74-100) 90 (77-99) 0.3
SpO2 (%) 100 (98-100) 100 (98-
100) 0.5 100 (98-100)
100 (99-100)
0.6
Central venous
8 (6-11) 10 (6-13) 0.4 7.5 (6-12) 10 (6-13) 0.1
Page 29 of 37
Downloaded From: http://journal.publications.chestnet.org/ by a Francis A Countway User on 11/02/2015
pressure (mmHg)
Laboratory Tests
White blood cell count (K/uL)
10.6 (7.8-14.3)
11.8 (8.5-15.9)
<0.0001 10.7 (8-14.8) 11.5 (8.4-
14.7) 0.8
Hemoglobin (g/dL)
13 (11.3-14.4) 12.6 (11-
14.1) 0.003
12.8 (11.2 -14.2)
12.7 (11-14.1)
0.8
Platelets (K/uL)
246 (190-304) 237 (177-
294) 0.01 238 (184-303)
238 (186-289)
0.8
Sodium (mEq/L)
140 (138-143) 140 (137-
142) 0.007 140 (138-143)
140 (137-142)
0.6
Potassium (mEq/L)
4 (3.6-4.5) 4 (3.7-4.4) 0.77 4 (3.6-4.5) 4 (3.7-4.4) 0.9
Bicarbonate (mEq/L)
24 (22-27) 24 (21-27) 0.05 24 (22-27) 24 (21-27) 0.3
Chloride (mEq/L)
104 (100-107) 104 (101-
108) 0.0003 104 (100-107)
104 (100-107)
0.3
Blood urea nitrogen (mg/dL)
15 (11-21) 16 (12-22) 0.02 15 (11-22) 16 (12-22) 0.7
Creatinine (mg/dL)
0.9 (0.7-1.1) 0.9 (0.7-
1.1) 0.6 0.9 (0.7-1.2)
0.9 (0.7-1.1)
0.6
Glucose (mg/dL)
126 (105-161) 136 (111-
171) 0.0001 129 (107-157)
131 (109-171)
0.3
Calcium (mg/dL)
8.6 (8.1-9) 8.4 (7.9-
8.9) 0.0001 8.5 (8-9)
8.4 (7.9-8.9)
0.3
Magnesium (mg/dL)
1.9 (1.7-2.1) 1.8 (1.5-2) <0.0001 1.8 (1.6-2) 1.8 (1.6-
2.1) 0.8
Phosphate (mg/dL)
3.3 (2.7-4) 3.4 (2.8-
4.1) 0.02 3.3 (2.7-4)
3.4 (2.7-4.1)
0.5
Aspartate transaminase (IU/L)
32 (22-56) 38 (23-83) 0.0008 36 (23-67) 33 (21-67) 0.05
Alanine transaminase (IU/L)
26 (16-45) 29 (17-60) 0.004 26 (17-48) 28 (17-51) 0.1
Lactate dehydrogenase (IU/L)
226 (187-297) 268 (207-
383) <0.0001 225 (188-319)
261 (199-377)
0.9
Total Bilirubin (mg/dL)
0.5 (0.3-0.8) 0.6 (0.4-1) <0.0001 0.5 (0.3-1) 0.6 (0.3-
0.9) 0.13
Alkaline phosphatase (IU/L)
78 (60-106) 77 (58-103) 0.8 78 (59-108) 74 (57-99) 0.2
Albumin (g/dL) 3.6 (3.2-4) 3.3 (2.8-
3.7) <0.0001 3.6 (3.1-3.9)
3.4 (2.9-3.8)
0.1
Troponin T (ng/mL)
0.045 (0.02-0.11)
0.05 (0.02-0.12)
0.97 0.05 (0.03-
0.15) 0.04 (0.02-
0.16) 0.3
Creatinine kinase (ng/mL)
5 (3-8) 5 (4-10) 0.0007 5 (3-9) 4 (3-8.5) 0.7
Brain natriuretic peptide (pg/mL)
2269 (1076-6199)
2636 (1230-4228)
0.9 --- --- ---
Lactate (mmol/L)
2.1 (1.4-3) 2 (1.4-3.2) 0.7 2 (1.3-2.9) 2.2 (1.5-
3.4) 0.2
pH 7.4 (7.3-7.4) 7.4 (7.3-
7.4) 0.6
7.37 (7.32-7.43)
7.37 (7.3-7.42)
0.07
SvO2 70 (59-90) 81 (76-84) 0.6 --- --- ---
PaO2 (mmHg) 206 (96-375) 200 (108-
337) 0.5 180 (104-340)
187 (106-300)
0.8
Page 30 of 37
Downloaded From: http://journal.publications.chestnet.org/ by a Francis A Countway User on 11/02/2015

PaCO2 (mmHg)
42 (37-50) 41 (36-48) 0.02 41.5 (37-47) 40 (35-46.5)
0.6
Sedative Medications Used
554 (70%) 819 (83%) <0.0001 269 (80%) 279 (83%) 0.3
Fentanyl 83 (11%) 224 (23%) <0.0001 43 (12%) 79 (23%) 0.002
Midazolam 55 (7%) 95 (10%) 0.05 22 (6%) 48 (14%) 0.001
Propofol 524 (66%) 774 (79%) <0.0001 259 (77%) 259 (77%) 1
* Insufficient number matched pairs for brain natriuretic peptide and SvO2 comparisons
Page 31 of 37
Downloaded From: http://journal.publications.chestnet.org/ by a Francis A Countway User on 11/02/2015

eFigure 1. Baseline covariate distributional balance in propensity-matched cohorts
Page 32 of 37
Downloaded From: http://journal.publications.chestnet.org/ by a Francis A Countway User on 11/02/2015
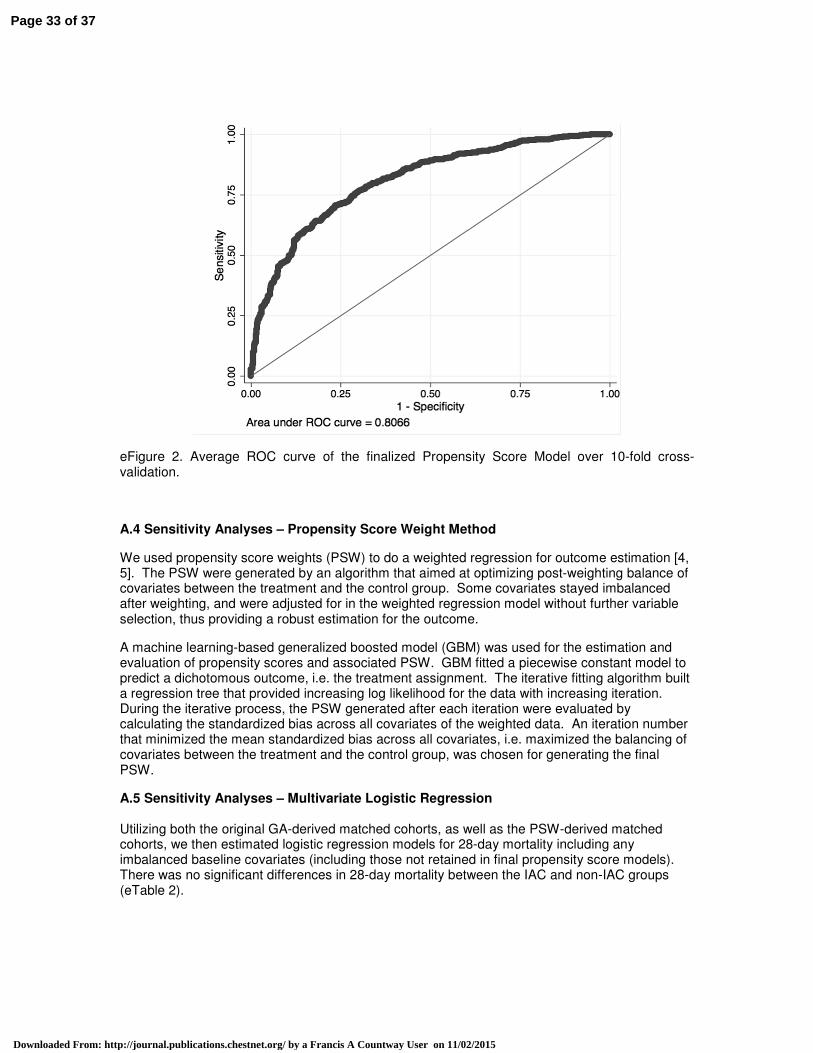
eFigure 2. Average ROC curve of the finalized Propensity Score Model over 10-fold cross-validation.
A.4 Sensitivity Analyses – Propensity Score Weight Method
We used propensity score weights (PSW) to do a weighted regression for outcome estimation [4, 5]. The PSW were generated by an algorithm that aimed at optimizing post-weighting balance of covariates between the treatment and the control group. Some covariates stayed imbalanced after weighting, and were adjusted for in the weighted regression model without further variable selection, thus providing a robust estimation for the outcome.
A machine learning-based generalized boosted model (GBM) was used for the estimation and evaluation of propensity scores and associated PSW. GBM fitted a piecewise constant model to predict a dichotomous outcome, i.e. the treatment assignment. The iterative fitting algorithm built a regression tree that provided increasing log likelihood for the data with increasing iteration. During the iterative process, the PSW generated after each iteration were evaluated by calculating the standardized bias across all covariates of the weighted data. An iteration number that minimized the mean standardized bias across all covariates, i.e. maximized the balancing of covariates between the treatment and the control group, was chosen for generating the final PSW.
A.5 Sensitivity Analyses – Multivariate Logistic Regression Utilizing both the original GA-derived matched cohorts, as well as the PSW-derived matched cohorts, we then estimated logistic regression models for 28-day mortality including any imbalanced baseline covariates (including those not retained in final propensity score models). There was no significant differences in 28-day mortality between the IAC and non-IAC groups (eTable 2).
Page 33 of 37
Downloaded From: http://journal.publications.chestnet.org/ by a Francis A Countway User on 11/02/2015

eTable 3. Weighted logistic regression model for 28-day mortality
OR 95% Confidence Interval p-value
GA Method 0.93 0.61, 1.44 0.75
PSW Method 1.39 0.63, 3.06 0.41
* Reference group - Non-IAC
eTable 4. Comparison of candidate covariates between matched and unmatched cohorts
Variables
Non-IAC IAC
Matched (n=348)
Unmatched (n=636) p-value
Matched (n=348)
Unmatched (n=444) p-value
Age (year) 53 (35-72) 49 (34-71) 0.1 54 (38-73) 58 (41-74) 0.1
Female 205 (58.9%) 256 (56.1%) 0.8 192 (55.2%) 394 (60.7%) 0.1
White race 225 (64.7%) 333 (72.8%) 0.2 234 (67.3%) 459 (70.7%) 0.8
Daytime admission (7am-7pm)
92 (26.4%) 148 (32.3%) 0.1 97 (27.9%) 190 (29.2%) 0.9
Weekend admission
112 (32.2%) 140 (30.6%) 0.4 95 (27.3%) 161 (24.8%) 0.3
SOFA Score 5 (4-7) 4 (3-5) <0.0001 6 (4-7) 7 (5-8) <0.0001
Service Unit
<0.0001
<0.0001 MICU 184 (52.9%) 328 (71.7%) 192 (55.2%) 103 (15.9%)
SICU 164 (47.1%) 129 (28.2%) 156 (44.8%) 546 (84.1%)
Co-incident Diseases
Congestive heart failure
44 (12.6%) 60 (13.1%) 0.4 36 (10.3%) 75 (11.6%) 0.8
Atrial fibrillation 36 (10.3%) 45 (9.9%) 0.6 32 (9.2%) 88 (13.6%) 0.3
Chronic renal disease
13 (3.8%) 18 (4%) 0.6 10 (2.9%) 22 (3.4%) 0.9
Liver Disease 14 (4%) 20 (4.4%) 0.6 18 (5.2%) 45 (6.9%) 0.2
Chronic obstructive pulmonary disease
32 (9.2%) 43 (9.4%) 0.4 39 (11.2%) 40 (6.2%) 0.02
Coronary artery disease
23 (6.6%) 27 (6%) 0.6 21 (6%) 56 (8.6%) 0.03
Stroke 32 (9.2%) 37 (8.1%) 0.4 33 (9.5%) 118 (18,2%) 0.001
Malignancy 44 (12.6%) 46 (10.1%) 0.1 51 (14.7%) 125 (19.3%) 0.0002
Respiratory disease (non-
121 (34.7%) 157 (34.4%) 0.7 125 (35.9%) 158 (24.4%) <0.0001
Page 34 of 37
Downloaded From: http://journal.publications.chestnet.org/ by a Francis A Countway User on 11/02/2015

COPD)
Pneumonia 67 (20%) 89 (17.5%) 0.4 68 (20.3%) 84 (12.9%) 0.003
Vital Signs
Weight (Kg) 75 (65-90) 76 (65-89) 0.9 78 (65-90) 78 (67-90) 0.7
Mean arterial pressure (mmHg)
87 (77-98) 86 (77-97) 0.99 87 (75-98) 88 (76-101) 0.2
Temperature (F)
98 (97-99) 98 (97-99) 0.2 98 (97-99) 98 (97-99) 0.3
Heart Rate 86 (74-100) 88 (76-101) 0.2 90 (77-99) 86 (73-100) 0.1
SpO2 (%) 100 (98-100) 100 (98-100) 0.1 100 (99-100) 100 (99-100) 0.3
Central venous pressure (mmHg)
7.5 (6-12) 8.5 (6-11) 0.7 10 (6-13) 10 (6-13) 0.5
Laboratory Tests
White blood cell count (K/uL)
10.7 (8-14.8) 10.6 (7.6-
14.1) 0.3 11.5 (8.4-14.7) 11.8 (8,7-16.4) 0.2
Hemoglobin (g/dL)
12.8 (11.2 -14.2)
13 (11.4-14.4)
0.1 12.7 (11-14.1) 12.3 (10.8-
13.9) 0.02
Platelets (K/uL) 238 (184-
303) 247 (199-
307) 0.09 238 (186-289) 228 (165-291) 0.05
Sodium (mEq/L)
140 (138-143)
140 (138-143)
0.12 140 (137-142) 139 (137-142) 0.01
Potassium (mEq/L)
4 (3.6-4.5) 4 (3.7-4.4) 0.5 4 (3.7-4.4) 4 (3.6-4.4) 0.5
Bicarbonate (mEq/L)
24 (22-27) 25 (22-28) 0.02 24 (21-27) 24 (21-27) 0.22
Chloride (mEq/L)
104 (100-107)
103 (100-106)
0.1 104 (100-107) 105 (101-108) 0.02
Blood urea nitrogen (mg/dL)
15 (11-22) 15 (11-21) 0.5 16 (12-22) 16 (12-22) 0.6
Creatinine (mg/dL)
0.9 (0.7-1.2) 0.9 (0.7-1.1) 0.2 0.9 (0.7-1.1) 0.9 (0.7-1.1) 0.2
Glucose (mg/dL)
129 (107-157)
124 (104-164 0.4 131 (109-171) 137 (112-171) 0.2
Calcium (mg/dL)
8.5 (8-9) 8.6 (8.1-9.1) 0.1 8.4 (7.9-8.9) 8.4 (7.8-8.9) 0.4
Magnesium (mg/dL)
1.8 (1.6-2) 1.9 (1.7-2.1) 0.01 1.8 (1.6-2.1) 1.7 (1.5-2) 0.03
Phosphate (mg/dL)
3.3 (2.7-4) 3.3 (2.7-3.9) 0.8 3.4 (2.7-4.1) 3.4 (2.9-4.1) 0.3
Page 35 of 37
Downloaded From: http://journal.publications.chestnet.org/ by a Francis A Countway User on 11/02/2015

Aspartate transaminase (IU/L)
36 (23 -67) 29 (21-51) 0.01 33 (21-67) 40 (24-92) 0.02
Alanine transaminase (IU/L)
26 (17-48) 34 (16-42) 0.3 28 (17-51) 30 (17-64) 0.3
Lactate dehydrogenase (IU/L)
225 (188-319)
230 (184-291)
0.5 261 (199-377) 270 (210-384) 0.3
Total Bilirubin (mg/dL)
0.5 (0.3-1) 0.5 (0.3-0.7) 0.2 0.6 (0.3-0.9) 0.7 (0.4-1.2) 0.0007
Alkaline phosphatase (IU/L)
78 (59-108) 78 (61-101) 0.9 74 (57-99) 78 (59-112) 0.13
Albumin (g/dL) 3.6 (3.1-3.9) 3.7 (3.2-4.1) 0.05 3.4 (2.9-3.8) 3.1 (2.8-3.7) 0.01
Troponin T (ng/mL)
0.05 (0.03-0.15)
0.04 (0.02-0.1)
0.1 0.04 (0.02-
0.16) 0.05 (0.02-
0.11) 0.9
Creatinine kinase (ng/mL)
5 (3-9) 5 (3-8) 0.7 4 (3-8.5) 5 (4-10) 0.2
Brain natriuretic peptide (pg/mL)
NA NA NA NA NA NA
Lactate (mmol/L)
2 (1.3-2.9) 2.2 (1.5-3.1) 0.1 2.2 (1.5-3.4) 1.9 (1.4-3.1) 0.1
pH 7.37 (7.32-
7.43) 7.4 (7.3-7.4) 0.3 7.37 (7.3-7.42) 7.38 (7.3-7.4) 0.1
SvO2 NA NA NA NA NA NA
PaO2 (mmHg) 180 (104-
340) 174 (87-341) 0.2 187 (106-300) 205 (122-326) 0.2
PaCO2 (mmHg) 41.5 (37-47) 42 (37-49) 0.06 40 (35-46.5) 40 (35-45) 0.2
Sedative Medications Used
269 (80%) 285 (63%) <0.0001 279 (83%) 540 (22%) 1
Fentanyl 43 (12%) 40 (9%) 0.08 79 (23%) 145 (22%) 0.7
Midazolam 22 (6%) 33 (7%) 0.8 48 (14%) 47 (7%) 0.001
Propofol 259 (77%) 265 (58%) <0.0001 259 (77%) 515 (79%) 0.5
* Insufficient number of matched pairs for brain natriuretic peptide and SvO2 comparisons
References:
[1] Mitchell, Melanie (1996). An Introduction to Genetic Algorithms. Cambridge, MA: MIT Press.
[2] http://cran.r-project.org/web/packages/GA/index.html
Page 36 of 37
Downloaded From: http://journal.publications.chestnet.org/ by a Francis A Countway User on 11/02/2015

[3] Ridgeway G, McCaffrey D, Morral A, Ann B, and Burgette L (2015). Twang: Toolkit for Weighting and Analysis of Nonequivalent Groups. R package version 1.4-9.3. http://CRAN.R-project.org/package=twang
[4] McCaffrey D, Ridgeway G, Morral A (2004). “Propensity Score Estimation with Boosted Regression for Evaluating Adolescent Substance Abuse Treatment,” Psychological Methods 9(4):403-425.
[5] Brian K. Lee, Justin Lessler, and Elizabeth A. Stuart (2010). “Improving propensity score weighting using machine learning,” Stat Med. 2010 February 10; 29(3): 337–346
Page 37 of 37
Downloaded From: http://journal.publications.chestnet.org/ by a Francis A Countway User on 11/02/2015