
Onion - SFAC Indiasfacindia.com/PDFs/OnionPotato-February2015.pdf · · 2016-10-10Onion Volume 33...
4
Onion Volume 33 February 2015 Monthly Average Wholesale Price (`/qtl) and Arrivals (in Quintals) Trend Comparison Source: Agriwatch Market Avg. Prices January 2015 Avg. Prices December 2014 % Change in Prices Over Previous Month Previous Year Avg. January (2014) Price % Change Over Previous Year Daily Avg. Arrivals January Daily Avg. Arrivals December % Change in Arrivals Over Previous Month Delhi 1457 1596 -8.71 1129 29.05 8189 10787 -24.08 Bengaluru 1706 1788 -4.59 1052 62.17 32167 50560 -36.38 Lasalgaon 1264 1460 -13.42 985 28.32 19250 7185 167.92 Pimplagaon 1289 1538 -16.19 1032 24.90 22279 16063 38.70 Mumbai 1479 1744 -15.19 1102 34.21 22406 19308 16.05 Pune 1520 1802 -15.65 962 58.00 10650 11500 -7.39 Jaipur 1531 1674 -8.54 1122 36.45 3154 2780 13.45 Chennai 2126 2420 -12.15 1460 45.62 4560 4796 -4.92 Hyderabad 2004 2125 -5.69 875 129.03 2442 2055 18.83 Executive Summary All India, onion arrival in month of January is approximately 32% higher compared to previous month. If we compare onion arrivals in January month on a yearly basis we observed that arrivals are 30% higher than last year during same time. All India Rabi production is expected to be approximately 95 lakh ton. According to trade sources, storage onion is expected to arrive in market from 1st week of March. As per IBIS (International Business Information Services), approximately 78383 tons of processed and fresh onion has been exported in month of January 2015 compared to previous month export of 34081 tons. In Karnataka, total Rabi area is approximately 16676 ha. As on 27.1.2015 approximately 18145 ha of area is sown compared to last year area of 23844 ha. In Maharashtra, January arrivals are approximately 5% lower compared to previous year during same time. Prices are expected to fall down further with increase in arrivals of late Kharif and Rabi crop. On a month-on-month basis, prices have decreased in almost all the markets with arrivals of late Kharif onion from Maharashtra and Other parts. Maximum prices have decreased in major producing regions of Maharashtra like Lasalgaon, Pimpalgaon and Pune by 13%-16%. In Bengaluru onion is arriving in market from local region (Bijapur and Gulbarga districts) and Maharashtra which are contributing approximately 40% and 60% respectively. Monthly Average Retail Price (`/qtl) Trend Comparison Market State Average Retail Price January 2015 Average Retail Price December 2014 Previous Year Avg. Retail Price- January 2014 % Change in Price Over Prev. Month % Change in Price Over Prev. Month Bengaluru Karnataka 2314 2263 1600 2.3 44.6 Bhubaneswar Odisha 2136 2540 1936 -15.9 10.3 Chennai Tamil Nadu 2161 2159 1740 0.1 24.2 Delhi Delhi 3150 3000 2525 5.0 24.8 Guwahati Assam 2766 2819 2054 -1.9 34.7 Hyderabad A.P. 2544 2600 1400 -2.2 81.7 Kolkata W. Bengal 2605 2750 2200 -5.3 18.4 Mumbai Maharashtra 2800 3000 2509 -6.7 11.6 Patna Bihar 1933 2257 1720 -14.4 12.4 Source: Consumer Affairs
Transcript of Onion - SFAC Indiasfacindia.com/PDFs/OnionPotato-February2015.pdf · · 2016-10-10Onion Volume 33...

Onion
Volume 33 February 2015
Monthly Average Wholesale Price (`/qtl) and Arrivals (in Quintals) Trend Comparison
Source: Agriwatch
Market Avg. Prices January 2015
Avg. Prices December
2014
% Change in Prices Over
Previous Month
Previous Year Avg. January
(2014) Price
% Change Over
Previous Year
Daily Avg. Arrivals January
Daily Avg. Arrivals
December
% Change in Arrivals Over
Previous Month
Delhi 1457 1596 -8.71 1129 29.05 8189 10787 -24.08Bengaluru 1706 1788 -4.59 1052 62.17 32167 50560 -36.38Lasalgaon 1264 1460 -13.42 985 28.32 19250 7185 167.92Pimplagaon 1289 1538 -16.19 1032 24.90 22279 16063 38.70Mumbai 1479 1744 -15.19 1102 34.21 22406 19308 16.05Pune 1520 1802 -15.65 962 58.00 10650 11500 -7.39Jaipur 1531 1674 -8.54 1122 36.45 3154 2780 13.45Chennai 2126 2420 -12.15 1460 45.62 4560 4796 -4.92Hyderabad 2004 2125 -5.69 875 129.03 2442 2055 18.83
Executive SummaryAll India, onion arrival in month of January is �approximately 32% higher compared to previous month. If we compare onion arrivals in January month on a yearly basis we observed that arrivals are 30% higher than last year during same time.
All India � Rabi production is expected to be approximately 95 lakh ton. According to trade sources, storage onion is expected to arrive in market from 1st week of March.
As per IBIS (International Business Information �Services), approximately 78383 tons of processed
and fresh onion has been exported in month of January 2015 compared to previous month export of 34081 tons.
In Karnataka, total � Rabi area is approximately 16676 ha. As on 27.1.2015 approximately 18145 ha of area is sown compared to last year area of 23844 ha.
In Maharashtra, January arrivals are �
approximately 5% lower compared to previous year during same time. Prices are expected to fall down further with increase in arrivals of late Kharif and Rabi crop.
On a month-on-month basis, prices have decreased in almost all the markets with arrivals of late Kharif onion from Maharashtra and Other parts. Maximum prices have decreased in major producing regions of Maharashtra like Lasalgaon, Pimpalgaon and Pune by 13%-16%.
In Bengaluru onion is arriving in market from local region (Bijapur and Gulbarga districts) and Maharashtra which are contributing approximately 40% and 60% respectively.
Monthly Average Retail Price (`/qtl) Trend ComparisonMarket State Average Retail
Price January 2015
Average Retail Price December
2014
Previous Year Avg. Retail Price- January 2014
% Change in Price Over Prev.
Month
% Change in Price Over Prev.
MonthBengaluru Karnataka 2314 2263 1600 2.3 44.6Bhubaneswar Odisha 2136 2540 1936 -15.9 10.3Chennai Tamil Nadu 2161 2159 1740 0.1 24.2Delhi Delhi 3150 3000 2525 5.0 24.8Guwahati Assam 2766 2819 2054 -1.9 34.7Hyderabad A.P. 2544 2600 1400 -2.2 81.7Kolkata W. Bengal 2605 2750 2200 -5.3 18.4Mumbai Maharashtra 2800 3000 2509 -6.7 11.6Patna Bihar 1933 2257 1720 -14.4 12.4
Source: Consumer Affairs

Monthly Report | February 2015Market Intelligence System
All India Onion Monthly Arrivals
Technical Analysis of Onion Prices at Lasalgaon, Nasik
Onion Rabi Production Estimate
Note: Each bar or “candle” in the chart shows the price movement in a particular week. The green candle signifies prices increased and red candle signifies prices decreased in that week. The length of the “candle” shows the upper and lower end of the price range for the week.
In Retail market, prices have decreased in almost all the markets except Bengaluru, Chennai and Delhi where prices have increased nominally. In Bengaluru prices have increased because almost 60% onion is arriving in market from Maharashtra.
The graph shows the monthly all India arrivals. Arrivals are higher in January month than last month because fresh Kharif arrivals are arriving in market with full pace. In coming months arrivals are expected to increase as late Kharif and Rabi crop will start arriving in market. Source: Agmarknet
Name of the State Rabi Targets for 2014 ('000 ha)
Likely Acreage ('000 ha)
Expected Average Yield(Ton/ha)
Expected Production Rabi (‘000 Tons)*
Maharashtra 196.666 190 15 2850Madhya Pradesh 119.917 119 21 2499Karnataka 16.68 16 14.5 232Andhra Pradesh 5.085 3.8 16 60.8Gujarat 70 50 24.5 1225Haryana 30.8 25 22 550Tamil Nadu 14.345 25.57 11 281.27Telangana 10.092 11 11 121West Bengal 24.64 24 14 336Punjab 7.56 7 22 154Total Above state 495.785 471 8309.07All India Total Rabi Production 9555.43
2014-15 2013-14
Comparison of All India Monthly Onion Arrivals
*Rabi onion production this year under normal condition is estimated to be 95.55 lakh tons. It could vary between 95 to 100 lakh tons.
The above chart shows the monthly price movement of onion in the benchmark of Lasalgaon mandi of Nasik. During the month of January modal prices are trading around `1264/qtl. On the upper side prices may find resistance at a level of `1500/qtl whereas long
1200
0200400600800
1000
1400
1600
Arr
ival
s in
('00
0 M
T)
September October November December January
1800
Source: Agriwatch Research
term support is `1000/qtl. Overall, onion prices are expected to fall further as Relative Strength Indicator (RSI) oscillator is moving stable in neutral region which suggest prices may remain range bound in a range of `1000- `1300/qtl in coming month.

Monthly Report | February 2015Market Intelligence System
Potato
Source: #Consumer Affairs, *Agriwatch
Monthly Retail Price (`/qtl) and Arrivals (Tons) Trend in Different Consuming CentersMarket January
2015 Avg. Retail Price
(`/qtl)- (Fresh Potato)
December 2014 Avg. Retail Price
(`/qtl)- (Fresh Potato)
Previous Year Avg.
Retail Price- January 2014
% Change in Price
Over Prev. Month
% Change in Price
Over Prev. Year
Total Arrivals in January
2015 (in qtl )*
Total Arrivals in December
2014 (in qtl )*
Total Arrivals in January
2014 (in qtl )*
Bengaluru 2428 3000 2118 -19.07 14.64 206500 239850 180600Chennai 2322 2700 1793 -14.00 29.50 63100 66200 63900Delhi 1450 2000 1887 -27.50 -23.16 651200 628200 646750Guwahati 1080 2100 1373 -48.57 -21.34 70950 33210 52300Hyderabad 2477 3300 1730 -24.94 43.18 56480 18530 24100Mumbai 2926 3100 2353 -5.61 24.35 346800 352950 266950Ranchi 1280 1700 1592 -24.71 -19.60 57250 64300 57600
Source: Agriwatch
Monthly Wholesale Price Trend in Different Producing & Consuming CentersMarket January 2015
Avg. Wholesale Price (`/qtl)- (Fresh Potato)
December 2014 Avg.
Wholesale Price (`/qtl)- (Fresh
Potato)
January 2014 Avg. Wholesale
Price (`/qtl)
Absolute Change over Prev. Month
(`/qtl)
% Change Over Prev. Month
% Change Over Prev. Year
Delhi 580 770 766 -190 -24.68 -24.28Khandauli (Agra) 795 929 783 -134 -14.42 1.53Farrukhabad 495 699 610 -204 -29.18 -18.85Ludhiana 471 656 694 -185 -28.20 -32.13Kolkata 823 1585 1089 -762 -48.08 -24.43Jaipur 729 902 864 -173 -19.18 -15.63Mumbai 992 1881 1099 -889 -47.26 -9.74Bengaluru 1630 1984 1392 -354 -17.84 17.10Tarkeshwar 636 1619 1123 -983 -60.72 -43.37
Executive SummaryIn U.P., � Rabi acreage is expected to be higher than last year by approximately 6%. Total estimated area for 2014-15 Rabi season is approximately 601000 ha.
In West Bengal, potato area is expected �to be approximately 4.43 lakh ha which is 15% higher than last year due to better price realization in 2014. Crop is expected to arrive in cold storages from February last which is normal time. In some parts Blight disease is seen but that is nominal and would not impact the production much.
In Karnataka, targeted area for � Rabi season
is 9855 ha. As on 27.01.2015 approximately 8384 ha of area is sown compared to last year 5636 ha during same time.
In Bihar, potato area is estimated to be �
approximately 3.53 lakh ha which 10-12% higher than last year. Potato prices are expected to remain low this year because of higher production estimate.
Across the country potato prices are �
comparatively lower than last year in January due to higher production estimate this year. Potato prices are expected to remain on lower side throughout the season
The above table shows the monthly average prices of major markets and variation of prices with previous month and year. In most of the markets, prices have decreased as fresh crop from producing regions like Punjab, West Bengal, and U.P. is continuously arriving in market.
If we compare the prices with previous year during same time it is observed that prices are comparatively lower than last year because of higher production and better crop condition this year in major producing regions.
Monthly Report | February 2015Market Intelligence System
The information contained in this document has been compiled by Agriwatch from sources believed to be reliable, such as NHB, Agmarknet, etc. and directly from traders in mandis. However, users of this data are requested to use the information with due caution and crosscheck with other sources. This document is not, and should not be construed as an offer to sell or buy any commodities. This document may not be reproduced, distributed or published without the express consent of SFAC.
DISCLAIMER
SMALL FARMERS’ AGRIBUSINESS CONSORTIUMNCUI Auditorium Building, 5th Floor, 3 Siri Institutional Area August Kranti Marg, Hauz Khas, New Delhi – 110016Tel: (011) 26862365, 26966017 | Fax: (011) 26862367Email: [email protected] | Web: www.sfacindia.com
INdIAN AGRIBUSINESS SySTEMS PvT. LTd.H–128, First Floor, Sector 63, Noida – 201 301, India
Tel: (0120) 4618100 | Fax: (0120) 4618118
Email: [email protected] | Web: www.agriwatch.com
Report Prepared by:Report Produced by:
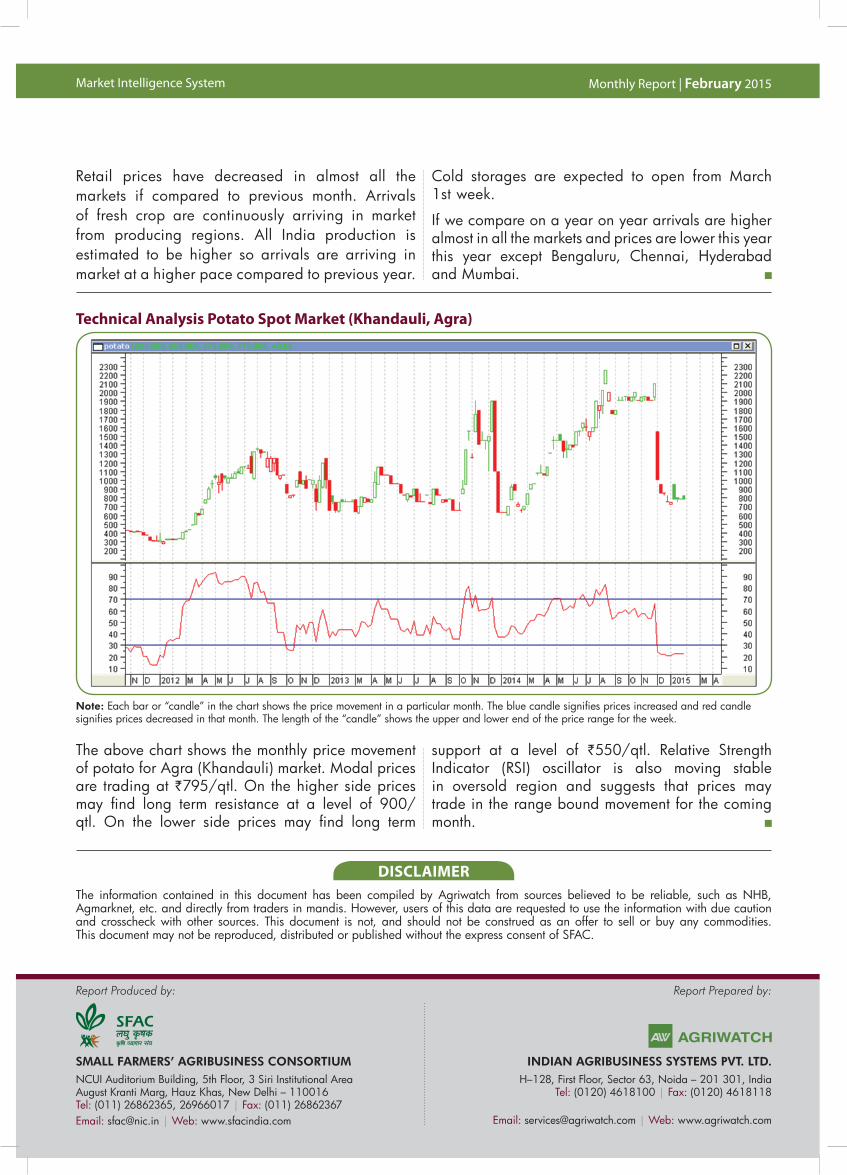
Note: Each bar or “candle” in the chart shows the price movement in a particular month. The blue candle signifies prices increased and red candle signifies prices decreased in that month. The length of the “candle” shows the upper and lower end of the price range for the week.
Technical Analysis Potato Spot Market (Khandauli, Agra)
Retail prices have decreased in almost all the markets if compared to previous month. Arrivals of fresh crop are continuously arriving in market from producing regions. All India production is estimated to be higher so arrivals are arriving in market at a higher pace compared to previous year.
The above chart shows the monthly price movement of potato for Agra (Khandauli) market. Modal prices are trading at `795/qtl. On the higher side prices may find long term resistance at a level of 900/qtl. On the lower side prices may find long term
support at a level of `550/qtl. Relative Strength Indicator (RSI) oscillator is also moving stable in oversold region and suggests that prices may trade in the range bound movement for the coming month.
Cold storages are expected to open from March 1st week.
If we compare on a year on year arrivals are higher almost in all the markets and prices are lower this year this year except Bengaluru, Chennai, Hyderabad and Mumbai.