OneView - Mason School of Business
42
OneView User’s Guide McLeod Business Library, Mason School of Business Page 1 April 2013 OneView User’s Guide Welcome to OneView. This user guide will show you everything you need to know to access and utilize the wealth of information available from OneView. The OneView program is an Internet-based database that may be accessed by using one of the network computers in the McLeod Business Library in Alan B. Miller Hall. Mason School of Business graduate students, undergraduate students with a Business major, faculty and staff may also access this program through the Mason School of Business network. Introduction OneView is the primary platform for providing marketers with access to the Experian Simmons National Consumer Study (NCS). OneView combines the research from Experian Simmons with powerful analytic tools and reports to provide marketers with a single, complete view of consumer targets via an intuitive online platform. The OneView program accesses a wealth of marketing data collected from a comprehensive survey of about 30,000 American adults, which has been projected to reflect the general population. The Simmons National Consumer Study (NCS) is an annual survey of consumer buying habits and preferences, coordinated with demographic characteristics and with media usage and audience. There are about 5,000 questions with 50,000 possible answers.
Transcript of OneView - Mason School of Business

OneView User’s Guide McLeod Business Library, Mason School of Business
Page 1
April 2013
OneView
User’s Guide Welcome to OneView. This user guide will show you everything you need to know to access and utilize the wealth of information available from OneView.
The OneView program is an Internet-based database that may be accessed by using one of the network computers in the McLeod Business Library in Alan B. Miller Hall.
Mason School of Business graduate students, undergraduate students with a Business major, faculty and staff may also access this program through the Mason School of Business network.
Introduction OneView is the primary platform for providing marketers with access to the Experian Simmons National Consumer Study (NCS). OneView combines the research from Experian Simmons with powerful analytic tools and reports to provide marketers with a single, complete view of consumer targets via an intuitive online platform.
The OneView program accesses a wealth of marketing data collected from a comprehensive survey of about 30,000 American adults, which has been projected to reflect the general population. The Simmons National Consumer Study (NCS) is an annual survey of consumer buying habits and preferences, coordinated with demographic characteristics and with media usage and audience. There are about 5,000 questions with 50,000 possible answers.

OneView User’s Guide McLeod Business Library, Mason School of Business
Page 2
April 2013
Table of Contents Introduction ......................................................................................................................... 1 Table of Contents ................................................................................................................ 2 The Opening Screen ............................................................................................................ 3 The Coding Window ........................................................................................................... 4 Tab Bar ................................................................................................................................ 5 Profile Tab .................................................................................................................... 5 Crosstab ................................................................................................................... 5 Edit Pane ......................................................................................................... 11 Action Bar ................................................................................................. 11 Dictionary Window and Answer Window ................................................ 14 Columns and Rows Boxes ........................................................................ 17 Coding Box ............................................................................................... 18 Content Menu (Right-Click Menu) ........................................................... 20 View Pane ....................................................................................................... 21 Report List ................................................................................................ 21 Action Bar ................................................................................................. 22 View Selector ............................................................................................ 23 Results Window ....................................................................................... 24 Crosstab ............................................................................................... 24 Private Eye .......................................................................................... 25 Interpreting OneView Data ............................................................................. 26 Trend Analysis ................................................................................................ 28 Results Window (Trend) ........................................................................... 29 Quick Reports ....................................................................................................... 30 Plan Tab ...................................................................................................................... 31 Reach & Frequency ............................................................................................... 31 Reach and Frequency View Pane ................................................................... 32 Administration Tab ..................................................................................................... 35 Resources Tab ............................................................................................................. 35 Functions Window ............................................................................................................ 36 Average Tab ................................................................................................................ 36 Count Tab .................................................................................................................... 37 Volume Tab ................................................................................................................ 38 N-Tile Tab ................................................................................................................... 39 Definitions ......................................................................................................................... 40 General ........................................................................................................................ 40 Logical Operators ........................................................................................................ 42 Use of Parentheses ...................................................................................................... 42

OneView User’s Guide McLeod Business Library, Mason School of Business
Page 3
April 2013
The Opening Screen
When accessing OneView, you will see a warning message dis-played. Click on either the Yes or No button to continue to the One-View Welcome page.
Once you have opened the One-View Welcome page you must click on the Proceed button to continue on to the OneView program. This will open the Coding window in the OneView pro-gram.

OneView User’s Guide McLeod Business Library, Mason School of Business
Page 4
April 2013
The Coding Window The OneView Coding Window is pictured below. This screen consists of three major areas.
1. The Tab Bar has four tabs and the Sign Out button. The tabs are: Profile (with five selections in a menu bar), Plan (with three selections in a menu bar), Administration (not available in this subscription), and Resources (with five selections). For information on the Tab Bar go to page 5.
2. The Edit Pane occupies the major section of the page. This pane includes the Action Bar, Dictionary Window, Answer Window, Columns box, Rows box, and Coding Box. See page 11 for information about the Edit Pane.
3. The View Pane is displayed when a Crosstab is run. This pane includes a Report List, Action Bar, View Selector and Results Window. See page 21 for information about the View Pane.
3
2 1

OneView User’s Guide McLeod Business Library, Mason School of Business
Page 5
April 2013
Tab Bar The Tab Bar has four tabs and the Sign Out button. The Sign Out button will close the program and open a Login Window. You must restart the program from the icon on the Business Databases page to re-enter the program.
The four tabs are: Profile (with five selections in a menu bar) (see below), Plan (with three selections in a menu bar) (see page 31), Administration (not included in this subscription), and Resources (with five selections in a menu bar) (see page 35).
Profile Tab The Profile tab has a menu bar with five selections: Crosstab (see below), Quick Reports (see page 30), MME (not included in the current subscription), Correspondence (not included in the current subscription), and Cluster (not included in the current subscription).
Crosstab With the Crosstab Editor open, these are the steps to take in setting up a Crosstab analysis. For information about the Edit Pane please go to page 21.
1. Select Study.
• The first step is to select the study you wish to use in your research. The current study is listed in the Action Bar of the Edit Pane. (The Spring 2009 NCS Adult Survey 12-Month: Population study is shown in the Edit Pane pictured at right.)
If you do not want to use the current study, click on the Study button in the Action Bar.
Dictionary Window
Answer Window
Columns Box
Rows Box Coding Box
Action Bar

OneView User’s Guide McLeod Business Library, Mason School of Business
Page 6
April 2013
This will open the Select Current Study window with the currently available studies listed. Highlight the study you want to use by clicking on it.
You also select whether you want the study weighted by Population or by Household (the selections in the lower left corner of the window).
Note: A survey may have two different “weights,” either Population or Household. The Population weight projects all respondents in the survey to the total survey population. Household projects respondents to total households in the survey.
After making your selections click on the OK button and that study will be loaded into the OneView program.
• The new study will be listed in the Action Bar.
2. Select the Base(s).
• With a survey displayed in the Dictionary Window, open the Lifestyle (Demographics) question list by clicking on the arrow icon or double clicking on the title. This will display the questions contained in this question list. There are several sub-lists in this topic so you will have to continue to open lists until you find the question you are looking for. Also open the Demographics (Personal Information) question list.
• As you click on a question, the possible answers are displayed in the Answer Window to the right of the list of questions. An example of a selection for a Base would be “Gender.”
• In the Answer Window, select “Male” or “Female” by highlighting the answer. Note, more than one Base may be selected for a single Crosstab. Once you have selected an answer (“Male” in this analysis), click on the Bases tab to display the Bases box. Then click and hold the mouse pointer over the answer and drag the answer to the Bases box. The number of Bases currently in use are displayed in the parentheses after the word “Bases” above the Bases box.
Note: For instructions on how to create a complex coding expression to narrow the universe of your analysis please go to the Coding Box section on page 18.
OneView User’s Guide McLeod Business Library, Mason School of Business
Page 7
April 2013
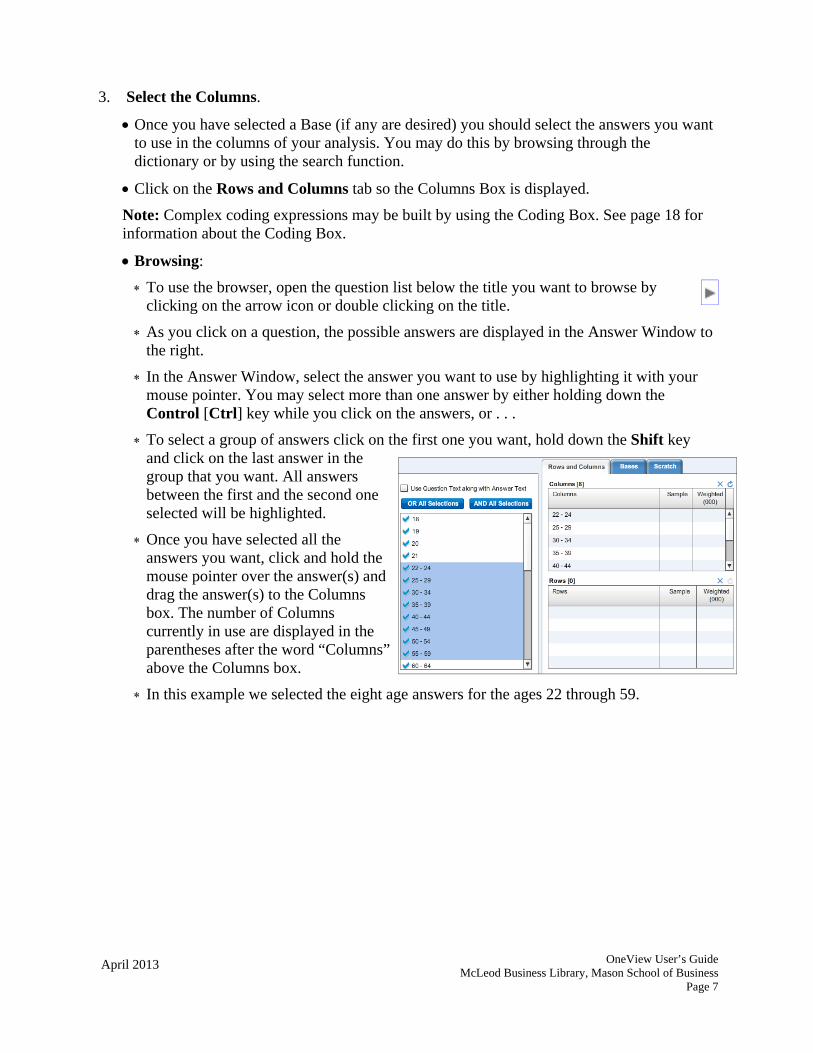
3. Select the Columns.
• Once you have selected a Base (if any are desired) you should select the answers you want to use in the columns of your analysis. You may do this by browsing through the dictionary or by using the search function.
• Click on the Rows and Columns tab so the Columns Box is displayed.
Note: Complex coding expressions may be built by using the Coding Box. See page 18 for information about the Coding Box.
• Browsing:
∗ To use the browser, open the question list below the title you want to browse by clicking on the arrow icon or double clicking on the title.
∗ As you click on a question, the possible answers are displayed in the Answer Window to the right.
∗ In the Answer Window, select the answer you want to use by highlighting it with your mouse pointer. You may select more than one answer by either holding down the Control [Ctrl] key while you click on the answers, or . . .
∗ To select a group of answers click on the first one you want, hold down the Shift key and click on the last answer in the group that you want. All answers between the first and the second one selected will be highlighted.
∗ Once you have selected all the answers you want, click and hold the mouse pointer over the answer(s) and drag the answer(s) to the Columns box. The number of Columns currently in use are displayed in the parentheses after the word “Columns” above the Columns box.
∗ In this example we selected the eight age answers for the ages 22 through 59.

OneView User’s Guide McLeod Business Library, Mason School of Business
Page 8
April 2013
• Search:
∗ To use the search function, click on the Search button above the Dictionary Window. This opens the search function box in the place of the Dictionary Window. (You may return to the Dictionary Window by clicking on the green arrow icon.) Type a search term into the Search data field. You also may select where the program searches for your term (Answers Only, Questions & Answers or All). In this example “shopping” has been entered.
∗ Click on the Search button and the results of the search will be displayed in the box below the search function. If your search term results in too broad a search you will receive a message that you have too many results and that you should refine your search.
∗ The items in the results box will be those with the search term included in the questions (or answers).
∗ Open the question list you want and select the answers you want by highlighting them and then move them to the Columns box by clicking and dragging the items with your mouse pointer.
4. Select the Rows:
• Once you have selected a filter (if any are desired) and the columns you should select the answers you want to use in the rows of your analysis. You may do this by browsing through the dictionary or by using the search function.
Note: Complex coding expressions may be built by using the Coding box. See page 18 for information about the Coding box.
• Click on the Rows and Columns tab so the Rows Box is displayed.
• Browsing:
∗ To use the browser, open the question list below the title you want to browse by clicking on the arrow icon or double clicking on the title.
∗ As you click on a question, the possible answers are displayed in the Answer Window to the right.
∗ In the Answer Window, select the answer you want to use by highlighting it with your mouse pointer. You may select more than one answer by either holding down the Control [Ctrl] key while you click on the answers, or . . .

OneView User’s Guide McLeod Business Library, Mason School of Business
Page 9
April 2013
∗ To select a group of answers click on the first one you want, hold down the Shift key and click on the last answer in the group that you want. All answers between the first and the second one selected will be highlighted.
∗ Once you have selected all the answers you want, click and hold the mouse pointer over the answer(s) and drag the answer(s) to the Rows box. The number of Rows currently in use are displayed in the parentheses after the word “Rows” above the Rows box.
∗ In this example we selected eight answers under Dining: Family Restaurants and Steak Houses: Family Restaurants Visit Most Often.
• Search:
∗ To use the search function, click on the Search button above the Dictionary Window. This opens the search function box in the place of the Dictionary Window. (You may return to the Dictionary Window by clicking on the green arrow icon.) Type a search term into the Search data field. You also may select where the program searches for your term (Answers Only, Questions & Answers or All).
∗ Click on the Search button and the results of the search will be displayed in the box below the search function. If your search term results in too broad a search you will receive a message that you have too many results and that you should refine your search.
∗ The items in the results box will be those with the search term included in the questions (or answers).
∗ Open the question list you want and select the answers you want by highlighting them and then move them to the Rows box by clicking and dragging the items with your mouse pointer.

OneView User’s Guide McLeod Business Library, Mason School of Business
Page 10
April 2013
5. Perform a Crosstab.
• Now that your data elements have been selected it is time to perform a function on that information.
• To run a Crosstab, click on the Run Crosstab button in the Edit pane Action Bar. Note that when the Columns and Rows boxes are populated all the buttons in the Action Bar are active. See page 11 for information about the Edit Pane Action Bar.
• The View pane of the Crosstab tab is opened when the processing is completed. See page 21 for information about the View pane (e.g., saving your data, changing the data displayed, etc.).
• For help interpreting the data, go to Interpreting OneView Data on page 26.
Note: This window has its own Action Bar allowing you to copy, export and perform other actions on the results display. If your results are lengthy, please save them to your removable media to use later.
6. To exit the View pane, click on the Edit bar. This will open the Edit pane where you may create another Crosstab. The existing crosstab will not be deleted. Any additional crosstabs will be listed in the Report List column on the left side of the View pane.
Report List View Selector
Results Window
Action Bar

OneView User’s Guide McLeod Business Library, Mason School of Business
Page 11
April 2013
Edit Pane The Edit pane is displayed when the OneView program is opened. You may use this pane to set up and run a Crosstab analysis. See page 5 for information about setting up a Crosstab analysis.
The Edit pane consists of six areas: the Action Bar (see below), Dictionary Window and Answer Win-dow (see page 14), Col-umns Box and Rows Box (this area also has tabs for Bases and Scratch) (see page 17), and the Coding Box (see box 18).
Action Bar The Action Bar area of the Edit pane has ten control buttons that allow you to perform functions on the Crosstab you are building. This area also lists the cur-rent study (e.g., Spring 2009 NCS Adult Survey 12-Month) that will be used for your analysis.
These buttons are Open, Export, Save, Clear, Import SPC, Export SPC, Study, Trend, Send To, and Run Crosstab. Some of these buttons are grayed out until you populate the Columns and Rows boxes with answer items.
Open The Open button allows you to open any saved files. Clicking on the button will open the Select Saved Crosstab window. This window has a list of any saved Crosstabs.
To open a saved Crosstab high-light the one you want to open. This will make the buttons at the bottom of the window active. Click on the Load button to open your selected Crosstab. Highlighted Crosstabs may be re-moved from the list by clicking on the Delete button.
The Load button will close the Select Saved Crosstab window and insert the criteria from the selected Crosstab into the Crosstab Editor pane.
Dictionary Window
Answer Window
Columns Box
Rows Box Coding Box
Action Bar

OneView User’s Guide McLeod Business Library, Mason School of Business
Page 12
April 2013
Save The Save button allows you to save a Crosstab you have created for use at a later time. You should name the Crosstab before you save it. Enter a name in to the Crosstab Name box near the top of the pane.
Clicking on the Save button will add your Crosstab to the list of saved Crosstabs.
Export The Export button will open the Choose Export Format window. This window gives you three choices of formats: Excel 2003/Mac Excel 2004, Excel 2007/Mac Excel 2008 and later, and CSV (comma separated values). The CSV is a file type that can also be opened by Excel but may have format-ting problems with cell placement.
Select the format you want by clicking on the radio button next to your choice. Then click on the Export but-ton.
The Crosstab will be run and the re-sults displayed in an Excel spread-sheet.
The spreadsheet pictured at right is of a Crosstab set up for restaurants vs. age. The format selected was Excel 2007/Mac Excel 2008 and later. The various cells are populated with data. See page 26 for information on inter-preting OneView data.
Clear The Clear button will remove any selections you have made and return the Edit pane to its blank starting display.
Import SPC The OneView program uses the Spec (.spc) format for its Crosstabs. The Import SPC button allows you to import a pre-viously constructed Crosstab. It will populate the columns, rows and bases boxes. It will not set the target study.
To import a Crosstab click on the Import SPC button. This will open a window where you select the location of the file to upload and then the file. Click on the file and then the Open button. This will populate the Edit pane boxes.
Export SPC The Export SPC button will create a file in .spc format. This will open a Save As window where you may select the location of the file and name the file.

OneView User’s Guide McLeod Business Library, Mason School of Business
Page 13
April 2013
Study The Study button allows you to select the study to use in the construction of your Crosstab. Clicking on the Study button will open the Select Current Study window. This window lists all the studies available.
If the list is long you may search for a study by entering a term into the Search box near the top of the window.
Select the study you want to use (most studies are available in six month or 12 month versions and most years had studies done in both Fall and Spring) by highlighting it with your mouse pointer. Then select whether you want the study weighted by population or household (the se-lections in the lower left corner of the window).
Note: A study may have two different “weights,” either Population or Household. The Popula-tion weight projects all respondents in the study to the total study population. Household projects respondents to total households in the study.
When finished selecting the study click on the OK button and the study will be loaded into the Edit pane.
This study will only by used during the current session. When you end the session the study will revert back to the default study (currently Spring 2009 NCS Adult Survey 12-Month: Pop-ulation).
Trend The Trend button is used to set up a Crosstab covering more than one study. This allows you to see if there is a trend over a course of time. See page 28 for information on setting up a Trend analysis.
Send To The Send To button will display a menu with four selections: Send to Corre-spondence, Send to Reach and Frequency, Send to MME, and Close. Send to Correspondence and Send to MME do not function because the Corre-spondence and MME are not included in the current subscription.
Send to Reach and Frequency will send the crosstab you have set up to the Reach and Fre-quency selection under the Plan tab. If the Crosstab you have created has more than one item in the columns box only the first one will be used in the Reach and Frequency. See page 31 for information about the Reach and Frequency function.
Close will close the menu.
Run Crosstab
The Run Crosstab button is used to run your analysis after you have finished setting up your Crosstab. The results are displayed in the View pane. See page 21 for information about the View pane.
If you choose to do a trend the Run Crosstab button changes to Run Trend after the Trend button is selected and the trend is set up. See page 28 for information about setting up a trend.

OneView User’s Guide McLeod Business Library, Mason School of Business
Page 14
April 2013
Dictionary Window and Answer Window The Dictionary Window and Answer Window work together to display the many survey ques-tion and answer selections available for your research.
All the questions used in the current survey (listed in the Action Bar) are included in the Dictionary Window.
The questions are grouped into topics. Each topic may be opened by clicking on the ar-row icon next to it or by double-clicking on the topic itself.
This will display more selec-tions. Each major topic usually has many sub-topics under it. These must be opened as well until you get to the actual ques-tions.
In the Dictionary Window pictured, the topics have been opened to display the selections under Lifestyle (Demographics). This displayed many more sub-topics. The Demographics (Personal Information) sub-topic was also opened displaying a long list of questions (i.e., Gender, Age, Race, etc.).
The answers included in the questions may be viewed by clicking on a question. The answers for the question “Education—Highest Level Completed” are pictured in the Answer Window above.
The answers are used to populate the Columns, Rows and Bases boxes. Answers may be select-ed one at a time, more than one by holding down the Control [Ctrl] key while clicking on the answers you want, or a range of answers by clicking on one answer and holding down the Shift key while selecting a second answer—all the answers between the first and second will be se-lected.
Selected answers are moved to the Columns, Rows and Bases boxes by clicking and dragging the selected answers to the desired box.
If you also wish to have the question displayed in the Columns, Rows or Bases boxes click on the Use Question Text String With Answer Text check box. Otherwise only the answer text will be displayed and could cause confusion if you do not remember in what context it was selected.
You also have the option to add answers using the AND or OR operators by clicking on the ap-propriate button above the Answer Window.
Answer Window Dictionary Window

OneView User’s Guide McLeod Business Library, Mason School of Business
Page 15
April 2013
Tabs
This area of the Crosstab Editor pane has three tabs and a search function. The tabs are Ques-tions, Definitions, and Recycle. The Questions tab is displayed when the pane first opens. It lists the questions included in the current study.
The Recycle tab displays all answers that have been removed (deleted) from the columns, rows or bases boxes. This way, if you had created a complex code to use in your analysis it wouldn’t be lost if you inadvertently deleted it.
The Definitions tab is used to store saved target Definitions. A Definition is used to store items that you use frequently. By placing them in the Definitions tab, you avoid having to re-code them or find them again in the dictionary. A Definition can be dragged and dropped onto the Columns Box, Rows Box, Bases Box, or Coding Box.
Definitions are contained inside folders. There are five types of definition folders:
Global Folder: These contain common targets that are available to everyone using OneView. They are provided by Experian Simmons and cannot be modified by end us-ers.
Non-Shared (all studies) Folder: Standard storage loca-tion for users.
Non-Shared (study specific) Folder: Folders created as Study Specific will only display when a particular study is set as the current study. When other studies are set as the current study in the crosstab editor, this folder does not display in the list.
Shared (all studies) Folder: Folder that is shared across an account.
Shared (study specific) Folder: Same as a Non-Shared (study specific) Folder plus it is shared across the account.
The Create, Edit, Duplicate and De-lete buttons are used on selected defi-nition folders. A folder is selected by clicking on it.
The Create button opens the New Definition window where you name the new folder and se-lect whether it is Shared or Non-shared.
The Edit button opens the Edit Definition window where you may change the name of a select-ed folder. This window also allows you to change whether the folder is Shared or Non-shared.

OneView User’s Guide McLeod Business Library, Mason School of Business
Page 16
April 2013
The Duplicate button opens the Add to Definition window. This window allows you to add the targets in the selected folder to another folder or to a new folder.
The Delete button allows you to remove the selected folder from the Definition list.
The Browse Shared button opens the Adopt Shared Defini-tion window. If any shared definitions are available they will be listed here. You may only view these folders. You cannot update them because only the original owner can make changes.
Step-by-step guide to using Definitions •Open the appropriate study. •Go to the Definitions tab. •Click on the Create Definition button. •Enter a name for the folder. •Select whether it is to be a shared or study specific folder •Click OK button •Go to the Questions tab and locate the items in the dictionary that you wish to store in Definitions.
•Highlight the items. •Right click the mouse and select Add to Definitions. •Select the Existing Definition radio button. •In the dropdown list, select the folder you created above.
To use items stored in a definitions folder:
•Go to the Definitions tab. •Open the desired folder. •Drag the items from the folder to the Rows, Columns, or Bases boxes.
Search
To perform a search in the Dictionary Window click on the Search button above the Dictionary Window. This will open the search function. You may return to the Dictionary Window by clicking on the Search button again. This forms a toggle action for moving back and forth between the Search function and the Dictionary Window.
You have the option to search for your key words in the Answers Only, Questions & Answers, or All. Click on the radio button next to your selection.
Enter a search term into the Search box and click on the Search button below the box.
The search function will find all instances of your search term in the Dictionary Window. The results will be displayed in the area below the search function.

OneView User’s Guide McLeod Business Library, Mason School of Business
Page 17
April 2013
The results are in the form of the Dictionary expandable ques-tion list from the Dictionary Window. However, only those questions that include your search term are included.
Clicking on a question will display the answers for that ques-tion in the Answer Window. The answers are then selected and moved to the Columns, Rows, and Bases Boxes as you would from the regular Dictionary/Answer Windows.
Columns and Rows Boxes The Columns and Rows area includes the Columns and Rows Boxes on the right side of the Edit pane. This area also has three tabs: Rows and Columns (the default display when the pane is first opened), Bases and Scratch.
The Rows and Columns Boxes in the Rows and Columns tab are used to build the Crosstab for your report. The answers from the Answer Window are inserted into these boxes. The answers will then become the column and row headers in the Crosstab report. Once you have the Columns and Rows Boxes populated click on the Run Crosstab button in the Action Bar to run your analysis. The Sample and Weighted columns are populated as items are placed into the boxes. The Sample is how many people gave that particular answer and the Weighted number is how many people in the general population to which that answer would apply.
There is an icon above each box allow you to delete all data in that box.
The Bases tab will display the Bases Box. This box is used to identify a base that you want to use for the universe for your Crosstab Analysis. Without a base the OneView program will use the entire adult population of the U.S. as its universe. It you want to limit this universe (i.e., only males or females, or specific age groups, or other characteristic) enter those answers into the Bases Box. The program will then perform the Crosstab Analysis using your selections as the universe. If more than one Base is used the View pane allows you to switch from one base selection to another. That is, the program performs an analysis for each base you select. If you use five bases there will be five analyses performed. See page 21 for information about the View pane.
The Scratch tab is used to combine answers into a com-bined count coding. To use this feature locate the answers you wish to combine and drag them into the Scratch Box.
When finished selecting answers, select them all, right click in the highlighted area and select Functions from the Content Menu (see page 20) that appears. This will open the Functions Window. Please go to page 36 for infor-mation about this window.

OneView User’s Guide McLeod Business Library, Mason School of Business
Page 18
April 2013
Coding Box The Coding Box near the bottom of the Edit pane is where you create a complex expression by combining answers using logic operators, numeric operators and comparison operators.
The Coding box consists of two boxes, Name and the work area box. The work area box is where you may build complex coding statements. The Name box is used to name the expression you construct. The buttons below the work area box become active once an expression is entered into the work area box.
Using the Coding Box To build a complex expression follow the steps below. In this example we will build an expression (or coding statement) that will include all males and females in the 25 to 44 age group. This expression could then be used as the Base (for example) to limit the universe of your analysis to all adults in these ages.
1. Open the Lifestyle (Demographics) and Demographics (Personal Information) topics of the question list in the Dictionary Window.
2. Select the Gender question so that the Male and Female answers appear in the Answer Win-dow.
3. Click and drag the Male answer to the Coding Box work area box. This will put the keyword MALE in the Coding Box.
4. Click and drag the Female answer to the Coding Box. Both Male and Fe-male are in the Coding Box work area box.
5. In the Dictionary Window, select Age from the question list so that the list of ages appears in the Answer Window.
6. In the Answer Window scroll down so that the 25-34 age group is visible. Click and drag it to the Coding Box. This will put the keyword AGE2534 in the Coding Box work area box.
7. In the Answer Window click and drag the 35-44 age group to the Coding Box. This will put the keyword AGE3544 in the Coding Box work area box.
8. You should now have the keywords MALE, FEMALE, AGE2534 and AGE3544 in the Coding Box work area box.
9. In the Work Area, place the cursor before the keyword MALE. Click on the “(” button to place an open parenthesis in front of the keyword.

OneView User’s Guide McLeod Business Library, Mason School of Business
Page 19
April 2013
10. Move the cursor to the space between the keywords MALE and FEMALE. Click on the Or button. This will place the logic operator OR between the two keywords.
11. Move the cursor to the end of the keyword FEMALE. Click on the “)” button to place a close parenthesis after the word FEMALE. This now completes the statement (MALE OR FEMALE).
12. Place the cursor in front of the keyword AGE2534. Click on the “(” button to place an open parenthesis in front of the keyword.
13. Move the cursor to the space between the keywords AGE2534 and AGE3544. Click on the Or button to place the logic operator OR between the keywords.
14. Move the cursor to the end of the keyword AGE3544. Click on the “)” button to place a close parenthesis behind the keyword. This now completes the statement (AGE2534 OR AGE3544).
15. Again move the cursor to the space between the two statements (between the “)” and “(” parentheses). Click on the And button to place the logic operator AND between the two statements.
16. This now completes the complex expression (MALE OR FEMALE) AND (AGE2534 OR AGE3544)
17. You should type a name for the expression in the Name box. “Age Expression” is used in this example.
18. Click on the Move to Bases button to move the expression into the Bases Box.
Coding Box Tool Bar The work area box is the larger box where complex codes can be created. There is a row of buttons above the box. They are: OR, AND, NOT, XOR, “+”, “-”, “x”, “÷”, “<“, “>“, “<“, “>“, “=“, “(“, and “)”; and a row below the box Move to Rows, Move to Columns, Move to Bases, Verify, Define, Clear, and Save.
The AND, OR, XOR, and NOT buttons represent Boolean logic operators (for definitions of these operators see page 42). You may either type these operators into the coding statement or click the appropriate button to have it inserted where the cursor is positioned in the work area box.
The ( and ) (parentheses) buttons allow you to insert parentheses into your coding statement. The use of parenthesis is described on page 42. You may either type these symbols into the coding statement or click the appropriate button to have it inserted where the cursor is positioned in the work area box.
The “+”, “-”, “x”, “÷”, “<“, “>“, “<“, “>“, and “=“ buttons allow you to insert numeric operators into the expression you are building. You may either type these symbols into the coding statement or click the appropriate button to have it inserted where the cursor is positioned in the work area box.

OneView User’s Guide McLeod Business Library, Mason School of Business
Page 20
April 2013
The Move to Rows, Move to Columns, and Move to Bases buttons will move the expression you have created to the selected box. The name you have given the expression will be displayed in the box.
The Verify button will check your expression to see if it is valid. If there is a problem the area of the expression in question will be dis-played in red. The expression pictured needs an operator (OR) between the two age statements.
The Define button will open the Expression Definition window with your complex code displayed.
The Clear button will remove all data from the Coding Box.
The Save button will open the Add to Definition window. This window al-lows you to save your expression as a new definition or add it to an existing definition. For a new defini-tion click on that radio button and enter a name for the definition and click the OK button. This will add the new definition to the Definition tab. See page 15 for information about the Definition tab.
You may only add the expression to another user cre-ated definition, one that is listed in the Definition tab. These will be on the drop-down menu once the radio button for the existing definition selection is selected.
Content Menu The Content Menu is displayed by right-clicking the mouse buttons while the mouse pointer is hovering over a particular area. The content menus for the various areas (i.e., Column Box, Coding Box, Dictionary Window, etc.) are similar in that they all have the same bottom section.
The bottom section has selections for various settings options. The settings for this program are already set for optimum perfor-mance and do not need to be adjusted.
Each area has selections that are specific for that area. The Dic-tionary Window only has a Print selection. This will print only that section of the Edit pane.
Select All Items will select all the items in that window or box. This selection is available for the Answer Window and the Col-umns/Rows/Bases/Scratch Boxes.
Delete Columns (Rows or Bases) will delete all items in that box.
Add to Definition will open the Add to Definition window. See above for information about his window. This will add the selected items to a new definition or an existing definition.
The Functions selection will open the Functions window. This window allows you to set up four different types of functions: Average, Count, Volume, and N-Tile. See page 36 for infor-mation about these functions.

OneView User’s Guide McLeod Business Library, Mason School of Business
Page 21
April 2013
View Pane The View pane is displayed when a Crosstab analysis has been run.
The View pane consists of four areas: the Report List (see below), Action Bar (see page 22), View Selector (see page 23), and Results Window (see page 24).
Report List The Report List area of the View pane is on the left side of the pane. This area of the pane lists all Crosstabs that have been done during the current session. The most recent analysis is listed first.
Each block on the list is an analysis. If you name an analysis the name is displayed at the top of the block. Each block tells you the number of Columns, Rows and Bases.
Clicking on a block will open the View pane for that analysis.
An analysis may be removed by clicking on the X icon in the upper right corner of the block.
View Selec-tor Report List
Results Window
Action Bar View Selector

OneView User’s Guide McLeod Business Library, Mason School of Business
Page 22
April 2013
Action Bar The Action Bar area of the View pane has four buttons, a box with a drop-down menu, six
check boxes, and the name of the Current Study.
The box has a drop-down menu with a list of Bases (if any were chosen). In the Action Bar pic-tured above the box shows “MALE” as the current base. Opening the menu will display other Bases.
The buttons are: Copy, Export, Highlight & Filter, and Quad Chart. These are described be-low:
Copy The Copy button will put the data in the data table into the Windows clipboard. With the data in the clipboard you may paste it into other programs such as Excel or Word. In Excel it will be formatted in columns and rows.
Export The Export button will open the Choose Export Format win-dow. This window gives you three choices of formats: Excel 2003/Mac Excel 2004, Excel 2007/Mac Excel 2008 and later, and CSV (comma separated values). The CSV is a file type that can also be opened by Excel but may have formatting problems with cell placement.
Select the format you want by clicking on the radio button next to your choice. Then click on the Export button.
The Crosstab will be run and the results displayed in an Excel spreadsheet.
Highlight & Filter The Highlight & Filter button will open the Cell Highlighting and Fil-tering window. This gives you the option to highlight cells according to criteria you select.
Select the element (e.g., Sample, Index, Weighted, etc.) by clicking on the appropriate button.
Select the function (Greater Than, Less Than or Range).
Enter a value into the Value box. The Range selection will display two boxes.
Select the action to take (highlight the text, cell or both; or remove matching cells), select the

OneView User’s Guide McLeod Business Library, Mason School of Business
Page 23
April 2013
color if needed, and click on the Add New Rule button. This will place the new rule in the High-light & Filter Rules box.
Click on OK when ready to execute your rule.
The Crosstab at right shows the results of a rule that specified an Index of greater than 105, text color red and cell color yellow.
See page 26 for information about interpreting OneView data.
Quad Chart The Quad Chart button will open the Quad Chart Viewer window.
This window displays the data in a Quad Chart. You have the option to change the data in the X and Y axes by selecting different data elements from the data field drop-down men-us above the chart.
The chart may be exported by click-ing on the Export button. The ex-port format is .png.
Data Element Check Boxes The data element check boxes to the right of the buttons allow you to specify which data elements you want displayed. For example, if you only wanted the Sample, Weighted and Index data displayed you would click on the check boxes for the Vertical %, Horizontal % and Total % elements. This would remove the checks from those boxes and the data for those elements would be removed from the table.
View Selector The View Selector area of the Crosstab Viewer pane has selections for Crosstab, Private Eye, and Trend. The Crosstab selection displays the results of your Crosstab Analysis in the Results window. This selection has all the Column and Row elements displayed in a single table.
Private Eye will display the table with one Column element at a time. See page 25 for information about the Private Eye display.
The Trend selection is only active if you had set up a trend analysis. See page 28 for infor-mation about the Trend Analysis and page 29 for information about the Trend Result pane.

OneView User’s Guide McLeod Business Library, Mason School of Business
Page 24
April 2013
Results Window The Results Window area of the View pane displays the results of your crosstab analysis.
Crosstab This is a table of columns and rows. All the items selected for the columns and rows (from the
Edit pane) will be displayed. The table will probably extend off the edges of the screen and the scroll bars at the bottom and right side may be used to see all the columns or rows. For help interpreting the data, go to Interpreting OneView Data on page 26.
The base used for the analysis (if any) is listed in the Action Bar. You may change the Base by selecting another element from the menu in the Action Bar.
Clicking on the arrows in the column headers will allow you to arrange the data in ascending or descending order according to the data element you select. Click on the arrow in the column you want to sort (the down (descending) arrow in the Total column is pictured). This displays a menu with the various data elements listed. Click on the element (e.g., index) with which you want to sort the data in the col-umn. The data in the table will be sorted according to the data in that column.

OneView User’s Guide McLeod Business Library, Mason School of Business
Page 25
April 2013
Private Eye This is a table of columns and rows. All the items selected for the rows will be displayed. However, only one “column” of information (data originally selected for the columns in your analysis) will be presented at a time. The name of the column of data being displayed is in the box in the table header (e.g., Total). The information originally displayed in the cells (e.g., index, sample, etc.) in the Crosstab will be spread out over a number of columns with the data elements as the column headings.
You may change the data being displayed to a different “column” by selecting an-other column heading from the drop-down menu.
You may page through the Crosstab columns of information by clicking on the bot-tom scrolling arrows. By clicking on these arrows you may go forward or back through the columns (e.g., Total, or age groups) to compare data.
Clicking on the arrows in the column headers will allow you to arrange the data in ascending or descending order. Click on the arrow in the column you want to sort. The data in the table will be sorted according to the data in that column.

OneView User’s Guide McLeod Business Library, Mason School of Business
Page 26
April 2013
Interpreting OneView Data
Above is a sample OneView View pane showing:
Spring 2009 NCS Adult Survey 12-month = The selected survey is the NCS Spring 2009 Full Year.
Population = The selected weight is the population.
MALE = The universe (Base) selected is the male population (e.g., Number of Males age 18+ in the continental U.S.). (Other Bases that were included in the analysis are accessed by using the drop-down menu for this box.)
Selected Elements:
Sample. The number of actual people in this study who meet the specifications of both the Row and the Column.
’(000). This number represents the total number of adults who meet the specifications of both the Row and the Column. The three 0s (000) should be added to the end of the number shown. These are the people in the general population that the survey is projected to represent.

OneView User’s Guide McLeod Business Library, Mason School of Business
Page 27
April 2013
Vertical % = Vertical percentage (or percent down). The number of people who have a given characteristic, expressed as a percentage, as defined by the Column heading. This cell repre-sents this percentage of the number of the total in this column.
Horizontal % = Horizontal percentage (or percentage across). The number of people who have a given characteristic, expressed as a percentage, as defined by the Row heading. This cell represents this percentage of the number of the total in this row.
Index. This number indicates the likelihood, compared to the total population, of meeting the specifications of both the Column and the Row. The base number for comparison is 100, which means the group is neither more nor less likely to meet the criteria defined by the Column and Row. A higher number means a higher likelihood.
Total % = Total percentage. The percentage of the Base that the cell represents.
A single asterisk (*) means that the projections are the result of 31 to 60 interviews. These pro-jections are not sufficiently reliable to be used safely alone and have been included for con-sistency only, to permit the combination of such breakdowns into larger groups without loss of information. If you receive data with one asterisk consider broadening your search.
Two asterisks (**) mean that the projections are the result of 30 or fewer interviews. The pro-jections are likely unstable and should be used with considerable caution.
Note that the program does not always label all results that meet the above criteria with a single or double asterisk. Even if a result is not tagged, if the number of interviews is rela-tively low the data should be used with caution.

OneView User’s Guide McLeod Business Library, Mason School of Business
Page 28
April 2013
Trend Analysis A Trend Analysis allows you to analyze multiple years of data in a single report. You may compare data on study to study changes.
Note: The number of studies available for analysis varies from time to time. If only one study is available, a trend analysis cannot be performed.
1. To perform a Trend Analysis, use the same procedures as in the Crosstab to set up the Bases, Columns and Rows. See page 5 for information on setting up a Crosstab.
2. Once you have data elements chosen, click on the Trend button in the Action Bar.
3. The Trend Over Multiple Studies window opens. Using this window you may select which surveys to use.
Highlight the survey you want to include by clicking on the survey in the left box. With a survey highlighted, click on the right arrow icon and that survey will be added to the list in the Trend Studies box. You may select as many studies as you need.
The studies are presented in the Trend Analysis in the order in which they are listed in the Trend Studies box. It is best to view them in chronological order so if the studies are not listed in order, you may rearrange them by removing them (click on the left arrow icon) and re-selecting them in the order you want. The current survey is listed in the Base Study box.
4. When you have selected all the surveys you want to use in your analysis, click on the OK button. The Run Crosstab button in the Action Bar then becomes the Run Trend button. Click on this button to run your Trend analysis.
5. The View pane is opened when the processing is completed.

OneView User’s Guide McLeod Business Library, Mason School of Business
Page 29
April 2013
Results Window The Results Window area of the View pane displays the results of your Trend analysis.
This is a table of columns and rows. The table will probably extend off the edges of the screen and the scroll bars at the bottom and right side may be used to see all the columns or rows. For help interpreting the data, go to Interpreting One-View Data on page 26.
The View Selector in the View pane indicates the various ways the Trend Analysis may be displayed. The Trend Analy-sis is displayed when the Crosstab Viewer pane is first opened.
Using the View Selector you have the option of viewing the standard Crosstab information. This will display a complete crosstab with all the data elements. The data in this Crosstab will be from the Base study, as listed in the Action Bar. Go to page 24 for information on reading the View pane.
You also have the option to view the data using the Private Eye form of the View pane. See page 25 for information about the Private Eye view.
The Trend table is displayed when the View pane (when a Trend Analysis is run) is first opened. The Base study is displayed in the Action Bar.
Each study you selected is given its own column. The rows are the same rows that you selected in the Crosstab Editor. Data for the columns you selected are displayed one at a time.
The box in the top of the table has a drop-down menu with the items from the Columns box. Clicking on a data element in the menu will change the figures in the table to repre-sent the information for that data element. The opening display is for the Total selection.
The box with a drop-down menu in the Action Bar allows you to change the Base. In the sample pictured there are selections for the Study Universe, Male and Fe-male. The Male and Female selections were the items chosen as Bases.

OneView User’s Guide McLeod Business Library, Mason School of Business
Page 30
April 2013
Quick Reports You also have the option to run a simplified report using one Target element and one Base ele-ment. This report is designed to give you a Demographic Profile of the two elements you select.
Click on Quick Reports in the menu bar for the Profile tab (this is the same tab that has the Crosstab selection). This will open the Edit pane.
This pane operates in a similar manner as the Edit pane for the Crosstab selec-tion but has fewer elements.
The study is listed in the Action Bar near the top of the page. You may se-lect a different study by clicking on the Study button.
To populate the Base and Target boxes, click on the Ed-it button. The Edit button in either section (Base or Tar-get) will open the same Expression Creator window. This window allows you to select elements for the Base and Target boxes.
The Dictionary and Answer windows in this window perform in a similar manner as the Dictionary and An-swer windows in the Edit pane for the Crosstab selec-tion. See page 14 for information about the Dictionary and Answer windows.
You must have an expression in the Coding Box be-fore it can be moved to the Base or Target boxes. You may use a simple expression or create a complex ex-pression. See page 18 for information about the Cod-ing Box.
Once you have an expression in the Coding Box (and have named it), click on the Use as Target or Use as Base button to move the expression to the Quick Re-port Edit pane.
Once you have the Base and Target boxes populated select the report you want to use from the selection pictured in the lower part of the Edit pane. The available reports are: Demographic Profile and Segmentation. The other reports are grayed out and are not available for this subscription.
When you have the Target and Base boxes populated and have selected a report type, click on the Run Analysis button. This will open the View pane.
The View pane gives you a one-page display of tables and charts of the demographic profile of the results.
Coding Box
Answer Window
Dictionary Window

OneView User’s Guide McLeod Business Library, Mason School of Business
Page 31
April 2013
Plan Tab The Plan tab has a menu bar with three selections: Geo Mapping (not included in the current subscription), Reach and Frequency (see below), and Simmons DataStream (not included in the current subscription).
Reach and Frequency A Reach and Frequency Analysis allows you to analyze the most effective way to reach a target audience via print media.
Reach and Frequency Edit Pane The Reach and Fre-quency Edit pane is accessed by click-ing on the Plan tab in the header and then on the Reach and Frequency selection in the menu bar.
This opens the Reach and Fre-quency Edit pane.
The current study is displayed in the Action Bar, which also has a Study button that will al-low you to change to a different study.
Below the Action Bar are the Dictionary and Answer Windows. These operate in a similar manner as the same windows in the Crosstab Edit pane. Please go to page 14 for information about the Dictionary and Answer Windows.
The Reach and Frequency Edit pane also has a Coding Box where you may create complex codes. See page 18 for information about the Coding Box.
To set up a Reach and Frequency analysis select the item from the Answer Window you want to use as a Base (if any). Only one item can be placed in the Base Window for a Reach and Fre-quency.
Next place an item from the Answer Window into the Target Window. Only one item may be placed into the Target window for a Reach and Frequency.
Note: Using the Coding Box to create a complex code to use in the Target Window allows you to refine the audience of your Reach and Frequency analysis.
Action Bar
Dictionary Window
Answer Window Target Window
Media Window
Coding Box
Base Window

OneView User’s Guide McLeod Business Library, Mason School of Business
Page 32
April 2013
Finally enter the print media (e.g., magazines) into which you are interested in inserting market-ing materials into the Print Media Window. These magazines would be those you identified as most used by your target audience during your Crosstab analyses.
Note: You must use the “Average Issue Audience (AIA)” category under the various types of media (e.g., magazines, newspapers, etc.). If you use one of the other selections (e.g., # of is-sues read 1 of 4) the Results Window will display zero reach for all schedule set ups.
Once you have data elements chosen, click on the Run Analysis button in the Action Bar.
Reach and Frequency View Pane This opens the Reach and Frequency View pane. This pane is di-vided into three sec-tions: the Action Bar with five buttons. The Settings Window where you set up your schedules, and the Re-sults Window where the results of your var-ious schedules are dis-played.
Settings Window To use the View pane you must first set up your parameters for the magazines and the schedules.
Enter dollar amounts for each magazine in the Cost column. This would be the cost for an advertisement (e.g., full page, four color; half page, four color; etc.) for that particular magazine.
Note: This information is available in the Standard Rate and Data Services publications in the Business Library reference section. Some of the publications available are:
Business Publication Advertising Source BUS. LIB. HF5905 .S723 Consumer Magazine Advertising Source BUS. LIB. HF5905 .S725
The Business Library also has the SRDS in electronic format through the Business Li-brary Databases server.
You also have to enter the number of insertions for each magazine (number of times you are placing an advertisement during your advertising campaign) in the Schedule columns.
You may set up a number of schedules to see how the reach and gross impressions compare.
Action Bar
Results Window
Settings Window

OneView User’s Guide McLeod Business Library, Mason School of Business
Page 33
April 2013
The Optimize button at the top of each Schedule column opens a window where you may let the program set up the best schedule based on the criteria you select. You may target the reach by maximum budget (enter a number into the box) or by percentage (enter a number into that box). Next enter the maximum number of insertions (per magazine) in your cam-paign. The Advanced button opens the Schedule 4 window where you may select minimum and maximum insertions for each magazine. Click on the OK button to accept your selections and return to the Optimize window.
When finished click on the Run Optimize button. This will populate the cells in that Schedule column in both the Set-tings Window and the Results Window.
If you have set up a schedule manually click on the Run Schedules button in the Action Bar. This will populate the data boxes in the Results Window. If you had a manually set up schedule but had not run the schedule, using the Optimize button in one column will run the schedules in all columns.
Results Window Once you have run your schedules the data cells in the Results Win-dow are populated in each sched-ule column you have entered in-sertion data.
The data cells may be interpreted using the following information:
Reach (000): The number of people exposed to at least one issue in a schedule. Three 000s are added to the number (following the decimal point, if present).
Reach (%): The percentage of people exposed to at least one issue in a schedule.
Gross Impressions: This is the total opportunities to see the campaign or schedule. (Reach multiplied by the average frequency.)
Average Frequency: The average number of issues read by each person in the target market.
Duplication: This compares the Reach of the schedule with the Gross Impressions. Therefore, if the Reach was 600 and the Gross Impressions were 900 then the duplication would be 33% (e.g., Gross Impressions minus Reach, divided by Gross Impressions).
GRPs: Gross Rating Points. These are the Gross Impressions expressed as a percentage of the target market. Therefore, if the Gross Impressions are 600 and the population of the target is 1200, then the GRPs are 50.

OneView User’s Guide McLeod Business Library, Mason School of Business
Page 34
April 2013
Total Insertions: Sum of the insertions for each magazine.
Total Cost: The cost for each insertion in each issue for all magazines.
CPM: Whether this is the Cost Per Thousand Reach or the Cost Per Thousand Gross Impressions, it is the total cost of the schedule divided by either the Reach or the Gross Impressions expressed in Thousands.
Reach 2+ to Reach 13+: (In a Reach and Frequency.) People exposed to at least 2, 3, 4 . . . 13 titles in the schedule. (i.e., 3+ is 3 or more.)
You may assess the effectiveness of each schedule by comparing the data in the Results Win-dow. For instance, you can compare the Reach, Total Cost, and CPM for each schedule to see if a lower cost will reach the same (or nearly the same) number of people.
Action Bar The Action Bar has five buttons: Run Schedules, Save Table, Load Table, Clear All, and Clear Calcs. The Action Bar also displays the current study and information about the Target and Base used in the analysis. The Sample size and the Weight for this analysis is included.
The Run Schedules button will run computations on the schedules you create and populate the data cells in the Results Window below the Schedule columns.
The Clear All button will clear all data you have entered from the Reach and Frequency View-er pane.
The Clear Calcs button will clear all data from the Results Window.
The Load Table button will open a window where you may specify a previously saved Reach and Frequency table to load into the current pane.
The Save Table button will open a window where you may name the file and direct where to save it. The table will be saved in .RFX format. You may save the file to your removable media for use in a future session.
OneView User’s Guide McLeod Business Library, Mason School of Business
Page 35
April 2013
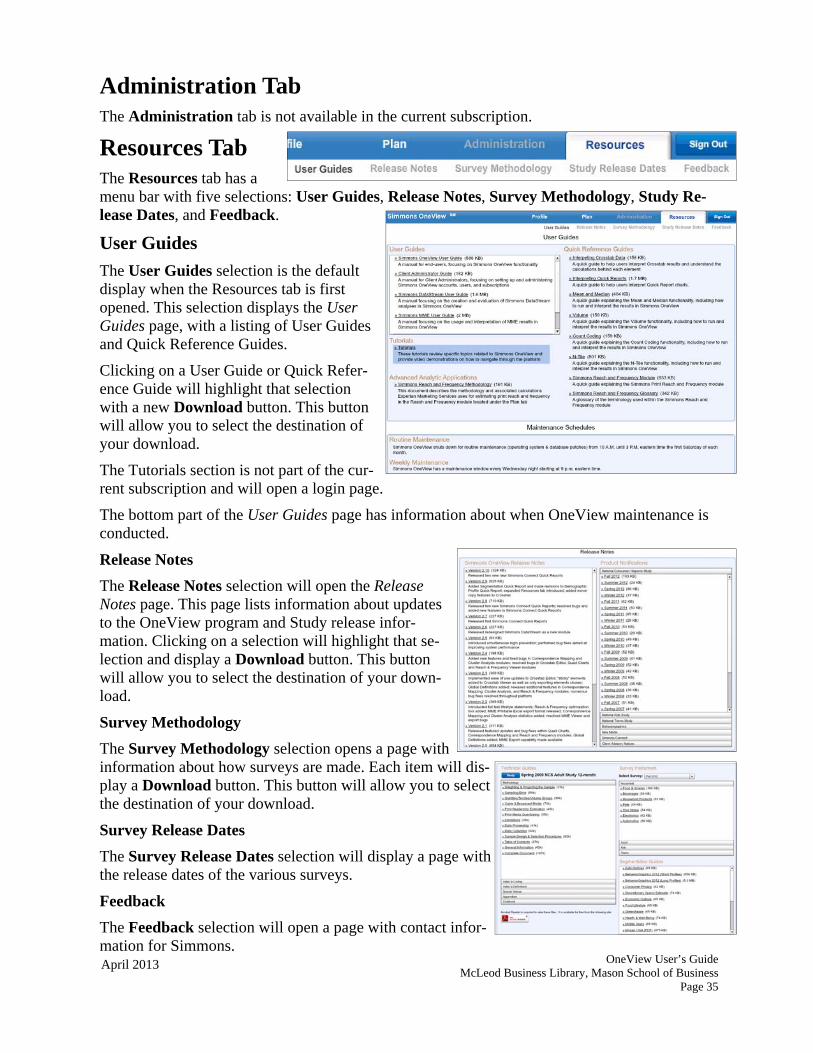
Administration Tab The Administration tab is not available in the current subscription.
Resources Tab The Resources tab has a menu bar with five selections: User Guides, Release Notes, Survey Methodology, Study Re-lease Dates, and Feedback.
User Guides The User Guides selection is the default display when the Resources tab is first opened. This selection displays the User Guides page, with a listing of User Guides and Quick Reference Guides.
Clicking on a User Guide or Quick Refer-ence Guide will highlight that selection with a new Download button. This button will allow you to select the destination of your download.
The Tutorials section is not part of the cur-rent subscription and will open a login page.
The bottom part of the User Guides page has information about when OneView maintenance is conducted.
Release Notes The Release Notes selection will open the Release Notes page. This page lists information about updates to the OneView program and Study release infor-mation. Clicking on a selection will highlight that se-lection and display a Download button. This button will allow you to select the destination of your down-load.
Survey Methodology The Survey Methodology selection opens a page with information about how surveys are made. Each item will dis-play a Download button. This button will allow you to select the destination of your download.
Survey Release Dates The Survey Release Dates selection will display a page with the release dates of the various surveys.
Feedback The Feedback selection will open a page with contact infor-mation for Simmons.

OneView User’s Guide McLeod Business Library, Mason School of Business
Page 36
April 2013
Functions Window The OneView database has four types of built-in functions. These are: Average, Count, Volume and N-Tile. These functions are accessed via a pop-up menu.
To open the menu, highlight a selection of answers in the Answer Window then right-click on the highlighted items. In the Content menu that appears click on the Functions selection.
This will open the Functions window.
This window has four tabs: Average (see be-low), Count (see page 37), Volume (see page 38), and N-Tile (see page 39).
Average Tab The Average tab enables you to work out average values in a Crosstab.
To use this function first select some answers in the Answer Window. The example pictured shows the answers for the ques-tion: State Lottery, number of times bought tickets last 12 months.
With Mean selected at the right and the Exclude Zeros check box checked the program includes all users of a product or service (e.g., lottery tickets), it excludes non-users.
The MidPoint column shows the mean score used for each level of consumption, which is used in the calculation of averages.
Enter a name for your function into the Title box. You then may move the function to the Cod-ing Box where you may combine it with other items to make a complex expression. The Move to Coding Box button will move the function to the Coding Box, replacing any code that may already be there.
The Append to Coding box button will move the function to the Coding Box, adding it to any code that may already be there.
The Move to Columns and Move to Rows buttons will move the function to the desired Col-umns or Rows Boxes. The function may then be used in a Crosstab analysis.
The Save to Definitions button will save the function to the Definitions tab. It will be included in the list of definitions in that tab. See page 15 for information about the Definition tab.
The Median selection would determine the middle number of lottery tickets purchased. This function is set up the same as the Mean.

OneView User’s Guide McLeod Business Library, Mason School of Business
Page 37
April 2013
Count Tab The Count tab enables you to count the number of respondents who fall into at least several categories from a defined list. Examples would be:
Respondents to the survey who agree with between 4 and 8 lifestyle statements out of a list of 12.
Respondents to the survey who read at least 3 magazines from the designated list.
To set up a count command you must first select the items to be counted. This may be done from either the Answer Window list or from a list of items in the Columns Box or Rows Box.
In the example pictured twelve items were selected from the list of answers to the attitude/opinion question of whether the interviewee agrees with the statements.
The table in this tab displays data pertinent to your count function. It shows the frequency distribution for your selected items. The columns in this box are:
Count – The number of items a respondent appears in. Frequency – A weighted figure for how many respondents fall into count items. Cumulative Frequency Ascending – Cumulative frequency in ascending order. Cumulative Frequency Descending – Cumulative frequency in descending order.
To use this function first select items in the Answer Window (or Columns/Rows Boxes).
The Lower Bound data field allows you to select the lower limit of your count (e.g., the “4” in the first example above).
The Upper Bound data field allows you to select the upper limit of your count (e.g., the “8” in the first example above).
Enter a name for your function into the Title box. You then may move the function to the Cod-ing Box where you may combine it with other items to make a complex expression. The Move to Coding Box button will move the function to the Coding Box, replacing any code that may already be there.
The Append to Coding box button will move the function to the Coding Box, adding it to any code that may already be there.
The Move to Columns and Move to Rows buttons will move the function to the desired Col-umns or Rows Boxes. The function may then be used in a Crosstab analysis.
The Save to Definitions button will save the function to the Definitions tab. It will be included in the list of definitions in that tab. See page 15 for information about the Definition tab.

OneView User’s Guide McLeod Business Library, Mason School of Business
Page 38
April 2013
Volume Tab The Volume tab enables you to measure consumption of a product or service. OneView allows you to analyze such products in volume units rather than just usage. For example, a question on the frequency of the purchase of state lottery tickets (from the 2009 survey) is pictured.
These can be analyzed by usage (e.g., how many users) but mid-point values
can also be attributed for each of the frequency answers and calculate both total volume and average volume.
Using the lottery as an example you can define a medium lottery player and then find both the total number of medium users and the volume of lottery tickets bought by these medium users.
Total Users
To find the total users select “State Lottery – # Times Bought Tickets Last 12 Months” from the question list and then select the answers to be included for a medium user. (e.g., Once a Week and 2 or 3 Times a Month)
Next click and drag the selections to the Coding Box using OR as a connector. Type a name (e.g., Total Medium Users) into the Coding Box’s Name box. Then click on the Move to Columns button.
Volume
For the volume, again select “State Lottery – # Times Bought Tickets Last 12 Months” from the question list and then select the answers to be included for a medium user.
Then right-click on the highlighted answers and select Functions from the Content menu. This will open the Functions window.
In the Functions window:
Click on the Volume tab.
Type a name in the Title box (e.g., Volume Medium Users).
Click on the Move to Columns button.

OneView User’s Guide McLeod Business Library, Mason School of Business
Page 39
April 2013
In the Edit pane, click on the Run Crosstab button in the Action Bar.
This will open the results of the analy-sis in the View pane.
In the Total Medium Users column the Weighted number shows that 33,136,000 medium users bought lot-tery tickets. The Volume Medium Us-ers column Weighted number shows that these 33,136,000 users bought 103,659,000 tickets.
The buttons in the Volume tab perform the following functions:
The Move to Coding Box button will move the function to the Coding Box, replacing any code that may already be there.
The Append to Coding box button will move the function to the Coding Box, adding it to any code that may already be there.
The Move to Columns and Move to Rows buttons will move the function to the desired Col-umns or Rows Boxes. The function may then be used in a Crosstab analysis.
The Save to Definitions button will save the function to the Definitions tab. It will be included in the list of definitions in that tab. See page 15 for information about the Definition tab.
N-Tile Tab The N-Tile tab enables you to perform the an n-tile ana-lytic function on a list of items.
After selecting items in the Answer Window of the Edit pane right click on the items and select Functions from the content menu.
In the Functions window select the N-Tile tab. The items you selected will be displayed in the tab’s table.
An n-tile is an analytic function that divides an ordered data set into a number of groups. The Number of Groups box-es allow you to select how the list is divided. You also select whether to use the sample or weighted figures.
When finished you may move the data to the Edit pane using the buttons. These buttons per-form the same function as those in the other tabs. See page 36 for information about these but-tons.

OneView User’s Guide McLeod Business Library, Mason School of Business
Page 40
April 2013
Definitions General (000): The projected number of people in the population. Three 000s are added to the number (following the decimal point, if present).
Average Frequency: (In a Reach and Frequency.) The average number of issues read by each person in the target market.
Base %: The percentage of the currently selected base that the specific cell represents.
Columns: For the basic Crosstab, this information will appear vertically on the page.
Cost: Most commonly used for print titles as the rows. This cost can be any number but usually represents a single insertion in the publication.
CPM: Cost Per Thousand. This is only applicable when costs have been entered. This number represents the cost per thousand people reached by the given row, column and base.
CPM: (In a Reach and Frequency.) Whether this is the Cost Per Thousand Reach or the Cost Per Thousand Gross Impressions, it is the total cost of the schedule divided by either the Reach or the Gross Impressions expressed in Thousands.
Duplication: (In a Reach and Frequency.) This compares the Reach of the schedule with the Gross Impressions. Therefore, if the Reach was 600 and the Gross Impressions were 900 then the duplication would be 33% (e.g., Gross Impressions minus Reach, divided by Gross Impressions).
Base: A Base is the universe of the report. If no base is selected OneView defaults to the universe of the study. For the NCS the default universe is all adults 18+ in the 48 continuous states.
Gross Impressions: (In a Reach and Frequency.) This is the total opportunities to see the campaign or schedule. (Reach multiplied by the average frequency.)
GRPs: (In a Reach and Frequency.) Gross Rating Points. These are the Gross Impressions expressed as a percentage of the target market. Therefore, if the Gross Impressions are 600 and the population of the target is 1200, then the GRPs are 50.
Horizontal %: The row percentage. The percentage of the corresponding row total that the specific cell represents (based on weighted counts).
Index: An indication of how the weighted numbers in the cell differ from expected within the specified filter. An index of 100 corresponds to the average (or no difference); an index of greater than 100 indicates higher than average and an index of less than 100 indicates lower than average.
Projected Counts (000): The representative number of people after sample-balancing has been applied to the raw sample counts. Often this number is also projected to the known universe such as the total population. Also referred to as weighted counts.
Reach (000): (In a Reach and Frequency.) The number of people exposed to at least one issue in a schedule. Three 000s are added to the number (following the decimal point, if present).

OneView User’s Guide McLeod Business Library, Mason School of Business
Page 41
April 2013
Reach 2+ to Reach 13+: (In a Reach and Frequency.) People exposed to at least 2, 3, 4 . . . 13 titles in the schedule. (e.g., 3+ is 3 or more.)
Rows: Information selected as rows will appear horizontally in reports. Media MUST be selected as Rows when you are performing the Reach & Frequency function.
Recycle: Items deleted from the Bases, Columns, Rows, or Scratch areas are moved into the Recycle area. Items may be retrieved from the Recycle area if needed.
Sample Size: The number of respondents actually interviewed. Also referred to as unweighted counts, sample counts or respondents.
Scheduled Insertions: (In a Reach and Frequency.) The total number of insertions in the schedule.
Scratch: This is a holding area for data. It will NOT appear in any printed report. You may place items in Scratch to use them at a later time.
Total Cost: (In a Reach and Frequency.) The total cost of advertising of a particular schedule.
Vertical %: The column percentage. The percentage of the corresponding column total that the specific cell represents (based on weighted counts).

OneView User’s Guide McLeod Business Library, Mason School of Business
Page 42
April 2013
Logical Operators Logical operators are used in OneView to combine pieces of data to create a complex target. There are four types of logical operators used in OneView. Each of the areas where logical operators are used has buttons to insert these operators into the target. The logical operators are:
And Condition One and Condition Two MUST be satisfied for inclusion. AND is used where the user wants to restrict a definition to a certain group (i.e., men aged 18-24 would be constructed as MALE AND AGED 18-24).
Or At least one condition MUST be satisfied. If a respondent meets both conditions it is only counted once to avoid duplicating the audience. OR is used where the user wants to broaden a definition to include two or more answers (i.e., any user of Nestea, Tetly or Lipton would be constructed as NESTEA OR TETLY OR LIPTON).
Not Condition One and NOT Condition Two MUST be satisfied. If a respondent satisfies both conditions it will not be included. NOT is used to exclude a certain group (i.e., females who do not watch Ally McBeal would be constructed as FEMALE NOT ALLY MCBEAL).
Xor Condition One or Condition Two but not Both must be satisfied. If a respondent satisfies both conditions it will not be included. XOR stands for “Exclusive OR” and is used when looking at members of one group or another but not both (i.e., eat Total or Wheaties, but not both would be constructed as TOTAL XOR WHEATIES).
Use of Parentheses OneView reads complex coding from the left to the right. If you are creating a statement that contains more than one type of logical operator parenthesis must be utilized. Parentheses will indicate to OneView how to calculate any given coding statement. The system combines the answers within the parentheses first (collapsing them into a new variable or answer) and then combines it with everything outside the parentheses.
To create a definition of “Men with a household income of $30,000+ who read either Sports Illustrated or GQ”. You might use the following logic statement:
Q1 and Q2 and Q3 or Q4, where Q1 = Men
Q2 = House hold income of $30,000+
Q3 = Sports Illustrated
Q4 = GQ
However, Choices 3 interprets this as “Men with a household income of $30,000+ who read Sports Illustrated or ANYONE (including women or men with house hold income of less than $30,000) who read GQ.
The correct statement to use would be: Q1 and Q2 and (Q3 or Q4)