OneHealth Tool Start- up Manual - Avenir...
61
OneHealth User MANUAL iii OneHealth Tool Start- up Manual A Computer Program for Making Informed Health Programming Decisions
Transcript of OneHealth Tool Start- up Manual - Avenir...
OneHealth User MANUAL
iii
OneHealth Tool Start-
up Manual A Computer Program for Making
Informed Health Programming Decisions

ONEHEALTH Start up MANUAL (February 2016)
iv

OneHealth Start-up Manual (February 2016)
v
One Health Start-up
Manual A Computer Program for Making
Informed Health Programming Decisions
February 2016

ONEHEALTH Start up MANUAL (February 2016)
vi
The development of the OneHealth software and manual was supported by the World Health
Organization, the Global Workforce Health Alliance, UNFPA, UNICEF, the Health Metrics Network
and The Global Fund to fight AIDS, Tuberculosis and Malaria. It was prepared by Shetal Datta and Bill
Winfrey of Futures Institute in 2011, and has been updated by Nadia Carvalho of Avenir Health
(formerly Futures Institute) in 2015. Overall technical guidance on the development of the OneHealth
tool is provided by the United Nations Inter Agency Working Group on Costing. The views expressed
in this publication do not necessarily reflect the views of the funding organizations.

OneHealth User MANUAL
iii
TABLE OF CONTENTS
INTRODUCTION .................................................................................................................. 5
BASIC STEPS IN INSTALLING AND USING ONEHEALTH .................................................. 6
Step 1: Obtain software ................................................................................................................ 6
Step 2: Install OneHealth ............................................................................................................ 6
Step 3: Launch Spectrum ............................................................................................................ 7
Step 4: Ensure that you are in OneHealth mode ....................................................................... 8
Step 5: Create a new projection. ................................................................................................. 9
Step 6: Open an existing projection. ........................................................................................ 13
NAVIGATING ONEHEALTH ................................................................................................ 16
Icon Groups, Icons, Ribbons and Menus ..................................................................................... 16
Right click functions ..................................................................................................................... 16
Copying from Windows applications into OneHealth .................................................................17
Technical assistance .......................................................................................................................17
MODULES AND FEATURES OF ONEHEALTH .................................................................... 19
Programme costing or delivery channel costing ......................................................................... 19
Intervention coverages ................................................................................................................. 19
Bottleneck review .......................................................................................................................... 19
Human resources .......................................................................................................................... 20
Infrastructure ................................................................................................................................ 20
Logistics ......................................................................................................................................... 21
Health financing ............................................................................................................................ 21
Health information systems ......................................................................................................... 22
Governance .................................................................................................................................... 22
SPECIAL TOPICS ................................................................................................................ 23
Creating comparison scenarios .................................................................................................... 23
Opening multiple scenarios .......................................................................................................... 23
Sharing scenarios .................................................................... Error! Bookmark not defined.
December
2007
December
2007
ONEHEALTH Start up MANUAL (February 2016)
iv
Viewing results side by side (Using the “Group” function) ........................................................ 23
Equity Analysis ........................................................................ Error! Bookmark not defined.
Creating a sub-national projection............................................................................................... 27
Installing and running OneHealth on a Mac/Apple computer .................................................. 43
TROUBLE SHOOTING ........................................................................................................ 44
OneHealth modules cannot be activated ..................................................................................... 44
TB deaths averted are not being reported ................................................................................... 45
Zero services are reported for an intervention ............................................................................ 46
Zero costs are reported for an intervention ................................................................................. 47
Unusually large costs or unusually large number of services are reported for an intervention47
APPENDIX: COUNTRIES WITH DEFAULT DATA .............................................................. 48
APPENDIX: POPULATION AND COVERAGE CONCEPTS .................................................. 55
OneHealth Start-up Manual (February 2016)
5
INTRODUCTION
OneHealth is a tool that can be used to inform the development of strategic plans for health sector
planning. The software was developed to respond to country requests for a single tool which reflects the
best aspects of the existing tools. The OneHealth tool provides a unified framework to strengthen integrated
planning. OneHealth is a single mechanism to be used for supporting the planning, costing and budgeting
of health sector priorities, including health system strengthening strategies. As such it represents a modular
instrument for program-specific and sector-wide applications. The tool illustrates the health system
implications of scaling up intervention delivery, shows the capital investment gap and allows a comparison
of costs with the estimated financial resources available. In this manner, the tool facilitates scenario
generation and informs priority setting processes. The identification of impediments to intervention scale-
up emphasizes the need to strengthen systems for sustainable long term planning.
The tool facilitates an assessment of costs related to the areas of maternal, newborn and reproductive
health, child health, vaccination, malaria, tuberculosis, HIV/AIDS, nutrition, and water sanitation and
hygiene, to inform progress towards the Millennium Development Goals, including assessment of
achievable health impact. In addition it contains modules for the areas of human resources, infrastructure,
logistics, financial space, programme and channel analysis, intervention coverage and costing, bottleneck
analysis, programme costing, summary outputs and budgeting.
Potentially, OneHealth has a multiplicity of users. At the most comprehensive, health planners putting
together a multi-year health plan can use the tool to create a costed plan for addressing critical health needs
in a country; to compare different scenarios for reaching the identified health sector priority goals. This
could be as part of a national strategic health planning exercise or as a part of a proposal to a multi-lateral
funding organization. At a simpler level, disease area planners can use the programme planning modules
to develop plans addressing their particular needs with reference to health systems as appropriate.
Similarly, health systems planners can use the systems modules to make medium and long range plans for
Human Resources, Infrastructure, Logistics, etc. as appropriate. The added value of OneHealth is generated
when multiple modules are used at the same time, to identify synergies and to ensure that planning
processes take into account systemic constraints.
The purpose of this manual is to guide the user through a step-by-step process of downloading and getting
started with the OneHealth tool. It is not meant to be comprehensive. After the user is launched into the
tool, Help screens that will guide and inform the user as s/he implements the tool.
OneHealth is a work in progress that is continuously adapting to meet the needs of countries and health
organizations. The user is advised to check back on the Avenir Health website periodically for released
newer versions of OneHealth software and the OneHealth Start-up Guide. A technical manual will also be
made available through the website. As of November 2, 2011, OneHealth included complete modules for
programme-specific analysis and costing, delivery channel analysis and costing, human resources, logistics,
infrastructure, governance, health information systems, health financing, financial space and budgeting.
ONEHEALTH Start up MANUAL (February 2016)
6
BASIC STEPS IN INSTALLING AND USING
ONEHEALTH
This section provides instructions for downloading and installing the OneHealth tool as well as creating a
projection. The user is also encouraged to explore other parts of OneHealth and SPECTRUM to become
familiar with the full array of features and options.
Step 1: Obtain software
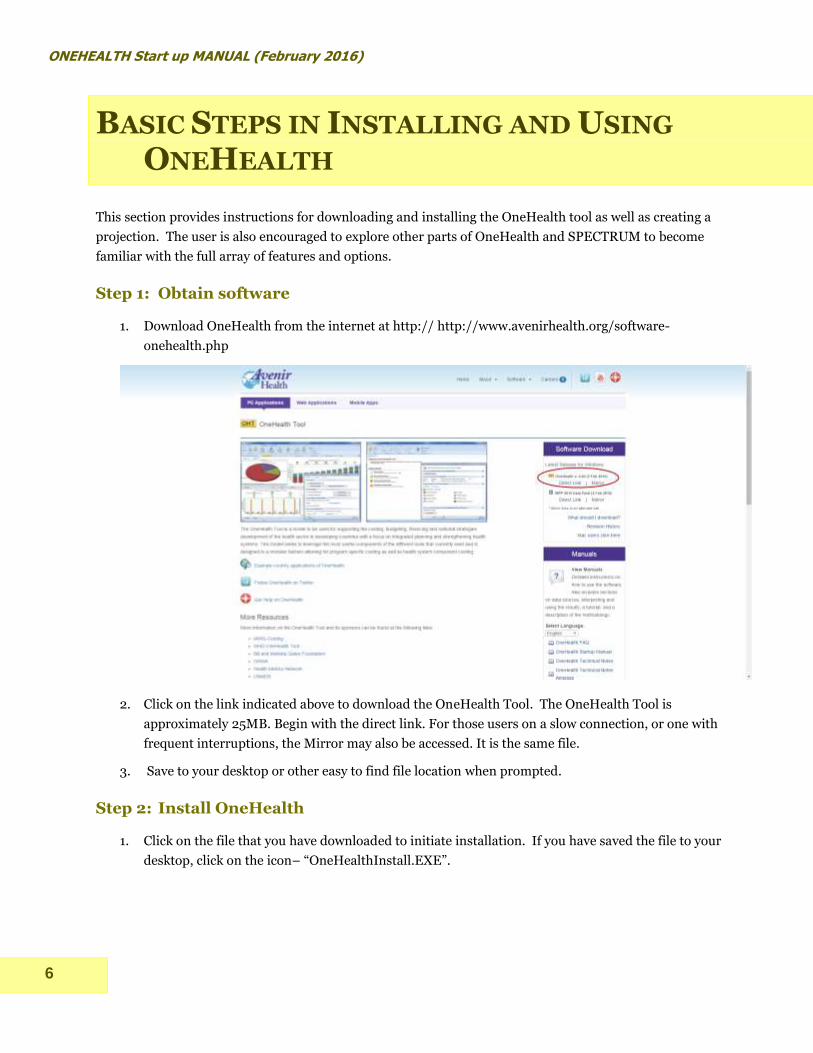
1. Download OneHealth from the internet at http:// http://www.avenirhealth.org/software-
onehealth.php
2. Click on the link indicated above to download the OneHealth Tool. The OneHealth Tool is
approximately 25MB. Begin with the direct link. For those users on a slow connection, or one with
frequent interruptions, the Mirror may also be accessed. It is the same file.
3. Save to your desktop or other easy to find file location when prompted.
Step 2: Install OneHealth
1. Click on the file that you have downloaded to initiate installation. If you have saved the file to your
desktop, click on the icon– “OneHealthInstall.EXE”.

OneHealth Start-up Manual (February 2016)
7
2. Click next at all of the prompts and click finish at the end when OneHealth is installed.
Step 3: Launch the OneHealth Tool
1. Click the Start menu from the bottom left hand corner of screen. From the “All programs” menu
item, find OneHealth, and click on the OHT icon.
Note to previous users of SPECTRUM: OneHealth is programmed within the SPECTRUM suite of health
policy tools. If you have previously used SPECTRUM1, OneHealth may need to be launched from the
SPECTRUM icon of a previously installed version.
1Among its various tools SPECTRUM includes DemProj, FamPlan, AIM and Goals.
ONEHEALTH Start up MANUAL (February 2016)
8
Step 4: Ensure that you are in OneHealth mode
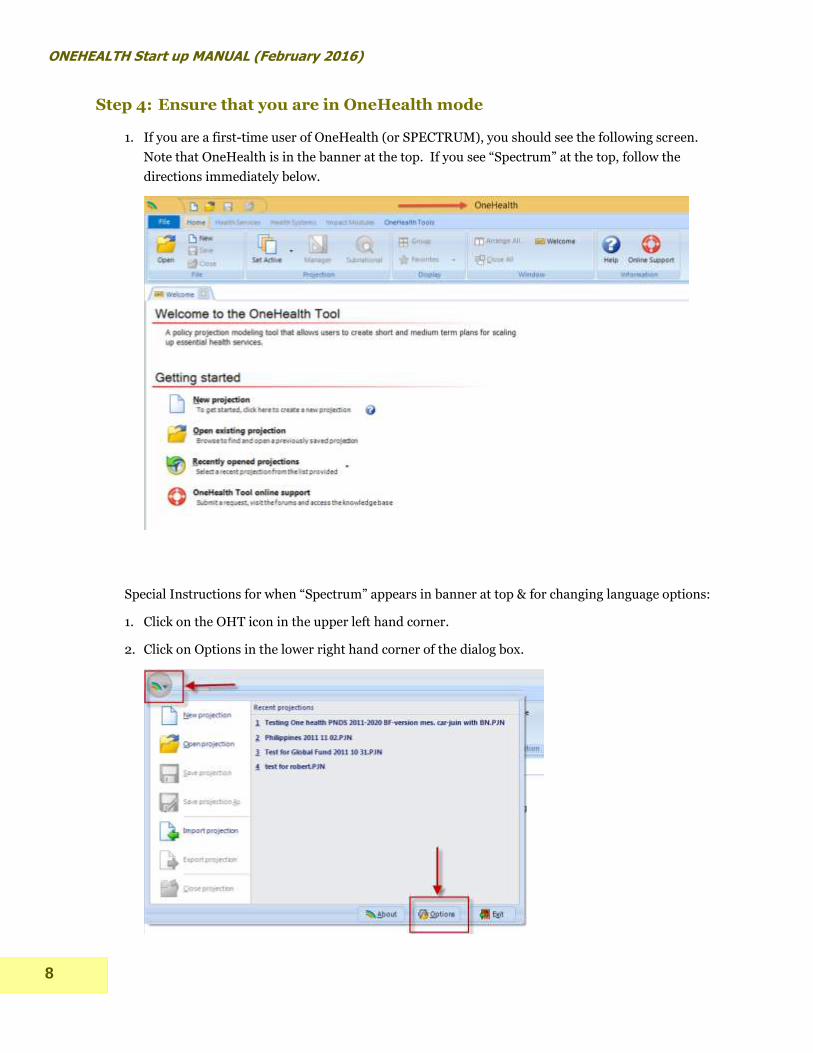
1. If you are a first-time user of OneHealth (or SPECTRUM), you should see the following screen.
Note that OneHealth is in the banner at the top. If you see “Spectrum” at the top, follow the
directions immediately below.
Special Instructions for when “Spectrum” appears in banner at top & for changing language options:
1. Click on the OHT icon in the upper left hand corner.
2. Click on Options in the lower right hand corner of the dialog box.

OneHealth Start-up Manual (February 2016)
9
3. Assure that “Enable OneHealth Layout” is checked.
4. Note that you may also change language settings in this dialog box. As of January 15, 2015, partial
translations of the tool have been made for French, Spanish, Russian, Portuguese, and Chinese.
The other languages indicated may be clicked but translations will be visible only for other features
of SPECTRUM.
5. Click OK to return to the Welcome screen. Note that at any time you may re-show the Welcome
Screen by clicking on the OHT icon with the word “Welcome” next to it.
Step 5: Create a new projection.
1. Click on the item “New Projection” in the Welcome screen. You should see the following dialog
screen.

ONEHEALTH Start up MANUAL (February 2016)
10
2. Click on “Projection file name” to create a name for your projection. Locate the projection in a
folder where you can easily find it.
The basic unit of analysis for OneHealth is the projection. As many as ten projections may be open in a
single session of OneHealth. Different projections can be built from a basic projection to analyze
the cost and impact implications of different health scale up plans. As a general rule, we
recommend that the user first create a “Base” scenario which includes all of the basic set up for the
health system and programmes. We then recommend that the user replicate this Base scenario to
build different visions of the future.
OneHealth Start-up Manual (February 2016)
11
3. Click on the “? Help” next to the years to inform your decision about the First Year, Final Year and
Timeframe for health system analysis.
4. Leave all modules checked on as shown.
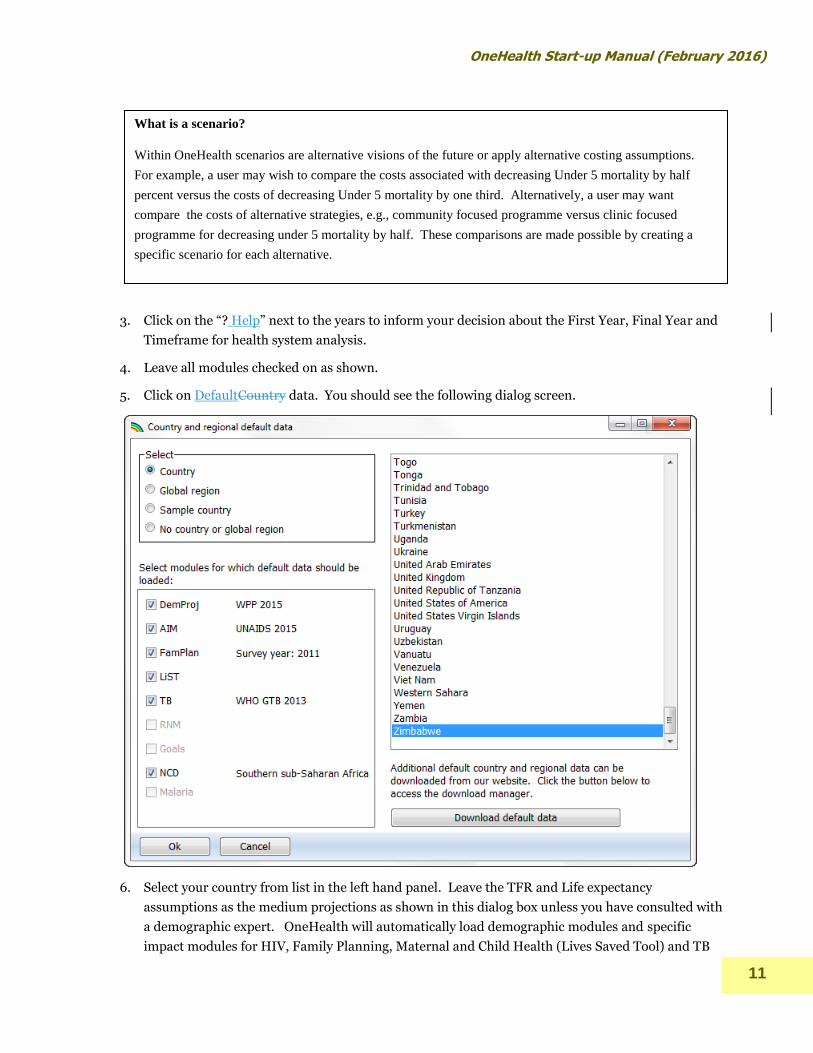
5. Click on DefaultCountry data. You should see the following dialog screen.
6. Select your country from list in the left hand panel. Leave the TFR and Life expectancy
assumptions as the medium projections as shown in this dialog box unless you have consulted with
a demographic expert. OneHealth will automatically load demographic modules and specific
impact modules for HIV, Family Planning, Maternal and Child Health (Lives Saved Tool) and TB
What is a scenario?
Within OneHealth scenarios are alternative visions of the future or apply alternative costing assumptions.
For example, a user may wish to compare the costs associated with decreasing Under 5 mortality by half
percent versus the costs of decreasing Under 5 mortality by one third. Alternatively, a user may want
compare the costs of alternative strategies, e.g., community focused programme versus clinic focused
programme for decreasing under 5 mortality by half. These comparisons are made possible by creating a
specific scenario for each alternative.
ONEHEALTH Start up MANUAL (February 2016)
12
epidemiological information for the country you have selected in most cases. See appendix for a list
of countries with default data.
Note however that in some cases OneHealth will load regional values for child survival data and
representative values for family planning if data are not currently available to the tool. The
appendix “Countries with Default Data” lists the various countries that include default data. When
regional or representative data have been loaded a notice will appear. It is recommended that you
review and edit the family planning and mortality data in the FamPlan and LiST modules if you
receive this notice.
In addition, note that OneHealth includes a “sample” country as default, which includes default
data for several modules including TB and NCDs, and can be used for training purposes and to
further explore the capabilities of the tool.
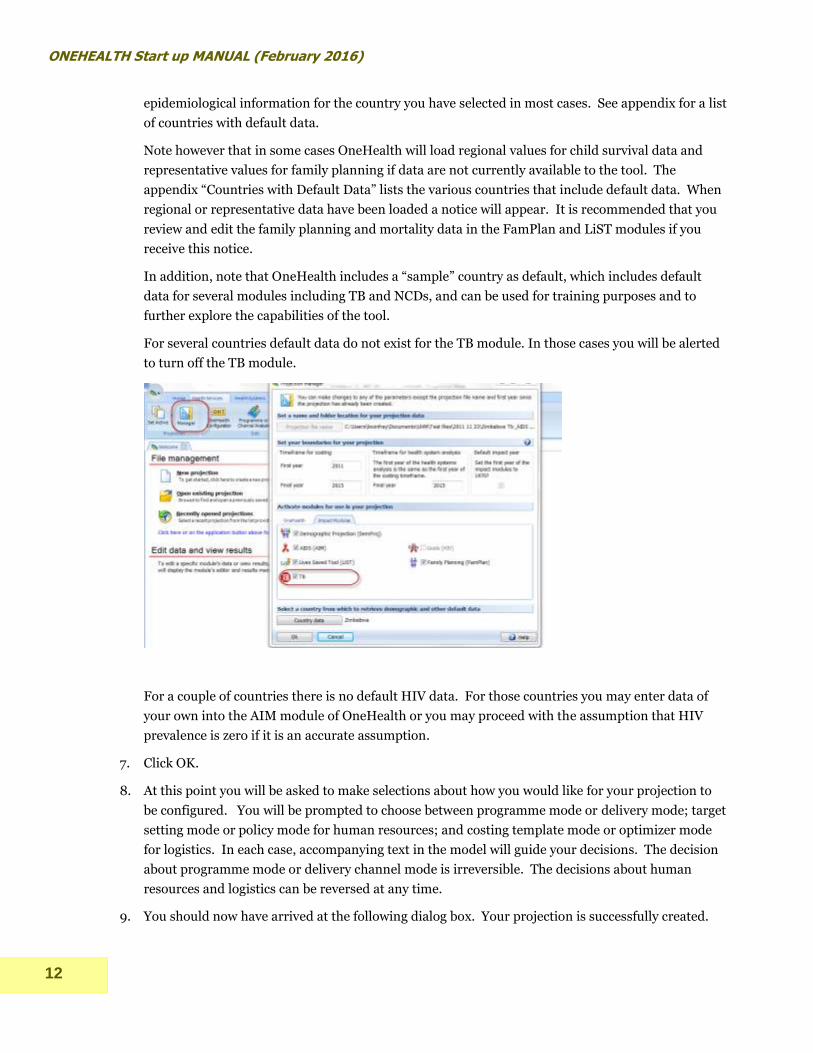
For several countries default data do not exist for the TB module. In those cases you will be alerted
to turn off the TB module.
For a couple of countries there is no default HIV data. For those countries you may enter data of
your own into the AIM module of OneHealth or you may proceed with the assumption that HIV
prevalence is zero if it is an accurate assumption.
7. Click OK.
8. At this point you will be asked to make selections about how you would like for your projection to
be configured. You will be prompted to choose between programme mode or delivery mode; target
setting mode or policy mode for human resources; and costing template mode or optimizer mode
for logistics. In each case, accompanying text in the model will guide your decisions. The decision
about programme mode or delivery channel mode is irreversible. The decisions about human
resources and logistics can be reversed at any time.
9. You should now have arrived at the following dialog box. Your projection is successfully created.

OneHealth Start-up Manual (February 2016)
13
We recommend that you first save your projection and then return to this editor to customize your
projection to fit your country’s health system.
10. Click on Close, then click on the OHT icon in the upper left corner, and click “Save”. Until you click
save, nothing is actually stored permanently. You may return to the OneHealth Configuration to
customize your projection by clicking on the OneHealth Configuration icon.
Step 6: Open an existing projection.
If you are returning to OneHealth after having closed the tool, you may open your projection by clicking on
“Open existing projection” in the welcome screen or with the file management system accessible via the
OHT icon.
If you have received a projection from a colleague follow the following sub-steps.
ONEHEALTH Start up MANUAL (February 2016)
14
1. Save the file or files to an easy to find folder on your computer’s hard drive. Please take note if you
have received a collection of many files with extensions such as *.pjn, *.cs, *.aim, etc. or a single file
with the extension *.pjnz.
2. Launch the OneHealth Tool.
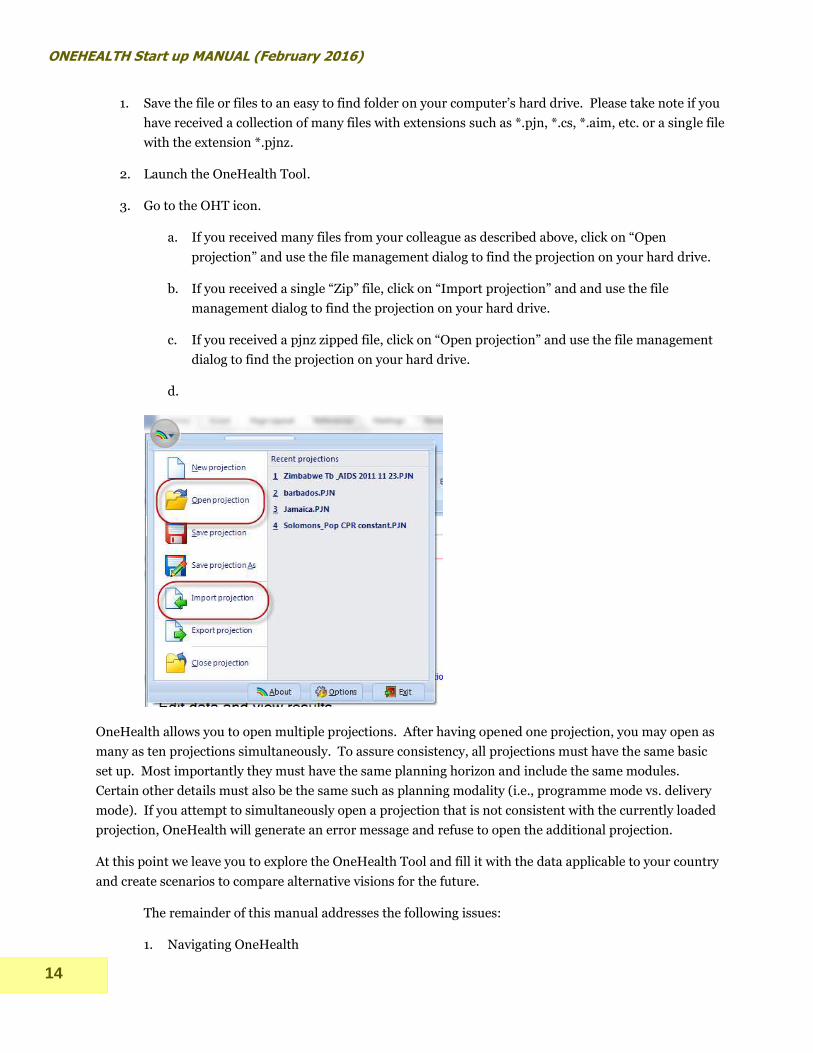
3. Go to the OHT icon.
a. If you received many files from your colleague as described above, click on “Open
projection” and use the file management dialog to find the projection on your hard drive.
b. If you received a single “Zip” file, click on “Import projection” and and use the file
management dialog to find the projection on your hard drive.
c. If you received a pjnz zipped file, click on “Open projection” and use the file management
dialog to find the projection on your hard drive.
d.
OneHealth allows you to open multiple projections. After having opened one projection, you may open as
many as ten projections simultaneously. To assure consistency, all projections must have the same basic
set up. Most importantly they must have the same planning horizon and include the same modules.
Certain other details must also be the same such as planning modality (i.e., programme mode vs. delivery
mode). If you attempt to simultaneously open a projection that is not consistent with the currently loaded
projection, OneHealth will generate an error message and refuse to open the additional projection.
At this point we leave you to explore the OneHealth Tool and fill it with the data applicable to your country
and create scenarios to compare alternative visions for the future.
The remainder of this manual addresses the following issues:
1. Navigating OneHealth

OneHealth Start-up Manual (February 2016)
15
2. Description of the OneHealth Modules
3. Special topics
We recommend that you look carefully at the chapter on Navigation as it contains many hints that
can make use of OneHealth much simpler. We recommend that you skim the remainder of the
manual to familiarize yourself with the content. You may want to later return to the manual when
you need to use particular features.
ONEHEALTH Start up MANUAL (February 2016)
16
NAVIGATING ONEHEALTH
This next section will help a new user to become familiar with all of the different functions within
OneHealth. A simple screen snapshot will be shown to you with a set of numbers next to the icon, or tab of
the model that is being explained. Below the screenshot the user will find the explanation of each
number/icon/tab.
Icon Groups, Icons, Ribbons and Menus
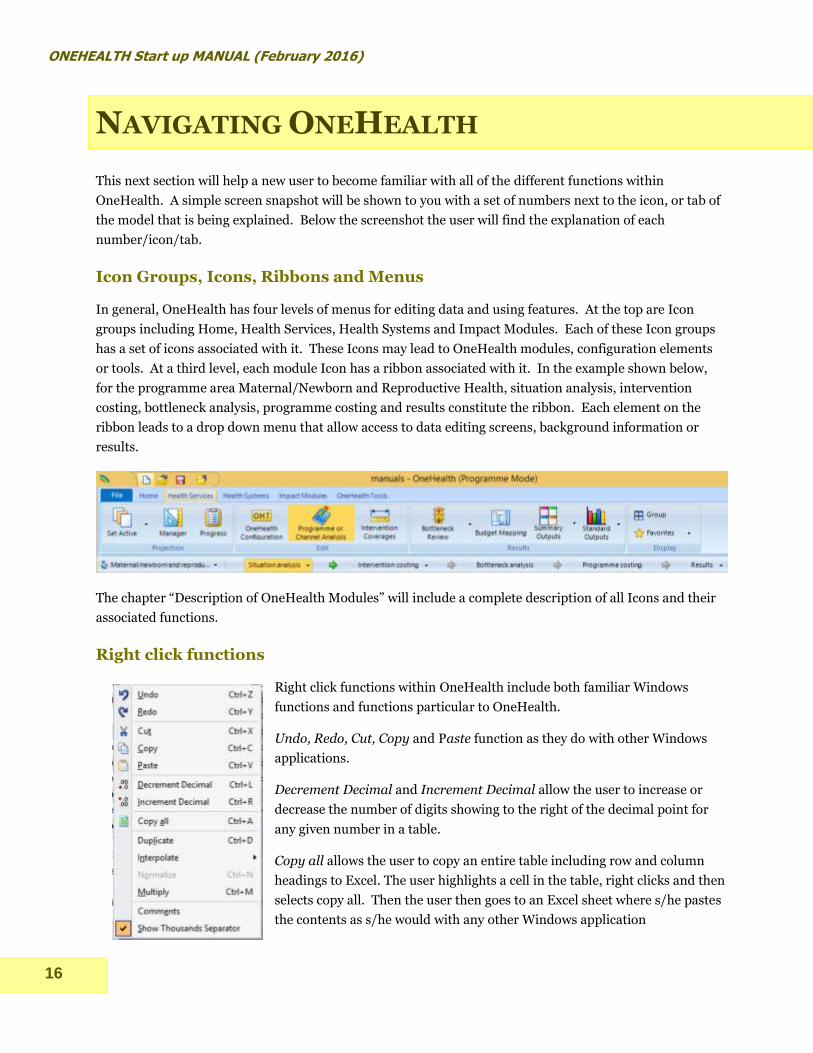
In general, OneHealth has four levels of menus for editing data and using features. At the top are Icon
groups including Home, Health Services, Health Systems and Impact Modules. Each of these Icon groups
has a set of icons associated with it. These Icons may lead to OneHealth modules, configuration elements
or tools. At a third level, each module Icon has a ribbon associated with it. In the example shown below,
for the programme area Maternal/Newborn and Reproductive Health, situation analysis, intervention
costing, bottleneck analysis, programme costing and results constitute the ribbon. Each element on the
ribbon leads to a drop down menu that allow access to data editing screens, background information or
results.
The chapter “Description of OneHealth Modules” will include a complete description of all Icons and their
associated functions.
Right click functions
Right click functions within OneHealth include both familiar Windows
functions and functions particular to OneHealth.
Undo, Redo, Cut, Copy and Paste function as they do with other Windows
applications.
Decrement Decimal and Increment Decimal allow the user to increase or
decrease the number of digits showing to the right of the decimal point for
any given number in a table.
Copy all allows the user to copy an entire table including row and column
headings to Excel. The user highlights a cell in the table, right clicks and then
selects copy all. Then the user then goes to an Excel sheet where s/he pastes
the contents as s/he would with any other Windows application

OneHealth Start-up Manual (February 2016)
17
Duplicate allows a user to duplicate the contents of a cell either left to right or top to bottom. The user
highlights a row or a column, rights clicks and then selects duplicate. If more than one row and more than
one column is selected at the same time, cells in the column at the far left are duplicated to the highlighted
columns at the right.
Interpolate functions the same as duplicate except that instead of duplicating cells, cells are between the
beginning and the end of a highlighted area are interpolated. There are four different patterns of
interpolation to choose among: linear, s-shaped, exponential and front loaded.
Normalize is a function that only operates in a few specialized edit tables where the items in a row or a
column should sum to 100 percent. If the user selects this option, the items in the row or column will be
recalculated to proportionally sum to 100. An example of where this function is live is the method mix table
in the family planning module.
The Comments function allows the user to document his/her work. Each edit screen has a comments field
associated with it. Via the Summary Outputs, there is an option where the user may view, copy or print the
entire set of comments associated their OneHealth projection.
Copying from Windows applications into OneHealth
In addition to being able to copy from OneHealth into Windows applications, the reverse can be done as
well. The user may copy a column, row or an entire table of numbers from Excel into a OneHealth edit
table.
It is also possible to copy columns of labels from Excel into configuration elements of the following
modules: Human resources, Infrastructure and Budgeting.
Finally in some modules it is possible to import appropriately configured Excel spreadsheets into
OneHealth. Instructions guide within OneHealth guide the user where this is possible. Examples of where
this function operates are: User supplied commodities in Logistics; and Equipment lists in the
Infrastructure module.
Technical assistance
Technical assistance for features and inputs to OneHealth are spread throughout the tool. These assists
come in the following forms:
1. Help screens accessed via “? Help” or simply “?”

ONEHEALTH Start up MANUAL (February 2016)
18
2. Highlighted Links to more information
3. Text directly included in the editor
4. Scroll overs with particular information
are usually indicated by red triangles in a
cell or label (see screen shot below). The
user accesses this information by
hovering his/her cursor over the cell
containing the triangle
OneHealth Start-up Manual (February 2016)
19
MODULES AND FEATURES OF ONEHEALTH
The following describes the various modules and features of OneHealth accessed via the various Icons.
These descriptions are offered only for orientation, not as a guide to use. It is expected that the user will
investigate these modules via the OneHealth Tool. When s/he has questions, s/he will access the associated
help screens, hyper-links and scroll-overs.
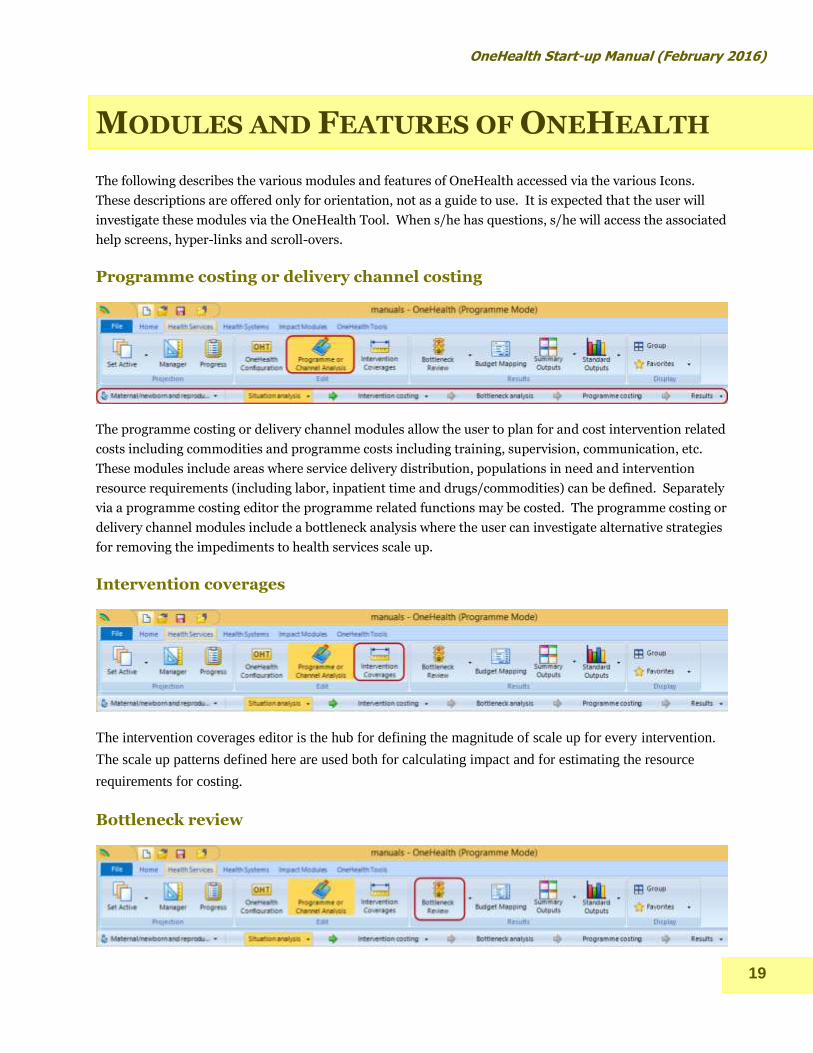
Programme costing or delivery channel costing
The programme costing or delivery channel modules allow the user to plan for and cost intervention related
costs including commodities and programme costs including training, supervision, communication, etc.
These modules include areas where service delivery distribution, populations in need and intervention
resource requirements (including labor, inpatient time and drugs/commodities) can be defined. Separately
via a programme costing editor the programme related functions may be costed. The programme costing or
delivery channel modules include a bottleneck analysis where the user can investigate alternative strategies
for removing the impediments to health services scale up.
Intervention coverages
The intervention coverages editor is the hub for defining the magnitude of scale up for every intervention.
The scale up patterns defined here are used both for calculating impact and for estimating the resource
requirements for costing.
Bottleneck review
ONEHEALTH Start up MANUAL (February 2016)
20
The bottleneck analysis mentioned above is one aspect of the tool that allows the user to bring together
disparate sets of information and experience to help define a coherent plan. The bottleneck review icon
allows the user to graphically contrast and compare the bottleneck analyses made across programme areas
or delivery channels. The Bottleneck review icon also allows the user to access a listing of all of the
strategies defined within the various programme or delivery channel bottleneck analyses.
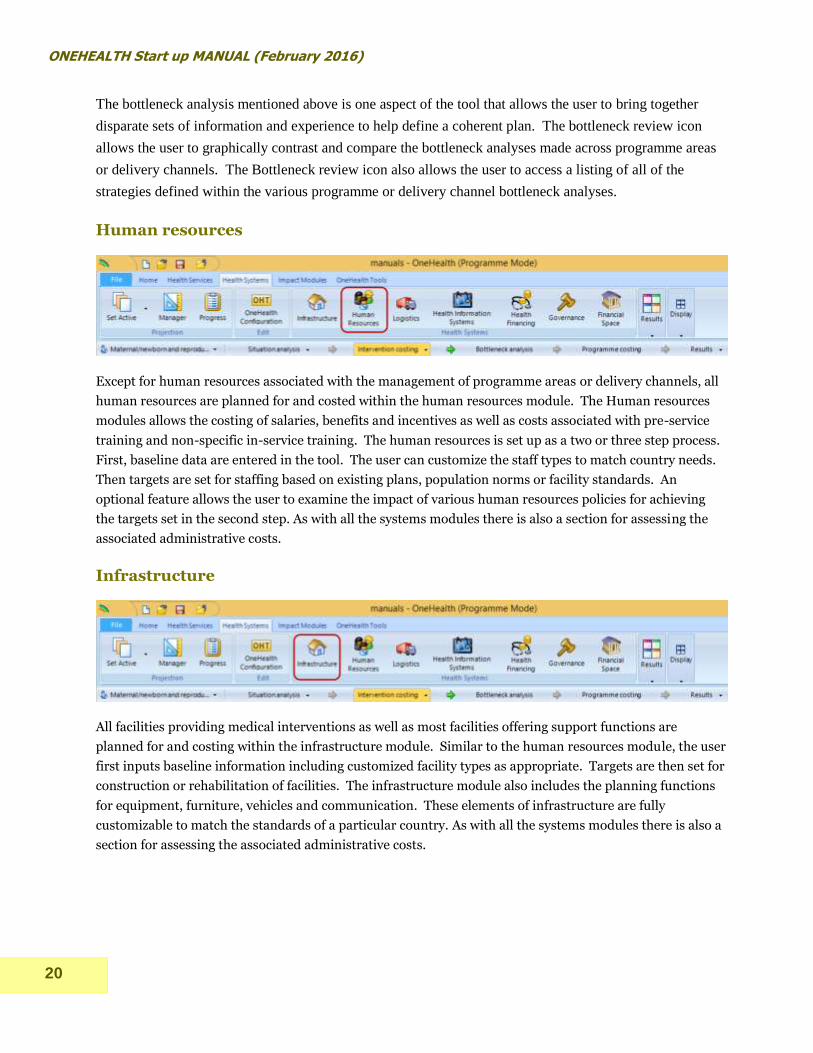
Human resources
Except for human resources associated with the management of programme areas or delivery channels, all
human resources are planned for and costed within the human resources module. The Human resources
modules allows the costing of salaries, benefits and incentives as well as costs associated with pre-service
training and non-specific in-service training. The human resources is set up as a two or three step process.
First, baseline data are entered in the tool. The user can customize the staff types to match country needs.
Then targets are set for staffing based on existing plans, population norms or facility standards. An
optional feature allows the user to examine the impact of various human resources policies for achieving
the targets set in the second step. As with all the systems modules there is also a section for assessing the
associated administrative costs.
Infrastructure
All facilities providing medical interventions as well as most facilities offering support functions are
planned for and costing within the infrastructure module. Similar to the human resources module, the user
first inputs baseline information including customized facility types as appropriate. Targets are then set for
construction or rehabilitation of facilities. The infrastructure module also includes the planning functions
for equipment, furniture, vehicles and communication. These elements of infrastructure are fully
customizable to match the standards of a particular country. As with all the systems modules there is also a
section for assessing the associated administrative costs.
OneHealth Start-up Manual (February 2016)
21
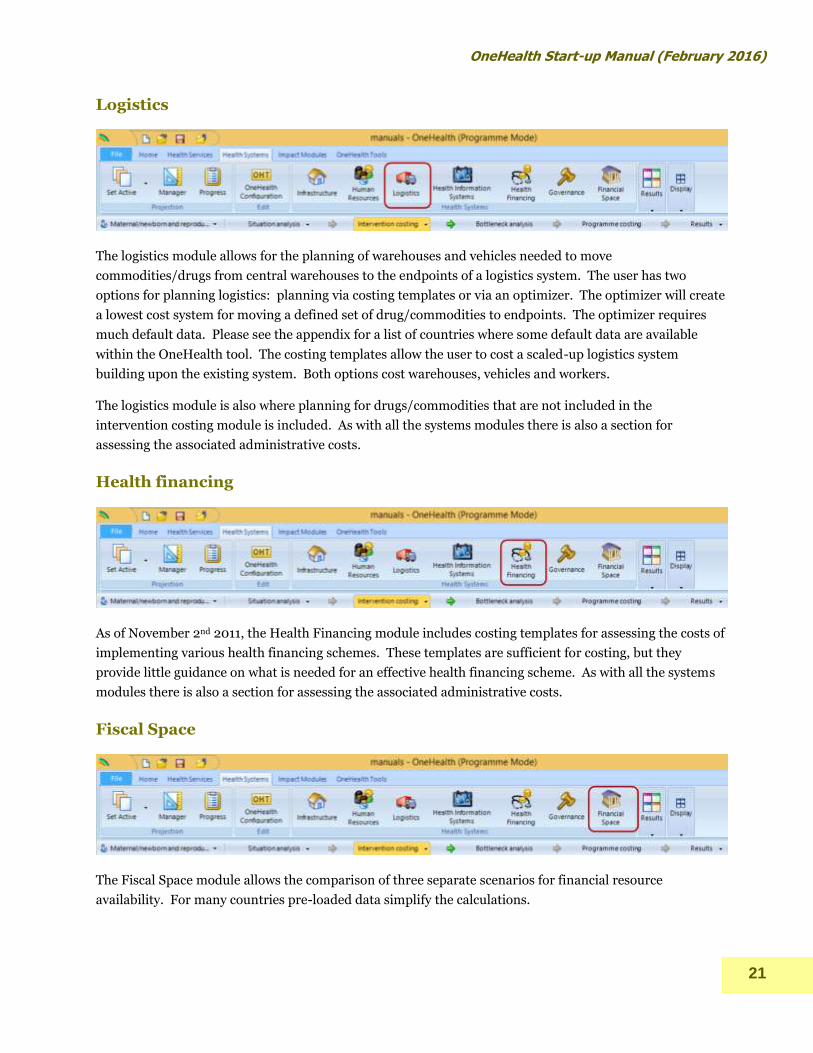
Logistics
The logistics module allows for the planning of warehouses and vehicles needed to move
commodities/drugs from central warehouses to the endpoints of a logistics system. The user has two
options for planning logistics: planning via costing templates or via an optimizer. The optimizer will create
a lowest cost system for moving a defined set of drug/commodities to endpoints. The optimizer requires
much default data. Please see the appendix for a list of countries where some default data are available
within the OneHealth tool. The costing templates allow the user to cost a scaled-up logistics system
building upon the existing system. Both options cost warehouses, vehicles and workers.
The logistics module is also where planning for drugs/commodities that are not included in the
intervention costing module is included. As with all the systems modules there is also a section for
assessing the associated administrative costs.
Health financing
As of November 2nd 2011, the Health Financing module includes costing templates for assessing the costs of
implementing various health financing schemes. These templates are sufficient for costing, but they
provide little guidance on what is needed for an effective health financing scheme. As with all the systems
modules there is also a section for assessing the associated administrative costs.
Fiscal Space
The Fiscal Space module allows the comparison of three separate scenarios for financial resource
availability. For many countries pre-loaded data simplify the calculations.
ONEHEALTH Start up MANUAL (February 2016)
22
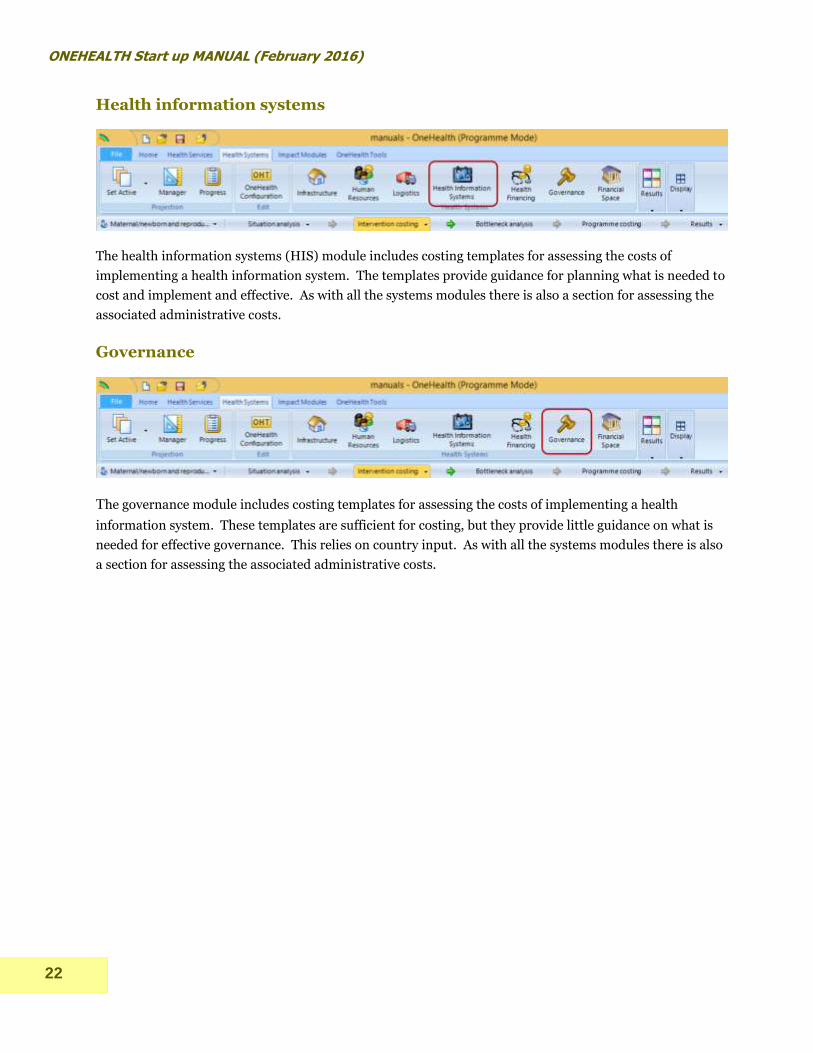
Health information systems
The health information systems (HIS) module includes costing templates for assessing the costs of
implementing a health information system. The templates provide guidance for planning what is needed to
cost and implement and effective. As with all the systems modules there is also a section for assessing the
associated administrative costs.
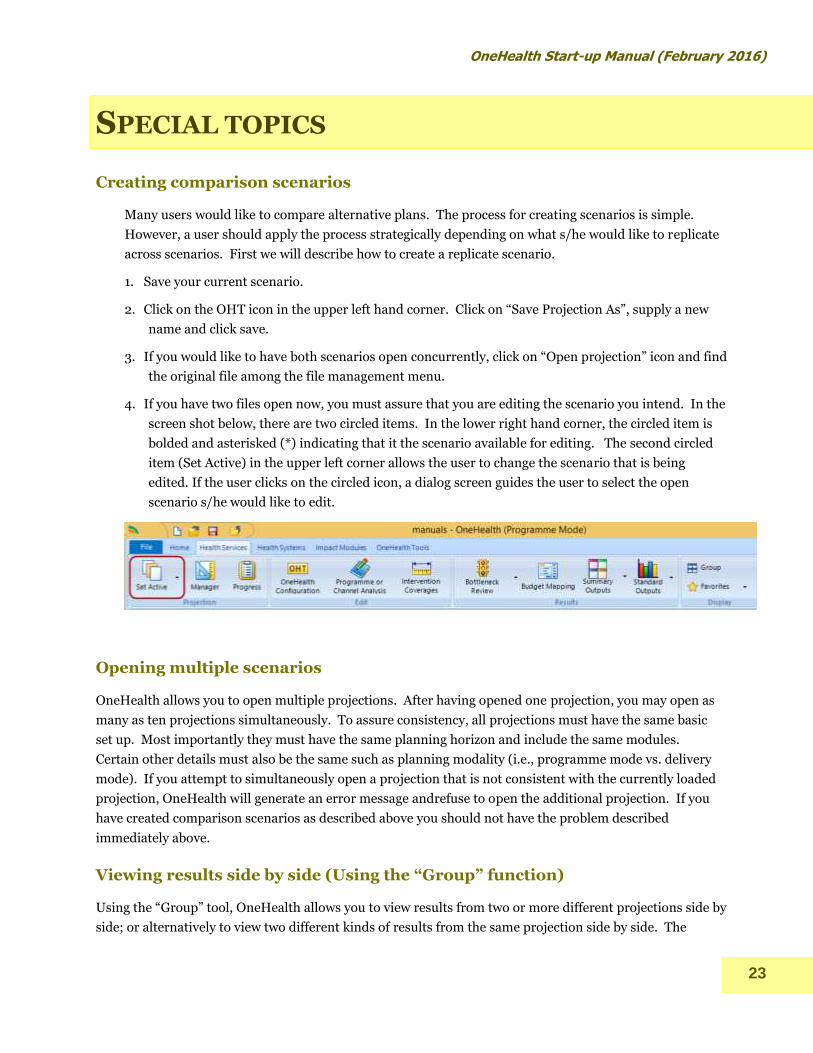
Governance
The governance module includes costing templates for assessing the costs of implementing a health
information system. These templates are sufficient for costing, but they provide little guidance on what is
needed for effective governance. This relies on country input. As with all the systems modules there is also
a section for assessing the associated administrative costs.
OneHealth Start-up Manual (February 2016)
23
SPECIAL TOPICS
Creating comparison scenarios
Many users would like to compare alternative plans. The process for creating scenarios is simple.
However, a user should apply the process strategically depending on what s/he would like to replicate
across scenarios. First we will describe how to create a replicate scenario.
1. Save your current scenario.
2. Click on the OHT icon in the upper left hand corner. Click on “Save Projection As”, supply a new
name and click save.
3. If you would like to have both scenarios open concurrently, click on “Open projection” icon and find
the original file among the file management menu.
4. If you have two files open now, you must assure that you are editing the scenario you intend. In the
screen shot below, there are two circled items. In the lower right hand corner, the circled item is
bolded and asterisked (*) indicating that it the scenario available for editing. The second circled
item (Set Active) in the upper left corner allows the user to change the scenario that is being
edited. If the user clicks on the circled icon, a dialog screen guides the user to select the open
scenario s/he would like to edit.
Opening multiple scenarios
OneHealth allows you to open multiple projections. After having opened one projection, you may open as
many as ten projections simultaneously. To assure consistency, all projections must have the same basic
set up. Most importantly they must have the same planning horizon and include the same modules.
Certain other details must also be the same such as planning modality (i.e., programme mode vs. delivery
mode). If you attempt to simultaneously open a projection that is not consistent with the currently loaded
projection, OneHealth will generate an error message andrefuse to open the additional projection. If you
have created comparison scenarios as described above you should not have the problem described
immediately above.
Viewing results side by side (Using the “Group” function)
Using the “Group” tool, OneHealth allows you to view results from two or more different projections side by
side; or alternatively to view two different kinds of results from the same projection side by side. The

ONEHEALTH Start up MANUAL (February 2016)
24
following describes the process for viewing the under five mortality distribution side by side with the
maternal mortality distribution.
1. Open the “Deaths by Cause” for children from the mortality output (select pie chart from
configuration).
You should see the following or something similar.
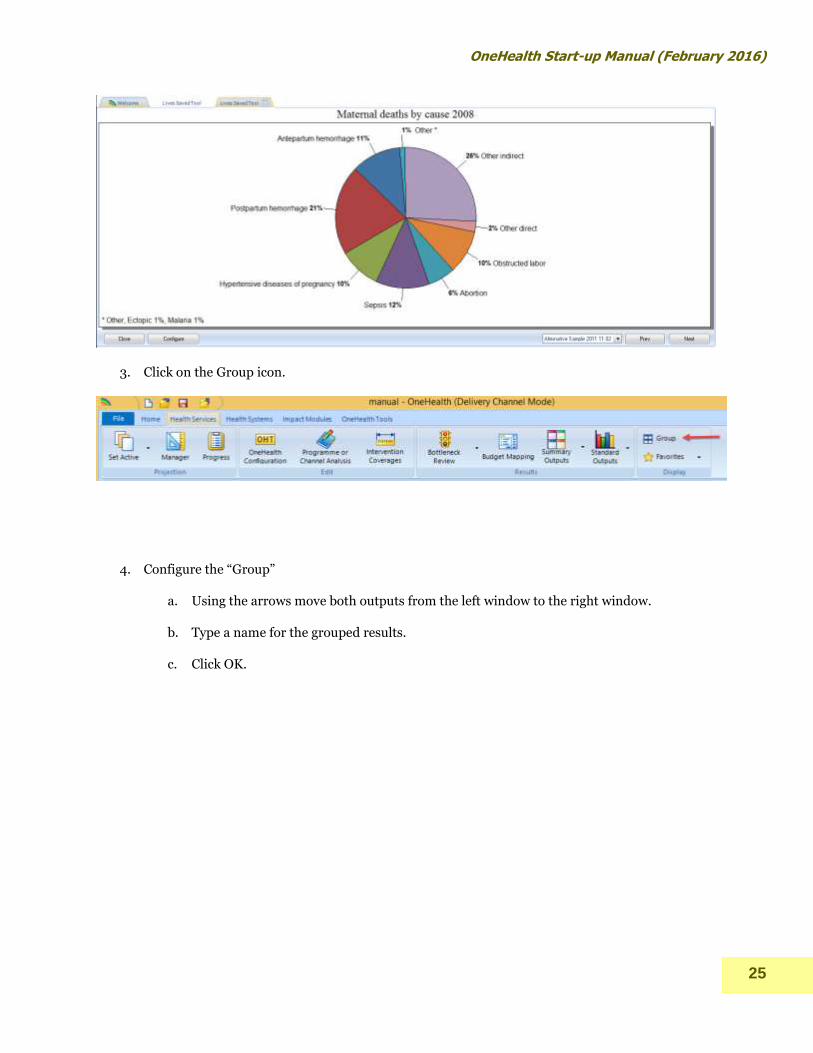
2. Open a second window with the distribution for maternal deaths by cause, again choose the pie chart
configuration. You should now see something like the following.
OneHealth Start-up Manual (February 2016)
25
3. Click on the Group icon.
4. Configure the “Group”
a. Using the arrows move both outputs from the left window to the right window.
b. Type a name for the grouped results.
c. Click OK.

ONEHEALTH Start up MANUAL (February 2016)
26
5. You should see something similar to the following.
OneHealth has a feature for creating “Favorite” comparisons. If you right click on either of the comparison
graphs, one of your possible actions is to add the comparison to your favorites. You may access your
favorite comparisons by clicking on the icon item directly below the “Group” Icon.

OneHealth Start-up Manual (February 2016)
27
Creating a sub-national projection
By default, OneHealth is designed to make national level projections. However, subnational projections are
possible by using the following steps. Please note that you may need to consult demographic or
epidemiological experts for some of the decisions you will need to make in the set up.
Step 1. Obligatory. Create a national projection for the country from which the subnational area or
population is drawn. Turn off the TB Module (creation of subnational TB incidence and mortality
projections is currently impossible).
ONEHEALTH Start up MANUAL (February 2016)
28
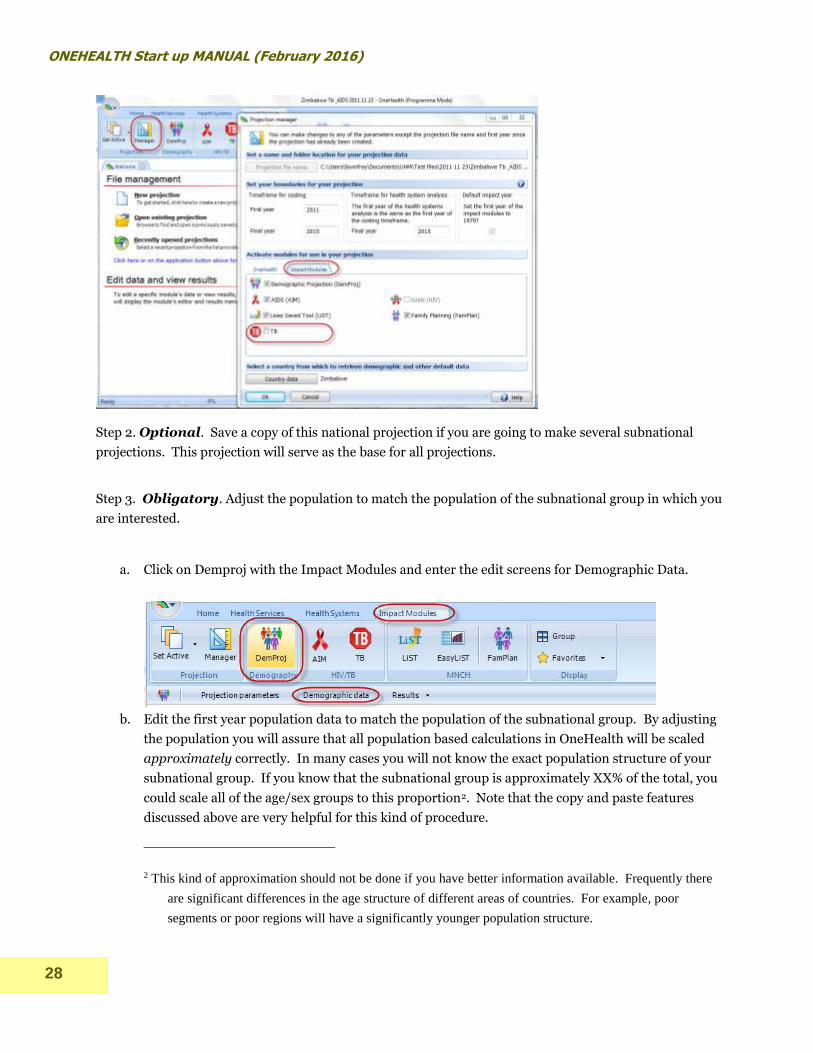
Step 2. Optional. Save a copy of this national projection if you are going to make several subnational
projections. This projection will serve as the base for all projections.
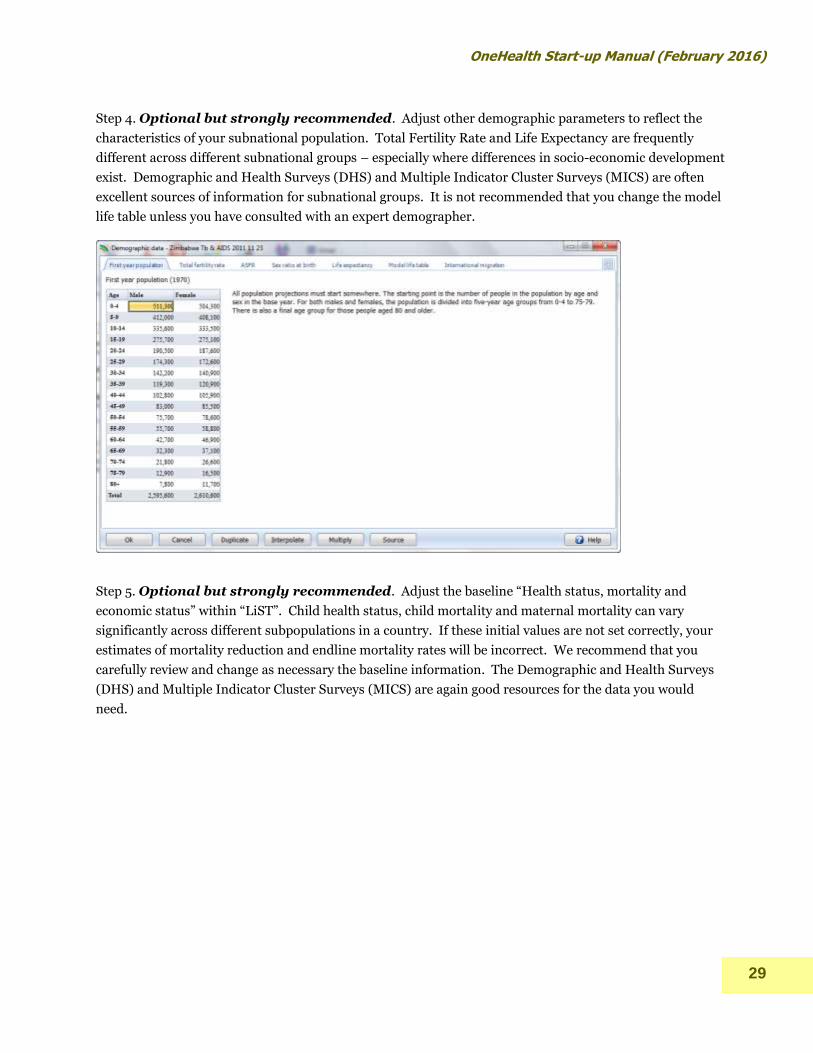
Step 3. Obligatory. Adjust the population to match the population of the subnational group in which you
are interested.
a. Click on Demproj with the Impact Modules and enter the edit screens for Demographic Data.
b. Edit the first year population data to match the population of the subnational group. By adjusting
the population you will assure that all population based calculations in OneHealth will be scaled
approximately correctly. In many cases you will not know the exact population structure of your
subnational group. If you know that the subnational group is approximately XX% of the total, you
could scale all of the age/sex groups to this proportion2. Note that the copy and paste features
discussed above are very helpful for this kind of procedure.
2 This kind of approximation should not be done if you have better information available. Frequently there
are significant differences in the age structure of different areas of countries. For example, poor
segments or poor regions will have a significantly younger population structure.
OneHealth Start-up Manual (February 2016)
29
Step 4. Optional but strongly recommended. Adjust other demographic parameters to reflect the
characteristics of your subnational population. Total Fertility Rate and Life Expectancy are frequently
different across different subnational groups – especially where differences in socio-economic development
exist. Demographic and Health Surveys (DHS) and Multiple Indicator Cluster Surveys (MICS) are often
excellent sources of information for subnational groups. It is not recommended that you change the model
life table unless you have consulted with an expert demographer.
Step 5. Optional but strongly recommended. Adjust the baseline “Health status, mortality and
economic status” within “LiST”. Child health status, child mortality and maternal mortality can vary
significantly across different subpopulations in a country. If these initial values are not set correctly, your
estimates of mortality reduction and endline mortality rates will be incorrect. We recommend that you
carefully review and change as necessary the baseline information. The Demographic and Health Surveys
(DHS) and Multiple Indicator Cluster Surveys (MICS) are again good resources for the data you would
need.

ONEHEALTH Start up MANUAL (February 2016)
30
OneHealth Start-up Manual (February 2016)
31
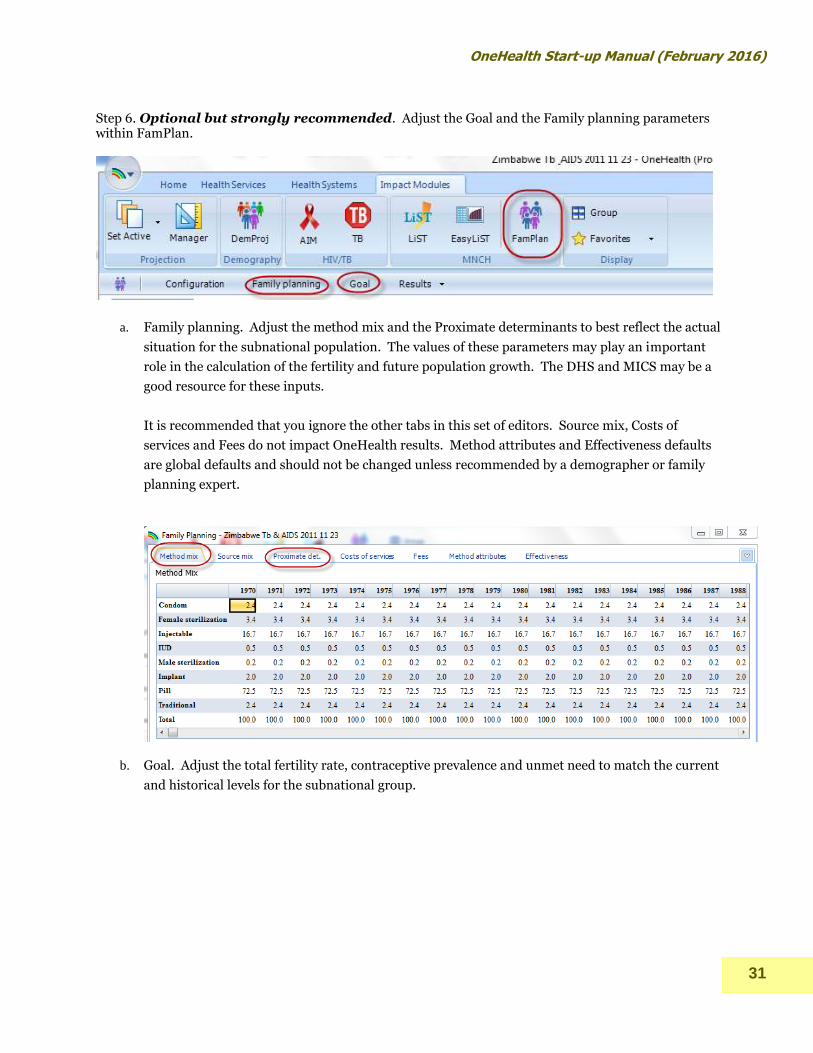
Step 6. Optional but strongly recommended. Adjust the Goal and the Family planning parameters within FamPlan.
a. Family planning. Adjust the method mix and the Proximate determinants to best reflect the actual
situation for the subnational population. The values of these parameters may play an important
role in the calculation of the fertility and future population growth. The DHS and MICS may be a
good resource for these inputs.
It is recommended that you ignore the other tabs in this set of editors. Source mix, Costs of
services and Fees do not impact OneHealth results. Method attributes and Effectiveness defaults
are global defaults and should not be changed unless recommended by a demographer or family
planning expert.
b. Goal. Adjust the total fertility rate, contraceptive prevalence and unmet need to match the current
and historical levels for the subnational group.

ONEHEALTH Start up MANUAL (February 2016)
32
Step 7. Optional but strongly recommended. Adjust the program statistics with the AIM
module. The AIM module is automatically loaded with historical information about the numbers of
adults and children receiving treatment for HIV. These numbers will be for the entire country. You
should adjust these numbers down to reflect the reality of the subnational group. Official
HIV/AIDS services statistics may be helpful.
If you have access to an HIV specialist it is also recommended that you adjust the incidence. If you
do not adjust the incidence, the AIDS deaths averted will not be correctly calculated and there may
be a poor estimate of the drugs needed for HIV treatment.
Step 8. Adjust all of the baseline coverages within the intervention coverages editor.
The defaults are all gauged to the national level. Subnational coverages will vary significantly. The
DHS and MICS are useful sources for some of this information.

OneHealth Start-up Manual (February 2016)
33
Lock/Unlock Capability in OneHealth
The OneHealth Tool includes a feature that allows users to save a version of their projection as “locked”
projection, which only allows users to edit certain areas of the OneHealth Tool that have not been locked.
This feature is especially important for:
- Cases where OneHealth users might be working on the same projection
- Situations where an existing projection is shared with others to fill in data for a particular program
area or health system, without any other data within the Tool inadvertently getting changed.
To lock a projection:
Before creating a locked projection, the data in OneHealth Configuration, as well as data in the following
menus should be finalized, as these are items that will be shared across locked projections and cannot be
changed in individual locked files.
- Intervention list
- Infrastructure types
- HR types
- Drug and supply list
- Impact models
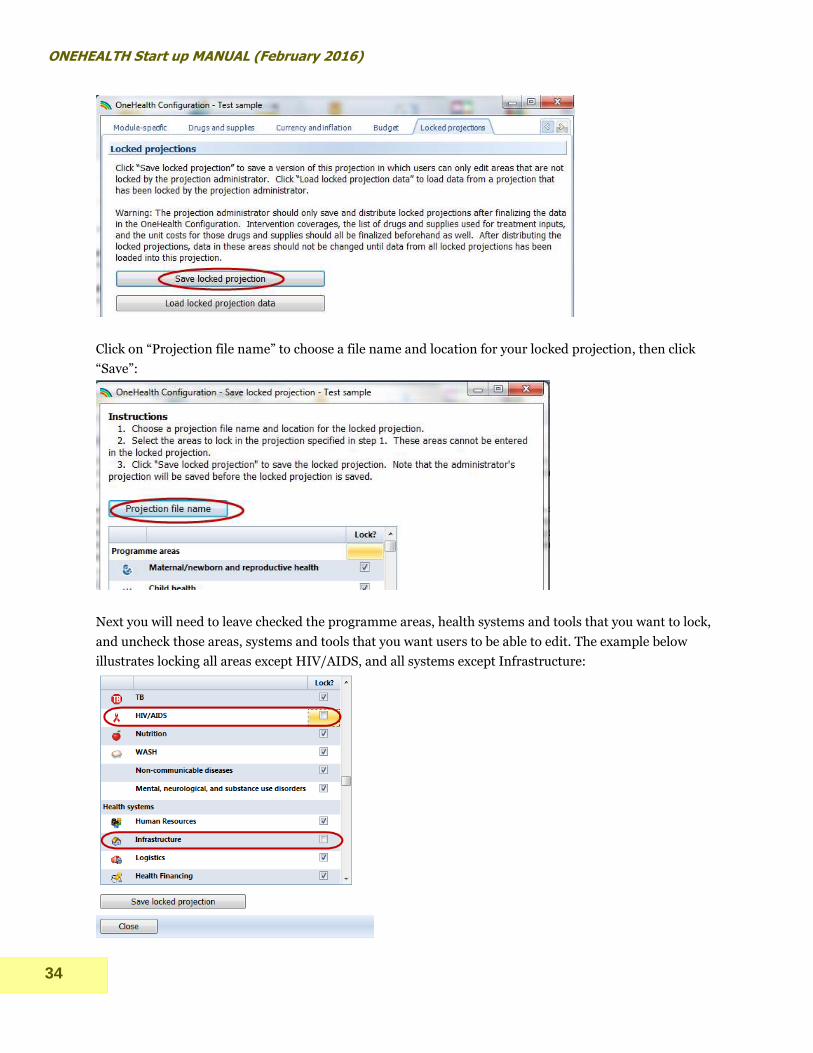
In the OneHealth Configuration menu, click on the arrow in the top right to scroll to the last tab in the
dialogue box: Locked projections
To save a projection as a “Locked projection”, click on the “Save locked projection” box. This will open a
dialogue box to help you name your projection and determine which areas and modules in the OneHealth
Tool you want to lock:
ONEHEALTH Start up MANUAL (February 2016)
34
Click on “Projection file name” to choose a file name and location for your locked projection, then click
“Save”:
Next you will need to leave checked the programme areas, health systems and tools that you want to lock,
and uncheck those areas, systems and tools that you want users to be able to edit. The example below
illustrates locking all areas except HIV/AIDS, and all systems except Infrastructure:
OneHealth Start-up Manual (February 2016)
35
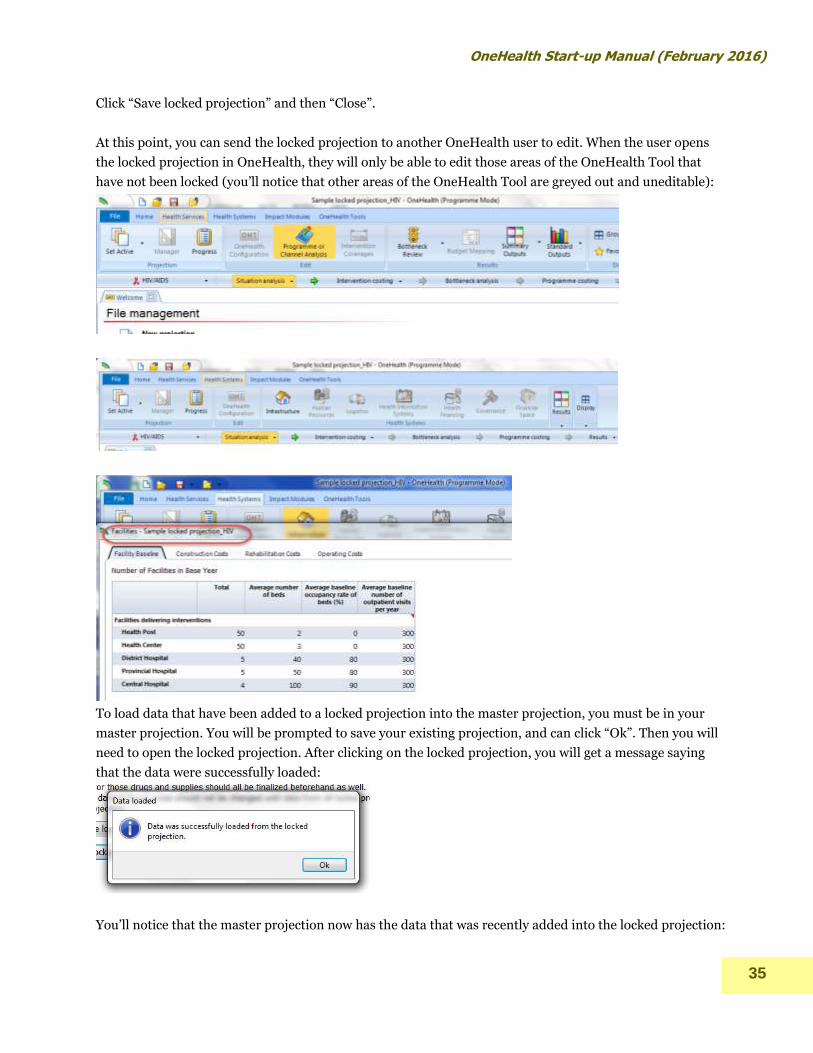
Click “Save locked projection” and then “Close”.
At this point, you can send the locked projection to another OneHealth user to edit. When the user opens
the locked projection in OneHealth, they will only be able to edit those areas of the OneHealth Tool that
have not been locked (you’ll notice that other areas of the OneHealth Tool are greyed out and uneditable):
To load data that have been added to a locked projection into the master projection, you must be in your
master projection. You will be prompted to save your existing projection, and can click “Ok”. Then you will
need to open the locked projection. After clicking on the locked projection, you will get a message saying
that the data were successfully loaded:
You’ll notice that the master projection now has the data that was recently added into the locked projection:
ONEHEALTH Start up MANUAL (February 2016)
36
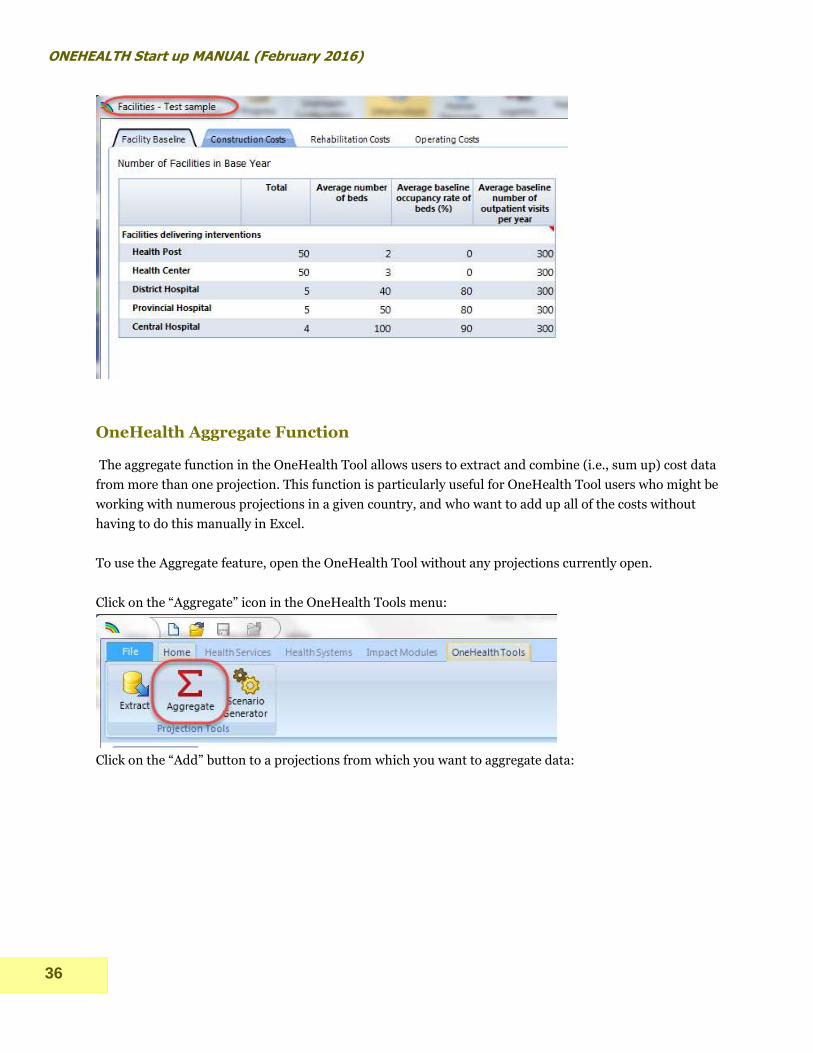
OneHealth Aggregate Function
The aggregate function in the OneHealth Tool allows users to extract and combine (i.e., sum up) cost data
from more than one projection. This function is particularly useful for OneHealth Tool users who might be
working with numerous projections in a given country, and who want to add up all of the costs without
having to do this manually in Excel.
To use the Aggregate feature, open the OneHealth Tool without any projections currently open.
Click on the “Aggregate” icon in the OneHealth Tools menu:
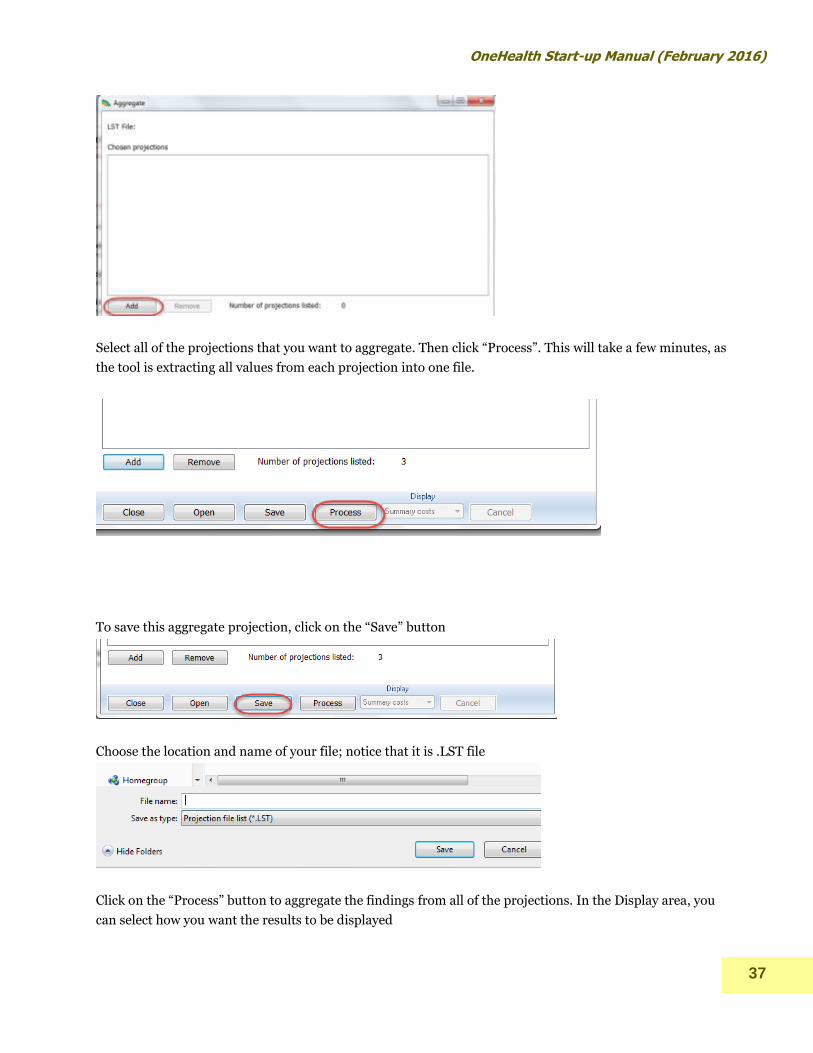
Click on the “Add” button to a projections from which you want to aggregate data:
OneHealth Start-up Manual (February 2016)
37
Select all of the projections that you want to aggregate. Then click “Process”. This will take a few minutes, as
the tool is extracting all values from each projection into one file.
To save this aggregate projection, click on the “Save” button
Choose the location and name of your file; notice that it is .LST file
Click on the “Process” button to aggregate the findings from all of the projections. In the Display area, you
can select how you want the results to be displayed
ONEHEALTH Start up MANUAL (February 2016)
38
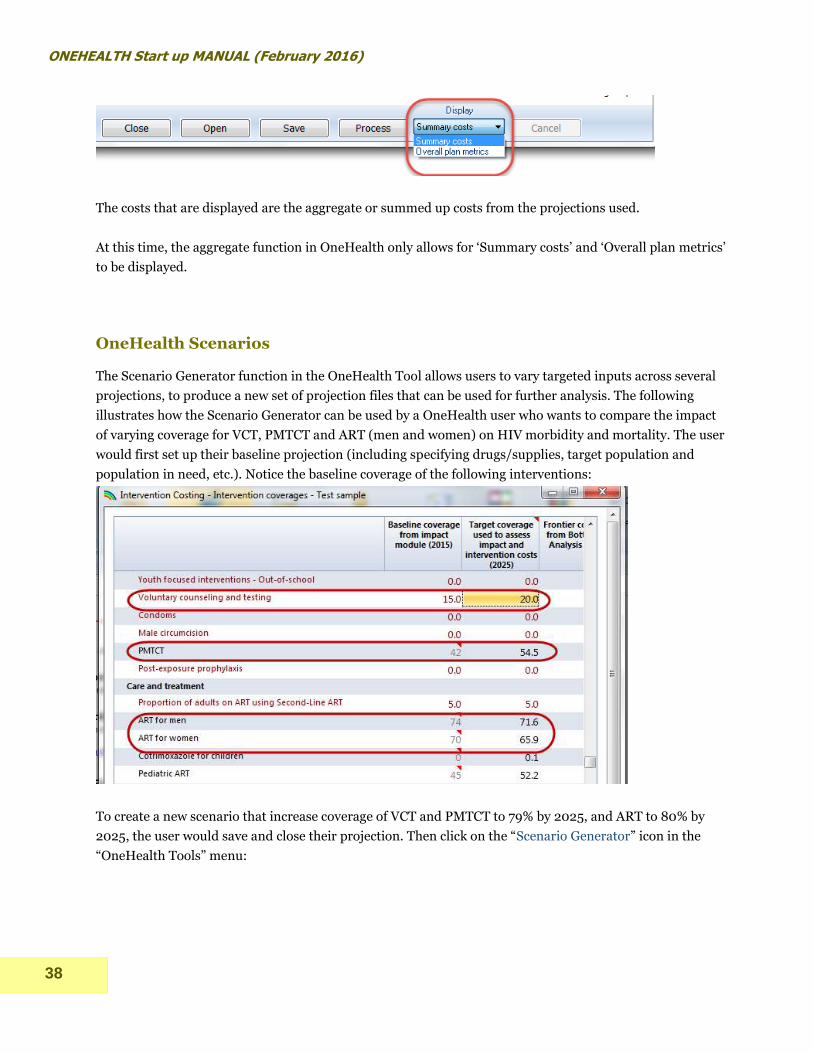
The costs that are displayed are the aggregate or summed up costs from the projections used.
At this time, the aggregate function in OneHealth only allows for ‘Summary costs’ and ‘Overall plan metrics’
to be displayed.
OneHealth Scenarios
The Scenario Generator function in the OneHealth Tool allows users to vary targeted inputs across several
projections, to produce a new set of projection files that can be used for further analysis. The following
illustrates how the Scenario Generator can be used by a OneHealth user who wants to compare the impact
of varying coverage for VCT, PMTCT and ART (men and women) on HIV morbidity and mortality. The user
would first set up their baseline projection (including specifying drugs/supplies, target population and
population in need, etc.). Notice the baseline coverage of the following interventions:
To create a new scenario that increase coverage of VCT and PMTCT to 79% by 2025, and ART to 80% by
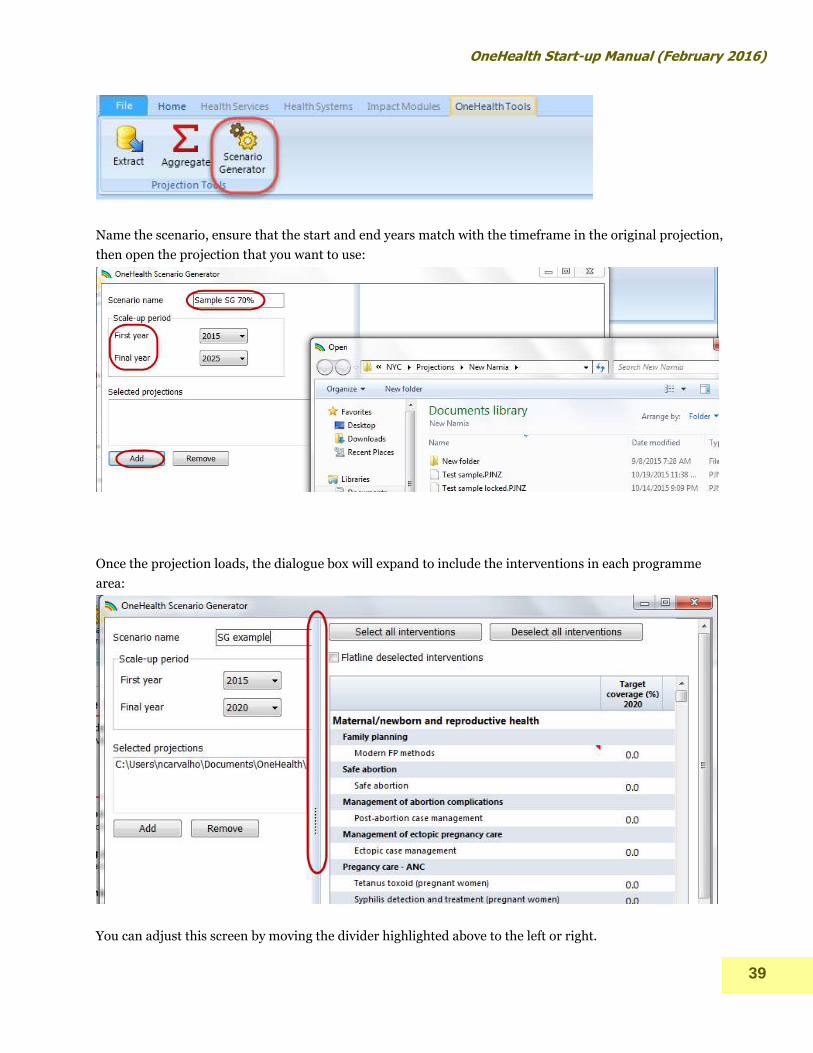
2025, the user would save and close their projection. Then click on the “Scenario Generator” icon in the
“OneHealth Tools” menu:
OneHealth Start-up Manual (February 2016)
39
Name the scenario, ensure that the start and end years match with the timeframe in the original projection,
then open the projection that you want to use:
Once the projection loads, the dialogue box will expand to include the interventions in each programme
area:
You can adjust this screen by moving the divider highlighted above to the left or right.
ONEHEALTH Start up MANUAL (February 2016)
40
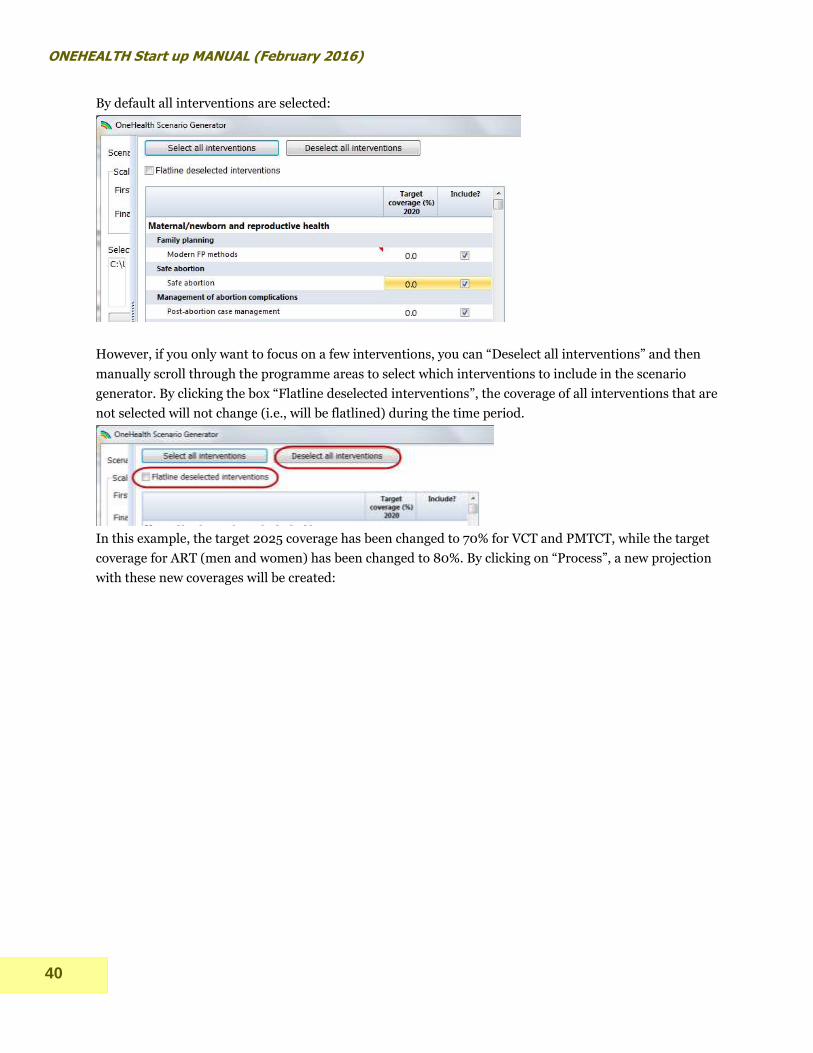
By default all interventions are selected:
However, if you only want to focus on a few interventions, you can “Deselect all interventions” and then
manually scroll through the programme areas to select which interventions to include in the scenario
generator. By clicking the box “Flatline deselected interventions”, the coverage of all interventions that are
not selected will not change (i.e., will be flatlined) during the time period.
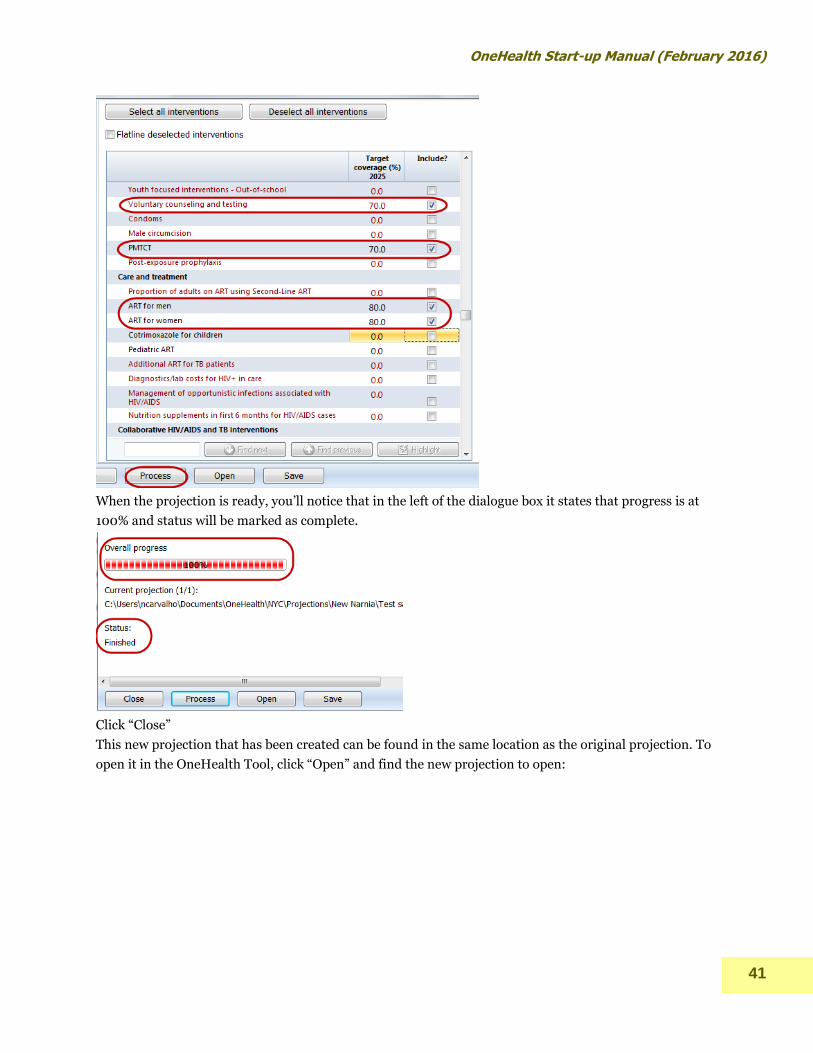
In this example, the target 2025 coverage has been changed to 70% for VCT and PMTCT, while the target
coverage for ART (men and women) has been changed to 80%. By clicking on “Process”, a new projection
with these new coverages will be created:
OneHealth Start-up Manual (February 2016)
41
When the projection is ready, you’ll notice that in the left of the dialogue box it states that progress is at
100% and status will be marked as complete.
Click “Close”
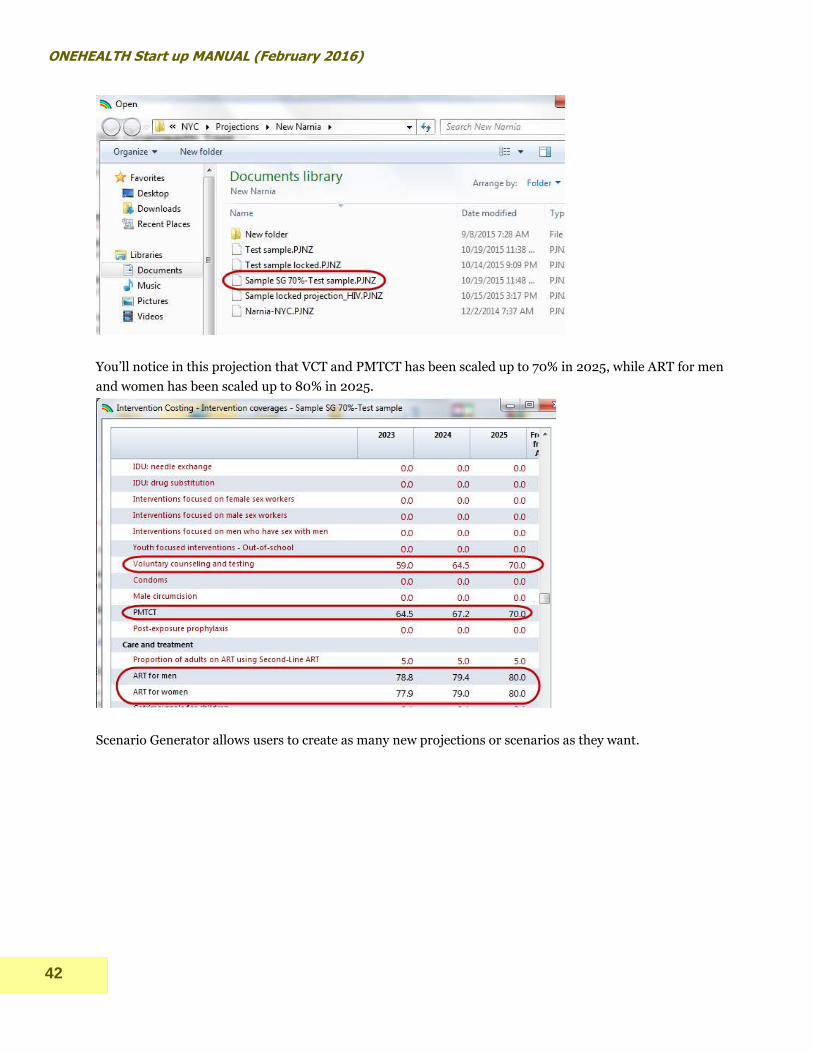
This new projection that has been created can be found in the same location as the original projection. To
open it in the OneHealth Tool, click “Open” and find the new projection to open:
ONEHEALTH Start up MANUAL (February 2016)
42
You’ll notice in this projection that VCT and PMTCT has been scaled up to 70% in 2025, while ART for men
and women has been scaled up to 80% in 2025.
Scenario Generator allows users to create as many new projections or scenarios as they want.

OneHealth Start-up Manual (February 2016)
43
Installing and running OneHealth on a Mac/Apple computer
Follow the instructions below to run OneHealth on a Mac operating system.
Option 1: Use Boot Camp to partition your hard drive with Windows
Note: This option uses the Boot Camp software, which helps Mac users (Mac OS X) create a partition on
their internal hard drive to use Microsoft Windows. You can only use Boot Camp Assistant on internal hard
drives (not external hard drives). For this option, you will need to purchase Windows 7 (Home Premium
should be sufficient), you will need the Mac OS X Install DVD that came with your Mac, and you will need a
built-in or external CD drive. You will also need to install antivirus protection for your Windows partition.
Step 1. Download Boot Camp Assistant (http://www.apple.com/support/bootcamp/). Click on the Boot
Camp Assistant in the Applications folder. Follow the directions to partition your drive. Based on
experience, it is recommended to use a 50MB partition your drive for Windows.
Step 2. Continue to follow Boot Camp Assistant directions to download Windows. Once the installation is
complete and the computer needs to restart, make sure to eject the disk.
Step 3. Once the Windows installation is complete, you will need to install the Apple Windows drivers
using the Mac OS X DVD.
Step 4. To use Windows, you will need to restart your computer and hold down the “Option” button, then
select “Windows.” Then download OneHealth in Windows.
Final Note: If you want to undo this Boot Camp partition, boot your computer into OS X and re-run Boot
Camp. Click the “Restore the startup disk to a single volume” button; this will destroy the Windows
partition and will return your hard drive to its original one-partition configuration.
Option 2: Use Parallels Desktop and Windows Operating System
Note: You will need Parallels Desktop software (www.parallels.com or www.apple.com) and a Windows
Operating System.
Step 1. Install Parallels software. Follow the instructions to install Windows.
Step 2. Turn off all other programs outside of Parallels (including email). Open Parallels in Full Screen
Mode
Step 3. Install OneHealth from the Parallels Desktop.

ONEHEALTH Start up MANUAL (February 2016)
44
TROUBLE SHOOTING
OneHealth modules cannot be activated
1. If you are a first-time user of OneHealth (or SPECTRUM), you should see the following screen.
Note that OneHealth is in the banner at the top. If you see “Spectrum” at the top, follow the
directions immediately below.
Special Instructions for when “Spectrum” appears in banner at top & for changing language options:
2. Click on the OHT icon in the upper left hand corner.
3. Click on Options in the lower right hand corner of the dialog box.

OneHealth Start-up Manual (February 2016)
45
4. Assure that “Enable OneHealth Layout” is checked.
TB deaths averted are not being reported
Please assure that the TB module has been activated. However, note that for some countries there are no
default data for TB and therefore the calculation of TB deaths in the current version of the tool is not
possible. The OneHealth Tool will alert you if data do not exist.

ONEHEALTH Start up MANUAL (February 2016)
46
Zero services are reported for an intervention
Possibility 1. The configuration for the output has been set to report the costs for a delivery channel where
there are no such service s are offered.
Possibility 2. Configuration of output is set to a delivery channel where no services are offered. The solution
is to change the configuration to another channel or select all.
Possibility 3. Some element of the calculation does not have data.
The calculation of services depends on information from four different editors:
a. Intervention coverages
b. Population in need
c. Delivery channels

OneHealth Start-up Manual (February 2016)
47
If for any one of these there is a zero for your particular intervention, then the calculation of services will be zero.
Zero costs are reported for an intervention
Possibility 1. The configuration for the output has been set to report the costs for a delivery channel where
there are no such service s are offered.
Possibility 2. Zero services have been calculated (see above for potential solutions).
Possibility 3. Resource requirements have not been completed for the intervention. Every intervention has
a set of associated resource requirements. If these resource requirements have not been specified there will
be no costs associated with the intervention.
Unusually large costs or unusually large number of services are reported for an intervention
Possibility 1. The population in need is set at a value greater than the reality. Examples of where this can
happen are:
The population in need is set at 100 or some other large value when in fact not all of the target
population are eligible or in need of the intervention. For example, not all women giving birth need
treatment for pre-eclampsia.
The intervention is “user defined intervention”. In this case the default target population is the
entire population, including both children and adults. If the population in need therefore needs to
reflect both the sex/age group who are targeted as well as the incidence of the condition. For
example, if you have added a new intervention for children under five suffering from malaria, you
would need to adjust the population in need to reflect % of population aged less than five x annual
incidence of malaria.
Possibility 2. The intervention coverage exceeds what is the reality at the baseline.
Possibility 3. The cost per intervention is not realistic. Check the quantities and prices of the resource
requirements for the intervention.
ONEHEALTH Start up MANUAL (February 2016)
48
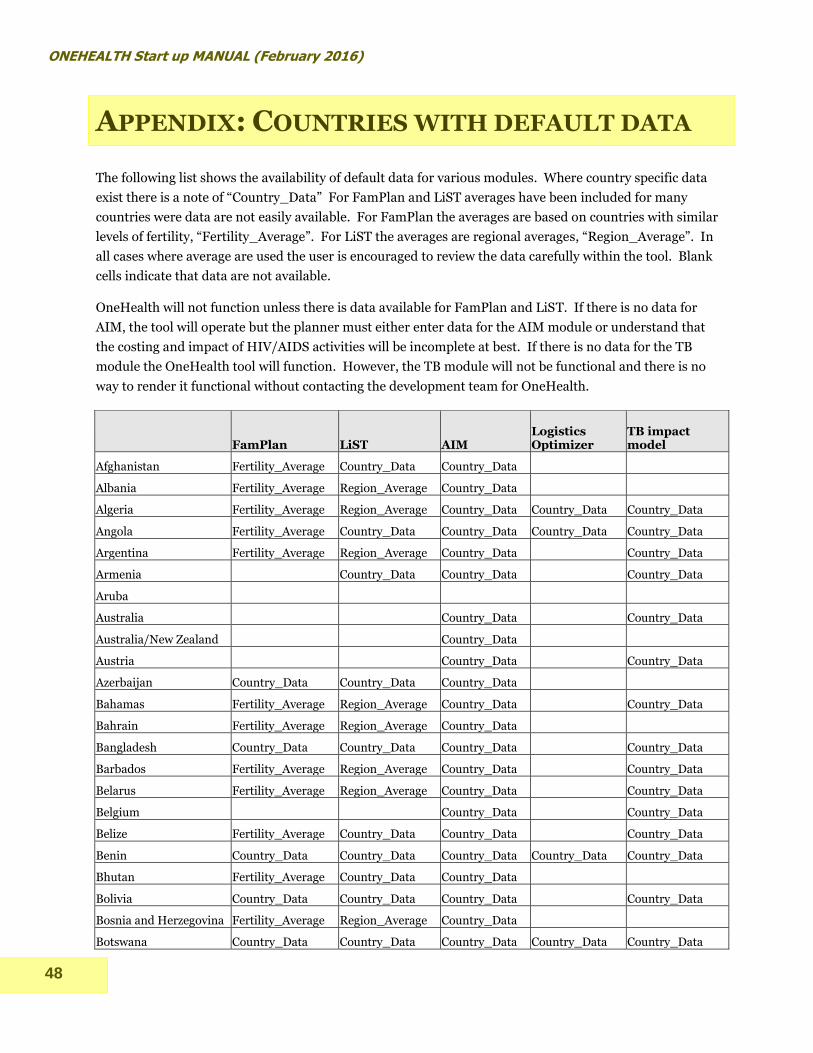
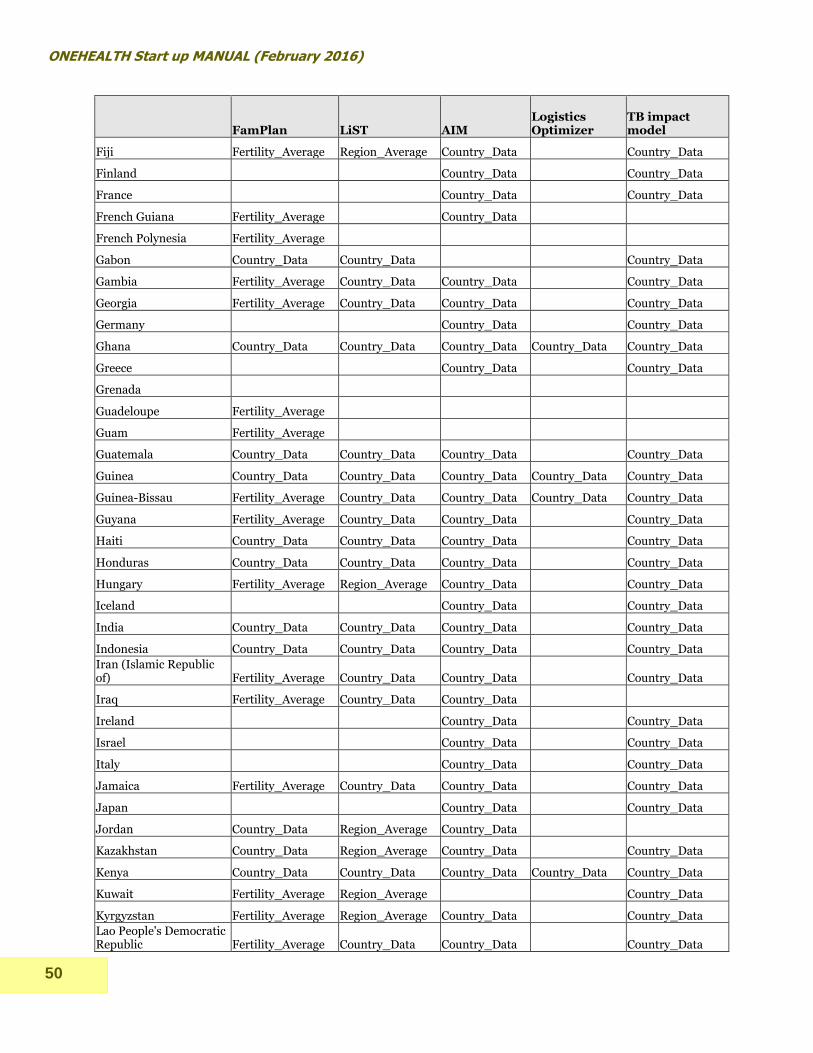
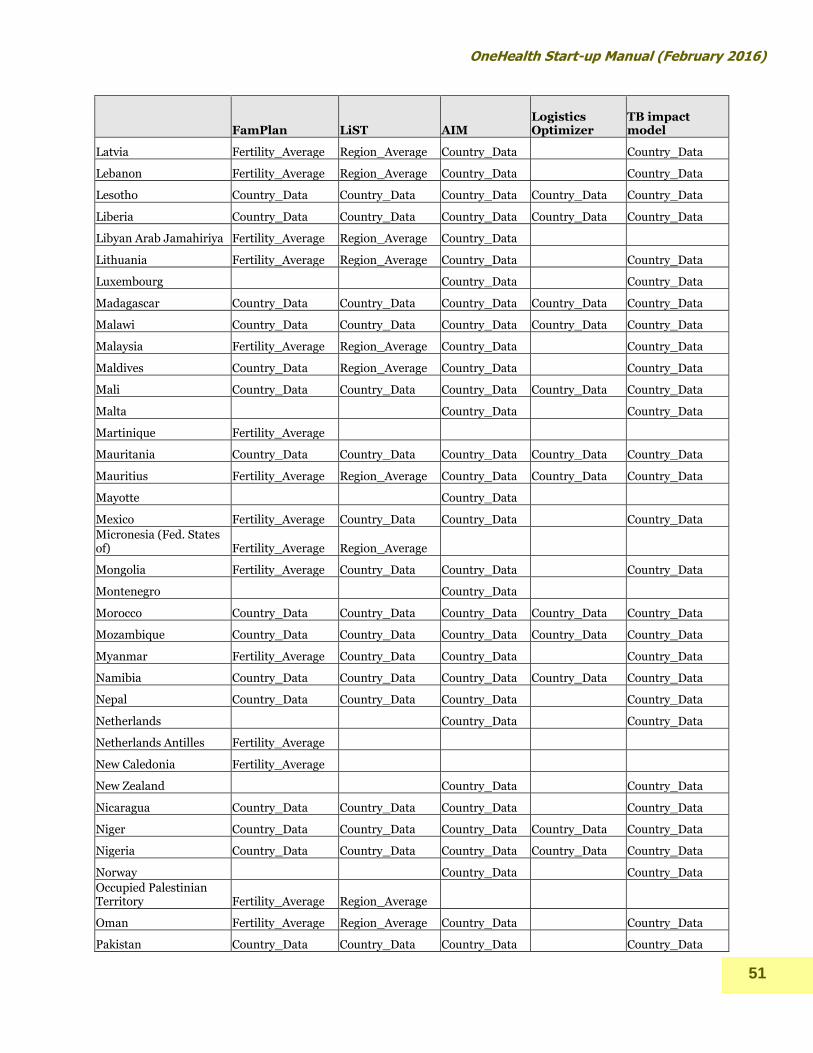
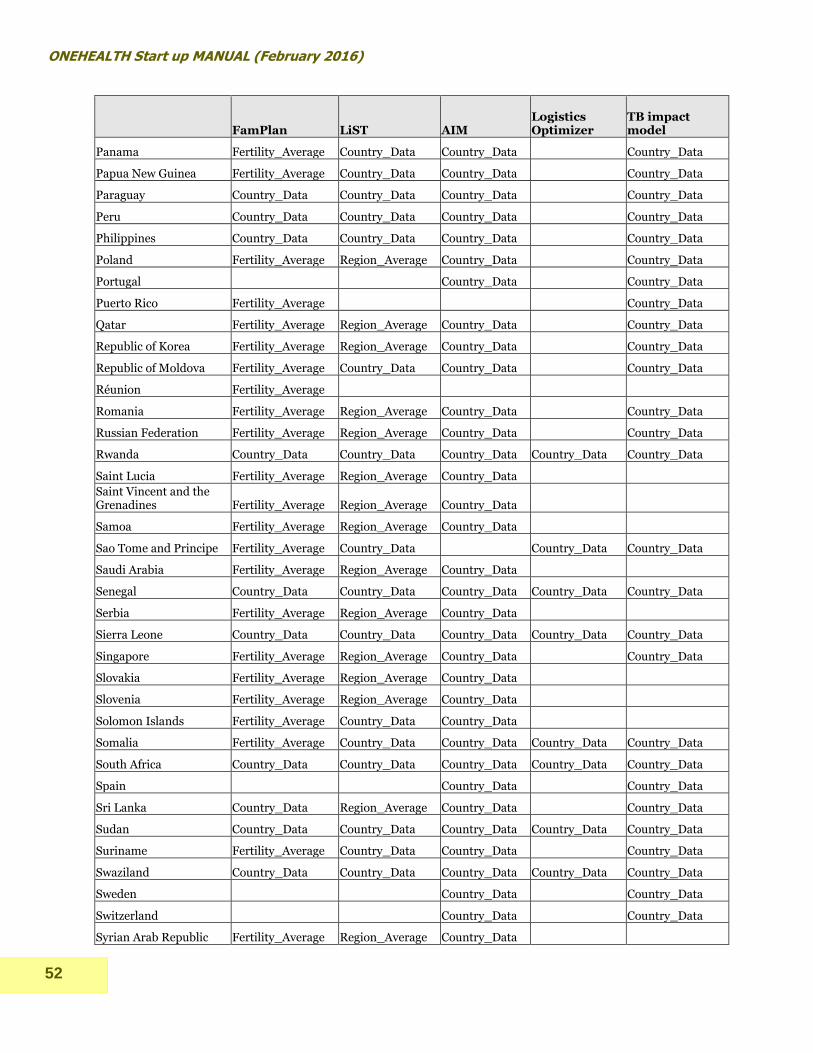
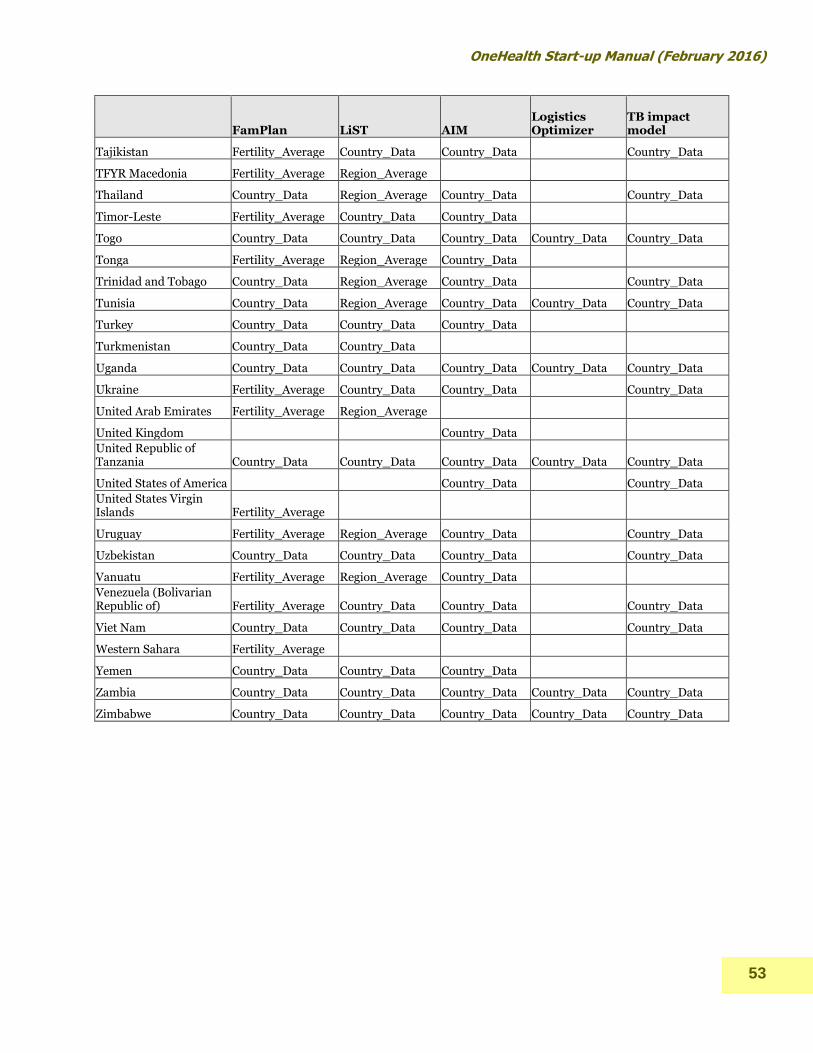
APPENDIX: COUNTRIES WITH DEFAULT DATA
The following list shows the availability of default data for various modules. Where country specific data
exist there is a note of “Country_Data” For FamPlan and LiST averages have been included for many
countries were data are not easily available. For FamPlan the averages are based on countries with similar
levels of fertility, “Fertility_Average”. For LiST the averages are regional averages, “Region_Average”. In
all cases where average are used the user is encouraged to review the data carefully within the tool. Blank
cells indicate that data are not available.
OneHealth will not function unless there is data available for FamPlan and LiST. If there is no data for
AIM, the tool will operate but the planner must either enter data for the AIM module or understand that
the costing and impact of HIV/AIDS activities will be incomplete at best. If there is no data for the TB
module the OneHealth tool will function. However, the TB module will not be functional and there is no
way to render it functional without contacting the development team for OneHealth.
FamPlan LiST AIM Logistics Optimizer
TB impact model
Afghanistan Fertility_Average Country_Data Country_Data
Albania Fertility_Average Region_Average Country_Data
Algeria Fertility_Average Region_Average Country_Data Country_Data Country_Data
Angola Fertility_Average Country_Data Country_Data Country_Data Country_Data
Argentina Fertility_Average Region_Average Country_Data Country_Data
Armenia Country_Data Country_Data Country_Data
Aruba
Australia Country_Data Country_Data
Australia/New Zealand Country_Data
Austria Country_Data Country_Data
Azerbaijan Country_Data Country_Data Country_Data
Bahamas Fertility_Average Region_Average Country_Data Country_Data
Bahrain Fertility_Average Region_Average Country_Data
Bangladesh Country_Data Country_Data Country_Data Country_Data
Barbados Fertility_Average Region_Average Country_Data Country_Data
Belarus Fertility_Average Region_Average Country_Data Country_Data
Belgium Country_Data Country_Data
Belize Fertility_Average Country_Data Country_Data Country_Data
Benin Country_Data Country_Data Country_Data Country_Data Country_Data
Bhutan Fertility_Average Country_Data Country_Data
Bolivia Country_Data Country_Data Country_Data Country_Data
Bosnia and Herzegovina Fertility_Average Region_Average Country_Data
Botswana Country_Data Country_Data Country_Data Country_Data Country_Data

OneHealth Start-up Manual (February 2016)
49
FamPlan LiST AIM Logistics Optimizer
TB impact model
Brazil Country_Data Country_Data Country_Data Country_Data
Brunei Darussalam Fertility_Average Region_Average
Bulgaria Fertility_Average Region_Average Country_Data Country_Data
Burkina Faso Country_Data Country_Data Country_Data Country_Data Country_Data
Burundi Country_Data Country_Data Country_Data Country_Data Country_Data
Cambodia Country_Data Country_Data Country_Data Country_Data
Cameroon Country_Data Country_Data Country_Data Country_Data Country_Data
Canada Country_Data Country_Data
Cape Verde Fertility_Average Region_Average Country_Data Country_Data
Central African Republic Country_Data Country_Data Country_Data Country_Data Country_Data
Chad Country_Data Country_Data Country_Data Country_Data Country_Data
Channel Islands
Chile Fertility_Average Region_Average Country_Data Country_Data
China Fertility_Average Country_Data Country_Data Country_Data
China, Hong Kong SAR
China, Macao SAR
Colombia Country_Data Country_Data Country_Data Country_Data
Comoros Country_Data Country_Data Country_Data Country_Data Country_Data
Congo Country_Data Country_Data Country_Data Country_Data Country_Data
Costa Rica Fertility_Average Country_Data Country_Data Country_Data
Côte d'Ivoire Country_Data Country_Data Country_Data Country_Data
Croatia Fertility_Average Region_Average Country_Data
Cuba Fertility_Average Country_Data Country_Data Country_Data
Cyprus
Czech Republic Fertility_Average Region_Average Country_Data Country_Data
Dem. People's Republic of Korea Country_Data
Democratic Republic of the Congo Fertility_Average Country_Data Country_Data Country_Data Country_Data
Denmark Country_Data Country_Data
Djibouti Fertility_Average Country_Data Country_Data Country_Data Country_Data
Dominican Republic Country_Data Country_Data Country_Data Country_Data
Ecuador Country_Data Country_Data Country_Data Country_Data
Egypt Country_Data Country_Data Country_Data Country_Data Country_Data
El Salvador Country_Data Country_Data Country_Data Country_Data
Equatorial Guinea Fertility_Average Country_Data Country_Data Country_Data Country_Data
Eritrea Country_Data Country_Data Country_Data Country_Data Country_Data
Estonia Fertility_Average Region_Average Country_Data Country_Data
Ethiopia Country_Data Country_Data Country_Data Country_Data Country_Data
ONEHEALTH Start up MANUAL (February 2016)
50
FamPlan LiST AIM Logistics Optimizer
TB impact model
Fiji Fertility_Average Region_Average Country_Data Country_Data
Finland Country_Data Country_Data
France Country_Data Country_Data
French Guiana Fertility_Average Country_Data
French Polynesia Fertility_Average
Gabon Country_Data Country_Data Country_Data
Gambia Fertility_Average Country_Data Country_Data Country_Data
Georgia Fertility_Average Country_Data Country_Data Country_Data
Germany Country_Data Country_Data
Ghana Country_Data Country_Data Country_Data Country_Data Country_Data
Greece Country_Data Country_Data
Grenada
Guadeloupe Fertility_Average
Guam Fertility_Average
Guatemala Country_Data Country_Data Country_Data Country_Data
Guinea Country_Data Country_Data Country_Data Country_Data Country_Data
Guinea-Bissau Fertility_Average Country_Data Country_Data Country_Data Country_Data
Guyana Fertility_Average Country_Data Country_Data Country_Data
Haiti Country_Data Country_Data Country_Data Country_Data
Honduras Country_Data Country_Data Country_Data Country_Data
Hungary Fertility_Average Region_Average Country_Data Country_Data
Iceland Country_Data Country_Data
India Country_Data Country_Data Country_Data Country_Data
Indonesia Country_Data Country_Data Country_Data Country_Data
Iran (Islamic Republic of) Fertility_Average Country_Data Country_Data Country_Data
Iraq Fertility_Average Country_Data Country_Data
Ireland Country_Data Country_Data
Israel Country_Data Country_Data
Italy Country_Data Country_Data
Jamaica Fertility_Average Country_Data Country_Data Country_Data
Japan Country_Data Country_Data
Jordan Country_Data Region_Average Country_Data
Kazakhstan Country_Data Region_Average Country_Data Country_Data
Kenya Country_Data Country_Data Country_Data Country_Data Country_Data
Kuwait Fertility_Average Region_Average Country_Data
Kyrgyzstan Fertility_Average Region_Average Country_Data Country_Data
Lao People's Democratic Republic Fertility_Average Country_Data Country_Data Country_Data
OneHealth Start-up Manual (February 2016)
51
FamPlan LiST AIM Logistics Optimizer
TB impact model
Latvia Fertility_Average Region_Average Country_Data Country_Data
Lebanon Fertility_Average Region_Average Country_Data Country_Data
Lesotho Country_Data Country_Data Country_Data Country_Data Country_Data
Liberia Country_Data Country_Data Country_Data Country_Data Country_Data
Libyan Arab Jamahiriya Fertility_Average Region_Average Country_Data
Lithuania Fertility_Average Region_Average Country_Data Country_Data
Luxembourg Country_Data Country_Data
Madagascar Country_Data Country_Data Country_Data Country_Data Country_Data
Malawi Country_Data Country_Data Country_Data Country_Data Country_Data
Malaysia Fertility_Average Region_Average Country_Data Country_Data
Maldives Country_Data Region_Average Country_Data Country_Data
Mali Country_Data Country_Data Country_Data Country_Data Country_Data
Malta Country_Data Country_Data
Martinique Fertility_Average
Mauritania Country_Data Country_Data Country_Data Country_Data Country_Data
Mauritius Fertility_Average Region_Average Country_Data Country_Data Country_Data
Mayotte Country_Data
Mexico Fertility_Average Country_Data Country_Data Country_Data
Micronesia (Fed. States of) Fertility_Average Region_Average
Mongolia Fertility_Average Country_Data Country_Data Country_Data
Montenegro Country_Data
Morocco Country_Data Country_Data Country_Data Country_Data Country_Data
Mozambique Country_Data Country_Data Country_Data Country_Data Country_Data
Myanmar Fertility_Average Country_Data Country_Data Country_Data
Namibia Country_Data Country_Data Country_Data Country_Data Country_Data
Nepal Country_Data Country_Data Country_Data Country_Data
Netherlands Country_Data Country_Data
Netherlands Antilles Fertility_Average
New Caledonia Fertility_Average
New Zealand Country_Data Country_Data
Nicaragua Country_Data Country_Data Country_Data Country_Data
Niger Country_Data Country_Data Country_Data Country_Data Country_Data
Nigeria Country_Data Country_Data Country_Data Country_Data Country_Data
Norway Country_Data Country_Data
Occupied Palestinian Territory Fertility_Average Region_Average
Oman Fertility_Average Region_Average Country_Data Country_Data
Pakistan Country_Data Country_Data Country_Data Country_Data
ONEHEALTH Start up MANUAL (February 2016)
52
FamPlan LiST AIM Logistics Optimizer
TB impact model
Panama Fertility_Average Country_Data Country_Data Country_Data
Papua New Guinea Fertility_Average Country_Data Country_Data Country_Data
Paraguay Country_Data Country_Data Country_Data Country_Data
Peru Country_Data Country_Data Country_Data Country_Data
Philippines Country_Data Country_Data Country_Data Country_Data
Poland Fertility_Average Region_Average Country_Data Country_Data
Portugal Country_Data Country_Data
Puerto Rico Fertility_Average Country_Data
Qatar Fertility_Average Region_Average Country_Data Country_Data
Republic of Korea Fertility_Average Region_Average Country_Data Country_Data
Republic of Moldova Fertility_Average Country_Data Country_Data Country_Data
Réunion Fertility_Average
Romania Fertility_Average Region_Average Country_Data Country_Data
Russian Federation Fertility_Average Region_Average Country_Data Country_Data
Rwanda Country_Data Country_Data Country_Data Country_Data Country_Data
Saint Lucia Fertility_Average Region_Average Country_Data
Saint Vincent and the Grenadines Fertility_Average Region_Average Country_Data
Samoa Fertility_Average Region_Average Country_Data
Sao Tome and Principe Fertility_Average Country_Data Country_Data Country_Data
Saudi Arabia Fertility_Average Region_Average Country_Data
Senegal Country_Data Country_Data Country_Data Country_Data Country_Data
Serbia Fertility_Average Region_Average Country_Data
Sierra Leone Country_Data Country_Data Country_Data Country_Data Country_Data
Singapore Fertility_Average Region_Average Country_Data Country_Data
Slovakia Fertility_Average Region_Average Country_Data
Slovenia Fertility_Average Region_Average Country_Data
Solomon Islands Fertility_Average Country_Data Country_Data
Somalia Fertility_Average Country_Data Country_Data Country_Data Country_Data
South Africa Country_Data Country_Data Country_Data Country_Data Country_Data
Spain Country_Data Country_Data
Sri Lanka Country_Data Region_Average Country_Data Country_Data
Sudan Country_Data Country_Data Country_Data Country_Data Country_Data
Suriname Fertility_Average Country_Data Country_Data Country_Data
Swaziland Country_Data Country_Data Country_Data Country_Data Country_Data
Sweden Country_Data Country_Data
Switzerland Country_Data Country_Data
Syrian Arab Republic Fertility_Average Region_Average Country_Data
OneHealth Start-up Manual (February 2016)
53
FamPlan LiST AIM Logistics Optimizer
TB impact model
Tajikistan Fertility_Average Country_Data Country_Data Country_Data
TFYR Macedonia Fertility_Average Region_Average
Thailand Country_Data Region_Average Country_Data Country_Data
Timor-Leste Fertility_Average Country_Data Country_Data
Togo Country_Data Country_Data Country_Data Country_Data Country_Data
Tonga Fertility_Average Region_Average Country_Data
Trinidad and Tobago Country_Data Region_Average Country_Data Country_Data
Tunisia Country_Data Region_Average Country_Data Country_Data Country_Data
Turkey Country_Data Country_Data Country_Data
Turkmenistan Country_Data Country_Data
Uganda Country_Data Country_Data Country_Data Country_Data Country_Data
Ukraine Fertility_Average Country_Data Country_Data Country_Data
United Arab Emirates Fertility_Average Region_Average
United Kingdom Country_Data
United Republic of Tanzania Country_Data Country_Data Country_Data Country_Data Country_Data
United States of America Country_Data Country_Data
United States Virgin Islands Fertility_Average
Uruguay Fertility_Average Region_Average Country_Data Country_Data
Uzbekistan Country_Data Country_Data Country_Data Country_Data
Vanuatu Fertility_Average Region_Average Country_Data
Venezuela (Bolivarian Republic of) Fertility_Average Country_Data Country_Data Country_Data
Viet Nam Country_Data Country_Data Country_Data Country_Data
Western Sahara Fertility_Average
Yemen Country_Data Country_Data Country_Data
Zambia Country_Data Country_Data Country_Data Country_Data Country_Data
Zimbabwe Country_Data Country_Data Country_Data Country_Data Country_Data

ONEHEALTH Start up MANUAL (February 2016)
54
OneHealth Start-up Manual (February 2016)
55
APPENDIX: POPULATION AND COVERAGE
CONCEPTS
The determinants for intervention costs are the number of people receiving the intervention and
the quantity of resources required to deliver the intervention per person.
In order to calculate the number of people receiving the services, OneHealth includes data entry
fields for the following:
Population
Target Population
Population in Need
Coverage All four of the above must have data entered into them in order for the tool to be able to estimate
the number of people receiving the intervention by year.
Population: The overall demographic parameters for the population are entered into the Demproj
module. There are country-specific defaults here.
Target Population: this is where the sub-population that will receive the intervention is
identified. There are global defaults available here for each intervention.
Examples of target population include:
pregnant women
adolescents
children aged < 1 month
children aged 0-59 months
children aged 1-59 months
total population
Etc.
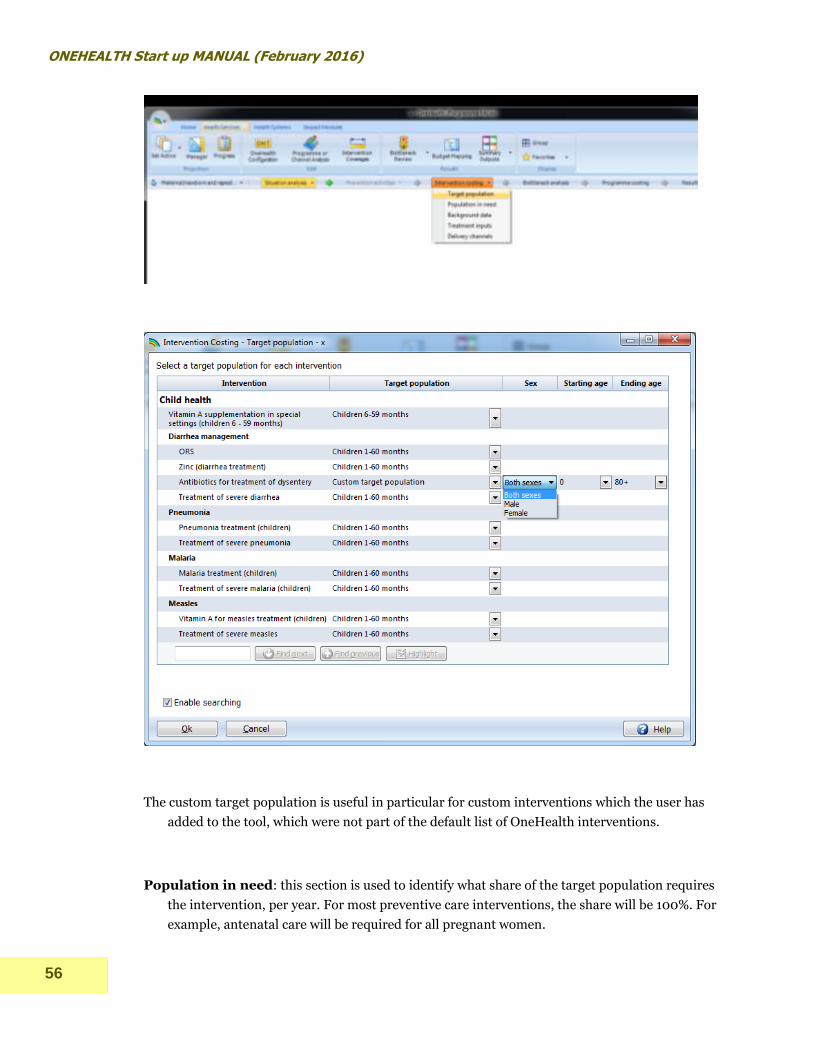
The user can select from the drop-down list of default populations, or specify the target population
of each intervention as shown below:
ONEHEALTH Start up MANUAL (February 2016)
56
The custom target population is useful in particular for custom interventions which the user has
added to the tool, which were not part of the default list of OneHealth interventions.
Population in need: this section is used to identify what share of the target population requires
the intervention, per year. For most preventive care interventions, the share will be 100%. For
example, antenatal care will be required for all pregnant women.
OneHealth Start-up Manual (February 2016)
57
Population in need is determined by incidence and prevalence of conditions, and treatment
guidelines.
In some instances the population in need may be > 100%. For example, management
of diarrhea with ORS. The target population is children aged 0-59 months. If we put 100%
population in need, this means that each child will on average receive the intervention once per
year. However in many settings the incidence of diarrhea may be greater than 1.0. For
example, if the incidence of diarrhea in children is estimated at 3.5 episodes per year, the
Population in need will then be 350%. If 1 % of all diarrhea cases are estimated to be severe,
then the population in need for treatment of severe diarrhea is 3.5% (calculated as 350% x 1%).
For another example, take treatment of malaria in pregnant women. Here the target population is
pregnant women, and the population in need is the percentage of pregnant women who will
need treatment of malaria, per year.
Coverage: The coverage measure refers to how many, out of the population in need, are actually
receiving the intervention. This is an indicator commonly measured in household surveys such
as Demographic and Health Surveys (DHS) and Multiple Indicator Cluster Surveys (MICS).
E.g., among children with a fever during the past two weeks, how many were taken to a health
provider for treatment?
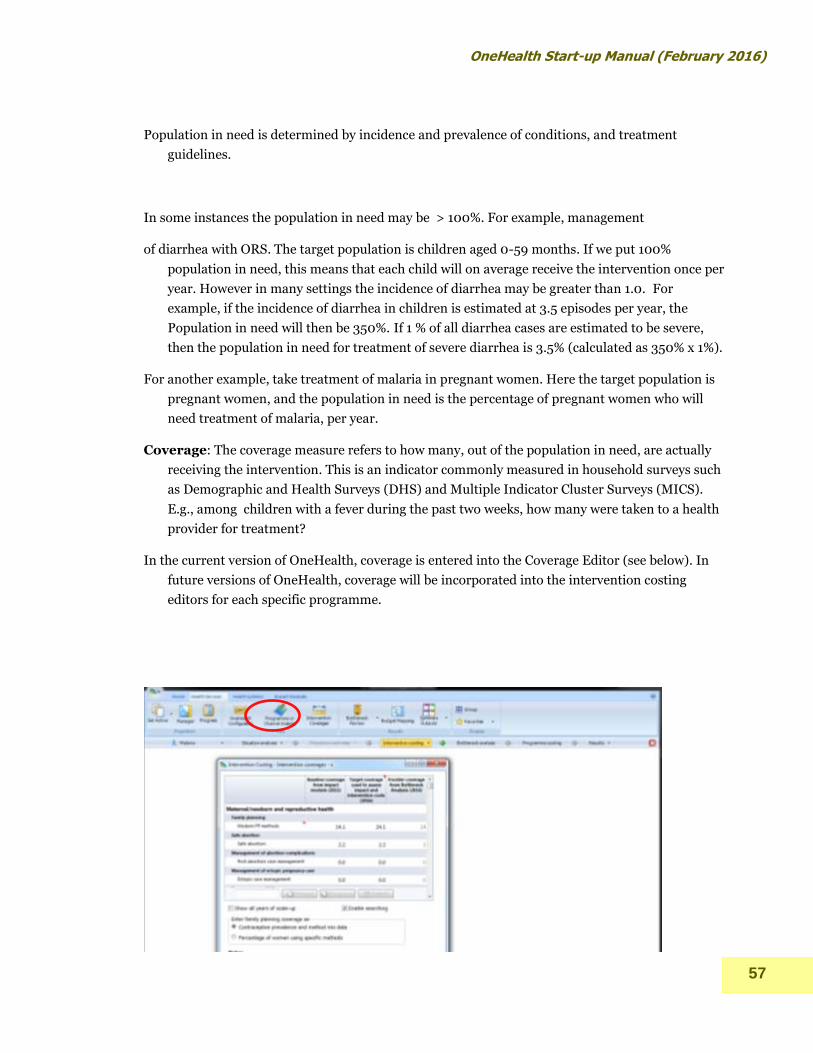
In the current version of OneHealth, coverage is entered into the Coverage Editor (see below). In
future versions of OneHealth, coverage will be incorporated into the intervention costing
editors for each specific programme.
ONEHEALTH Start up MANUAL (February 2016)
58
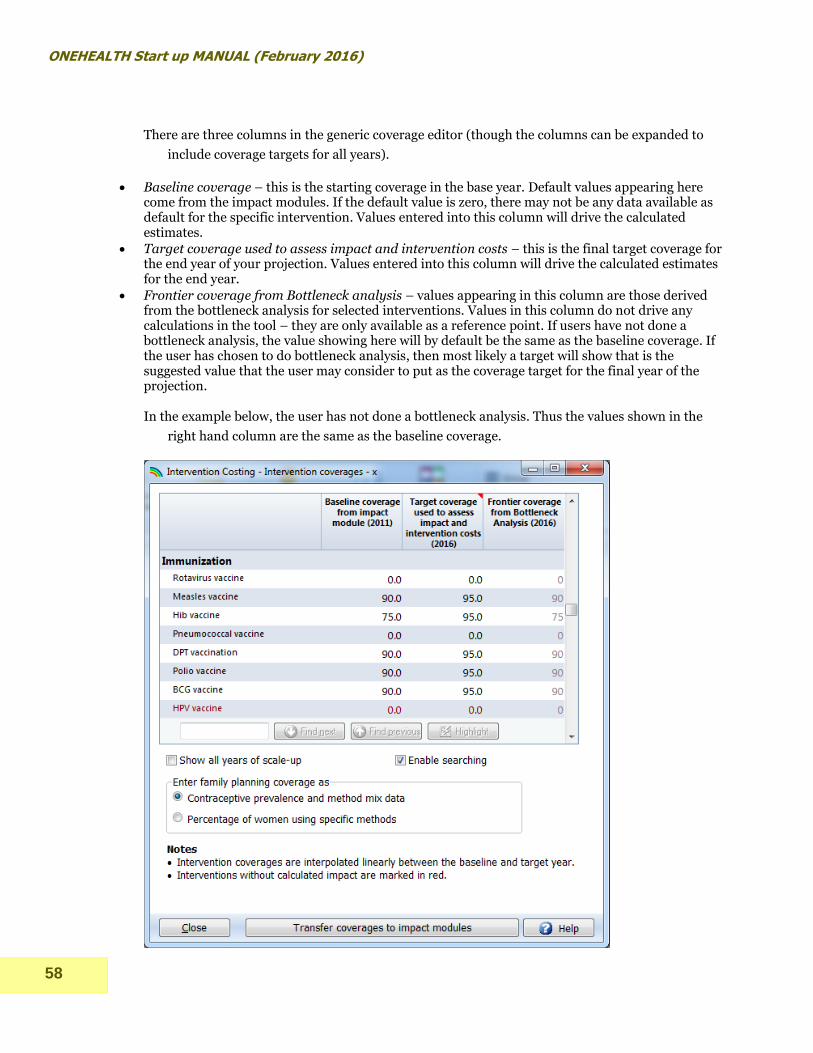
There are three columns in the generic coverage editor (though the columns can be expanded to
include coverage targets for all years).
Baseline coverage – this is the starting coverage in the base year. Default values appearing here come from the impact modules. If the default value is zero, there may not be any data available as default for the specific intervention. Values entered into this column will drive the calculated estimates.
Target coverage used to assess impact and intervention costs – this is the final target coverage for the end year of your projection. Values entered into this column will drive the calculated estimates for the end year.
Frontier coverage from Bottleneck analysis – values appearing in this column are those derived from the bottleneck analysis for selected interventions. Values in this column do not drive any calculations in the tool – they are only available as a reference point. If users have not done a bottleneck analysis, the value showing here will by default be the same as the baseline coverage. If the user has chosen to do bottleneck analysis, then most likely a target will show that is the suggested value that the user may consider to put as the coverage target for the final year of the projection. In the example below, the user has not done a bottleneck analysis. Thus the values shown in the
right hand column are the same as the baseline coverage.
OneHealth Start-up Manual (February 2016)
59
Notes:
When in doubt about what value to enter for the Population in Need, go into the Target Population editor and review what target population has been selected.
The OneHealth tool includes pop-up texts to guide users on the default definitions for the Population in Need, Target Population, and Coverage. These are shown as red triangles in the upper right hand corner of the cell. Text will appear when the user hovers the cursor above the flagged cell..
Examples for illustration:
Measles Vaccine
How should data be inputted?
The target population can be put as births or children <1 .
The population in need is 100% since the recommendation is that all children are immunized.
The current coverage may be 80-90% depending on the country.
School health programme
A new school health programme will be set up to target children age 9-12 years in rural areas. The
ambition is that 60% of schools in rural areas should be covered by 2015. How should data be
inputted?
The target population can be customized to children from age 9 to 12. Indicate whether both sexes are covered or select males / females.
The population in need is the percentage of children living in rural areas, who are enrolled in school. In this example assume the proportion is 75% population in rural areas and 90% of those are enrolled in school. The population in need is then 75% x 90% = 67.5%
The current coverage is 0% and the target coverage for 2015 is set to 60%.
PMTCT
How should data be inputted?
The target population should be set to “Women in need of PMTCT”. This is a specific parameter that pulls the relevant data from the HIV impact module.
The population in need here would be 100% since the target population is already defined as Women in need of PMTCT.
The current coverage can target coverage is country-specific.