One Voice Pre-Legislative Forum Maximizing Federal Funds: The State Budget September 27, 2006
38
www.cppp.org One Voice Pre-Legislative Forum One Voice Pre-Legislative Forum Maximizing Federal Funds: Maximizing Federal Funds: The State Budget The State Budget September 27, 2006 September 27, 2006 Eva DeLuna Castro, Senior Budget Analyst Center for Public Policy Priorities [email protected]
description
One Voice Pre-Legislative Forum Maximizing Federal Funds: The State Budget September 27, 2006. Eva DeLuna Castro, Senior Budget Analyst Center for Public Policy Priorities [email protected]. Presentation Outline. Brought to you by the federal government: Information 2) Money - PowerPoint PPT Presentation
Transcript of One Voice Pre-Legislative Forum Maximizing Federal Funds: The State Budget September 27, 2006

www.cppp.org
One Voice Pre-Legislative ForumOne Voice Pre-Legislative Forum
Maximizing Federal Funds: Maximizing Federal Funds: The State BudgetThe State Budget
September 27, 2006September 27, 2006
Eva DeLuna Castro, Senior Budget AnalystCenter for Public Policy Priorities

www.cppp.org
Presentation Outline
• Brought to you by the federal government:
1) Information 2) Money
• More details on how federal funds in the state budget are serving Harris County; how that could change in 2007 legislative session

www.cppp.org
Texas and U.S. Poverty, 2004-05
Texas U.S.
Poverty rate 16.3% 12.7%
Total in poverty 3.675 million 37.0 million
By ethnicity: In Texas, 23% of African-Americans; 26% of Hispanics; 7.5% of non-Hispanic Whites; and 12% of Asian-Americans live below the poverty line ($9,800/year for one person; $16,600 for a family of 3)
By age group: 25% of children in Texas live below the poverty line; 13% of Texans ages 65 and over live in poverty. US averages: 19% poverty for children; 10% for age 65 and over.
Source: U.S. Census Bureau, March Current Population Survey

www.cppp.org
ACS 2005: Growth Continues, But Poverty Increases Even More
2.929 2.971 3.002 3.010 3.071 2.995
0.430 0.448 0.513 0.544 0.6530.5290.0
1.0
2.0
3.0
4.0
2000 2001 2002 2003 2004 2005
Mill
ion
s o
f Har
ris
Co
un
ty R
esid
ents
Poor Above poverty line
Source: U.S. Census Bureau, 2005 American Community Survey

www.cppp.org
ACS 2005: Child Poverty Increase is Especially Troubling
8
1210
1113
12
1818 1921 22
26
21
15151513 13
0
10
20
30
2000 2001 2002 2003 2004 2005
Po
vert
y R
ate
in H
arri
s C
ou
nty
Child povertyElderly Poverty (65+)Overall Poverty
Source: U.S. Census Bureau, 2005 American Community Survey

www.cppp.org
Harris County Residents, 20053.6 million people total
Afr-Am, Below Poverty Line, 169,116 , 5%
Hispanic, Below Poverty Line, 353,302 , 10%
White/Other, Below Poverty Line, 128,412 ,
4%
African-American,
Above Poverty Line, 477,677 ,
13%
Hispanic, Above Poverty Line,
1,016,175 , 28%
White/Other Above Poverty
Line, 1,489,710 , 40%
Poverty rates by ethnicity:
18% overall
Hispanic: 26%
African-American: 26%
White/Other: 8%
Source: U.S. Census Bureau, 2005 American Community Survey

www.cppp.org
Harris County Residents by Age and Poverty, 2005
185,416311,689 32,75828,935
92,032
1,677,855
238,392294,565
542,237
230,513
0
500,000
1,000,000
1,500,000
2,000,000
Under 5 5 to 17 18 to 54 55 to 64 65 and over
Above poverty line
In poverty
Poverty rates: 28.5% 25.5% 15.7% 8.9% 12.1%
Source: U.S. Census Bureau, 2005 American Community Survey

www.cppp.org
51,68575,311144,413
0
200,000
400,000
600,000
Less than HS HS Graduate Some College/2 Yr Deg
Bachelor's Grad./ Prof.
Above poverty
Below poverty line
Harris County Adults by Education & Poverty Status, 2005 (Age 25+)
Poverty rates: 27.4% 14.0% 9.2% 3.5% 3.6%
Source: U.S. Census Bureau, 2005 American Community Survey
www.cppp.org
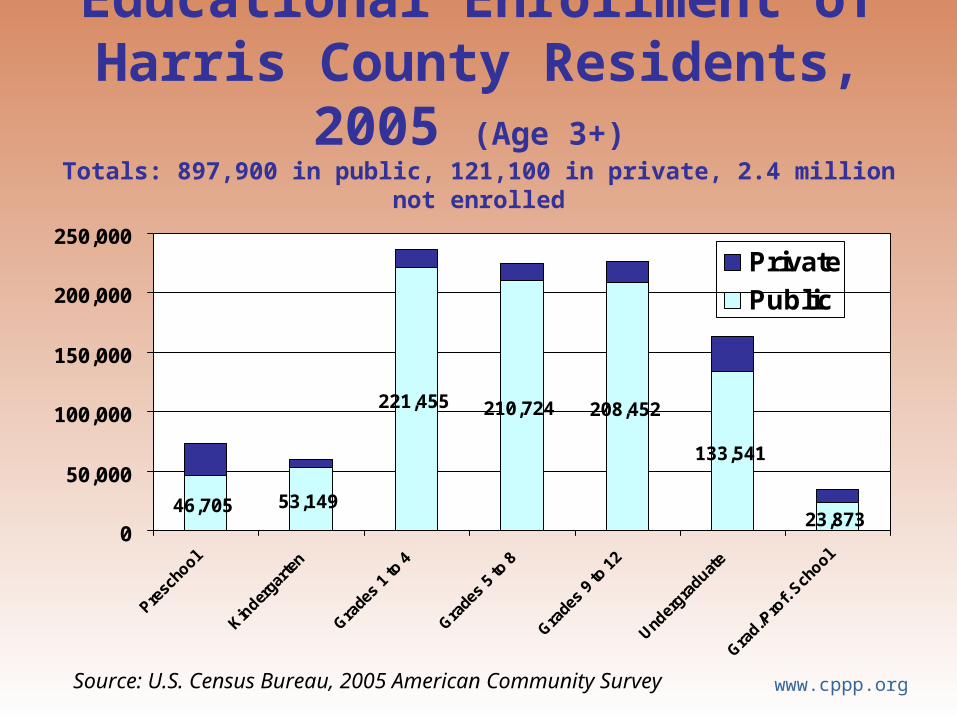
Educational Enrollment of Harris County Residents, 2005 (Age 3+)
Totals: 897,900 in public, 121,100 in private, 2.4 million not enrolled
46,705 53,149
221,455 210,724 208,452
133,541
23,8730
50,000
100,000
150,000
200,000
250,000
Presc
hool
Kinder
garte
n
Grade
s 1
to 4
Grade
s 5
to 8
Grade
s 9
to 1
2
Under
graduat
e
Grad.
/Pro
f. Sch
ool
Private
Public
Source: U.S. Census Bureau, 2005 American Community Survey

www.cppp.org
39
32
7
25
8
13
7
8
3
2
12
10
24
10
0% 20% 40% 60% 80% 100%
Percent of federal spending
Medicare/ Military & Direct payments Medicaid Hwys Other Nonmilitary Social Sec Veterans to people/firms Grants Empl/Goods
Texas$142 b
$6,313 per capita
HarrisCounty$15.8 b
$4,388 per capita
Source: U.S. Census Bureau, Consolidated Federal Funds Reports
Federal Spending in Harris County, 2004

www.cppp.org
$0 $2 $4 $6 $8 $10
State only
K-12 HHSC Aging/Disability
Other HHS Highways/DPS Higher Ed
Prisons Workforce Other
K-12: $2.0 billion (state aid to local school districts; Teacher Retirement System)HHSC: $753 million Aging/Disability: $157 million FPS/DSHS/DARS: $86 millionHighways & Dept. of Public Safety: $617 million Higher Education: $808 million
Prisons (TDCJ): $559 million Workforce Commission: $55 million All Other: $1.2 b
$6.2 billion
State Govt. Spending in Harris County, 2005
Source: Texas Comptroller of Public Accounts, County Expenditures

www.cppp.org
$0 $2 $4 $6 $8 $10
State only
With Federal
K-12 HHSC Aging/Disability
Other HHS Highways/DPS Higher Ed
Prisons Workforce Other
Federal funds added for No Child Left Behind, Special Education, School Lunch/Breakfast, Voc. Ed., and more:
$478 million
State Govt. Spending of K-12 Federal Funds
Source: Texas Comptroller of Public Accounts, County Expenditures

www.cppp.org
$0 $2 $4 $6 $8 $10
State only
With Federal
K-12 HHSC Aging/Disability
Other HHS Highways/DPS Higher Ed
Prisons Workforce Other
Federal funds added for Medicaid, CHIP, TANF, Food Stamps, and more:
$1.2 billion
State Govt. Spending, HHSC Federal Funds
Source: Texas Comptroller of Public Accounts, County Expenditures
www.cppp.org
$0 $2 $4 $6 $8 $10
State only
With Federal
K-12 HHSC Aging/Disability
Other HHS Highways/DPS Higher Ed
Prisons Workforce Other
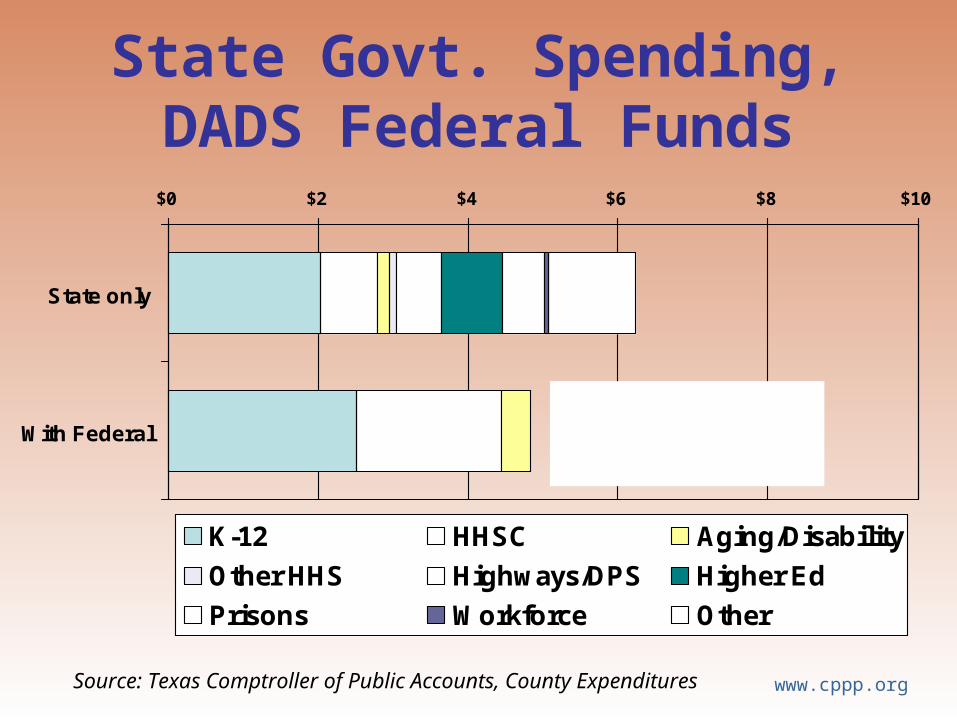
Federal funds added for nursing home & community long-term care and more:
$235 million
State Govt. Spending, DADS Federal Funds
Source: Texas Comptroller of Public Accounts, County Expenditures

www.cppp.org
$0 $2 $4 $6 $8 $10
State only
With Federal
K-12 HHSC Aging/Disability
Other HHS Highways/DPS Higher Ed
Prisons Workforce Other
Federal funds added for child protection, foster care, public health, mental health, ECI, and more:
$110 million
State Govt. Spending of Other HHS Federal Funds
Source: Texas Comptroller of Public Accounts, County Expenditures

www.cppp.org
$0 $2 $4 $6 $8 $10
State only
With Federal
K-12 HHSC Aging/Disability
Other HHS Highways/DPS Higher Ed
Prisons Workforce Other
Federal funds added for highways, transit and more:
$628 million
State Govt. Spending of Federal Highway Funds
Source: Texas Comptroller of Public Accounts, County Expenditures

www.cppp.org
$0 $2 $4 $6 $8 $10
State only
With Federal
K-12 HHSC Aging/Disability
Other HHS Highways/DPS Higher Ed
Prisons Workforce Other
Higher Ed: Minimal Federal Funds in State Budget
Source: Texas Comptroller of Public Accounts, County Expenditures

www.cppp.org
$0 $2 $4 $6 $8 $10
State only
With Federal
K-12 HHSC Aging/Disability
Other HHS Highways/DPS Higher Ed
Prisons Workforce Other
Prison System Doesn’t Add Much in Federal Funds Either
Source: Texas Comptroller of Public Accounts, County Expenditures

www.cppp.org
$0 $2 $4 $6 $8 $10
State only
With Federal
K-12 HHSC Aging/Disability
Other HHS Highways/DPS Higher Ed
Prisons Workforce Other
Federal funds added for workforce, child care, & more:
$403 million
Workforce System Almost Entirely Federally Funded
Source: Texas Comptroller of Public Accounts, County Expenditures

www.cppp.org
$0 $2 $4 $6 $8 $10
State only
With Federal
K-12 HHSC Aging/Disability
Other HHS Highways/DPS Higher Ed
Prisons Workforce Other
Federal funds added for child support enforcement,
housing/comm dev, envir. protection, & more:
$188 million$6.2 billion
$9.5 billion
Other State Govt. Spending of Federal Funds, 2005
Source: Texas Comptroller of Public Accounts, County Expenditures

www.cppp.org
Recap: State and Federal Funding of State Govt. Services in Harris County, 2005
State Funds
Federal estimate
K-12, Teacher Retirement $2.0 billion $478 million
HHSC (Medicaid, CHIP, TANF, Food Stamps) $753 million $1.2 billion
Aging & Disability $157 million $235 million
Other HHS (FPS, DARS, State Health Svcs) $86 million $110 million
Highways/State troopers $617 million $628 million
Higher Education $808 million $16 million
Prisons (TDCJ) $559 million $5 million
Workforce Commission $55 million $403 million
All Other $1.3 billion $188 million
TOTAL $6.2 billion $3.3 billion
Source: Texas Comptroller of Public Accounts, County Expenditures

www.cppp.org
Boosting Harris County’s Share of State Spending
In 2005, Harris County accounted for 14% of state spending, but it is home to 16% of the state’s residents
How to improve that statistic:
Work with Harris County delegation to see that state formulas to distribute federal funds (county allocations, rates, regional distributions) don’t put local service providers at a disadvantage
Make sure that eligible residents are being served by Medicaid, Food Stamps, other major programs
Understand what budget cuts (10% reduction proposals for 2008-09) will cost in lost federal funds and the services they provide

www.cppp.org
68,522 64,153
118,000 114,647
105,197 102,465
19,556 20,615
0
120,000
240,000
360,000
Sept. 2005 Aug. 2006
65 and over
18 to 64
5 to 17
Under 5
Total: 311,275 Total: 301,880
Recent Changes, Food Stamp Enrollment in Harris County
Source: Texas Health and Human Services Commission

www.cppp.org
Harris County Residents by Age and Poverty, 2005
185,416311,689 32,75828,935
92,032
1,677,855
238,392294,565
542,237
230,513
0
500,000
1,000,000
1,500,000
2,000,000
Under 5 5 to 17 18 to 54 55 to 64 65 and over
Above poverty line
In poverty
Poverty rates: 28.5% 25.5% 15.7% 8.9% 12.1%
Source: U.S. Census Bureau, 2005 American Community Survey

www.cppp.org
21,864
15,696
5,376
3,601
0
10,000
20,000
30,000
Sept. 2005 Jul. 2006
Adults
Children
Recent Changes, TANF Enrollment in Harris County
Source: Texas Health and Human Services Commission

www.cppp.org
Texas Child Medicaid and CHIP Enrollment (Jan. 2002-August 2006)
Sources: Enrollment from Texas Health and Human Services Commission; Uninsured from Census Bureau March Current Population Survey.
2.03
2.16
2.06
2.15
1.311.42
1.341.45
1.0
1.2
1.4
1.6
1.8
2.0
2.2
Jan-02
May-02
Sep-02
Jan-03
May-03
Sep-03
Jan-04
May-04
Sep-04
Jan-05
May-05
Sep-05
Jan-06
May-06
Mill
ion
s o
f c
hild
ren
On Medicaid or CHIP
Uninsured

www.cppp.org
Harris County Medicaid & CHIP Enrollment (August 2005-August 2006)
Source: Texas Health and Human Services Commission.
Aug-05 Sep-05 Oct-05 Nov-05 Dec-05 Jan-06 Feb-06 Mar-06 Apr-06 May-06 Jun-06 Jul-06 Aug-06
CHIP and Child Medicaid
Adult Medicaid
Almost 382,000 children covered in Nov-Dec 2005
About 118,600 in June 2006; by August, back up to 119,500
About 129,000 in January 2006
Below 356,000 in June 2006; back up to 361,200 by August

www.cppp.org
Governor’s Budget Instructions for 2008-09
10% Cut in General Revenue and GR-Dedicated funds: except for Medicaid and foster care CASELOAD (but not COST) increases, most budget proposals for state services must reflect a 10% reduction in state funding, even if this means that state won’t meet minimum match or maintenance of effort (MOE) requirements
Why is this being done? (especially after 5%-cut-instructions in 2005, and 12.5%-cut in 2003)
a) It’s a “useful planning exercise”b) It’ll create confusion about exceptional items needed to keep things from
getting worse (restoration), exceptional items that are “current services” (need more money to do the same thing, because it costs more), and exceptional items that would be an actual improvement or expansion
c) If 10% cuts can actually be implemented, some General Revenue will become available to pay for supplemental spending needs for the current year (fiscal 2007) and/or for newly enacted school property tax cuts
Source: Health and Human Services Commission, LAR 2008-09.

www.cppp.org
Digging a Hole
In billion $ 2008-09 2010-11 Total
HB 3 (business tax) 6.8 7.7 14.5
HB 4 (used cars) 0.1 0.1 0.2
HB 5 (cigarettes) 1.4 1.3 2.7
TOTAL REVENUE 8.3 9.1 17.4
Cost of HB 1 -18.8 -20.2 -39.0
Gap between HB 1 and
HB 3,4,5
-$10.5 b -$11.1 b -$21.6 b

www.cppp.org
State “Own Source” Spending/Revenue
K-12: $47.7 K-12: $32.5
Higher Ed: $19.4
Higher Ed: $17.7
HHS: $22.8
HHS: $19.2
Prisons: $8.7
Prisons: $8.3
Eco. Dev.: $9.2
Eco. Dev.: $9.2
Other: $8.1
Other: $7.0
$-
$20
$40
$60
$80
$100
$120
2006-07 Revenue for 2008-09 Needs, 2008-09
$94 billion
$113 billion $116 billion
“Own Source” = not counting federal funds. “Needs” does not include more than $3 billion in GR funding requested for improvements or restorations.

www.cppp.org
HHSC Budget Request for 2008-09
10% Instructions: would require $72 million cut in General Revenue spending, plus the loss of $106 million in federal funds and layoffs of 550 state employees
Base increase: $711 million more in General Revenue, mostly for caseload growth in Medicaid, would draw down another $611 million in federal funds
Exceptional items:•$1.8 billion in GR to deal with Medicaid and CHIP cost increases—what state pays for medical services/drugs—would draw down $2.8 billion in federal funds; $237 million GR and $370 million federal would restore rates to 2003 levels
•$255 million in GR for HHS waiting lists, mostly for community care, would draw down $282 million in federal funds
•Restoring CHIP perinatal coverage would save $20 million in GR and draw down $157 million more in federal dollars, vs. covering these infants in Medicaid
Source: Health and Human Services Commission, LAR 2008-09.

www.cppp.org
Aging & Disabilities Budget for 2008-09
10% Instructions: would require $112 million cut in General Revenue spending, plus the loss of $130 million in federal funds and layoffs of 298 state employees. Client impacts: Community Based Alternatives Waiver (CBA): 2,261 fewer served; Home and Community Based Services (HCS): 1,119 fewer served; Community Living Assistance (CLASS): 316 fewer served; Deaf Blind Multiple Disabilities (-14); Medically Dependent Children (-213); Consolidated Waiver Program (-18); Texas Home Living Waiver (-198); Non-Medicaid Services (-131); Mental Retardation Community Services (-799); In Home and Family Support (-391); MR In-Home Services (-275)
Base increase: $71 million more in General Revenue, mostly for caseload growth in Medicaid, would draw down another $148 million in federal funds
Exceptional items:$84 million in GR would draw down $129 million in federal funds to maintain caseloads for waiver programs; $8 million in GR and $12 million federal would fund Promoting Independence to get 240 ICF-MR clients and 120 children leaving foster care into the HCS Waiver program
Source: Dept. of Aging and Disabilities Services, LAR 2008-09.
www.cppp.org
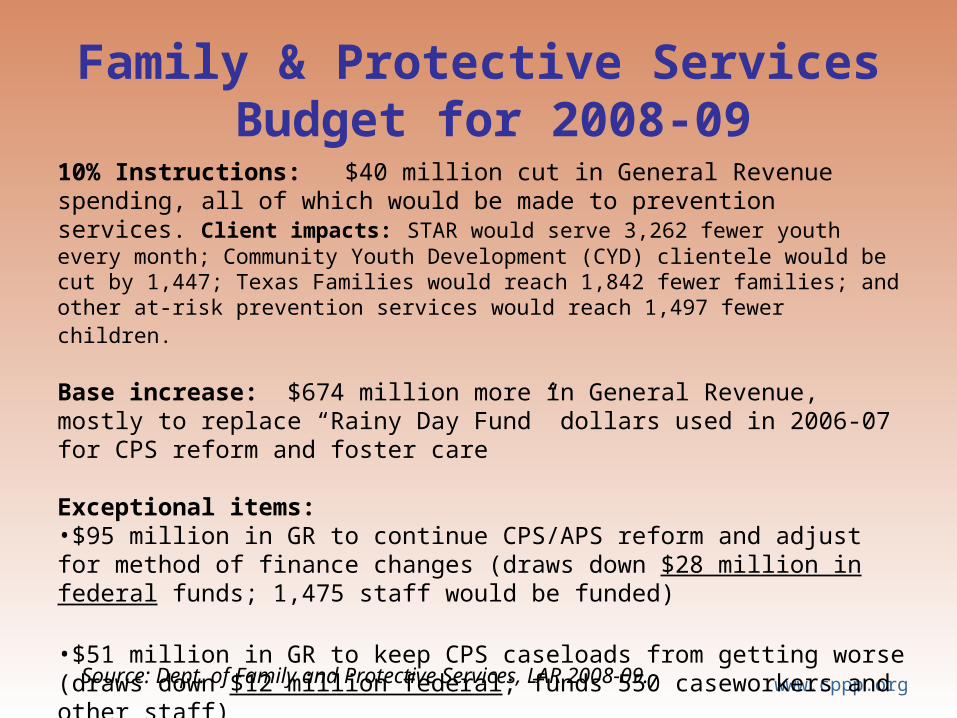
Family & Protective Services Budget for 2008-09
10% Instructions: $40 million cut in General Revenue spending, all of which would be made to prevention services. Client impacts: STAR would serve 3,262 fewer youth every month; Community Youth Development (CYD) clientele would be cut by 1,447; Texas Families would reach 1,842 fewer families; and other at-risk prevention services would reach 1,497 fewer children.
Base increase: $674 million more in General Revenue, mostly to replace “Rainy Day Fund” dollars used in 2006-07 for CPS reform and foster care
Exceptional items:•$95 million in GR to continue CPS/APS reform and adjust for method of finance changes (draws down $28 million in federal funds; 1,475 staff would be funded)
•$51 million in GR to keep CPS caseloads from getting worse (draws down $12 million federal; funds 550 caseworkers and other staff)
•$13 million GR to expand community-based prevention programs
Source: Dept. of Family and Protective Services, LAR 2008-09.

www.cppp.org
State Health Services Budget for 2008-09
10% Instructions: would require $236 million cut in GR-related spending, plus the loss of $59 million in federal funds and layoffs of 693 state employees.
Major cuts: $45 million GR-Dedicated for WIC Nutrition/Farmers Markets; $41 m GR + $38 m federal for adult mental health services (7,728 clients); $8.5 million GR + $8 m federal for children’s MH services (842 clients); $7.6 m GR + $7 m federal for NorthSTAR Behavioral Health waiver; $4.6 m GR + $5 m federal for substance abuse. GR cuts to Maternal & Child Health could endanger the whole federal grant ($35 million annually).
Exceptional items: Other than restoring the 10% GR cut, DSHS exceptional items would not expand the use of federal funds, but would improve staffing for various public health programs. 97 new positions would be funded for state mental hospitals (to continue the capacity increase approved for 2006-07); 123 staff would provide preparedness/prevention/emergency response services to the 188 counties that lack a public health authority.
Source: Dept. of State Health Services, LAR 2008-09.

www.cppp.org
Assistive & Rehabilitative Svcs. Budget for 2008-09
10% Instructions: would require $13 million cut in General Revenue spending, plus the loss of $45 million in federal funds and layoffs of 168 state employees. Rehab/employment programs for blind/visually impaired and for deaf would be cut; general vocational rehab program would serve 13,875 fewer clients.
Base increase: $9 million more in General Revenue (before 10% cut) would draw down another $36 million in federal funds
Exceptional items:$8 million in GR would draw down $33 million in federal funds, newly available because of 3.5% annual increase in Vocational Rehabilitation Grant, and prevent the creation of a waiting list. $3.70 in federal funds for every $1 in GR
Legislature could also approve staffing increase of 122 employees in fiscal 2008, plus another 40 employees in 2009, for SSI and SSDI determination (100% federally funded)
Source: Dept. of Assistive & Rehabilitative Services, LAR 2008-09.

www.cppp.org
Federal Reauthorization NeededHIV Care Formula Grant: authorization expired at end of fiscal 2005. Congress could change formulas to favor Southern states. $73 million in fiscal 2006.
Special Programs for the Aging (Nutrition & Supportive Services): $55 million a year for DADS
Refugee and Entrant Assistance: no match required. Funds cash & medical assistance, social services, some admin costs. $16 million in fiscal 2006.
Family Planning Services: $14 million annually to Dept. of State Health Svcs.
Family Caregiver Support: $8 million/yr for Texas for support svcs for family caregivers and for grandparents/other older adults who care for relatives
Preventive Health Services: Sexually Transmitted Disease Control Grants: $7 million a year for Dept. of State Health Services
Source: LBB, Top 100 Federal Funding Sources, April 2006.

www.cppp.org
More InformationLegislative Budget Board, Top 100 Federal Funding Sources and Federal Funds Watch (newsletter): http://www.lbb.state.tx.us/Federal_Funds/Federal_Funds.htm
Texas Office of State-Federal Relations, News from Washington and more:http://www.osfr.state.tx.us/
Source: LBB, Top 100 Federal Funding Sources, April 2006.

www.cppp.org
Use of This PresentationThe Center for Public Policy Priorities encourages you to reproduce and distribute
these slides, which were developed for use in making public presentations.
If you reproduce these slides, please give appropriate credit to CPPP.
The data presented here may become outdated.
For the most recent information or to sign up for our free E-Mail Updates, visit www.cppp.org.
Center for Public Policy Priorities900 Lydia StreetAustin, TX 78702
Phone 512-320-0222 Fax 512-320-0227