
One Sketch to Rule Them All: Rethinking Network Flow Monitoring with...
14
One Sketch to Rule Them All: Rethinking Network Flow Monitoring with UnivMon Zaoxing Liu † , Antonis Manousis ? , Gregory Vorsanger † , Vyas Sekar ? , Vladimir Braverman † † Johns Hopkins University ? Carnegie Mellon University ABSTRACT Network management requires accurate estimates of met- rics for many applications including traffic engineering (e.g., heavy hitters), anomaly detection (e.g., entropy of source addresses), and security (e.g., DDoS detection). Obtain- ing accurate estimates given router CPU and memory con- straints is a challenging problem. Existing approaches fall in one of two undesirable extremes: (1) low fidelity general- purpose approaches such as sampling, or (2) high fidelity but complex algorithms customized to specific application- level metrics. Ideally, a solution should be both general (i.e., supports many applications) and provide accuracy com- parable to custom algorithms. This paper presents Univ- Mon, a framework for flow monitoring which leverages re- cent theoretical advances and demonstrates that it is possible to achieve both generality and high accuracy. UnivMon uses an application-agnostic data plane monitoring primitive; dif- ferent (and possibly unforeseen) estimation algorithms run in the control plane, and use the statistics from the data plane to compute application-level metrics. We present a proof- of-concept implementation of UnivMon using P4 and de- velop simple coordination techniques to provide a “one-big- switch” abstraction for network-wide monitoring. We eval- uate the effectiveness of UnivMon using a range of trace- driven evaluations and show that it offers comparable (and sometimes better) accuracy relative to custom sketching so- lutions across a range of monitoring tasks. CCS Concepts •Networks → Network monitoring; Network measure- ment; Keywords Flow Monitoring, Sketching, Streaming Algorithms Permission to make digital or hard copies of all or part of this work for personal or classroom use is granted without fee provided that copies are not made or distributed for profit or commercial advantage and that copies bear this notice and the full citation on the first page. Copyrights for components of this work owned by others than ACM must be honored. Abstracting with credit is per- mitted. To copy otherwise, or republish, to post on servers or to redistribute to lists, requires prior specific permission and/or a fee. Request permissions from [email protected]. SIGCOMM ’16, August 22–26, 2016, Florianopolis, Brazil c 2016 ACM. ISBN 978-1-4503-4193-6/16/08. . . $15.00 DOI: http://dx.doi.org/10.1145/2934872.2934906 1 Introduction Network management is multi-faceted and encompasses a range of tasks including traffic engineering [11, 32], attack and anomaly detection [49], and forensic analysis [46]. Each such management task requires accurate and timely statis- tics on different application-level metrics of interest; e.g., the flow size distribution [37], heavy hitters [10], entropy mea- sures [38, 50], or detecting changes in traffic patterns [44]. At a high level, there are two classes of techniques to esti- mate these metrics of interest. The first class of approaches relies on generic flow monitoring, typically with some form of packet sampling (e.g., NetFlow [25]). While generic flow monitoring is good for coarse-grained visibility, prior work has shown that it provides low accuracy for more fine-grained metrics [30, 31, 43]. These well-known limitations of sam- pling motivated an alternative class of techniques based on sketching or streaming algorithms. Here, custom online al- gorithms and data structures are designed for specific met- rics of interest that can yield provable resource-accuracy trade- offs (e.g., [17, 18, 20, 31, 36, 38, 43]). While the body of work in data streaming and sketching has made significant contributions, we argue that this trajec- tory of crafting special-purpose algorithms is untenable in the long term. As the number of monitoring tasks grows, this entails significant investment in algorithm design and hard- ware support for new metrics of interest. While recent tools like OpenSketch [47] and SCREAM [41] provide libraries to reduce the implementation effort and offer efficient resource allocation, they do not address the fundamental need to de- sign and operate new custom sketches for each task. Fur- thermore, at any given point in time the data plane resources have to be committed (a priori) to a specific set of metrics to monitor and will have fundamental blind spots for other metrics that are not currently being tracked. Ideally, we want a monitoring framework that offers both generality by delaying the binding to specific applications of interest but at the same time provides the required fidelity for estimating these metrics. Achieving generality and high fidelity simultaneously has been an elusive goal both in the- ory [33] (Question 24) as well as in practice [45]. In this paper, we present the UnivMon (short for Univer- sal Monitoring) framework that can simultaneously achieve both generality and high fidelity across a broad spectrum of monitoring tasks [31, 36, 38, 51]. UnivMon builds on and
Transcript of One Sketch to Rule Them All: Rethinking Network Flow Monitoring with...

One Sketch to Rule Them All:Rethinking Network Flow Monitoring with UnivMon
Zaoxing Liu†, Antonis Manousis?, Gregory Vorsanger†, Vyas Sekar?, Vladimir Braverman†† Johns Hopkins University ? Carnegie Mellon University
ABSTRACTNetwork management requires accurate estimates of met-rics for many applications including traffic engineering (e.g.,heavy hitters), anomaly detection (e.g., entropy of sourceaddresses), and security (e.g., DDoS detection). Obtain-ing accurate estimates given router CPU and memory con-straints is a challenging problem. Existing approaches fallin one of two undesirable extremes: (1) low fidelity general-purpose approaches such as sampling, or (2) high fidelitybut complex algorithms customized to specific application-level metrics. Ideally, a solution should be both general(i.e., supports many applications) and provide accuracy com-parable to custom algorithms. This paper presents Univ-Mon, a framework for flow monitoring which leverages re-cent theoretical advances and demonstrates that it is possibleto achieve both generality and high accuracy. UnivMon usesan application-agnostic data plane monitoring primitive; dif-ferent (and possibly unforeseen) estimation algorithms runin the control plane, and use the statistics from the data planeto compute application-level metrics. We present a proof-of-concept implementation of UnivMon using P4 and de-velop simple coordination techniques to provide a “one-big-switch” abstraction for network-wide monitoring. We eval-uate the effectiveness of UnivMon using a range of trace-driven evaluations and show that it offers comparable (andsometimes better) accuracy relative to custom sketching so-lutions across a range of monitoring tasks.
CCS Concepts•Networks → Network monitoring; Network measure-ment;
KeywordsFlow Monitoring, Sketching, Streaming AlgorithmsPermission to make digital or hard copies of all or part of this work for personalor classroom use is granted without fee provided that copies are not made ordistributed for profit or commercial advantage and that copies bear this noticeand the full citation on the first page. Copyrights for components of this workowned by others than ACM must be honored. Abstracting with credit is per-mitted. To copy otherwise, or republish, to post on servers or to redistribute tolists, requires prior specific permission and/or a fee. Request permissions [email protected].
SIGCOMM ’16, August 22–26, 2016, Florianopolis, Brazilc© 2016 ACM. ISBN 978-1-4503-4193-6/16/08. . . $15.00
DOI: http://dx.doi.org/10.1145/2934872.2934906
1 IntroductionNetwork management is multi-faceted and encompasses arange of tasks including traffic engineering [11, 32], attackand anomaly detection [49], and forensic analysis [46]. Eachsuch management task requires accurate and timely statis-tics on different application-level metrics of interest; e.g., theflow size distribution [37], heavy hitters [10], entropy mea-sures [38, 50], or detecting changes in traffic patterns [44].
At a high level, there are two classes of techniques to esti-mate these metrics of interest. The first class of approachesrelies on generic flow monitoring, typically with some formof packet sampling (e.g., NetFlow [25]). While generic flowmonitoring is good for coarse-grained visibility, prior workhas shown that it provides low accuracy for more fine-grainedmetrics [30, 31, 43]. These well-known limitations of sam-pling motivated an alternative class of techniques based onsketching or streaming algorithms. Here, custom online al-gorithms and data structures are designed for specific met-rics of interest that can yield provable resource-accuracy trade-offs (e.g., [17, 18, 20, 31, 36, 38, 43]).
While the body of work in data streaming and sketchinghas made significant contributions, we argue that this trajec-tory of crafting special-purpose algorithms is untenable inthe long term. As the number of monitoring tasks grows, thisentails significant investment in algorithm design and hard-ware support for new metrics of interest. While recent toolslike OpenSketch [47] and SCREAM [41] provide libraries toreduce the implementation effort and offer efficient resourceallocation, they do not address the fundamental need to de-sign and operate new custom sketches for each task. Fur-thermore, at any given point in time the data plane resourceshave to be committed (a priori) to a specific set of metricsto monitor and will have fundamental blind spots for othermetrics that are not currently being tracked.
Ideally, we want a monitoring framework that offers bothgenerality by delaying the binding to specific applicationsof interest but at the same time provides the required fidelityfor estimating these metrics. Achieving generality and highfidelity simultaneously has been an elusive goal both in the-ory [33] (Question 24) as well as in practice [45].
In this paper, we present the UnivMon (short for Univer-sal Monitoring) framework that can simultaneously achieveboth generality and high fidelity across a broad spectrum ofmonitoring tasks [31, 36, 38, 51]. UnivMon builds on and
extends recent theoretical advances in universal streaming,where a single universal sketch is shown to be provably ac-curate for estimating a large class of functions [15, 16, 19,21, 22]. In essence, this generality can enable us to delaythe binding of the data plane resources to specific monitor-ing tasks, while still providing accuracy that is comparable(if not better) than running custom sketches using similar re-sources.
While our previous position paper suggested the promiseof universal streaming [39], it fell short of answering severalpractical challenges, which we address in this paper. First,we demonstrate a concrete switch-level realization of Uni-vMon using P4 [12], and discuss key implementation chal-lenges in realizing UnivMon. Second, prior work only fo-cused on a single switch running UnivMon for a specificfeature (e.g., source addresses) of interest, whereas in prac-tice network operators want a panoramic view across multi-ple features and across traffic belonging to multiple origin-destination pairs. To this end, we develop lightweight-yet-effective coordination techniques that enable UnivMon to ef-fectively provide a “one big switch” abstraction for network-wide monitoring [34], while carefully balancing the moni-toring load across network locations.
We evaluate UnivMon using a range of traces [1, 2] andoperating regimes and compare it to state-of-art custom sketch-ing solutions based on OpenSketch [47]. We find that for asingle network element, UnivMon achieves comparable ac-curacy, with an observed error gap ≤ 3.6% and average er-ror gap ≤ 1%. Furthermore, UnivMon outperforms OpenS-ketch in the case of a growing application portfolio. In anetwork-wide setting, our coordination techniques can re-duce the memory consumption and communication with thecontrol plane by up to three orders of magnitude.
Contributions and roadmap: In summary, this paper makesthe following contributions:• A practical architecture which translates recent theoretical
advances to serve as the basis for a general-yet-accuratemonitoring framework (§3, §4).• An effective network-wide monitoring approach that pro-
vides a one-big switch abstraction (§5).• A viable implementation using emerging programmable
switch architectures (§6).• A trace-driven analysis which shows that UnivMon pro-
vides comparable accuracy and space requirements com-pared to custom sketches (§7).We begin with background and related work in the next
section. We highlight outstanding issues and conclude in §8.
2 Background and Related WorkMany network monitoring and management applications de-pend on sampled flow measurements from routers (e.g., Net-Flow or sFlow). While these are useful for coarse-grainedmetrics (e.g., total volume) they do not provide good fidelityunless these are run at very high sampling rates, which isundesirable due to compute and memory overhead.
This inadequacy of packet sampling has inspired a large
body of work in data streaming or sketching. This derivesfrom a rich literature in the theory community on stream-ing algorithms starting with the seminal “AMS” paper [9]and has since been an active area of research (e.g., [19, 24,26, 28]). At the high level, the problem they address is asfollows: Given an input sequence of items, the algorithmis allowed to make a single or constant number of passesover the data stream while using sub-linear (usually poly-logarithmic) space compared to the size of the data set andthe size of the dictionary. The algorithm then provides an ap-proximate estimate of the desired statistical property of thestream (e.g., mean, median, frequency moments). Streamingis a natural fit for network monitoring and has been appliedto several tasks including heavy hitter detection [31], entropyestimation [38], change detection [36], among others.
A key limitation that has stymied the practical adoption ofstreaming approaches is that the algorithms and data struc-tures are tightly coupled to the intended metric of interest.This forces vendors to invest time and effort in building spe-cialized algorithms, data structures, and corresponding hard-ware without knowing if these will be useful for their cus-tomers. Given the limited resources available on networkrouters and business concerns, it is difficult to support a widespectrum of monitoring tasks in the long term. Moreover, atany instant the data plane resources are committed before-hand to the application-level metrics and other metrics thatmay be required in the future (e.g., as administrators startsome diagnostic tasks and require additional statistics) willfundamentally not be available.
The efforts closest in spirit to our UnivMon vision is theminimalist monitoring work of Sekar et al. [45] and OpenS-ketch by Yu et al., [47]. Sekar et al. showed empiricallythat flow sampling and sample-and-hold [31] can providecomparable accuracy to sketching when equipped with sim-ilar resources. However, this work offers no analytical basisfor this observation and does not provide guidelines on whatmetrics are amenable to this approach.
OpenSketch [47] addresses an orthogonal problem of mak-ing it easier to implement sketches. Here, the router is equippedwith a library of predefined functions in hardware (e.g., hash-maps or count-min sketches [26]) and the controller can re-program these as needed for different tasks. While OpenS-ketch reduces the implementation burden, it still faces keyshortcomings. First, because the switches are programmedto monitor a specific set of metrics, there will be a fundamen-tal lack of visibility into other metrics for which data planeresources have not been committed, even if the library offunctions supports those tasks. Second, to monitor a portfo-lio of tasks, the data plane will need to run many concurrentsketch instances, which increases resource requirements.
In summary, prior work presents a fundamental dichotomy:generic approaches that offer poor fidelity and are hard toreason about analytically vs. sketch-based approaches thatoffer good guarantees but are practically intractable giventhe wide range of monitoring tasks of interest.
Our recent position paper makes a case for a “RISC” ap-proach for monitoring [39], highlighting the promise of re-cent theoretical advances in universal streaming [19,21]. How-
3. Metric Estimation
App 1
Manifest computation
UnivMonControl Plane
UnivMonDataPlane
App 2 App N
TopologyRouting
#Sketches,Dimension,Memory
1. Distribute Manifests
2. Collect Sketch counters
…
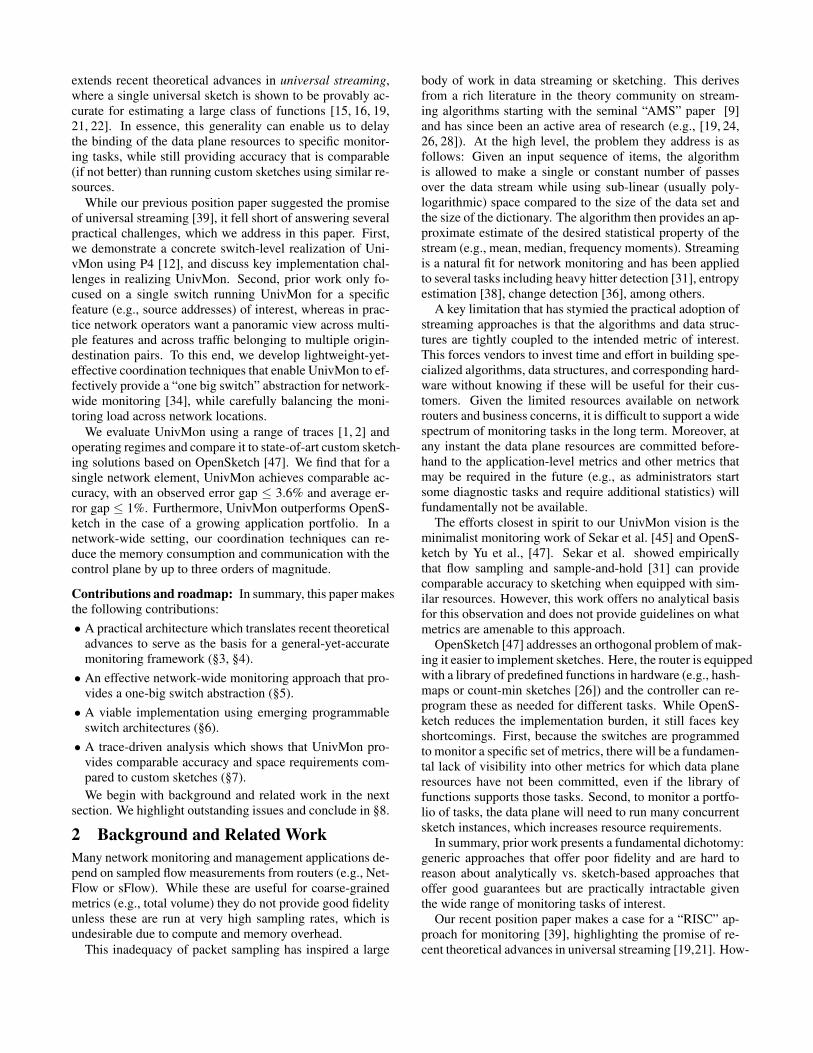
Figure 1: Overview of UnivMon: The data planenodes perform the monitoring operations and reportsketch summaries to the control plane which calculatesapplication-specific metric estimates.
ever, this prior work fails to address several key practicalchallenges. First, it does not discuss how these primitivescan actually be mapped into switch processing pipelines. Infact, we observe that the data-control plane split that theysuggest is impractical to realize as they require expensivesorting/sifting primitives (see §6). Second, this prior worktakes a narrow single-switch perspective. As we show later,naively extending this to a network-wide context can resultin inefficient use of compute resources on switches and/orresult in inaccurate estimates (see §5). This paper developsnetwork-wide coordination schemes and demonstrate an im-plementation in P4 [12]. Further, we show the fidelity ofUnivMon on a broader set of traces and metrics.
3 UnivMon architectureIn this section, we provide a high-level overview of the Uni-vMon framework. We begin by highlighting the end-to-endworkflow to show the interfaces between (a) the UnivMoncontrol plane and the management applications and (b) be-tween the UnivMon control and data plane components. Wediscuss the key technical requirements that UnivMon needsto satisfy and why these are challenging. Then, we brieflygive an overview of the control and data plane design to setup the context for the detailed design in the following sec-tions.1
Figure 1 shows an end-to-end view of the UnivMon frame-work. The UnivMon data plane nodes run general-purposemonitoring primitives that process the incoming stream ofpackets it sees and maintains a set of counter data structuresassociated with this stream. The UnivMon control plane as-signs monitoring responsibilities across the nodes. It peri-odically collects statistics from the data plane, and estimatesthe various application-level metrics of interest.
Requirements and challenges: There are three natural re-quirements that UnivMon should satisfy:• [R1.] Fidelity for a broad spectrum of applications: Ide-
ally UnivMon should require no prior knowledge of the
1We use the terms routers, switches, and nodes interchange-ably.
set of metrics to be estimated, and yet offer strong guar-antees on accuracy.• [R2.] One-big-switch abstraction for monitoring: There
may be several network-wide management tasks interestedin measuring different dimensions of traffic; e.g., sourceIPs, destination ports, IP 5-tuples. UnivMon should pro-vide a “one big switch” abstraction for monitoring to themanagement applications running atop UnivMon, so thatthe estimates appear as if all the traffic entering the net-work was monitored at a giant switch [34].• [R3.] Feasible implementation roadmap: While pure soft-
ware solutions (e.g., Open vSwitch [42]) may be valu-able in many deployments, for broader adoption and per-formance requirements, the UnivMon primitives used toachieve [R1] and [R2] must have a viable implementationin (emerging) switch hardware [12, 13].Given the trajectory of prior efforts that offer high gener-
ality and low fidelity (e.g, packet sampling) vs. low general-ity and high fidelity (e.g., custom sketches), [R1] may appearinfeasible. To achieve [R2], we observe that if each routeracts on the traffic it observes independently, it can becomedifficult to combine the measurements and/or lead to signif-icant imbalance in the load across routers. Finally, for [R3],we note that even emerging flexible switches [3,12,13] haveconstraints on the types of operations that they can support.
Approach Overview: Next, we briefly outline how the Uni-vMon control and data plane designs address these key re-quirements and challenges:• UnivMon data plane: The UnivMon plane uses sketching
primitives based on recent theoretical work on universalstreaming [19, 21]. By design, these so-called universalsketches require no prior knowledge of the metrics to beestimated. More specifically, as long as these metrics sat-isfy a series of statistical properties discussed in detail in§4, we can prove theoretical guarantees on the memory-accuracy tradeoff for estimating these metrics in the con-trol plane.• UnivMon control plane: Given that the data plane sup-
ports universal streaming, the control plane needs no ad-ditional capabilities w.r.t. [R1] once it collects the sketchinformation from the router. It runs simple estimation al-gorithms for every management application of interest aswe discuss in §4 and provides simple APIs and librariesfor applications to run estimation queries on the collectedcounters. To address [R2], the UnivMon control planegenerates sketching manifests that specify the monitoringresponsibility of each router. These manifests specify theset of universal sketch instances for different dimensionsof interest (e.g., for source IPs, for 5-tuples) that eachrouter needs to maintain for different origin-destination(OD) pair paths that it lies on. This assignment takesinto account the network topology and routing policiesand knowledge of the hardware resource constraints of itsnetwork elements.In the following sections, we begin by providing the back-
ground on universal streaming that forms the theoretical ba-
sis for UnivMon. Then, in §5, we describe the network-wide coordination problem that the UnivMon control planesolves. In §6, we show how we implement this design inP4 [7, 12].
4 Theoretical Foundations of UnivMonIn this section, we first describe the theoretical reasoning be-hind universal streaming and the class of supported func-tions [19, 21]. Then, we present and explain the underlyingalgorithms from universal streaming which serve as a basisfor UnivMon. We also show how several canonical networkmonitoring tasks are amenable to this approach.
4.1 Theory of Universal SketchingFor the following discussion, we consider an abstract streamD(m,n) of length m with n unique elements. Let fi denotethe frequency of the i-th unique element in the stream.
The intellectual foundations of many streaming algorithmscan be traced back to the celebrated lemma by Johnson andLindenstrauss [27]. This shows that N points in Euclideanspace can be embedded into another Euclidean space with anexponentially smaller dimension while approximately pre-serving the pairwise distance between the points. Alon, Ma-tias, and Szegedy used a variant of the Johnson-Lindenstrausslemma to approximately compute the second moment of thefrequency vector =
∑i f
2i (or the L2 norm =
√∑i f
2i ) in
the streaming model [9], using a small (polylogarithmic)amount of memory. The main question that universal stream-ing seeks to answer is whether such methods can be extendedto more general statistics of the form
∑g(fi) for an arbi-
trary function g. We refer to this statistic as the G-sum .
Class of Stream-PolyLog Functions: Informally, streamingalgorithms which have polylogarithmic space complexity,are known to exist for G-sum functions, where g is mono-tonic and upper bounded by the function O(f2i ) [14, 19].2
Note that this only guarantees that some (possibly custom)sketching algorithm exists if G-sum ∈ Stream-PolyLog anddoes not argue that a single “universal” sketch can computeall such G-sums.
Intuition Behind Universality: The surprising recent the-oretical result of universal sketches is that for any functiong() where G-sum belongs to the class Stream-PolyLog de-fined above can now be computed by using a single universalsketch.
The intuition behind universality stems from the follow-ing argument about heavy hitters in the stream. Informally,item i is a heavy hitter w.r.t. g if changing its frequency fisignificantly affects the G-sum value as well. For instance,consider the frequency vector (
√n, 1, 1, . . . , 1) of size n;
here the first item is a L2 heavy hitter since its frequencyis a large fraction of the L2 norm of the frequency vector.2This is an informal explanation; the precise characteriza-tion is more technically involved and can be found in [19].While streaming algorithms are also known for G-sumwhen its g grows monotonically faster than f2i [17] they can-not be computed in polylogarithmic space due to the lowerbound Ω(n1−2/k) where k > 2 [23].
For function g, let G-core be the set containing g-heavy el-ements. g-heavy elements can be defined as, for 0 < γ < 1,any element i ∈ [n] such that g(fi) > γ
∑j g(fj).
Now, let us consider two cases:
1. There is one sufficiently large g-heavy hitter in the stream:If the frequency vector has one (sufficiently) large heavyhitter, then most of mass is concentrated in this value.Now, it can be shown that a heavy hitter for the L2 normof the frequency vector is also a heavy hitter for com-putable g [14, 19]. Thus, to compute G-core, we cansimply find L2 heavy hitters (L2-HH) using some knowntechniques (e.g., [9, 24]) and use it to estimate G-sum .
2. There is no single g-heavy hitter in the stream and no sin-gle element contributes significantly to the G-sum:When there is no single large heavy hitter, it can be shownthat G-sum can be approximated w.h.p. by finding heavyhitters on a series of sampled substreams of increasinglysmaller size. The exact details are beyond the scope ofthis paper [19] but the main intuition comes from tailbounds (Chernoff/Hoeffding). Each substream is definedrecursively by the substream before it, and is created bysampling the previous frequency vector by replacing eachcoordinate of the frequency vector with a zero value withprobability 0.5. Repeating this procedure k times reducesthe dimensionality of the problem by a factor of 2k. Then,summing across heavy hitters of all these recursively de-fined vectors, we create a single “recursive sketch” whichgives a good estimate of G-sum [21].
4.2 Algorithms for Universal SketchingUsing the intuition from the two cases described above, wenow have the following universal sketch construction usingan online sketching stage and an offline estimation stage.The proof of the theorems governing the behavior of thesealgorithms is outside the scope of this paper and we referreaders to the previous work of Braverman et al [19, 21].In this section, we focus on providing a conceptual viewof the universal sketching primitives. As we will discusslater, the actual data plane and control plane realization willbe slightly different to accommodate switch hardware con-straints (see §6).
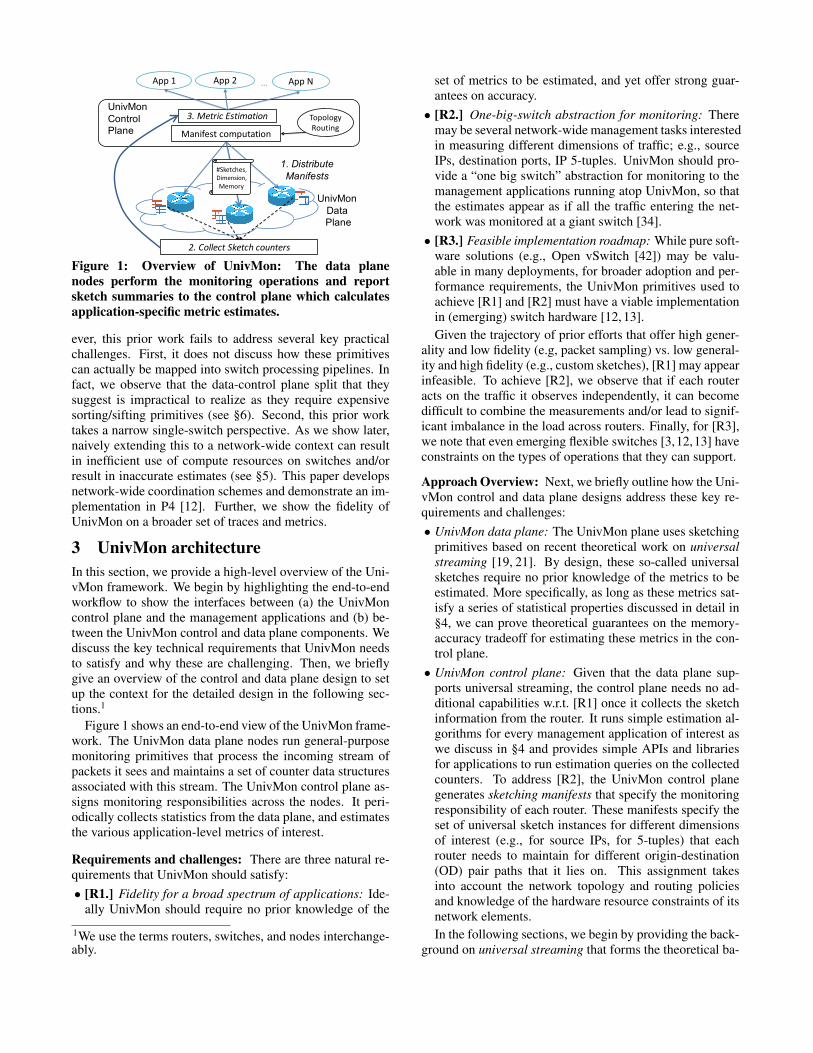
In the online stage, as described in Algorithm 1, we main-tain log(n) parallel copies of a “L2-heavy hitter” (L2-HH)sketch (e.g., [24]), one for each substream as described incase 2 above. For the jth parallel instance, the algorithmprocesses each incoming packet 5-tuple and uses an arrayof j pairwise independent hash functions hi : [n] → 0, 1to decide whether or not to sample the tuple. When 5-tupletup arrives in the stream, if for all h1 to hj , hi(tup) = 1,then the tuple is added to Dj , the sampled substream. Then,for substream Dj , we run an instance of L2-HH as shownin Algorithm 1, and visualized in Figure 2. Each L2-HH in-stance outputs Qj that contains L2 heavy hitters and theirestimated counts from Dj . This creates substreams of de-creasing lengths as the j-th instance is expected to have allof the hash functions agree to sample half as often as the(j − 1)-th instance. This data structure is all that is required

Figure 2: High-level view of universal sketch
Algorithm 1 UnivMon Online Sketching StepInput: Packet stream D(m,n) = a1, a2, . . . , am
1. Generate log(n) pairwise independent hash func-tions h1 . . . hlog(n) : [n]→ 0, 1.
2. Run L2-HH sketch on D and maintain HH set Q0.
3. For j = 1 to log(n), in parallel:
(a) when a packet ai in D arrives, if all h1(ai) ×h2(ai) · · · × hj(ai) = 1, sample and add ai tosampled substream Dj .3
(b) Run L2-HH sketch on Dj and maintain heavyhitters Qj
Output: Q = Q0, . . . , Qlog(n)
for the online portion of our approach.In the offline stage, we use Algorithm 2 to combine the
results of the parallel copies of Algorithm 1 to estimate dif-ferent G-sum functions of interest. This method is based onthe Recursive Sum Algorithm from [21]. The input to thisalgorithm is the output of Algorithm 1; i.e., a set of Qjbuckets maintained by the L2-HH sketch from parallel in-stance j. Let wj(i) be the counter of the i-th bucket (heavyhitter) in Qj . hj(i) is the hash of the value of the i-th bucketin Qj where hj is the hash function described in Algorithm1 Step 1. It can be shown that the output of Algorithm 2 isan unbiased estimator of G-sum [19, 21]. In this algorithm,each Y is recursively defined, where Yj is function g ap-plied to each bucket of Qj , the L2-HH sketch for substreamDj , and the sum taken on the value of those buckets and allYj′ , j
′ > j. Note that Qlog(n) is the set of heavy hitters fromthe sparsest substreamDlog(n) in Algorithm 1, and we beginby computing Ylog(n). Thus, Y0 can be viewed as computingG-sum in parts using these sampled streams.
The key observation here is that the online component,Algorithm 1, which will run in the UnivMon data plane isagnostic to the specific choice of g in the offline stage. Thisis in stark contrast to custom sketches where the online andoffline stages are both tightly coupled to the specific statisticwe want to compute.
4.3 Application to Network MonitoringAs discussed earlier, if a functionG-sum ∈ Stream-PolyLog,then it is amenable to estimation via the universal sketch.Next, we show that a range of network measurement taskscan be formulated via a suitable G-sum ∈ Stream-PolyLog.3In this way, we obtain log(n) streams D1, D2 . . . Dlog(n);i.e., for j = 1 . . . log n, the number of unique items n inDj+1, is expected to be half of Dj .
Algorithm 2 UnivMon Offline Estimation AlgorithmInput: Set of heavy hitters Q = Q0, . . . , Qlog(n)
1. For j = 0 . . . log(n), call g() on all counters wj(i) inQj . After g(), the i-th entry in Qj is g(wj(i)).
2. Compute Ylog(n) =∑i g(wlog(n)(i)).
3. For each j from log(n)− 1 to 0, compute:
Yj=2Yj+1+∑i∈Qj
(1-2hj+1(i)) g(wj(i))
Output: Y0
For the following discussion, we consider network traffic asa stream D(n,m) with m packets and at most n uniqueflows. When referring to the definitions of Heavy Hitters,note that L2 heavy hitters are a stronger notion that sub-sumes L1 heavy hitters.
Heavy Hitters: To detect heavy hitters in the network traf-fic, our goal is to identify the flows that consume more thana fraction γ of the total capacity [31]. Consider a functiong(x) = x such that the corresponding G-core outputs a listof heavy hitters with(1± ε)-approximation of their frequen-cies. For this case, these heavy hitters are L1-heavy hittersand g(x) is upperbounded by x2. Thus we have an algorithmthat provides G-core. This is technically a special case ofthe universal sketch; we are not ever computing a G-sumfunction and using G-core directly in all cases.
DDoS Victim Detection: Suppose we want to identify ifa host X is experiencing a Distributed Denial of Service(DDoS) attack. We can do so using sketching by check-ing if more than k unique flows from different sources arecommunication with X [47]. To show that the simple DDoSvictim detection problem is solvable by the universal sketch,consider a function g that g(x) = x0 and g(0) = 0. Hereg is upper bounded by f(x) = x2 and sketches already ex-ist to solve this exact problem. Thus, we know G-sum isin Stream-PolyLog and we approximate G-sum in polylog-arithmic space using the universal sketch. In terms of in-terpreting the results of this measurement, if G-sum is esti-mated to be larger than k, a specific host is a potential DDoSvictim.
Change Detection: Change detection is the process of iden-tifying flows that contribute the most to traffic change overtwo consecutive time intervals. As this computation takesplace in the control plane, we can store the output of theuniversal sketches from multiple intervals without impact-ing online performance. Consider two adjacent time inter-vals tA and tB . If the volume for a flow x in interval tAis SA[x] and SB [x] over interval tB . The difference signalfor x is defined as D[x] = |SA[x] − SB [x]|. A flow is aheavy change flow if the difference in its signal exceeds φpercentage of the total change over all flows. The total dif-ference is D =
∑x∈[n]D[x]. A flow x is defined to be a
heavy change iff D[x] ≥ φ ·D. The task is to identify theseheavy change flows. We assume the size of heavy changeflows is above some threshold T over the total capacity c.We can show that the heavy change flows are L1 heavy hit-ters on interval tA (a1 · · · an/2) and interval tB (b1 · · · bn/2),

where L1(tA, tB) =∑|ai − bi|. G-sum here is L1 norm,
which belongs to Stream-PolyLog, andG-core can be solvedby universal sketch. The G-sum outputs the estimated sizeof the total change D and G-core outputs the possible heavychange flows. By comparing the outputs from G-sum andG-core, we can detect and determine the heavy change flowsthat are above some threshold of all flows.
Entropy Estimation: We define entropy with the expres-sionH ≡ −
∑ni=1
fim log( fim ) [38] and we define 0 log 0 = 0
here. The entropy estimation task is to estimateH for sourceIP addresses (but could be performed for ports or other fea-tures). To compute the entropy, H = −
∑ni=1
fim log( fim ) =
log(m) − 1m
∑i fi log(fi). As m can be easily obtained,4
the difficulty lies in calculating∑i fi log(fi). Here the func-
tion g(x) = x log(x) is bounded by g(x) = x2 and thus itsG-sum is in Stream-PolyLog andH can be estimated by uni-versal sketch.
Global Iceberg Detection: Consider a system or networkthat consists of N distributed nodes (e.g., switches). Thedata set Sj at node j contains a stream of tuples < itemid ,c>where itemid is an item identity from a setU = µ1 . . . µnand c is an incremental count. For example, an item canbe a packet or an origin-destination (OD) flow. We definefr i =
∑j
∑<µi,c>∈Sj
c, the frequency of the item µi whenaggregated across all the nodes. We want to detect the pres-ence of items whose total frequency across all the nodesadds up to exceed a given threshold T . In other words, wewould like to find out if there exists an element µi ∈ Usuch that fr i ≥ T . (In §5, we will explain a solution togain a network-wide universal sketch. Here, we assume herethat we maintain an abstract universal sketch across all nodesby correctly combining all distributed sketches.) Consider afunction g(x) = x such that the corresponding G-core out-puts a list of global heavy hitters with(1±ε)−approximationof their frequencies. For this case, since g-heavy hitters areL1 heavy hitters, we have an algorithm that providesG-core.
5 Network-wide UnivMonIn a network-wide context, we have flows from several origin-destination (OD) pairs, and applications may want network-wide estimates over multiple packet header combinationsof interest. For instance, some applications may want per-source IP estimates, while others may want characteristicsin terms of the entire IP-5-tuple. We refer to these differentpacket header features and feature-combinations as dimen-sions.
In this section, we focus on this network-wide monitor-ing problem of measuring multiple dimensions of interesttraversing multiple OD-pairs. Our goal is to provide equiva-lent coverage and fidelity to a “one big switch abstraction”,providing the same level of monitoring precision at the net-work level as at the switch level. We focus mostly for thecase where each OD-pair has a single network route and de-scribe possible extensions to handle multi-pathing.
4e.g., a single counter or estimated as a G-sum .
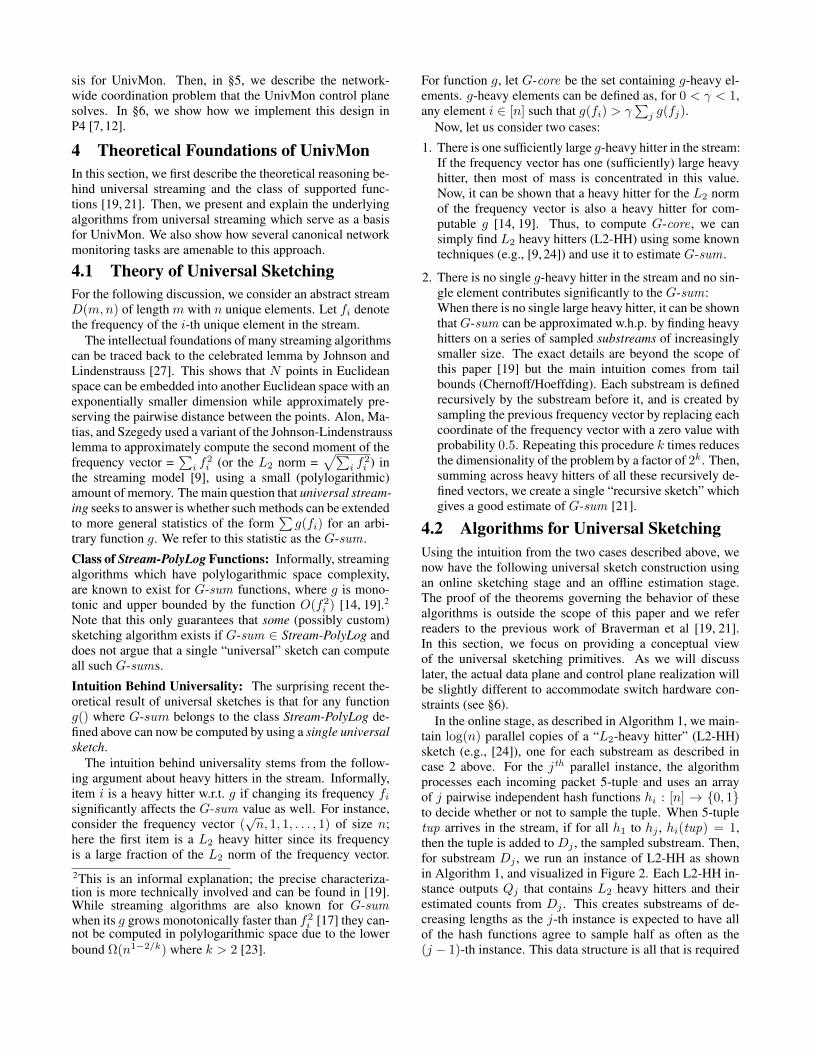
Figure 3: Example topology to explain the one-big-switch notion and to compare candidate network-widesolutions
5.1 Problem ScopeWe begin by scoping the types of network-wide estimationtasks we can support and formalize the one-big-switch ab-straction that we want to provide in UnivMon. To illustratethis, we use the example in Figure 3 where we want to mea-sure statistics over two dimensions of interest: 5-tuple andsource-IP.
In this example, we have four OD-pairs; suppose the setof traffic flows on each of these is denoted by P11, P12, P21,and P22. We can divide the traffic in the network into fourpartitions, one per OD-pair. Now, imagine we abstract awaythe topology and consider the union of the traffic across thesepartitions flowing through one logical node representing theentire network; i.e., computing some estimation functionF (P11 ] P12 ] P21 ] P22), where ] denotes the disjoint setunion operation.
For this work, we restrict our discussion to network-widefunctions where we can independently compute the F esti-mates on each OD-pair substream and add them up. In otherwords, we restrict our problem scope to estimation functionsF s such that:
F (P11]P12]P21]P22) = F (P11)+F (P12)+F (P21)+F (P22)
Note that this still captures a broad class of network-widetasks such as those mentioned in section 4.3. One such ex-ample measurement is finding heavy hitters for destinationIP addresses. An important characteristic of the UnivMonapproach is that in the network-wide setting the output ofsketches in the data plane can then be added together in thecontrol plane to give the same results as if all of the packetspassed through one switch. The combination of the sepa-rate sketches is a property of the universal sketch primitiveused in the data plane and is independent of the final statisticmonitored in the control plane, allowing the combination towork for all measurements supported by UnivMon. We dohowever acknowledge that some tasks fall outside the scope
of this partition model; an example statistic that is out ofscope would be measuring the statistical independence ofsource and destination IP address pairs (i.e. if a source IP islikely to appear with a given destination IP, or not), as this in-troduces cross-OD-pair dependencies. We leave extensionsto support more general network-wide functions for futurework (see §8).
The challenge here is to achieve correctness and efficiency(e.g., switch memory, controller overhead) while also bal-ancing the load across the data plane elements. Informally,we seek to minimize the total number of sketches instanti-ated in the network and the maximum number of sketchesthat any single node needs to maintain.
5.2 Strawman Solutions and LimitationsNext, we discuss strawman strategies and argue why thesefail to meet one or more of our goals w.r.t. correctness, effi-ciency, and load balancing. We observe that we can combinethe underlying sketch primitives at different switches as longas we use the same random seeds for our sketches, as thecounters are additive at each level of the UnivMon sketch.With this, we only need to add the guarantee that we counteach packet once to assure correctness. In terms of resourceusage, our goal is to minimize the number of sketches used.
Redundant Monitoring (RM): Suppose for each of k di-mensions of interest, we maintain a sketch on every node,with each node independently processing traffic for the OD-pairs whose paths it lies on. Now, we have the issue of com-bining sketches to get an accurate network-wide estimate. Inparticular, adding all of the counters from the sketches wouldbe incorrect, as packets would be counted multiple times. Inthe example topology, to correctly count packets we wouldneed to either only use the sketches atA orB, or, conversely,combine the sketches for source IP at O1 and O2 or D1 andD2. In terms of efficiency, this RM strategy maintains asketch for all k dimensions at each node and thus we main-tain a total of kN sketches across N nodes. Our goal, is tomaintain s total sketches, where s << kN .
Ingress Monitoring (IM): An improvement over the RMmethod is to have only ingress nodes maintaining every sketch.Thus, for each OD pair, all sketch information is maintainedin a single node. By not having duplicate sketches per ODpair, we will not double count and therefore can combinesketches together. This gives us the correctness guaranteemissing in RM. In Figure 3, IM would maintain sketches atO1 and O2. However, for Ni ingress nodes, we would runkNi sketches, and if Ni ≈ N we spend a similar amountof resources to RM, which is still high. Additionally, thesesketches woul be would all be present on a small number ofnodes, where other nodes with available compute resourceswould not run any sketches.
Greedy Divide and Conquer (GDC): To overcome theconcentration of sketches in IM above, one potential solutionis to evenly divide sketch processing duties across the path.Specifically, each node has a priority list of sketches, andtags packets with the current sketches that are already main-tained for this flow so that downstream nodes know which
remaining sketches to run. For instance, in Figure 3, GDCwould maintain the source IP sketch at O1 and O2, and the5-tuple sketch at A. This method is correct, as each sketchfor each OD pair is maintained once. However, it is difficultto properly balance resources as nodes at the intersection ofmultiple paths could be burdened with higher load.Reactive Query and Sketch (QS): An alternative approachis to use the controller to ensure better sketch assignment.For instance, whenever a new flow is detected at a node, wequery the controller to optimally assign sketches. In Figure3, the controller would optimally put the source IP sketchat A and the 5-tuple sketch at B (or vice versa). With thismethod, we can be assured of correctness. However, thereactive nature means that QS generates many requests tothe controller.
5.3 Our ApproachNext, we present our solution, which uses the UnivMon con-troller to coordinate switches to guarantee correctness andefficiency but without incurring the reactive query load ofthe QS strategy described above.
Periodically, the UnivMon controller gives each switch asketching manifest. For each switch A and for each OD-pair’s route that A lies on, the manifest specifies the dimen-sions for whichA needs to maintain a sketch. When a packetarrives at a node, the node uses the manifest to determinethe set of sketching actions to apply. When the controllerneeds to compute a network-wide estimate, we pull sketchesfrom all nodes and for each dimension, combine the sketchesacross the network for that dimension. This method mini-mizes communication to the control plane while still makinguse of the controller’s ability to optimize resource use.
The controller solves a simple constrained optimizationproblem that we discuss below. Note that maintaining twosketches uses much more memory than adding twice as manyelements to one sketch. Thus, a key part of this optimiza-tion is to ensure that we try to reuse the same sketch for agiven dimension across multiple OD pairs. In Figure 3, wewould first assign A the source IP sketch, then B the 5-tuplesketch for the OD pair (O1, D1). When choosing where toplace the sketches for the OD pair (O2, D2), the algorithmmatches the manifests such that the manifest for (O2, D2)uses the source IP sketch already at A and the 5-tuple sketchalready at B.
We formulate the controller’s decision to place sketchesas an integer linear program (ILP) shown in Figure 4. Letsjk be a binary decision variable denoting if the switch j ismaintaining a sketch for dimension j. The goal of the op-timization is to ensure that every OD-pair is suitably “cov-ered” and that the load across the switches is balanced. Letrk be the amount of memory for a sketch for dimension kand let R denote maximum amount of memory available ona single node. Note that the amount of memory for a sketchcan be chosen in advance based on the accuracy required.As a simple starting point, we focus primarily on the mem-ory resource consumption assuming that all UnivMon opera-tions can be done at line-rate; we can extend this formulationto incorporate processing load as well.
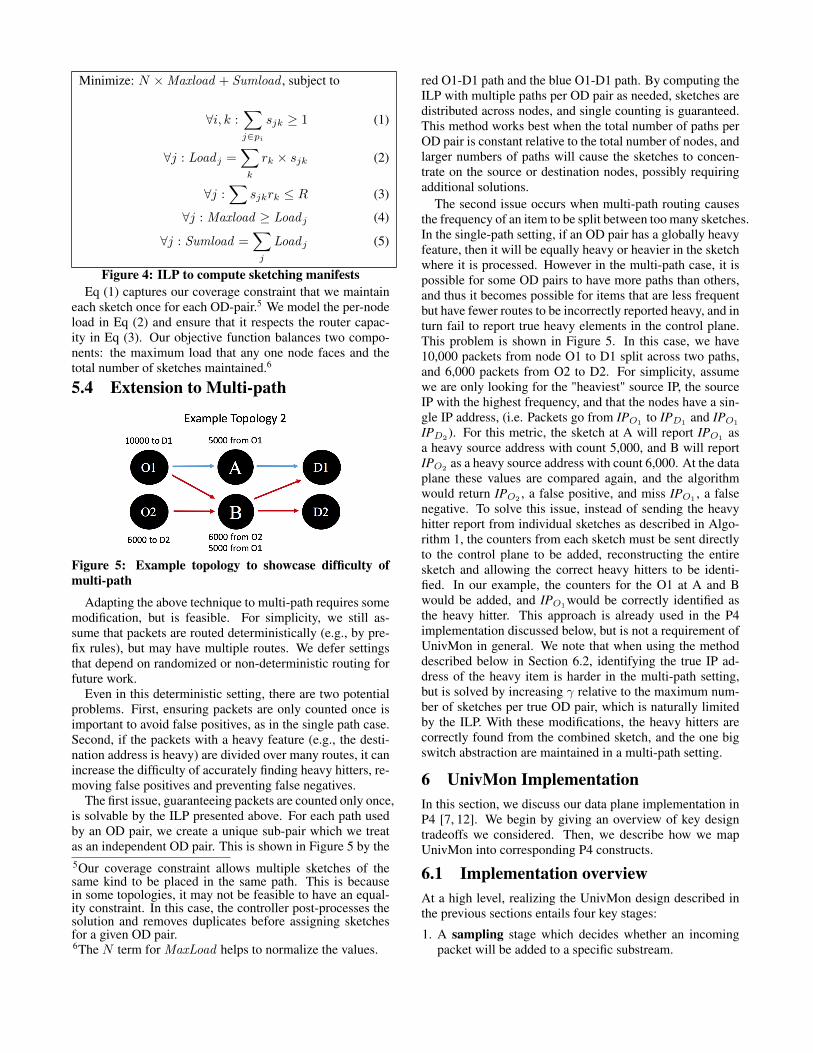
Minimize: N ×Maxload + Sumload , subject to
∀i, k :∑j∈pi
sjk ≥ 1 (1)
∀j : Load j =∑k
rk × sjk (2)
∀j :∑
sjkrk ≤ R (3)
∀j : Maxload ≥ Load j (4)
∀j : Sumload =∑j
Load j (5)
Figure 4: ILP to compute sketching manifestsEq (1) captures our coverage constraint that we maintain
each sketch once for each OD-pair.5 We model the per-nodeload in Eq (2) and ensure that it respects the router capac-ity in Eq (3). Our objective function balances two compo-nents: the maximum load that any one node faces and thetotal number of sketches maintained.6
5.4 Extension to Multi-path
Figure 5: Example topology to showcase difficulty ofmulti-path
Adapting the above technique to multi-path requires somemodification, but is feasible. For simplicity, we still as-sume that packets are routed deterministically (e.g., by pre-fix rules), but may have multiple routes. We defer settingsthat depend on randomized or non-deterministic routing forfuture work.
Even in this deterministic setting, there are two potentialproblems. First, ensuring packets are only counted once isimportant to avoid false positives, as in the single path case.Second, if the packets with a heavy feature (e.g., the desti-nation address is heavy) are divided over many routes, it canincrease the difficulty of accurately finding heavy hitters, re-moving false positives and preventing false negatives.
The first issue, guaranteeing packets are counted only once,is solvable by the ILP presented above. For each path usedby an OD pair, we create a unique sub-pair which we treatas an independent OD pair. This is shown in Figure 5 by the5Our coverage constraint allows multiple sketches of thesame kind to be placed in the same path. This is becausein some topologies, it may not be feasible to have an equal-ity constraint. In this case, the controller post-processes thesolution and removes duplicates before assigning sketchesfor a given OD pair.6The N term for MaxLoad helps to normalize the values.
red O1-D1 path and the blue O1-D1 path. By computing theILP with multiple paths per OD pair as needed, sketches aredistributed across nodes, and single counting is guaranteed.This method works best when the total number of paths perOD pair is constant relative to the total number of nodes, andlarger numbers of paths will cause the sketches to concen-trate on the source or destination nodes, possibly requiringadditional solutions.
The second issue occurs when multi-path routing causesthe frequency of an item to be split between too many sketches.In the single-path setting, if an OD pair has a globally heavyfeature, then it will be equally heavy or heavier in the sketchwhere it is processed. However in the multi-path case, it ispossible for some OD pairs to have more paths than others,and thus it becomes possible for items that are less frequentbut have fewer routes to be incorrectly reported heavy, and inturn fail to report true heavy elements in the control plane.This problem is shown in Figure 5. In this case, we have10,000 packets from node O1 to D1 split across two paths,and 6,000 packets from O2 to D2. For simplicity, assumewe are only looking for the "heaviest" source IP, the sourceIP with the highest frequency, and that the nodes have a sin-gle IP address, (i.e. Packets go from IPO1
to IPD1and IPO1
IPD2). For this metric, the sketch at A will report IPO1
asa heavy source address with count 5,000, and B will reportIPO2
as a heavy source address with count 6,000. At the dataplane these values are compared again, and the algorithmwould return IPO2
, a false positive, and miss IPO1, a false
negative. To solve this issue, instead of sending the heavyhitter report from individual sketches as described in Algo-rithm 1, the counters from each sketch must be sent directlyto the control plane to be added, reconstructing the entiresketch and allowing the correct heavy hitters to be identi-fied. In our example, the counters for the O1 at A and Bwould be added, and IPO1
would be correctly identified asthe heavy hitter. This approach is already used in the P4implementation discussed below, but is not a requirement ofUnivMon in general. We note that when using the methoddescribed below in Section 6.2, identifying the true IP ad-dress of the heavy item is harder in the multi-path setting,but is solved by increasing γ relative to the maximum num-ber of sketches per true OD pair, which is naturally limitedby the ILP. With these modifications, the heavy hitters arecorrectly found from the combined sketch, and the one bigswitch abstraction are maintained in a multi-path setting.
6 UnivMon ImplementationIn this section, we discuss our data plane implementation inP4 [7, 12]. We begin by giving an overview of key designtradeoffs we considered. Then, we describe how we mapUnivMon into corresponding P4 constructs.
6.1 Implementation overviewAt a high level, realizing the UnivMon design described inthe previous sections entails four key stages:
1. A sampling stage which decides whether an incomingpacket will be added to a specific substream.

Sampling Sketching Top-k HH App-EstimationImplementation Stages
Option 1 Option 2
S Sk Top-k AppData Plane Control Plane
S Sk Top-k AppData Plane Control Plane
Pros: Storage - CommOverheadCons: HW Complexity
table sampling1 actions
sample_1;
table Sket_1 actions
sket_1;
Figure 6: An illustration of UnivMon’s stages along withthe two main implementation options.
2. A sketching stage which calculates sketch counters frominput substreams and populates the respective sketch counterarrays.
3. A top-k computation stage which identifies (approximately)the k heaviest elements of the input stream.
4. An estimation stage which collects the heavy elementfrequencies and calculates the desired metrics.
Let us now map these stages to our data and control planemodules from Figure 1. Our delayed binding principle im-plies that the estimation stage maps to the UnivMon con-trol plane. Since the sampling and sketching are processingpackets, they naturally belong in the data plane to avoid con-trol plane overhead.
One remaining question is whether the top-k computationstage is in the data or control plane (Figure 6). Placing thetop-k stage in the data plane has two advantages. First, thecommunication cost between the data and control plane willbe low, as only the top-k rather than raw counters need tobe transferred. Second, the data plane only needs to keeptrack of the flowkeys (e.g., source IP) of the k heaviest el-ements at any given point in time, and thus not incur highmemory costs. However, one stumbling block is that real-izing this stage requires (i) sorting counter values and (ii)storing information about the heavy elements in some formof a priority queue. Unfortunately, these primitives may behard to implement in hardware and are not supported in P4yet. Thus, we make a pragmatic choice to split the top-kstage between the control and the data planes. We identifythe top-k heavy flowkeys in the dataplane and then we usethe raw data counters to calculate their frequencies in thecontrol plane. The consequence is that we incur higher com-munication overhead to report the raw counter data structure,but the number of flowkeys stored in the data plane remainslow.
UnivMon’s raw counters and flowkeys are stored on thetarget’s on-chip memory (TCAM and SRAM). We argue thatin practice the storage overhead of UnivMon is manageableeven for hardware targets with limited SRAM [4, 8, 47]. Weshow that for the largest traces that we evaluate and with-out losing accuracy, the total size of the raw counters canbe less than 600 KB whereas the cost of storing flowkeys
(assuming k is ≤ 20) is only a few KBs per measurementepoch. Thus, this decision to split the top-k between the twoplanes computation is practical and simplifies the data planerequirements.
6.2 Mapping UnivMon data plane to P4Based on the above discussion, the UnivMon data plane im-plements sampling, sketching, and “heavy” flowkey storagein P4. In a P4 program, packet processing is implementedthrough Match+Action tables, and the control flow of theprogram dictates the order in which these tables are appliedto incoming packets. Given the sketching manifests fromthe control plane, we generate a control program that definesthe different pipelines that a packet needs to be assigned to.These pipelines are specific to the dimension(s) (i.e., sourceIP, 5-tuple) for which the switch needs to maintain a univer-sal sketch. We begin by explaining how we implementedthese functions and then describe a sample control flow.
Sampling: P4 enables programmable calculations on spe-cific header fields using user-defined functions. We use thisto sample incoming packets, with a configurable flowkeythat can be any subset of the 5-tuple (srcIP, dstIP, srcPort,dstPort, protocol). We define l pairwise-independent hashfunctions, where l is the number of levels from §4. Thesefunctions take as input the flowkey and output a binary value.We store this output bit as packet metadata. A packet is sam-pled at level i if the outputs of the hash functions of all levels≤ i is equal to 1. We implement sampling for each level asa table that matches all packets and whose action is to applythe sampling hash function of that level. The hash metadatain the packets are used in conditional statements in the con-trol flow to append the packet to the first i substreams. Pack-ets that are not sampled are not subject to further UnivMonprocessing.7
Sketching: The sketching stage is responsible for maintain-ing counters for each one of the l substreams. From thesesketch counters, we can estimate the L2-HH for each stageand then the overall top-k heavy hitters and their counts.While UnivMon does not impose any constraints on the L2-HH algorithm to be used, in our P4 implementation we useCount Sketch [24]. The sketching computation for each levelis implemented as a table that matches every packet belong-ing to that level’s substream and its actions update the coun-ters, stored in the sketch counter arrays. Similar to the sam-pling stage, we leverage user-defined hash functions that takeas input the same flowkey as in the sampling stage. We usetheir output to retrieve the indexes of the sketch register ar-rays cells that correspond to a particular packet and updatetheir value as dictated by the Count Sketch algorithm.
P4 provides a register abstraction which offers a form ofstateful memory that can store user-defined data and thatcan be arranged into one dimensional arrays of user-definedlength. Register cells can be read or written by P4 actionstatements and are also accessible through the control planeAPI. Given that our goal is to store sketch counter values7There may be other routing/ACL actions to be applied tothe packet but this is outside our scope.
which do not represent byte or packet counts, we use reg-ister arrays to store and update sketch counters. The size ofthe array and the bitlength of each array cell are user-definedand can be varied based on the required memory-accuracytradeoff as well as on the available on-chip memory of thehardware target. Each sketch is an array of t rows and wcolumns. We instantiate register arrays of length t ∗ w, andthe bitlength of each cell is based on the maximum expectedvalue of a counter.
The one remaining issue is storing flowkeys correspond-ing to the “heavy” elements since these will be needed by theestimation stage running in the control plane. One option isto use a priority queue to maintain the top k heavy hitters on-line, as it is probably the most efficient and accurate choiceto maintain heavy flowkeys. However, this can incur morethan constant update time for each element, which makesit difficult to implement on hardware switches. To addressthe issue, we use an alternative approach which is to main-tain a fixed sized table of heavy keys and use constant timeupdates for each operation. It is practical and acceptablewhen the size of the table is small (e.g., 10-50) and the ac-tual number of heavy flows doesn’t greatly exceed this size.The lookup/update operations could be very fast (in a singleclock cycle) when leveraging some special types of memory(e.g., TCAM) on hardware switches.
Another scheme we use is as follows, and we leave im-proved sketches for finding heavy flowkeys as future work.For γ-threshold heavy hitters, there are at most 1/γ of them.While packets are being processed, we maintain an up-to-date L2 value (of the frequency vector), specifically L2 =(L2
2 + (ci + 1)2 −(ci)2)1/2, where ci is each flow’s current
count and we create log(1/γ) buckets of size k. In the onlinestage, when updating the counters in L2-HH, ci is obtainedby reading current sketch counters.
We then maintain buckets marked with L2/2, L2/4, . . . ,γL2. For each element that arrives, if its counter is greaterthanL2/2, insert it into theL2/2 bucket using a simple hash;otherwise, if its counter is greater thanL2/4, insert it into theL2/4 bucket, and so forth. When the value of L2 doublesitself, we delete the last γL2 bucket and we add a new L2/2bucket. This scheme ensures that O(k log(1/γ)) flowkeysare stored, and at the end of the stream we can return mosttop k items heavier than γL2.
P4 Control Flow: As a simple starting point, we use a se-quential control flow to avoid cloning every incoming packetl (i.e., number of levels) times. This means that every packetis processed by a sketching, a storage and a sampling tablesequentially until the first level where it doesn’t get sampled.More specifically, after a packet passes the parsing stage dur-ing which P4 extracts its header fields, it is first processedby the sketching table of level_0. The “heavy” keys for thatstage are updated and then it is processed by the samplingtable of level_1. If the packet gets sampled at level_1, it issketched at this level, the “heavy” keys are updated and theprocedure continues until the packet reaches the last level oruntil it is not sampled.
6.3 Control planeWe implement the UnivMon control plane as a set of cus-tom C++ modules and libraries. We implement modulesfor (1) Assigning sketching responsibilities to the networkelements, and (2) implementing the top-k and estimationstages. The P4 framework allows us to define the API forcontrol-data plane communication. We currently use a sim-ple RPC protocol that allows us to import sketching mani-fests and to query the contents of data plane register arrays
After the heavy flowkeys and their respective countershave been collected, the frequencies of the k-most frequentelements in the stream are extracted. The heavy elementsalong with the statistical function of the metric to be esti-mated are then fed to the recursive algorithm of UnivMon’sestimation stage.
7 EvaluationWe divide our evaluation into two parts. First, we focuson a single router setup and compare UnivMon vs. customsketches via OpenSketch [47]. Second, we demonstrate thebenefits of our network-wide coordination mechanisms.
7.1 Evaluation setupWe begin by describing our trace-driven evaluation setup.
Applications and error metrics: We have currently imple-mented translation libraries for five monitoring tasks: HeavyHitter detection (HH), DDoS detection (DDoS), Change De-tection (Change), Entropy Estimation (Entropy), and GlobalIceberg Detection (Iceberg). For brevity, we only show re-sults for metrics computed over one feature, namely the sourceIP address; our results are qualitatively similar for other di-mensions too.
For Heavy Hitters and Global Iceberg detection, we seta threshold T = 0.05% of the link capacity and identify alllarge flows that consume more traffic than that threshold. Weobtain the average relative error on the counts of each identi-fied large flow; i.e., |True−Estimate|
True . For Change Detection,whose frequency has changed more than a threshold φ of thetotal change over all flows across two monitoring windows.We chose this threshold to be 0.05% and calculate the aver-age relative error similar to HH. For Entropy Estimation andDDoS, we evaluate the relative error on estimated entropyvalue and the number of distinct source IPs.
Configuration: We normalize UnivMon’s memory usagewith the custom sketches by varying three key parameters:number of rows t and number of columnsw in Count-Sketchtables, and the number of levels l in the universal sketch. Intotal UnivMon uses t × w × l counters. In OpenSketch,we configure the memory usage in a similar way by varyingnumber of rows t and counters per row w in all the sketchesthey use. When comparing the memory usage with OpenS-ketch, we calculate the total number of sketch counters as-suming that each integer counter occupies 4 bytes. Both Uni-vMon and OpenSketch use randomized algorithms; we runthe experiment 10 times with random hash seeds and reportthe median cross these runs.

Trace Loc Date and Time1. CAIDA’15 Equinix-Chicago 2015/02/192. CAIDA’15 Equinix-Chicago 2015/05/213. CAIDA’15 Equinix-Chicago 2015/09/174. CAIDA’15 Equinix-Chicago 2015/12/175. CAIDA’14 Equinix-Sanjose 2014/06/19
Table 1: CAIDA traces in the evaluation
Traces: For this evaluation, we use five different one-hourbackbone traces (Table 1) collected at backbone links of aTier1 ISP between (i) Chicago, IL and Seattle, WA in 2015and (ii) between San Jose and Los Angeles in 2014 [1, 2].We split the traces into different representative time inter-vals (5s, 30s, 1min, 5min). For example, each one hour tracecontains 720 5s-epoch data points and we report min, 25%,median, 75%, and max on whisker bars. By default, we re-port results for a 5-second trace. Each 5s packet-trace con-tains 155k to 286k packets with ∼55k distinct source IP ad-dresses and ∼40k distinct destination IP addresses. The linkspeed of these traces is 10 Gbps.Experiment Setup: For our P4 implementation prototype,we used the P4 behavioral simulator, which is essentially aP4-enabled software switch [6]. To validate the correctnessof our P4 implementation, we compare it against a softwareimplementation of the data plane and control plane algo-rithms, written in C++. We evaluate P4 prototype on Trace1 and run software implementation in parallel on Trace 1- 5.The results between the two implementations are consistentas the relative error between the results of the two imple-mentations does not exceed 0.3%. To evaluate OpenSketch,we use its simulator written in C++ [5].
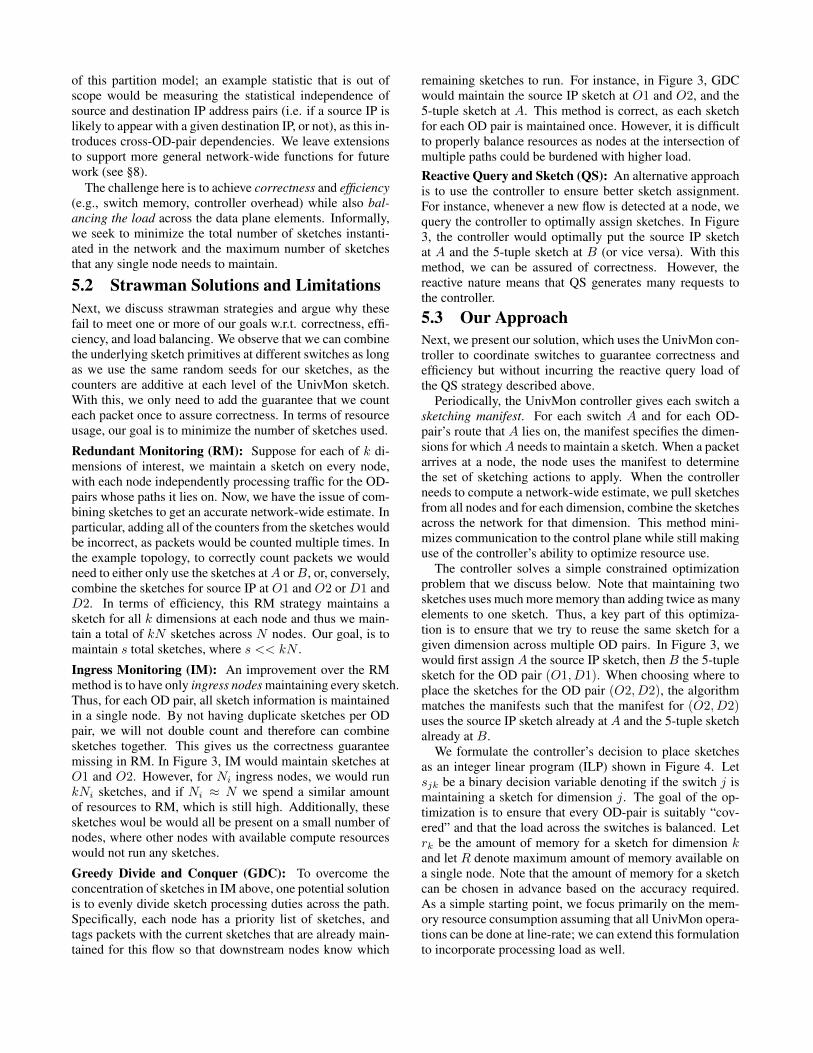
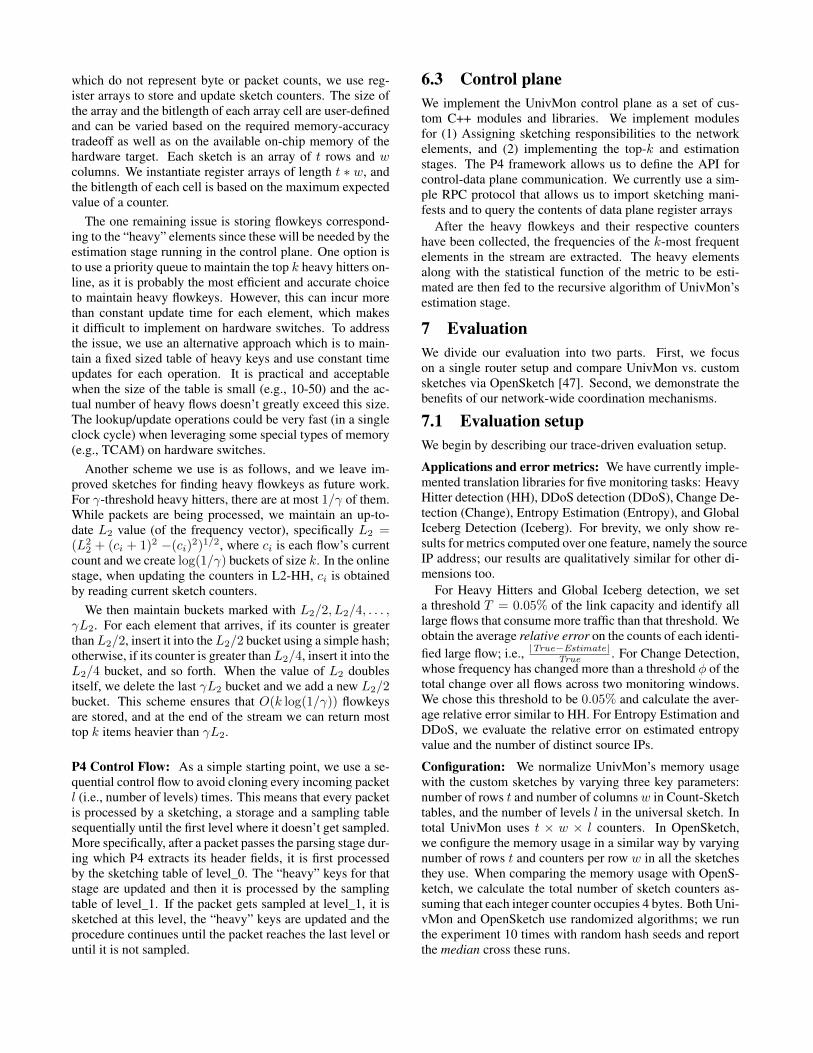
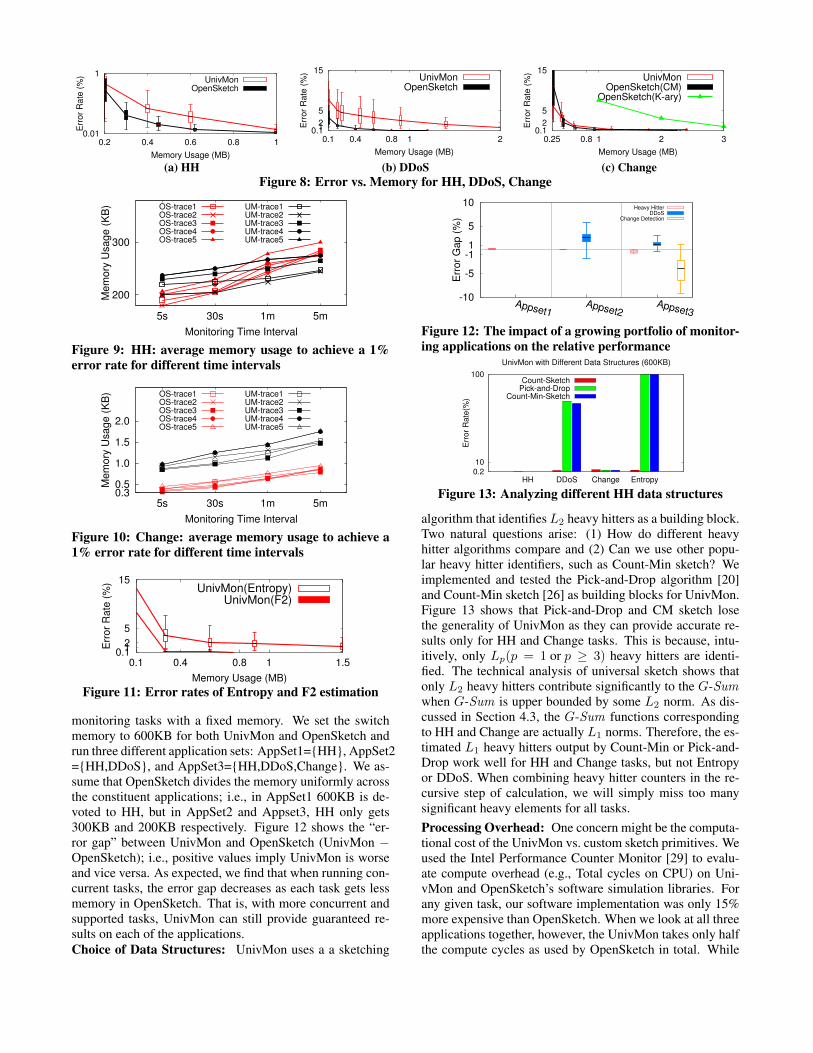
7.2 Single Router EvaluationComparison under fixed memory setting: First, we com-pare UnivMon and OpenSketch on the applications that OpenS-ketch supports: HH, Change, and DDoS. In Figures 7a and7b, we assign 600KB memory and use all traces in order toestimate the error when running UnivMon and OpenSketch.We find that the absolute error is very small for both ap-proaches. We observe that OpenSketch provides slightly bet-ter results for all three metrics. However we note that Uni-vMon uses 600KB memory to run three tasks concurrentlywhile OpenSketch is given 600KB to run each task. Figure7a and 7b confirm that this observation holds on multipletraces; the error gap between UnivMon and OpenSketch is≤3.6%.Accuracy vs. Memory: The previous result considered afixed memory value. Next, we study the sensitivity of theerror to the memory available. Figure 8a and 8b shows thatthe error is already quite small for all the HH and DDoS ap-plications and that the gap is almost negligible with slightlyincreased memory ≥ 1MB.
Figure 8c shows the results for the Change Detection task.For this task, the original OpenSketch paper uses a stream-ing algorithm based on reversible k-ary sketches [44]. Weimplement an extension to OpenSketch using a similar ideaas UnivMon.8 Our evaluation results show that our exten-8We maintain two recent Count-Min sketches using the
0.011
5
10
OC192-P4OC192-1
OC192-2OC192-3
OC192-4OC192-5
Err
or
Ra
te (
%)
Heavy HitterChange Detection
DDoS
(a) UnivMon
0.01
1
2
3
OC192-1OC192-2
OC192-3OC192-4
OC192-5
Err
or
Ra
te (
%)
Heavy HitterChange Detection
DDoS
(b) OpenSketchFigure 7: Error rates of HH, Change and DDoS for Uni-vMon and OpenSketch
sion offers better accuracy vs. memory tradeoff than OpenS-ketch’s original method [44]. For completeness, we also re-port the memory usage of OpenSketch’s original design (us-ing the k-ary sketch). From Figure 8c, we see UnivMonprovides comparable accuracy even though UnivMon has amuch smaller sketch table on each level of its hierarchicalstructure. This is because the “diff” across sketches are wellpreserved in UnivMon’s structure.Fixed Target Errors: Next, we evaluate the memory neededto achieve the same error rates (≤1%). In Figures 9 and 10 aswe vary the monitoring window, we can see that only smallamount of memory increase is required for both UnivMonand OpenSketch to achieve 1% error rates. In fact, we findthat UnivMon does not require more memory to maintain astable error rate for increased number of flows in the traffic.This is largely because sketch-based approaches usually justtake logarithmic memory increase in terms of input size tomaintain similar error guarantees. Furthermore, the natureof traffic distribution also helps as there are only a few veryheavy flows and the entire distribution is quite ‘flat’.Other metrics: We also considered metrics not in the OpenS-ketch library in Figure 11 to confirm that UnivMon is able tocalculate a low-error estimate. Specifically, we consider theentropy of the distribution and the second frequency momentF2 = f21 + f22 · · ·+ f2m for m distinct elements.9 Again, wefind that with reasonable amounts of memory (≥ 500KB)the error of UnivMon is very low.Impact of Application Portfolio: Next, we explore howUnivMon and OpenSketch handle a growing portfolio of
same hash functions; combine two sketches by one sketch“subtracts” the other; and use reversible sketch to trace backthe keys.9This is a measure of the “skewness” and is useful to calcu-late repeated rate or Gini index of homogeneity.
0.01
1
0.2 0.4 0.6 0.8 1
Err
or
Rate
(%
)
Memory Usage (MB)
UnivMonOpenSketch
(a) HH
0.112
5
15
0.1 0.4 0.8 1 2
Err
or
Rate
(%
)
Memory Usage (MB)
UnivMonOpenSketch
(b) DDoS
0.12
5
15
0.25 0.8 1 2 3
Err
or
Rate
(%
)
Memory Usage (MB)
UnivMonOpenSketch(CM)
OpenSketch(K-ary)
(c) ChangeFigure 8: Error vs. Memory for HH, DDoS, Change
200
300
5s 30s 1m 5m
Mem
ory
Usage (
KB
)
Monitoring Time Interval
OS-trace1OS-trace2OS-trace3OS-trace4OS-trace5
UM-trace1UM-trace2UM-trace3UM-trace4UM-trace5
Figure 9: HH: average memory usage to achieve a 1%error rate for different time intervals
0.30.5
1.0
1.5
2.0
5s 30s 1m 5m
Mem
ory
Usage (
KB
)
Monitoring Time Interval
OS-trace1OS-trace2OS-trace3OS-trace4OS-trace5
UM-trace1UM-trace2UM-trace3UM-trace4UM-trace5
Figure 10: Change: average memory usage to achieve a1% error rate for different time intervals
0.112
5
15
0.1 0.4 0.8 1 1.5
Err
or
Ra
te (
%)
Memory Usage (MB)
UnivMon(Entropy)UnivMon(F2)
Figure 11: Error rates of Entropy and F2 estimation
monitoring tasks with a fixed memory. We set the switchmemory to 600KB for both UnivMon and OpenSketch andrun three different application sets: AppSet1=HH, AppSet2=HH,DDoS, and AppSet3=HH,DDoS,Change. We as-sume that OpenSketch divides the memory uniformly acrossthe constituent applications; i.e., in AppSet1 600KB is de-voted to HH, but in AppSet2 and Appset3, HH only gets300KB and 200KB respectively. Figure 12 shows the “er-ror gap” between UnivMon and OpenSketch (UnivMon −OpenSketch); i.e., positive values imply UnivMon is worseand vice versa. As expected, we find that when running con-current tasks, the error gap decreases as each task gets lessmemory in OpenSketch. That is, with more concurrent andsupported tasks, UnivMon can still provide guaranteed re-sults on each of the applications.Choice of Data Structures: UnivMon uses a a sketching
-10
-5
-11
5
10
Appset1Appset2
Appset3
Err
or
Ga
p (
%)
Heavy HitterDDoS
Change Detection
Figure 12: The impact of a growing portfolio of monitor-ing applications on the relative performance
0.2
10
100
HH DDoS Change Entropy
Err
or
Rate
(%)
UnivMon with Different Data Structures (600KB)
Count-SketchPick-and-Drop
Count-Min-Sketch
Figure 13: Analyzing different HH data structures
algorithm that identifies L2 heavy hitters as a building block.Two natural questions arise: (1) How do different heavyhitter algorithms compare and (2) Can we use other popu-lar heavy hitter identifiers, such as Count-Min sketch? Weimplemented and tested the Pick-and-Drop algorithm [20]and Count-Min sketch [26] as building blocks for UnivMon.Figure 13 shows that Pick-and-Drop and CM sketch losethe generality of UnivMon as they can provide accurate re-sults only for HH and Change tasks. This is because, intu-itively, only Lp(p = 1 or p ≥ 3) heavy hitters are identi-fied. The technical analysis of universal sketch shows thatonly L2 heavy hitters contribute significantly to the G-Sumwhen G-Sum is upper bounded by some L2 norm. As dis-cussed in Section 4.3, the G-Sum functions correspondingto HH and Change are actually L1 norms. Therefore, the es-timated L1 heavy hitters output by Count-Min or Pick-and-Drop work well for HH and Change tasks, but not Entropyor DDoS. When combining heavy hitter counters in the re-cursive step of calculation, we will simply miss too manysignificant heavy elements for all tasks.Processing Overhead: One concern might be the computa-tional cost of the UnivMon vs. custom sketch primitives. Weused the Intel Performance Counter Monitor [29] to evalu-ate compute overhead (e.g., Total cycles on CPU) on Uni-vMon and OpenSketch’s software simulation libraries. Forany given task, our software implementation was only 15%more expensive than OpenSketch. When we look at all threeapplications together, however, the UnivMon takes only halfthe compute cycles as used by OpenSketch in total. While

0.1
1
ATT-N.A. GEANT BellSouth
Err
or
Rate
(%
)
Network Wide Evaluation (600KB per sketch)
IngressGreedy-D.&C.
Q.&S.UnivMon
(a) Error rates of global iceberg detection
0
500
1000
1500
2000
ATT-N.A. GEANT BellSouth
Avera
ge M
em
ory
(KB
)
Network Wide Evaluation (600KB per sketch)
IngressGreedy-D.&C.
Q.&S.UnivMon
(b) Average memory consumption
0.1k
1k
2k
ATT-N.A. GEANT BellSouth
Tota
l re
quests
to c
ontr
olle
r
Network Wide Evaluation (600KB per sketch)
IngressGreedy-D.&C.
Q.&S.UnivMon
(c) Total number of requests to controllerFigure 14: Network-wide evaluation on major ISP backbone topologies
Topology OD Pairs Dim. Time (s) Total SketchesGeant2012 1560 4 0.09 68Bellsouth 2550 4 0.10 60Dial Telecom 18906 4 2.8 252Geant2012 1560 8 0.22 136Bellsouth 2550 8 0.28 120Dial Telecom 18906 8 12.6 504
Table 2: Time to compute sketching manifests using ILP
we acknowledge that we cannot directly translate into ac-tual hardware processing overheads, this suggests that Uni-vMon’s compute footprint will be comparable and possiblybetter.
7.3 Network-wide EvaluationFor the network-wide evaluation, we consider different topolo-gies from the Topology Zoo dataset [35]. As a specific network-wide task, we consider the problem of estimating source IPand destination IP “icebergs”. We report the average relativeerrors across these two tasks.Benefits of Coordination: Figure 14a, Figure 14b, andFigure 14c present the error, average memory consumption,and total controller requests of four solutions: Ingress Moni-toring(IM), Greedy Divide and Conquer(GDC), Query andSketch(QS), and our approach(UnivMon). We pick threerepresentative topologies: AT&T North America, Geant, andBell South. We see that UnivMon provides an even distribu-tion of resources on each node while providing results withhigh accuracy. Furthermore, the control overhead is severalorders of magnitude smaller than purely reactive approaches.ILP solving time: One potential concern is the time to solvethe ILP. Table 2 shows the time to compute the ILP solutionon a Macbook Pro with a 2.5 GHz Intel Core i7 processor us-ing glpsol allowing at most k sketches per switch, wherek is the number of dimensions maintained. We see that theILP computation takes at most a few seconds which suggestthat updates can be pushed to switches with reasonable re-sponsiveness as the topology or routing policy changes.
7.4 Summary of Main FindingsOur analysis of UnivMon’s performance shows that:
1. For a single router with 600KB of memory, we observecomparable median error rate values between UnivMonand OpenSketch, with a relative error gap ≤ 3.6%. Therelative error decreases significantly with a growing ap-plication portfolio.
2. When comparing sensitivity to error and available mem-ory, we observe that UnivMon provides comparable ac-curacy with OpenSketch with similar, or smaller memoryrequirements.
3. The network-wide evaluation shows that UnivMon pro-vides an even distribution of resources on each node whileproviding results with high accuracy.
8 Conclusions and Future WorkIn contrast to the status quo in flow monitoring that can of-fer generality or fidelity but not both simultaneously, Univ-Mon offers a dramatically different design point by leverag-ing recent theoretical advances in universal streaming. Bydelaying the binding of data plane primitives to specific (andunforeseen) monitoring UnivMon provides a truly software-defined monitoring approach that can fundamentally changenetwork monitoring. We believe that this “minimality” ofthe UnivMon design will naturally motivate hardware ven-dors to invest time and resources to develop optimized hard-ware implementations, in the same way that a minimal dataplane was key to get vendor buy-in for SDN [40].
Our work in this paper takes UnivMon beyond just a the-oretical curiosity and demonstrates a viable path toward aswitch implementation and a network-wide monitoring ab-straction. We also demonstrate that UnivMon is already verycompetitive w.r.t. custom solutions and that the trajectory(i.e., as the number of measurement tasks grows) is clearlybiased in favor of UnivMon vs. custom solutions.
UnivMon already represents a substantial improvementover the status quo, That said, we identify several avenuesfor future work to further push the envelope. First, in termsof the data plane, while the feasibility of mapping UnivMonto P4 is promising and suggests a natural hardware mapping,we would like to further demonstrate an actual hardware im-plementation on both P4-like and other flow processing plat-forms. Second, in terms of the one-big-switch abstraction,we need to extend our coordination and sketching primitivesto capture other classes of network-wide tasks that entailcross-OD-pair dependencies. Third, while the ILP is quitescalable for many reasonable sized topologies, we may needother approximation algorithms (e.g., via randomized round-ing) to handle even larger topologies. Fourth, in terms of thevarious dimensions of interest to track, we currently main-tain independent sketches; a natural question if we can avoid

explicitly creating a sketch per dimension. Finally, while be-ing application agnostic gives tremendous power, it might beuseful to consider additional tailoring where operators maywant the ability to adjust the granularity of the measurementto dynamically focus on sub-regions of interest [48].
Acknowledgments: We thank our shepherd MohammadAlizadeh and the SIGCOMM reviewers for their commentsthat helped improve the paper. This work was supported inpart by NSF awards CCF-1536002, IIS-1447639, RaytheonBBN Technologies, and by a Google Faculty Award.
9 References[1] Caida internet traces 2014 sanjose. http://goo.gl/uP5aqG.[2] Caida internet traces 2015 chicago. http://goo.gl/xgIUmF.[3] Intel flexpipe. http://goo.gl/H5qPP2.[4] Netfpga technical specifications. http://netfpga.org/1G_specs.html.[5] Opensketch simulation library. https://goo.gl/kyQ80q.[6] P4 behavioral simulator. https://github.com/p4lang/p4factory.[7] P4 specification. http://goo.gl/5ttjpA.[8] Why big data needs big buffer switches. https://goo.gl/ejWUIq.[9] N. Alon, Y. Matias, and M. Szegedy. The space complexity of
approximating the frequency moments. In Proc., STOC, 1996.[10] N. Bandi, A. Metwally, D. Agrawal, and A. El Abbadi. Fast data
stream algorithms using associative memories. In Proc., SIGMOD,2007.
[11] T. Benson, A. Anand, A. Akella, and M. Zhang. Microte: Finegrained traffic engineering for data centers. In Proc., CoNEXT, 2011.
[12] P. Bosshart, D. Daly, G. Gibb, M. Izzard, N. McKeown, J. Rexford,C. Schlesinger, D. Talayco, A. Vahdat, G. Varghese, and D. Walker.P4: Programming protocol-independent packet processors.SIGCOMM Comput. Commun. Rev., July 2014.
[13] P. Bosshart, G. Gibb, H.-S. Kim, G. Varghese, N. McKeown,M. Izzard, F. Mujica, and M. Horowitz. Forwarding metamorphosis:Fast programmable match-action processing in hardware for sdn. InProc., SIGCOMM, 2013.
[14] V. Braverman and S. R. Chestnut. Universal Sketches for theFrequency Negative Moments and Other Decreasing StreamingSums. In APPROX/RANDOM, 2015.
[15] V. Braverman, S. R. Chestnut, R. Krauthgamer, and L. F. Yang.Streaming symmetric norms via measure concentration. CoRR, 2015.
[16] V. Braverman, S. R. Chestnut, D. P. Woodruff, and L. F. Yang.Streaming space complexity of nearly all functions of one variable onfrequency vectors. In Proc., PODS, 2016.
[17] V. Braverman, J. Katzman, C. Seidell, and G. Vorsanger. An optimalalgorithm for large frequency moments using o(nˆ(1-2/k)) bits. InAPPROX/RANDOM, 2014.
[18] V. Braverman, Z. Liu, T. Singh, N. V. Vinodchandran, and L. F.Yang. New bounds for the CLIQUE-GAP problem using graphdecomposition theory. In In Proc., MFCS, 2015.
[19] V. Braverman and R. Ostrovsky. Zero-one frequency laws. In Proc.,STOC, 2010.
[20] V. Braverman and R. Ostrovsky. Approximating large frequencymoments with pick-and-drop sampling. In APPROX/ROMDOM,2013.
[21] V. Braverman and R. Ostrovsky. Generalizing the layering method ofindyk and woodruff: Recursive sketches for frequency-based vectorson streams. In APPROX/RAMDOM. 2013.
[22] V. Braverman, R. Ostrovsky, and A. Roytman. Zero-one laws forsliding windows and universal sketches. In APPROX/RANDOM,2015.
[23] A. Chakrabarti, S. Khot, and X. Sun. Near-optimal lower bounds onthe multi-party communication complexity of set disjointness. InIEEE CCC, 2003.
[24] M. Charikar, K. Chen, and M. Farach-Colton. Finding frequent itemsin data streams. In Automata, Languages and Programming. 2002.
[25] B. Claise. Cisco systems netflow services export version 9. RFC3954.
[26] G. Cormode and S. Muthukrishnan. An improved data streamsummary: The count-min sketch and its applications. J. Algorithms,2005.
[27] S. Dasgupta and A. Gupta. An elementary proof of a theorem ofjohnson and lindenstrauss. Random Struct. Algorithms, Jan. 2003.
[28] M. Datar, A. Gionis, P. Indyk, and R. Motwani. Maintaining streamstatistics over sliding windows. SIAM J. Comput., June 2002.
[29] R. Dementiev, T. Willhalm, O. Bruggeman, P. Fay, P. Ungerer,A. Ott, P. Lu, J. Harris, P. Kerly, P. Konsor, A. Semin, M. Kanaly,R. Brazones, and R. Shah. Intel performance counter monitor - abetter way to measure cpu utilization. http://goo.gl/tQ5gxa.
[30] N. Duffield, C. Lund, and M. Thorup. Estimating flow distributionsfrom sampled flow statistics. In Proc., SIGCOMM, 2003.
[31] C. Estan and G. Varghese. New directions in traffic measurement andaccounting. In Proc., SIGCOMM, 2002.
[32] A. Feldmann, A. Greenberg, C. Lund, N. Reingold, J. Rexford, andF. True. Deriving traffic demands for operational ip networks:Methodology and experience. IEEE/ACM Trans. Netw., June 2001.
[33] P. Indyk, A. McGregor, I. Newman, and K. Onak. Open problems indata streams, property testing, and related topics. 2011.
[34] N. Kang, Z. Liu, J. Rexford, and D. Walker. Optimizing the "one bigswitch" abstraction in software-defined networks. In Proc., CoNEXT,2013.
[35] S. Knight, H. Nguyen, N. Falkner, R. Bowden, and M. Roughan. Theinternet topology zoo. Selected Areas in Communications, IEEEJournal on, october 2011.
[36] B. Krishnamurthy, S. Sen, Y. Zhang, and Y. Chen. Sketch-basedchange detection: methods, evaluation, and applications. In Proc.,ACM SIGCOMM IMC, 2003.
[37] A. Kumar, M. Sung, J. J. Xu, and J. Wang. Data streamingalgorithms for efficient and accurate estimation of flow sizedistribution. In Proc., SIGMETRICS, 2004.
[38] A. Lall, V. Sekar, M. Ogihara, J. Xu, and H. Zhang. Data streamingalgorithms for estimating entropy of network traffic. In Proc.,SIGMETRICS/Performance, 2006.
[39] Z. Liu, G. Vorsanger, V. Braverman, and V. Sekar. Enabling a "risc"approach for software-defined monitoring using universal streaming.In Proc., ACM HotNets, 2015.
[40] N. McKeown, T. Anderson, H. Balakrishnan, G. Parulkar,L. Peterson, J. Rexford, S. Shenker, and J. Turner. Openflow:Enabling innovation in campus networks. SIGCOMM Comput.Commun. Rev., Mar. 2008.
[41] M. Moshref, M. Yu, R. Govindan, and A. Vahdat. SCREAM: SketchResource Allocation for Software-defined Measurement. In Proc.,CoNEXT, 2015.
[42] B. Pfaff, J. Pettit, T. Koponen, K. Amidon, M. Casado, andS. Shenker. Extending networking into the virtualization layer. InProc., HotNets, 2009.
[43] A. Ramachandran, S. Seetharaman, N. Feamster, and V. Vazirani.Fast monitoring of traffic subpopulations. In Proc., IMC, 2008.
[44] R. Schweller, A. Gupta, E. Parsons, and Y. Chen. Reversible sketchesfor efficient and accurate change detection over network datastreams. In Proc., IMC, 2004.
[45] V. Sekar, M. K. Reiter, and H. Zhang. Revisiting the case for aminimalist approach for network flow monitoring. In Proc., IMC,2010.
[46] Y. Xie, V. Sekar, D. A. Maltz, M. K. Reiter, and H. Zhang. Wormorigin identification using random moonwalks. In S&P. IEEEComputer Society, 2005.
[47] M. Yu, L. Jose, and R. Miao. Software defined traffic measurementwith opensketch. In Proc., NSDI, 2013.
[48] L. Yuan, C.-N. Chuah, and P. Mohapatra. Progme: towardsprogrammable network measurement. IEEE/ACM TON, 2011.
[49] Y. Zhang. An adaptive flow counting method for anomaly detectionin sdn. In Proc., CoNEXT, 2013.
[50] H. C. Zhao, A. Lall, M. Ogihara, O. Spatscheck, J. Wang, and J. Xu.A data streaming algorithm for estimating entropies of od flows. InProc., IMC, 2007.
[51] H. C. Zhao, A. Lall, M. Ogihara, and J. J. Xu. Global icebergdetection over distributed data streams. In Proc., ICDE, 2010.