One-Question IQ Test There is a deaf-mute who wants to buy a toothbrush. By imitating the action of...
25
One-Question IQ Test One-Question IQ Test There is a deaf-mute who wants to buy a There is a deaf-mute who wants to buy a toothbrush. By imitating the action of toothbrush. By imitating the action of brushing one's teeth, he successfully brushing one's teeth, he successfully expresses himself to the shopkeeper and the expresses himself to the shopkeeper and the purchase is done. purchase is done. Now, if there is a blind man who wishes to Now, if there is a blind man who wishes to buy a pair of sunglasses, how should he buy a pair of sunglasses, how should he express himself? express himself? Essential Terms: Production Possibilities Curve, Production Possibilities Frontier, efficiency, underutilization, law of increasing costs
-
date post
19-Dec-2015 -
Category
Documents
-
view
214 -
download
0
Transcript of One-Question IQ Test There is a deaf-mute who wants to buy a toothbrush. By imitating the action of...

One-Question IQ TestOne-Question IQ TestThere is a deaf-mute who wants to buy a There is a deaf-mute who wants to buy a
toothbrush. By imitating the action of brushing toothbrush. By imitating the action of brushing one's teeth, he successfully expresses himself one's teeth, he successfully expresses himself to the shopkeeper and the purchase is done. to the shopkeeper and the purchase is done.
Now, if there is a blind man who wishes to buy Now, if there is a blind man who wishes to buy a pair of sunglasses, how should he express a pair of sunglasses, how should he express
himself?himself?
Essential Terms: Production Possibilities Curve, Production Possibilities Frontier, efficiency, underutilization, law of increasing costs


Decisions at the MarginDecisions at the Margin
““How much?” instead of “What?How much?” instead of “What?Satisfaction with individual unit Satisfaction with individual unit
decreases as additional units are decreases as additional units are addedadded
Productivity of individual unit Productivity of individual unit decreases as additional units are decreases as additional units are addedadded
Law of diminishing returnsLaw of diminishing returns

1-3a
Production Possibilities
Graph
shows alternative ways to use an
economy's resource
production possibilities
frontier
line on a production possibilities
graph shows the maximum possible output
each point on the line reflects
a trade-off
any point on the line represents the
maximum combination of two resources

Guns v Butter
0
2
4
6
8
10
12
14
16
0 5 10 15 20 25
Guns
Bu
tte
r

Efficiency and
Growth
1-3b
copyright 2002 by John Retzer
Efficiency: using resources in such a way as to maximize
production
any point inside the frontier represents underutilization of
resources
production possibilities curve moves to the right because of growth
PPC moves to the left with a shrinking
economy

Guns v Butter II
0
2
4
6
810
12
14
16
18
0 5 10 15 20 25
Guns
Bu
tter
Before
After
Underutilization
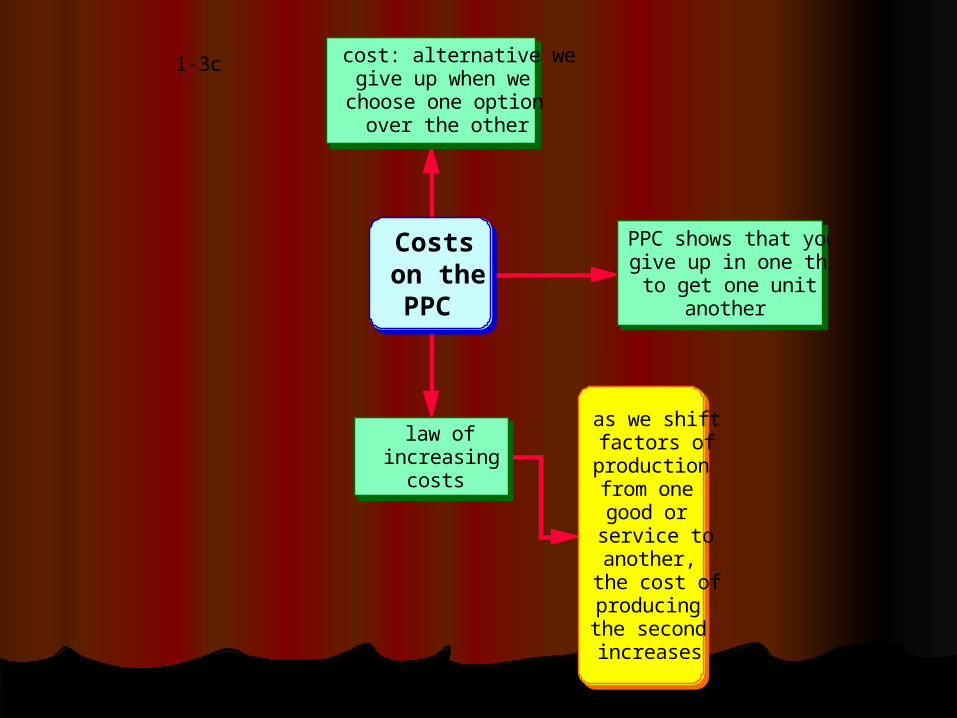
1-3c
Costs on the PPC
cost: alternative we give up when we
choose one option over the other
PPC shows that you give up in one thing
to get one unit of another
law of increasing
costs
as we shift factors of
production from one good or
service to another,
the cost of producing
the second increases

Law of Increasing CostsLaw of Increasing Costs
=10
=10
=10
____
30
=10
=10
=10
____
30
Ore Grain
30 30

=10
=10
=10
=5
____
35
=10
=10
____
20
Ore Grain
30 30
35 20

=10
=10
____
20
=5
=10
=10
=10
____
35
Ore Grain
20 35
30 30
35 20


Guns Butter0 158 1414 1218 920 521 0
Graph the following Production Possibilities Curve:

Guns v Butter
0
2
4
6
8
10
12
14
16
0 5 10 15 20 25
Guns
Bu
tte
r

Now, insert a point showing
underutilization.

Guns v Butter
0
2
4
6
8
10
12
14
16
0 5 10 15 20 25
Guns
Bu
tte
r
* Underutilization

GunsGuns ButterButter22 17171010 16161616 14142020 11112222 772323 22
After technological improvements, here is the new Production Possibilities Data. Graph this on the old chart.

Guns v Butter II
0
2
4
6
810
12
14
16
18
0 5 10 15 20 25
Guns
Bu
tter
Before
After


1. Use the data above to construct a Production Possibilities Curve. Be sure to label your graph.
2. Mattel produces only 3 million Kens and 5 million Barbies. Plot this point on the graph above.
3. What does this new point represent (in relation to the original line.)
KensKens BarbieBarbiess
11 9933 7755 5577 3399 11

Barbies v Kens
0
2
4
6
8
10
0 2 4 6 8 10
Kens
Bar
bie
s

The next year, Mattel invests in new equipment. The table below represents the new combinations of Kens and Barbies that it could produce.
Use this data to construct a new Production Possibilities Curve on the same grid.
What does this new line represent (in relation to the old)
KensKens BarbieBarbiess
1010 22
88 44
66 66
44 88
22 1010

Barbies v Kens
0
2
4
6
8
10
12
0 2 4 6 8 10 12
Kens
Ba
rbie
s