One Dimensional Steady Flow Analysis Using HEC- RAS – A ...
11
European Scientific Journal November 2016 edition vol.12, No.32 ISSN: 1857 – 7881 (Print) e - ISSN 1857- 7431 340 One Dimensional Steady Flow Analysis Using HEC- RAS – A case of River Jhelum, Jammu and Kashmir Hakim Farooq Ahmad Ph.D Research Scholar Dept. Of Geography and Regional Development University of Kashmir, Srinagar, India Akhtar Alam Remote Sensing and GIS Analyst Dept. Of Geography and Regional Development University of Kashmir, Srinagar, India M. Sultan Bhat Professor Dept. Of Geography and Regional Development University of Kashmir, Srinagar, India Shabir Ahmad Research Associate Dept. Of Geography and Regional Development University of Kashmir, Srinagar, India doi: 10.19044/esj.2016.v12n32p340 URL:http://dx.doi.org/10.19044/esj.2016.v12n32p340 Abstract Floods have been recurrent phenomena in the study area. A heavy precipitation, usually coming during the end months of the summer season in association with sudden cloudburst, leads to severe flooding in the study area. By now the catchment area of the river is already saturated and the high run-off swells the rivers beyond their capacity. The present study describes the application of HEC RAS Model for flood studies in the river Jhelum Kashmir valley. The peak flood records were used as inputs into HEC RAS model to find out the resultant expected flood levels. The resultant output generated by the model shows an overflow at maximum locations of the river under study for 50 years and above return period. This purpose is to give a hand to policy makers, planners and insurers, to develop a robust strategy for the development of flood mitigation measures and plans to minimise the losses associated with the disaster in the study area. Keywords: Flood, HEC-RAS Modelling, River Jhelum Introduction The flood modelling is one of the engineering tools which provide accurate information of the flood profile. The rainfall, runoff, catchment characteristics, and return period are the parameters which govern the flood.
Transcript of One Dimensional Steady Flow Analysis Using HEC- RAS – A ...
European Scientific Journal November 2016 edition vol.12, No.32 ISSN: 1857 – 7881 (Print) e - ISSN 1857- 7431
340
One Dimensional Steady Flow Analysis Using HEC-RAS – A case of River Jhelum, Jammu and Kashmir
Hakim Farooq Ahmad Ph.D Research Scholar Dept. Of Geography and Regional Development
University of Kashmir, Srinagar, India Akhtar Alam
Remote Sensing and GIS Analyst Dept. Of Geography and Regional Development University of Kashmir, Srinagar, India
M. Sultan Bhat Professor Dept. Of Geography and Regional Development
University of Kashmir, Srinagar, India Shabir Ahmad
Research Associate Dept. Of Geography and Regional Development University of Kashmir, Srinagar, India
doi: 10.19044/esj.2016.v12n32p340 URL:http://dx.doi.org/10.19044/esj.2016.v12n32p340
Abstract Floods have been recurrent phenomena in the study area. A heavy precipitation, usually coming during the end months of the summer season in association with sudden cloudburst, leads to severe flooding in the study area. By now the catchment area of the river is already saturated and the high run-off swells the rivers beyond their capacity. The present study describes the application of HEC RAS Model for flood studies in the river Jhelum Kashmir valley. The peak flood records were used as inputs into HEC RAS model to find out the resultant expected flood levels. The resultant output generated by the model shows an overflow at maximum locations of the river under study for 50 years and above return period. This purpose is to give a hand to policy makers, planners and insurers, to develop a robust strategy for the development of flood mitigation measures and plans to minimise the losses associated with the disaster in the study area.
Keywords: Flood, HEC-RAS Modelling, River Jhelum Introduction The flood modelling is one of the engineering tools which provide accurate information of the flood profile. The rainfall, runoff, catchment characteristics, and return period are the parameters which govern the flood.
European Scientific Journal November 2016 edition vol.12, No.32 ISSN: 1857 – 7881 (Print) e - ISSN 1857- 7431
341
These parameters are used as input variables along with cross section and L section of river (Correia et. al. 1999, Ahmad et. al. 2013, Zeinyvand 2001). Using a computational model has many advantages e.g. Calculating flood elevations with a properly written and documented program (one that is accepted by an oversight agency) is a scientific and defensible analytical technique. A numerical model also gives solutions that are reproducible by other researchers (Dyhouse,2003, Youngping and Qaiser 2011). With a hydraulic model, floods can be analyzed without waiting for the events to actually occur (Dyhouse,2003, Arcement et. al. 1989). A hydraulic model allows for quick modification of key variables, such as Manning's n, to perform sensitivity tests, thereby assessing the importance of each variable in determining the final water surface elevations. (Dyhouse,2003) Floodplain modelling can focus on several different areas, including preparation of comprehensive floodplain studies, design of transportation features (such as roads and bridges) or other facilities, floodway development, and structural and non-structural solutions to flood problems (Parviz et. al. 2013, Kyle et. al. 2011, Catchment and creeks 2011). Floodplain studies provide water surface profiles and floodplain maps for land-use planning for flood prone areas. Floodplain studies often include the analysis of historic floods, (Moramacro et. al. 2005) which are used in model calibration to make sure the model can reproduce historic water surface elevations recorded during actual flood events (Daniel et. al. 2008). Floodplain studies also generally feature the computation of the water surface profile for at least the one-percent annual chance (100-year average return interval) flood. The 100-year flood elevations from the profile are then transferred to a topographic map, illustrating the portions of the floodplain that will be inundated by the 100-year flood (Lin et. al. 2000, Correia et. al. 1999) HEC-RAS is a hydraulic model package developed by US Army Corps of Engineers - Hydrologic Engineering Centre (HEC) (USACE, 2001). In 1964, the HEC-2 computer model was introduced in order to help Hydraulic engineers in the field of river channels and floodplains. The model has been rapidly developed as hydraulic analysis program and was used in the analysis of bridges and ports. Although the HEC-2 model is designed to use in central processor of large computers, but it can also be used in personal computers. In 1990, due to increased use of the Windows operating system, HEC-2 software was upgraded to be used in this operating system and was named as HEC River Analysis System (RAS). This graphical software was developed in Visual Basics and benefits computational algorithms of FORTRAN. HEC-RAS software, in addition to calculating one-dimensional profile of water surface in stable rivers, it is also used for
European Scientific Journal November 2016 edition vol.12, No.32 ISSN: 1857 – 7881 (Print) e - ISSN 1857- 7431
342
simulating unstable flows in rivers, calculating delivered sediment load and water quality analysis. The Steady-component Module calculates water surface profiles from steady input discharge data at an upstream cross-section, from river geometry as well as surface roughness data for the river section under examination. The main output variables of this analysis are the water surface elevation above a base altitude for the defined river cross-sections as well as the flow velocity. It is possible to gradually alter the discharge at every defined cross-section (quasi unsteady flow) (Ellen 1998). The analysis module is capable of handling not only single reaches, but whole river networks. Furthermore it is also possible to model mixed and supercritical conditions aside from subcritical conditions (Jones et. al. 1998, Limerinos 1970, Chow 1959) Study Area The river Jhelum, which actually originates from a spring at Verinag. The Jhelum River system is unique and does not exhibit the characteristics of other Himalayan rivers. It has well established meandering form and is sluggish in its course (Fig.1). Its course has not changed during the past several decades. At Khanabal it becomes navigable and to be so in its course upto Baramulla. From Khanabal to Srinagar the river flows in a single channel between earthen banks constructed by local farmers since ancient times and raised by government from time to time. A flood spill channel had been constructed at Padshahi Bagh, a little above Srinagar, to divert a part of flood discharge towards the low lying areas situated along the eastern bank of river Jhelum. The length of the river from Khanabal to Padshahi Bagh is about seventy six kilometers. The level of bank is higher than the land on the left side of river Jhelum due to which there has been the emergence of swamps being surrounding by cultivated area. Along series of depressions lakes and Jheels are extended along the course of river and are mostly on its left bank. These are connected to the river at some places by outfall channels. During the floods, the spills from the river enter the depressions and relieve the pressure to the main river(Bhat and Alam 2014)

European Scientific Journal November 2016 edition vol.12, No.32 ISSN: 1857 – 7881 (Print) e - ISSN 1857- 7431
343
Fig. 1 Study area with Drainage Network and Water Divides.
Problem Statement The safe carrying capacity of the Jhelum from Sangam to Wular Lake ranges from 40,000 to 50, 000 cusecs and through the Srinagar city only about 35,000 cusecs. Compared to this, the flood discharge at Sangam rose to as much as 90,000 cusecs in 1957 and over 100,000 in 1959.

European Scientific Journal November 2016 edition vol.12, No.32 ISSN: 1857 – 7881 (Print) e - ISSN 1857- 7431
344
The in adequate discharge carrying capacity of the Jhelum results in different type of flood problem in various reaches of the Valley. To understand them clearly it is inevitable to divide Jhelum into the following three reaches: Sangam to Srinagar, through Srinagar and Below Srinagar (Koul 1978) In the first reach, the safe carrying capacity of Jhelum is about 50,000 cusec. When higher discharges are experienced, the bunds breach at number of places, mostly on the left side and submerge the low-lying areas in the vicinity. This however, safeguards the Srinagar city by reducing the peak discharge below the breach level of about 50,000 cusecs just upstream of it. At Padshahi Bagh, a flood spill channel with a designed carrying capacity of 17,000 cusecs takes away the actual volume of 35,000 cusec from the main river (Master plan for Flood control in the Kashmir valley). Since the discharge capacity of river through Srinagar is only 35,000 cusecs, a higher discharge would endanger the security of the city. Srinagar city is situated along both the embankments of the river which adds to the difficulty of keeping the city safe from the inundation. The simplest solution would appear to be to raise and strengthen the river embankments, but there is no scope for such a measure as many important buildings and habitations have sprung-up right along the embankments. Any scheme of raising and widening the embankments would involve demolition of number of these structures and so solution of the problem lies in restricting the flood discharge of the river to the safe carrying capacity through the city (Koul 1993) The reach of the river between Srinagar and Wular Lake can safely carry a discharge of 30,000 to 40,000 cusecs. The problem of this is interlinked with that of the reach below Wular Lake, commonly known as the Outfall Channel. The outfall channel is the only outlet of the drainage of whole valley. But it has at present silted up heavily and therefore cannot carry more than about 20,000 cusecs even during major floods. The flood waters therefore have to accumulate in the Wular Lake, which acts as an absorption basin. Due to the rise in the water level in the Wular Lake, water heads up in the reach above, almost upto Srinagar and subjects the embankments in the reach to greater pressure. This area known as the Sonawari area has been constituted into a community development block and therefore its submergence results in tremendous loss. Methodology The Hydrologic Engineering Centre’s River Analysis System (HEC-RAS, version 4.1.0 ), a one-dimensional, hydraulic-flow model developed by the U.S. Army Corps of Engineers (USACE), is to be used for the study. The HEC-RAS program was designed specifically for application in flood-

European Scientific Journal November 2016 edition vol.12, No.32 ISSN: 1857 – 7881 (Print) e - ISSN 1857- 7431
345
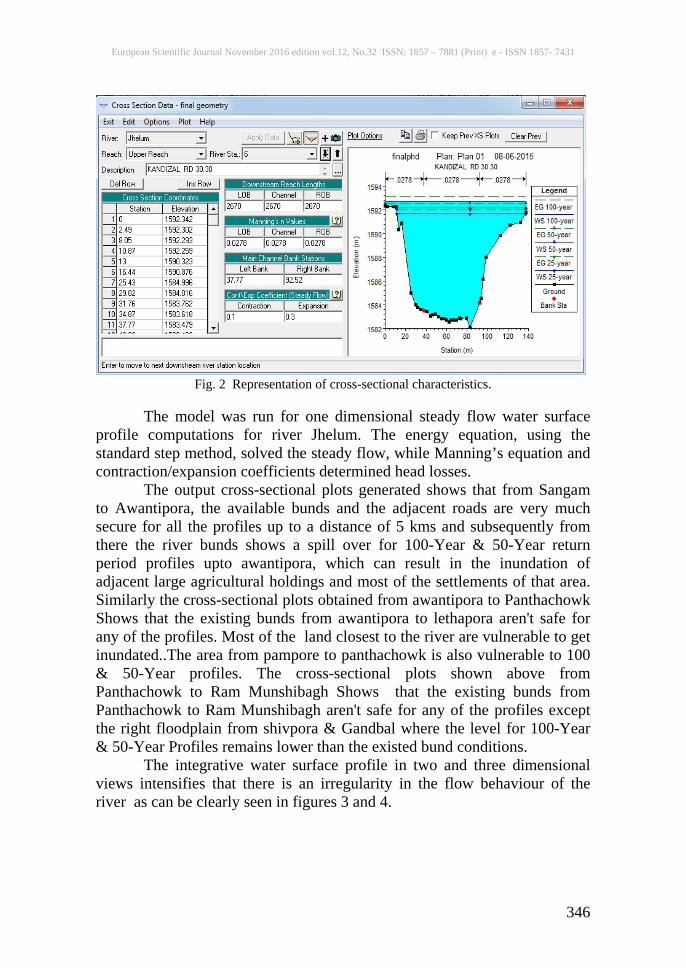
plain management and flood-insurance studies to evaluate floodway encroachment and to simulate estimated flood inundation (U.S. Army Corps of Engineers, 2006). HEC-RAS uses a number of input parameters for hydraulic analysis of the stream channel geometry and water flow. These parameters are used to establish a series of cross-sections along the stream. In each cross-section, the locations of the stream banks are identified and used to divide into segments of left floodway, main channel, and right floodway. At each cross-section, HEC-RAS uses several input parameters to describe shape, elevation, and relative location along the stream such as: • River station (cross-section) number. • Lateral and elevation coordinates for each (dry, unflooded) terrain point. • Left and right bank station locations. • Reach lengths between the left floodway, stream centreline, and right floodway of adjacent cross-sections. • Manning’s roughness coefficients. • Channel contraction and expansion coefficients. • Geometric description of any hydraulic structures, such as bridges, culverts, and weirs. HEC-RAS assumes that the energy head is constant across the cross-section and the velocity vector is perpendicular to the cross-section. After defining the stream geometry, flow values for each reach within the river system. The channel geometric description and flow rate values are the primary model inputs for the hydraulic computations (Eric T. 1998, Islam and Sado 2000). The basic computational procedure is based on the iterative solution of the energy equation. Given the flow and water surface elevation at one cross-section, the goal of the standard step method is to compute the water surface elevation at the adjacent cross-section (Hicks and Peacock 2005, Jhonson et. al. 1999). Results and Discussions The hydrological modelling for the present river in study was performed using the USACE Hydrologic Engineering Centre’s River Analysis System (HEC-RAS) version 4.1.0 for performing one dimensional steady flow analysis. By giving the parameters at their respective cross-sectional locations without leaving any class unattended (Fig. 2) the model then became ready to run to simulate the desired results.
European Scientific Journal November 2016 edition vol.12, No.32 ISSN: 1857 – 7881 (Print) e - ISSN 1857- 7431
346
Fig. 2 Representation of cross-sectional characteristics.
The model was run for one dimensional steady flow water surface profile computations for river Jhelum. The energy equation, using the standard step method, solved the steady flow, while Manning’s equation and contraction/expansion coefficients determined head losses. The output cross-sectional plots generated shows that from Sangam to Awantipora, the available bunds and the adjacent roads are very much secure for all the profiles up to a distance of 5 kms and subsequently from there the river bunds shows a spill over for 100-Year & 50-Year return period profiles upto awantipora, which can result in the inundation of adjacent large agricultural holdings and most of the settlements of that area. Similarly the cross-sectional plots obtained from awantipora to Panthachowk Shows that the existing bunds from awantipora to lethapora aren't safe for any of the profiles. Most of the land closest to the river are vulnerable to get inundated..The area from pampore to panthachowk is also vulnerable to 100 & 50-Year profiles. The cross-sectional plots shown above from Panthachowk to Ram Munshibagh Shows that the existing bunds from Panthachowk to Ram Munshibagh aren't safe for any of the profiles except the right floodplain from shivpora & Gandbal where the level for 100-Year & 50-Year Profiles remains lower than the existed bund conditions. The integrative water surface profile in two and three dimensional views intensifies that there is an irregularity in the flow behaviour of the river as can be clearly seen in figures 3 and 4.

European Scientific Journal November 2016 edition vol.12, No.32 ISSN: 1857 – 7881 (Print) e - ISSN 1857- 7431
347
Fig. 3 Integrative Profile Plot of Upper River Jhelum.
Fig. 4 3D Profile Plot of Upper River Jhelum
From sangam to pampore the average velocity of the river has been 1.1 to 2.2 m/s . In contrary to that 4.5 to 5.5 m/s velocity has been shown within the extents of the Srinagar, which clearly depicts that the flow through Srinagar moves with a very high velocity with respect to its upper reach,
0 10000 20000 30000 40000 50000 600001570
1575
1580
1585
1590
1595
1600
Main Channel Dis tance (m)
Ele
vatio
n (
m)
Legend
WS 100-yr
WS 50-yr
WS 25-yr
Ground
60
62
64
66
68
70
71
73
74
75
77
78
80
81
83
85
86
88
89
90
92
93
94
95
96
97
98
99
100
101
102
103
104
105
106
107
108
109
110
111
112
113
114
115
116
117
118
119
120
Jhelum San-sgr

European Scientific Journal November 2016 edition vol.12, No.32 ISSN: 1857 – 7881 (Print) e - ISSN 1857- 7431
348
which can be attributed to the reason of maximum overflowing of the river within lower reach, causing inundations of vast areas adjacent to the river through Srinagar ( Fig. 5).
Fig. 5 Velocity Profile Plot For River Jhelum Conclusion The foremost spotlight of this study was on assessing the appropriateness of HEC-RAS model in simulating water surface profiles of river Jhelum, which is the main river responsible for flooding the entire valley of Kashmir. The resultant outputs obtained from the use of one dimensional steady flow analysis using the HEC RAS model suggests that, to a greater extent the area under study was found to get inundated for 100-year & 50-year floods. The area lying on the left bank of the river was found to be more vulnerable to get inundated than the right bank. From the scenario of the water surface elevations from various return periods ( 50,100) with their respective cross profile, it can be clearly inferred that the maximum portion of the available buds of the river gets overflowed, which shows the necessity of construction of engineering structures such as dykes and levees along the river channel. Despite the fact that unsteady flow hydraulic models is known for being difficult to apply, it is not astonishing that water system managers and planners are questioning about the worth of their operational use. However, many studies carried so far, already have familiarity with HEC-RAS models that can be effectively utilized to improve and simplify the forecasts of areas likely to be inundated under a given flood.
0 10000 20000 30000 40000 50000 600001
2
3
4
5
6
7
Main Channel Dis tance (m)
Ve
l Ch
nl (
m/s
)
Legend
Vel Chnl 100-yr
Vel Chnl 50-yr
Vel Chnl 25-yr
Jhelum San-sgr
European Scientific Journal November 2016 edition vol.12, No.32 ISSN: 1857 – 7881 (Print) e - ISSN 1857- 7431
349
References: 1. Ahmad Shahiri Parsa ;, Netani Qalo Vuatalevu, (2013). "Introduction
to floodplain zoning simulation models through dimensional approach" International Journal of Advancements Civil Structural and Environmental Engineering – IJACSE
2. Arcement, G.J. and Schneider, V.R. (1989), Guide for Selecting Manning's Roughness Coefficients for Natural Channels and Flood Plains, United States Geological Survey Water supply Paper (WSP 2339).
3. Bhat, M. S., Alam A., 2014. Tracking the reasons: strong monsoon currents triggering multiple cloud bursts caused the catastrophe. http://www.greaterkashmir.com/news/gk-magazine/tracking-the-reasons/179066.html
4. Catchments & Creeks Pty Ltd (2011)," Background to rock roughness equation" Version 1 July-2011.
5. Chow, V.T., (1959) "Open-channel hydraulics": New York, McGraw- Hill Book Co., 680 p.
6. Correia EN. Saraiva MG Silva FN and Ramos, I (1999). Floodplain Management in Urban Development Area. Part II. GIS-Based Flood Analysis and Urban Growth Modeling. Water Resources Management, (13): 23-37.
7. Daniel E. Christiansen and David A. Eash (2008) "Flood-Plain Study of the Upper Iowa River in the Vicinity of Decorah, Iowa" USGS Report.
8. Dyhouse Gary R.(2003) "Floodplain Modeling using HEC-RAS" Haested Methods First Edition.
9. Ellen E.Wohl (1998), " Uncertainty in flood estimates associated with roughness coefficient " Journal of Hydraulic Engineering vol.124 no.2 .
10. Eric Tate, Doctoral thesis (1999)" Floodplain Mapping Using HEC-RAS and Arc View GIS" CRWR Online Report 99-1.
11. F.E. Hicks and T. Peacock, (2005) " Suitability of HEC-RAS for Flood Forecasting" Canadian Water Resources Journal Vol. 30(2): 159–174. Greener Journal of Science, Engineering and Technology Research ISSN: 2276-7835 Vol. 3 (3), pp. 076-081, February 2013. www.slanruojg.gro 81
12. Islam MD and Sado K (2000). Development of Flood Hazard Maps of Bangladesh Using NOAA-AVHRR Images with GIS. Hydrological Sciences Journal, 45(3).
13. Johnson GD Strickland MD and Byyok L (1999). Quantifying Impacts to Riparian Wetlands Associated with Reduced Flows along the GreybullRiver, Wyoming, Wetlands, 19(1): 71-77.

European Scientific Journal November 2016 edition vol.12, No.32 ISSN: 1857 – 7881 (Print) e - ISSN 1857- 7431
350
14. Jones, J.L., T.L. Haluska, A.K. Williamson, and M.L. Erwin. (1998) "Updating Flood Maps Efficiently: Building on Existing Hydraulic Information and
15. Koul, A. (1978). Geography of Jammu And Kashmir State. Light and Life Publishers. University of Michigan.
16. Koul, P.A., 1993. Geography of Jammu and Kashmir state ,Thacker spink, Calcutta , India.
17. Limerinos, J.T., (1970),"Determination of the Manning coefficient from measured bed roughness in natural channels" U.S. Geological Survey Water-Supply Paper 1898-B, 47 p.
18. Lin JY, Yu SL and Lee TC (2000). Managing Taiwan’s Reservoir Watersheds By the Zoning Approach. Journal of American water Resources Association 36(5): 989-1001.
19. Modern Elevation Data with a GIS". USGS Open-File Report. K.C.Patra(2002) "Hydrology and Water Resources Engineering".
20. Moramarco L, F.Melone and SingV P (2005).Assessment of flooding in urbanized ungauged basins:acasestudyintheUpperTiberarea,Italy. DOI:10.1002/hyp.5634. 1909-1924.
21. Parviz Kardavani ,Mohammad Hossein Qalehe,(2013)" Efficiency of Hydraulic Models for Flood Zoning Using GIS (Case Study: Ay-Doghmush River Basin)" Life Science Journal 2013;10(2).
22. S. Kyle McKay and J. Craig Fischenich,(2011), "Robust prediction of hydraulic roughness" ERDC/CHL CHETN-VII-11.
23. Tate EC, Olivera F and Maidment D (1990). Floodplain Mapping Using HEC-RAS and ArcView GIS. Center For Research In Water Resources(CRWR), Report No. 99-1.
24. US Army Corps of Engineers,(2010) “HEC-RAS, Hydraulic Refrence Manual,” Hydrologic Engineering Center, Version 4.1.
25. US Army Corps of Engineers,(2010) “HEC-RAS, User Manual,” Hydrologic Engineering Center, Version 4.1.
26. Yongping Yuan, Kamal Qaiser , (2011) Study report " Floodplain Modeling in the Kansas River Basin Using Hydrologic Engineering Center (HEC) Models"EPA
27. Zeinyvand H (2001). Flood hazard zonation Silakhor river hydraulic model HEC-RAS. Masters Thesis. Department of Natural Resources, Mazandaran university.