OncOlOgy PrOgram - Loyola Medicine Oncology Program Annual Report • 3 Millions of Americans are...
42
ONCOLOGY PROGRAM 2014 ANNUAL REPORT
Transcript of OncOlOgy PrOgram - Loyola Medicine Oncology Program Annual Report • 3 Millions of Americans are...

OncOlOgy PrOgram 2014 annual rePOrt

The Cardinal Bernardin Cancer Center is located on the east side of the campus and faces First Avenue. Parking is available in a parking lot in front of the building and valet parking is available at the entrance. A coffee bar is located just inside the building on the first floor. Named in honor of the late Archbishop of Chicago Joseph Cardinal Bernardin, the cancer center was the first free-standing facility in Illinois dedicated to cancer research, diagnosis, treatment and prevention. Loyola’s cancer center contains all outpatient cancer care along with extensive research laboratories, offices and educational space. Many of the multidisciplinary clinics within the cancer center provide a one-visit, one-team approach, providing patients with a diagnosis and treatment plan in the same day. Patients can see their physician, have lab work done, undergo chemotherapy and have cancer care-related prescriptions filled, among many other services in the building.
Mission Statement
Trinity Health Mission StatementWe serve in Trinity Health, in the spirit of the Gospel, to heal body, mind and spirit to improve the health of our communities, and to steward the resources entrusted to us.
Loyola University Health System is committed to excellence in patient care and the education of health professionals. We believe that our Catholic heritage and Jesuit traditions of ethical behavior, academic distinction and scientific research lead to new knowledge and advance our healing mission in the communities we serve. We believe that thoughtful stewardship, learning and constant reflection on experience improve all we do as we strive to provide the highest-quality health care.
We believe in God’s presence in all our work. Through our care, concern, respect and cooperation, we demonstrate this belief to our patients and families, our students and each other. To fulfill our mission, we foster an environment that encourages innovations, embraces diversity, respects life and values human dignity. We are committed to going beyond the treatment of disease. We also treat the human spirit.
Brand promiseThe people of Loyola promise patients that we go beyond the illness to treat the whole person.

2014 Oncology Program Annual Report • 1
table of contents
IntroductionChairman’s message . . . . . . . . . . . . . . . . . . . . . . . . . . . . 3
Member listOncology committee members and specialties . . . . . . . . . . . . . . . . . . . 5
Oncology servicesServices available . . . . . . . . . . . . . . . . . . . . . . . . . . . . . 6
Primary site tableStatistical breakdown of 2014 cases . . . . . . . . . . . . . . . . . . . . . . . 7
Data analysisNarrative results of 2014 cases . . . . . . . . . . . . . . . . . . . . . . . . 9
Cancer incidenceCancer incidence by sex and site comparison with national and state . . . . . . . . . . 13
Patient care evaluation study of leukemiaLeukemia study . . . . . . . . . . . . . . . . . . . . . . . . . . . . . 14
Patient care evaluation of larynx cancerLarynx study . . . . . . . . . . . . . . . . . . . . . . . . . . . . . . 39
GlossaryDefinitions and references . . . . . . . . . . . . . . . . . . . . . . . . . 53
2 • Loyola University Health System
Message from the Chairman
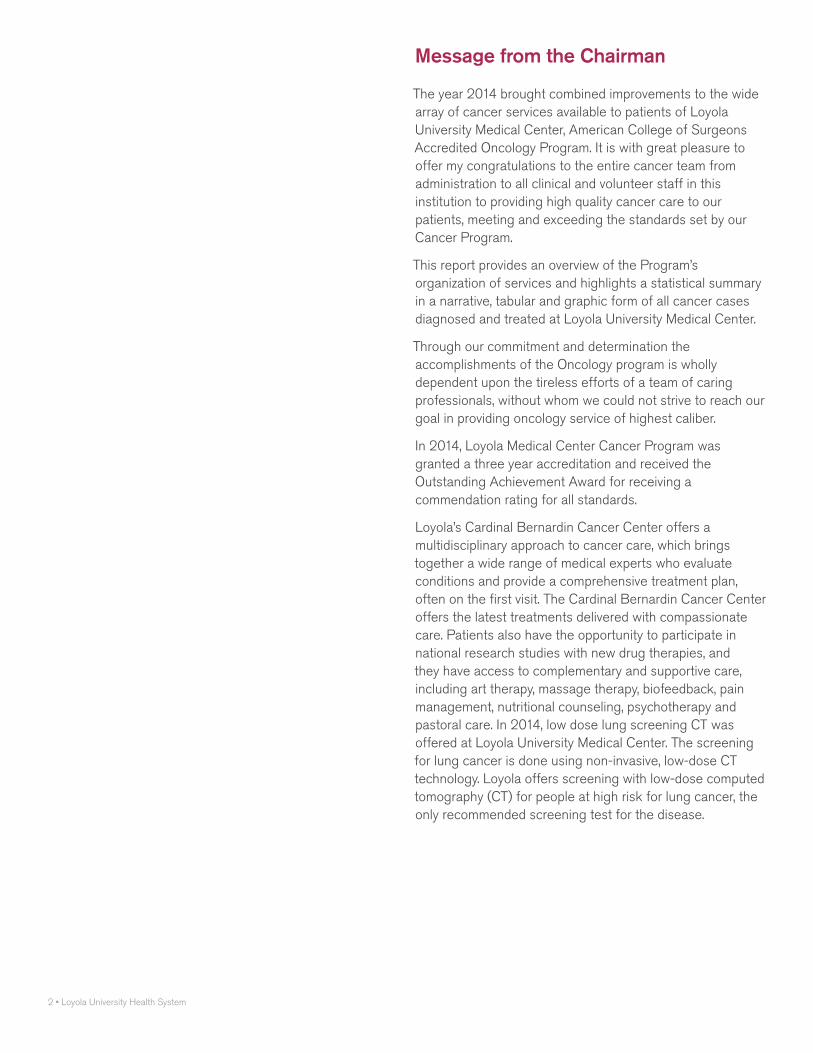
The year 2014 brought combined improvements to the wide array of cancer services available to patients of Loyola University Medical Center, American College of Surgeons Accredited Oncology Program. It is with great pleasure to offer my congratulations to the entire cancer team from administration to all clinical and volunteer staff in this institution to providing high quality cancer care to our patients, meeting and exceeding the standards set by our Cancer Program.
This report provides an overview of the Program’s organization of services and highlights a statistical summary in a narrative, tabular and graphic form of all cancer cases diagnosed and treated at Loyola University Medical Center.
Through our commitment and determination the accomplishments of the Oncology program is wholly dependent upon the tireless efforts of a team of caring professionals, without whom we could not strive to reach our goal in providing oncology service of highest caliber.
In 2014, Loyola Medical Center Cancer Program was granted a three year accreditation and received the Outstanding Achievement Award for receiving a commendation rating for all standards.
Loyola’s Cardinal Bernardin Cancer Center offers a multidisciplinary approach to cancer care, which brings together a wide range of medical experts who evaluate conditions and provide a comprehensive treatment plan, often on the first visit. The Cardinal Bernardin Cancer Center offers the latest treatments delivered with compassionate care. Patients also have the opportunity to participate in national research studies with new drug therapies, and they have access to complementary and supportive care, including art therapy, massage therapy, biofeedback, pain management, nutritional counseling, psychotherapy and pastoral care. In 2014, low dose lung screening CT was offered at Loyola University Medical Center. The screening for lung cancer is done using non-invasive, low-dose CT technology. Loyola offers screening with low-dose computed tomography (CT) for people at high risk for lung cancer, the only recommended screening test for the disease.

2014 Oncology Program Annual Report • 3
Millions of Americans are living with a personal history of cancer, and that number continues to grow each year. Whether these patients are in the midst of cancer treatment or celebrating remission, Loyola Medicine believes every cancer patient deserves compassionate care through diagnosis, treatment and beyond.
Our team offer innovative (HIPEC) heated intraperitoneal chemotherapy treatment of abdominal cancers. According to research studies, when it is used for appropriate candidates as part of a multidisciplinary treatment approach in an experienced setting, outcomes will be favourable compared to standard combination therapy, with the added benefit of shorter-term side effects.
Intrabeam intraoperative radiation therapy, also known as IORT, is another of the many ways Loyola Medicine’s expertly trained doctors use advanced technology for cancer treatment. IORT is a radiation treatment that is administered during surgery to deliver a concentrated dose of radiation therapy directly into the cavity where a tumor has been removed.
As a cancer survivor patient, healthcare needs have been forever altered, and Loyola is committed to providing the specialized care necessary to help each patient bridge the gap between their oncologist and cancer team to their primary care physician. The first of its kind in the Midwest, the Cancer Survivorship Program at the Loyola Cardinal Bernardin Cancer Center is designed to help patients transition from patient to survivor. Loyola’s cancer survivorship program is staffed by a physician director, psychologist and nurses. In addition, our cancer patients have access to the Coleman Foundation Image Renewal Center, which provides all patients with access to the following professionals: Genetic counselors, Nutritionists, Pastoral care and Social workers
At Loyola, our goal is to improve the quality of patients’ lives following cancer treatment, and to empower them, their family and caregivers through education and advocacy.
During National Breast Cancer Awareness Month, breast cancer survivors were invited to the “Bedazzle Your Bra” event that occurred on October 28th 2014.
In 2014, Loyola University Medical Center became the first hospital in Illinois to use a new MRI-ultrasound imaging system that can result in fewer biopsies and better treatment decisions for prostate cancer patients. U.S. News & World Report has ranked Loyola University Medical Center as the No. 3 hospital in Illinois.
Loyola Medicine has also expanded its cancer treatment services to include the most advanced, precise form of radiation treatment available today – proton therapy. Through a unique clinical affiliation with the Northwestern Medicine Chicago Proton Center – the region’s only proton therapy center – Loyola Medicine has been increasing access to the latest technologies and treatments to the people and families we care for.
Loyola University Health System has entered into a clinical affiliation agreement with Porter Regional Hospital in Northwest Indiana. The affiliation has complemented the quality care that patients receive at Porter Regional Hospital by expanding access to academic research and clinical care in Northwest Indiana. The Oncology Service Line also worked closely with Michiana Hematology Oncology of Indiana to establish a monthly clinic at their Mishawaka IN location for patients referred for bone marrow transplant consultation. The opportunity to establish this clinic has presented itself through the relationship Michiana Hematology Oncology has with St. Joseph Regional Medical Center of South Bend IN, a Trinity affiliated organization. Michiana Hematology Oncology is a multi-specialty oncology group practice of sixteen physicians with specialties in Hematology, Oncology, Gynecologic Oncology, and Radiation Oncology. The practice has seven locations to include South Bend, Crown Point, Elkhart, Mishawaka, Plymouth, and Westville, and treats approximately ninety percent of all cancers in their region. The first Transplant clinic in Indiana was conducted February 18 by Patrick Stiff, MD.
4 • Loyola University Health System
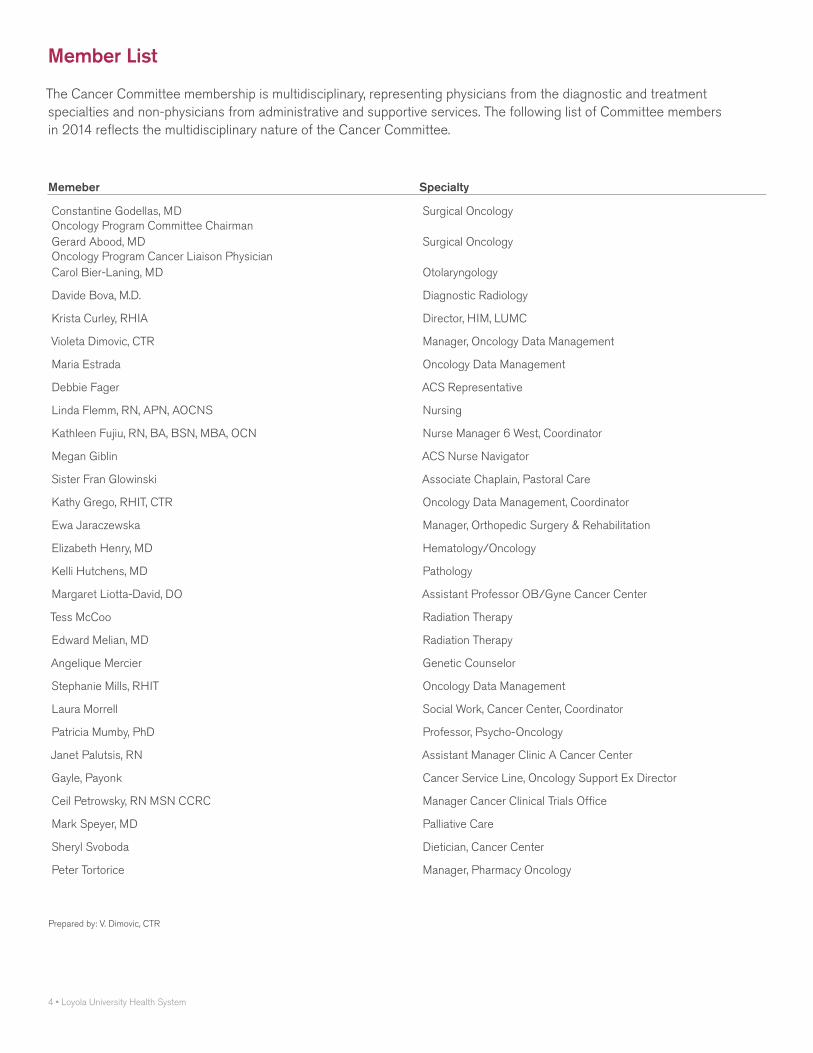
Member List
The Cancer Committee membership is multidisciplinary, representing physicians from the diagnostic and treatment specialties and non-physicians from administrative and supportive services. The following list of Committee members in 2014 reflects the multidisciplinary nature of the Cancer Committee.
Memeber Specialty
Constantine Godellas, MD Oncology Program Committee Chairman
Surgical Oncology
Gerard Abood, MD Oncology Program Cancer Liaison Physician
Surgical Oncology
Carol Bier-Laning, MD Otolaryngology
Davide Bova, M.D. Diagnostic Radiology
Krista Curley, RHIA Director, HIM, LUMC
Violeta Dimovic, CTR Manager, Oncology Data Management
Maria Estrada Oncology Data Management
Debbie Fager ACS Representative
Linda Flemm, RN, APN, AOCNS Nursing
Kathleen Fujiu, RN, BA, BSN, MBA, OCN Nurse Manager 6 West, Coordinator
Megan Giblin ACS Nurse Navigator
Sister Fran Glowinski Associate Chaplain, Pastoral Care
Kathy Grego, RHIT, CTR Oncology Data Management, Coordinator
Ewa Jaraczewska Manager, Orthopedic Surgery & Rehabilitation
Elizabeth Henry, MD Hematology/Oncology
Kelli Hutchens, MD Pathology
Margaret Liotta-David, DO Assistant Professor OB/Gyne Cancer Center
Tess McCoo Radiation Therapy
Edward Melian, MD Radiation Therapy
Angelique Mercier Genetic Counselor
Stephanie Mills, RHIT Oncology Data Management
Laura Morrell Social Work, Cancer Center, Coordinator
Patricia Mumby, PhD Professor, Psycho-Oncology
Janet Palutsis, RN Assistant Manager Clinic A Cancer Center
Gayle, Payonk Cancer Service Line, Oncology Support Ex Director
Ceil Petrowsky, RN MSN CCRC Manager Cancer Clinical Trials Office
Mark Speyer, MD Palliative Care
Sheryl Svoboda Dietician, Cancer Center
Peter Tortorice Manager, Pharmacy Oncology
Prepared by: V. Dimovic, CTR

2014 Oncology Program Annual Report • 5
Medical Services
All patients at the Cardinal Bernardin Cancer Center begin with a visit to one of the center’s specialty or multidisciplinary clinics. There, the patient and family meet with the cancer specialist responsible for establishing an individual treatment plan and coordinating care. Within our unique multidisciplinary setting, a patient will meet with a team of cancer experts that may include surgeons, medical oncologists, radiation oncologists, radiologists, pathologists and plastic surgeons. These specialists work together to evaluate a patient’s condition. During the same visit, patients might also meet with a nutritionist, nurse, social worker or other supportive staff.
Programs and servicesBelow is a list of our programs and services for cancer care: loyolamedicine.org
Adrenal Cancer
Anal Cancer
Bone Cancer
Bone Marrow Transplantation
Breast Cancer
Breast Care
Breast Oncology Center
CAN-HELP Cancer Information Service
Cancer Genetics Evaluation Program
Cancer Risk Assessment and Prevention
Cancer-Pediatric Hematology and Oncology Through our membership in the Children’s Oncology Group, we participate in clinical trials and studies for pediatric conditions such as: (Leukemia, Lymphoma, Brain Tumors, Neuroblastoma, Wilm’s Tumor, Rhabdomyosarcoma & Other Soft Tissue Sarcoma, Bone Malignancies)
Art Therapy
Cancer Survivorship Program
Caregivers Class for Bone Marrow Transplant Patients
Centers for Fitness
Chaplain Services
Chemotherapy Classes
Clinical Research
Coleman Foundation Image Renewal Center
Gastroenterology Services
Gastrointestinal Oncology Center
Gynecologic Oncology Services
Head and Neck Oncology Clinic
Hematology Clinic
Hematology/Oncology Services
Home Care and Hospice
Image Renewal Center
Melanoma Clinic
Networking and Support GroupsNeuro-Oncology Clinic
Nutrition Services
Orthopedic Oncology
Psychology Support Services
Radiation Oncology Services
Sarcoma Oncology
Screening and Early Detection - Cancer
Skin Cancer and Mohs Micrographic Surgery Center
Speech Therapy
Surgical Oncology
Thoracic and Lung Oncology Program and Urologic Oncology Clinic
*click on bolded programs and services to view website page.

6 • Loyola University Health System
Analytic: A cases first diagnosed and / or receiving first course treatment at the facility, or diagnosed at autopsy.
Non-Analytic: Any case diagnosed at another facility and receiving all first course treatment at that facility, then seen at Loyola University Medical Center for subsequent treatment.
Primary Site Table 2014
The following table summarizes the primary sites by gender for 2014. The top five most frequent occurring cancers at Loyola University Medical Center in 2014 were: breast, lung, prostate, thyroid and colorectal.
table: 1
Primary Site Male Female Analytic Non-analytic Total
All Sites 1269 1387 2656 335 2991
Oral cavity 99 56 155 20 175Lip 2 3 5 1 6Tongue 40 14 54 8 62Oropharynx 3 0 3 1 4Hypopharynx 5 5 10 0 10Other 49 34 83 10 93
Digestive System 265 177 442 51 493Esophagus 15 4 19 2 21Stomach 19 16 35 8 43Colon 39 47 86 13 99Rectum 35 25 60 9 69Anus/Anal Canal 7 6 13 1 14Liver 75 30 105 8 113Pancreas 53 35 88 3 91Other 22 14 36 7 43
Respiratory System 131 103 234 20 254Nasal / Sinus 7 5 12 0 12Larynx 33 3 36 8 44Lung/Bronchus 89 93 182 12 194Other 2 2 4 0 4
Blood and bone marrow 90 76 166 42 208Leukemia 45 45 90 18 108Multiple Myeloma 24 18 42 17 59Other 21 13 34 7 41
Bone 2 7 9 0 9
Connective/soft tissue 14 18 22 2 24
Skin 100 54 154 21 175Melanoma 88 49 137 19 156Other 12 5 17 2 19
Breast 3 351 354 19 373
Female Genital 0 206 206 16 222Cervix Uteri 0 24 24 3 27Corpus Uteri 0 118 118 6 124Ovary 0 42 42 6 48Vulva 0 16 16 1 17Other 0 6 6 0 6
Male Genital 229 0 229 26 234Prostate 208 0 208 26 234Testis 8 0 8 3 11Other 13 0 13 1 14
Urinary System 163 78 241 37 278Bladder 67 26 93 20 113Kidney/Renal 90 50 140 17 157Other 6 2 8 0 8
Brain and CNS 37 63 100 24 124Brain (Benign) 2 2 6 0 6Brain (Malignant) 5 10 15 3 18Other 30 51 81 21 102
Endocrine 53 149 202 23 225Thyroid 39 130 169 16 185Other 14 19 33 7 40
Lymphatic System 62 39 101 25 126Hodgkin’s Disease 9 1 10 5 15Non-Hodgkin’s 53 38 91 20 111
Unknown Primary 14 7 21 2 23
Other/Ill-Defined 7 13 20 3 23

2014 Oncology Program Annual Report • 7
graph 1: Incidence per year
Data shows that the number of cases diagnosed and treated at Loyola University Medical Center in 2014.
# of cases
3000
2500
2000
1500
1000
500
0
# o
f ca
ses
2002 2003 2004 2005 2006 2007 2008 2009 2010 2011 2012 2013 2014
Data Analysis
In most of the 2014 cases, a total of 51% (1498), patients received their initial diagnosis at LUMC; 36% (1085) of patients were diagnosed elsewhere, but came in our facility to be treated; 2% (73) of patients were diagnosed at our facility and all their first course of therapy was done elsewhere; and 11% (335) of the patients came here for treatment of recurrent disease. (See Figure 1) Total 2,991
Figure 1: class of case
Class 0
Class 1
Class 2
Class 3
36%
11% 2%
51%
Most of the 2014 cases, 56% (1,471) of the patients were seen from Cook county, followed by 17% (460) from DuPage, 8% (204) from Will, 4% (116) from Kane. Out-of-state cases accounted for 3% (84) and the remaining others accounted for 12% (321).
Figure 2: cases by Diagnosis county
Cook
DuPage
Will
Kane
Out of State
Other
12%
3%
4%
17%
8%
56 %

8 • Loyola University Health System
For all analytical cases, the most frequent site is Breast 33% (354). Next in frequency is the Prostate with 20% (208), Lung 17% (182); Thyroid with 16% (169) and finally Colorectal with 14% (146) (See Graph 2) Total Cases 1059
graph 2: Five major Sites
Male
Female
350
300
250
200
150
100
50
03
93
351
89
0
208
130
39
# o
f C
ases
Breast LungProstate ColorectalThyroid
7274
For new analytic cases 52% (1387 ) were female and 48% (1269) male. Graph 3 below shows that the diagnosis of cancer was most found in the 60-69 year range for males and females.
graph 3: age by Sex
9 4 129
3314
82
32
80
56
416
286
123
332
12
250
103
14
400
350
300
250
200
150
100
50
0
# o
f C
ases
Age of Patients
00-09 10-19 20-29 30-39 40-49 50-59 60-69 70-79 80-89 90-99
288
401
Male
Female
Data Analysis
table 2: age by Sex
Age Range Male Female
0-9 9 4
10-19 9 12
20-29 14 33
30-39 32 82
40-49 80 56
50-59 288 332
60-69 416 401
70-79 286 250
80-89 123 103
90+ 12 14
Total (2,548) 1269 1387
For all analytic combined staged cases: (146) were stage 0; (840) Stage I; (447) Stage II; (350) Stage III; (431) Stage IV, (95) Unknown Stage and (347) accounted for non-applicable cases for staging.
graph 4: aJcc Stage by Sex
Male
Female
0
100
200
300
400
500
600
# o
f C
ases
AJCC Stage
0 I II III IV UNK N/A

2014 Oncology Program Annual Report • 9
Cancer Incidence by Sex and Site with the State and National
table 3: males
Site
LUMC % (N=1,269) Year 2014
Illinois % (N=32,588) Year 2013
National % (N=855,220) Year 2014
Prostate 16.3 25.8 27.2
Kidney 7.1 4.5 4.6
Lung 7.0 14.7 13.6
Skin 6.9 4.1 5.4
Liver 5.9 2.9 2.9
Colorectal 5.8 10.0 8.3
Bladder 5.3 6.6 6.6
Non-Hodgkin’s 4.2 4.2 4.5
Pancreas 4.2 2.7 2.8
Leukemia 3.5 3.0 3.5
table 4: Females
Site
LUMC % (N=1,387) Year 2014
Illinois % (N=32,086) Year 2013
National % (N=810,320) Year 2014
Breast 25.3 29.4 28.7
Thyroid 9.3 4.3 5.9
Corpus Uteri 8.5 6.7 6.5
Lung 6.7 13.3 13.4
Colorectal 5.2 9.4 8.0
Kidney 3.6 2.8 3.1
Skin 3.5 3.2 4.3
Leukemia 3.2 3.0 2.7
Ovary 3.1 2.6 2.7
Non-Hodgkin’s 2.7 3.8 4.0
The American Cancer Society National estimates for site and sex distribution for all races were used to compare the estimates with Loyola University Medical Center data and the State of Illinois Cancer Statistics. The numbers reported are percentages of the total cases by sex. For the male population as compared to both the state and the nation, we observed quite a high incidence of Kidney, Skin (Melanoma), Liver and Pancreas, but a lower level of Prostate, Lung, and Colorectal.
For the female population as compared to the state and nation, we observed quite a high incidence of Thyroid, Corpus Uteri, Skin, Pancreas and Ovary, but a lower level of Breast, Lung, Bladder, and Colorectal.

10 • Loyola University Health System Patient Care Evaluation
Elizabeth Henry, MD Hematology/Oncology Quality Medical Director
Violeta Dimovic, CTR Manager, Oncology Data Cancer Program
PatIent care evaluatIOn StuDy OF leukemIa 2010-2014
Study of Leukemia 2010-2014 2014 Oncology Program Annual Report • 11
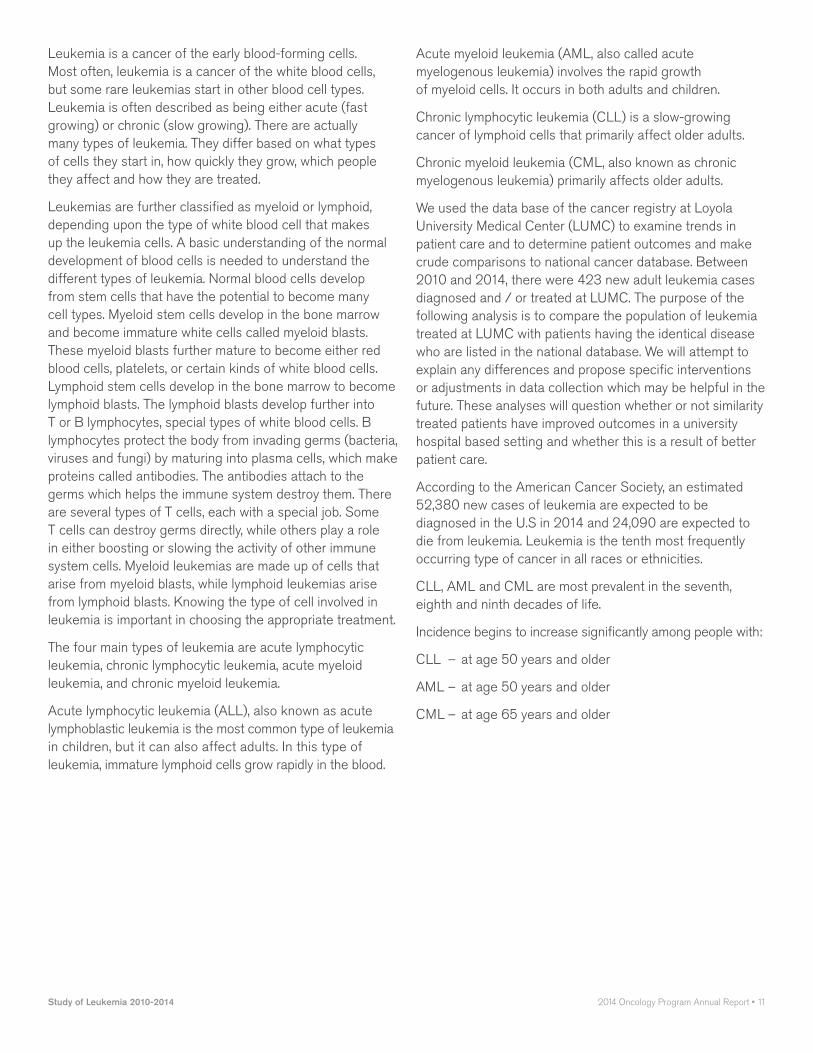
Leukemia is a cancer of the early blood-forming cells. Most often, leukemia is a cancer of the white blood cells, but some rare leukemias start in other blood cell types. Leukemia is often described as being either acute (fast growing) or chronic (slow growing). There are actually many types of leukemia. They differ based on what types of cells they start in, how quickly they grow, which people they affect and how they are treated.
Leukemias are further classified as myeloid or lymphoid, depending upon the type of white blood cell that makes up the leukemia cells. A basic understanding of the normal development of blood cells is needed to understand the different types of leukemia. Normal blood cells develop from stem cells that have the potential to become many cell types. Myeloid stem cells develop in the bone marrow and become immature white cells called myeloid blasts. These myeloid blasts further mature to become either red blood cells, platelets, or certain kinds of white blood cells. Lymphoid stem cells develop in the bone marrow to become lymphoid blasts. The lymphoid blasts develop further into T or B lymphocytes, special types of white blood cells. B lymphocytes protect the body from invading germs (bacteria, viruses and fungi) by maturing into plasma cells, which make proteins called antibodies. The antibodies attach to the germs which helps the immune system destroy them. There are several types of T cells, each with a special job. Some T cells can destroy germs directly, while others play a role in either boosting or slowing the activity of other immune system cells. Myeloid leukemias are made up of cells that arise from myeloid blasts, while lymphoid leukemias arise from lymphoid blasts. Knowing the type of cell involved in leukemia is important in choosing the appropriate treatment.
The four main types of leukemia are acute lymphocytic leukemia, chronic lymphocytic leukemia, acute myeloid leukemia, and chronic myeloid leukemia.
Acute lymphocytic leukemia (ALL), also known as acute lymphoblastic leukemia is the most common type of leukemia in children, but it can also affect adults. In this type of leukemia, immature lymphoid cells grow rapidly in the blood.
Acute myeloid leukemia (AML, also called acute myelogenous leukemia) involves the rapid growth of myeloid cells. It occurs in both adults and children.
Chronic lymphocytic leukemia (CLL) is a slow-growing cancer of lymphoid cells that primarily affect older adults.
Chronic myeloid leukemia (CML, also known as chronic myelogenous leukemia) primarily affects older adults.
We used the data base of the cancer registry at Loyola University Medical Center (LUMC) to examine trends in patient care and to determine patient outcomes and make crude comparisons to national cancer database. Between 2010 and 2014, there were 423 new adult leukemia cases diagnosed and / or treated at LUMC. The purpose of the following analysis is to compare the population of leukemia treated at LUMC with patients having the identical disease who are listed in the national database. We will attempt to explain any differences and propose specific interventions or adjustments in data collection which may be helpful in the future. These analyses will question whether or not similarity treated patients have improved outcomes in a university hospital based setting and whether this is a result of better patient care.
According to the American Cancer Society, an estimated 52,380 new cases of leukemia are expected to be diagnosed in the U.S in 2014 and 24,090 are expected to die from leukemia. Leukemia is the tenth most frequently occurring type of cancer in all races or ethnicities.
CLL, AML and CML are most prevalent in the seventh, eighth and ninth decades of life.
Incidence begins to increase significantly among people with:
CLL – at age 50 years and older
AML – at age 50 years and older
CML – at age 65 years and older
12 • Loyola University Health System Patient Care Evaluation
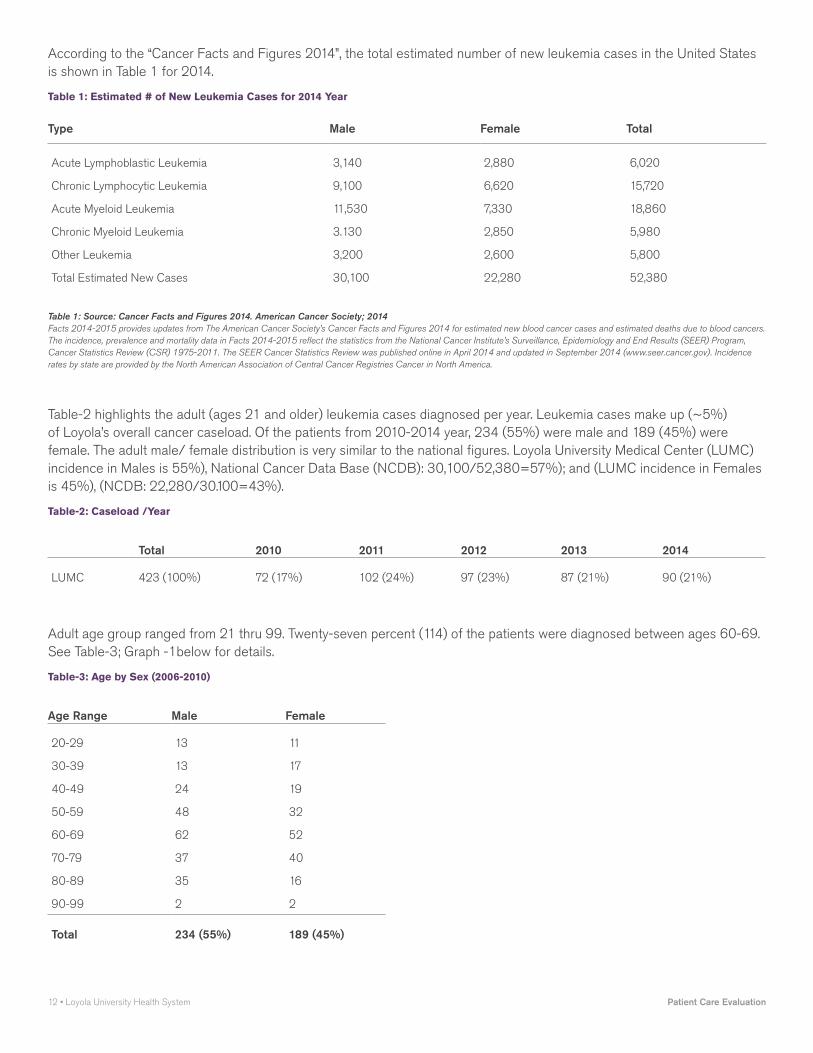
According to the “Cancer Facts and Figures 2014”, the total estimated number of new leukemia cases in the United States is shown in Table 1 for 2014.
table 1: estimated # of new leukemia cases for 2014 year
Type Male Female Total
Acute Lymphoblastic Leukemia 3,140 2,880 6,020
Chronic Lymphocytic Leukemia 9,100 6,620 15,720
Acute Myeloid Leukemia 11,530 7,330 18,860
Chronic Myeloid Leukemia 3.130 2,850 5,980
Other Leukemia 3,200 2,600 5,800
Total Estimated New Cases 30,100 22,280 52,380
Table 1: Source: Cancer Facts and Figures 2014. American Cancer Society; 2014Facts 2014-2015 provides updates from The American Cancer Society’s Cancer Facts and Figures 2014 for estimated new blood cancer cases and estimated deaths due to blood cancers. The incidence, prevalence and mortality data in Facts 2014-2015 reflect the statistics from the National Cancer Institute’s Surveillance, Epidemiology and End Results (SEER) Program, Cancer Statistics Review (CSR) 1975-2011. The SEER Cancer Statistics Review was published online in April 2014 and updated in September 2014 (www.seer.cancer.gov). Incidence rates by state are provided by the North American Association of Central Cancer Registries Cancer in North America.
Table-2 highlights the adult (ages 21 and older) leukemia cases diagnosed per year. Leukemia cases make up (~5%) of Loyola’s overall cancer caseload. Of the patients from 2010-2014 year, 234 (55%) were male and 189 (45%) were female. The adult male/ female distribution is very similar to the national figures. Loyola University Medical Center (LUMC) incidence in Males is 55%), National Cancer Data Base (NCDB): 30,100/52,380=57%); and (LUMC incidence in Females is 45%), (NCDB: 22,280/30.100=43%).
table-2: caseload /year
Total 2010 2011 2012 2013 2014
LUMC 423 (100%) 72 (17%) 102 (24%) 97 (23%) 87 (21%) 90 (21%)
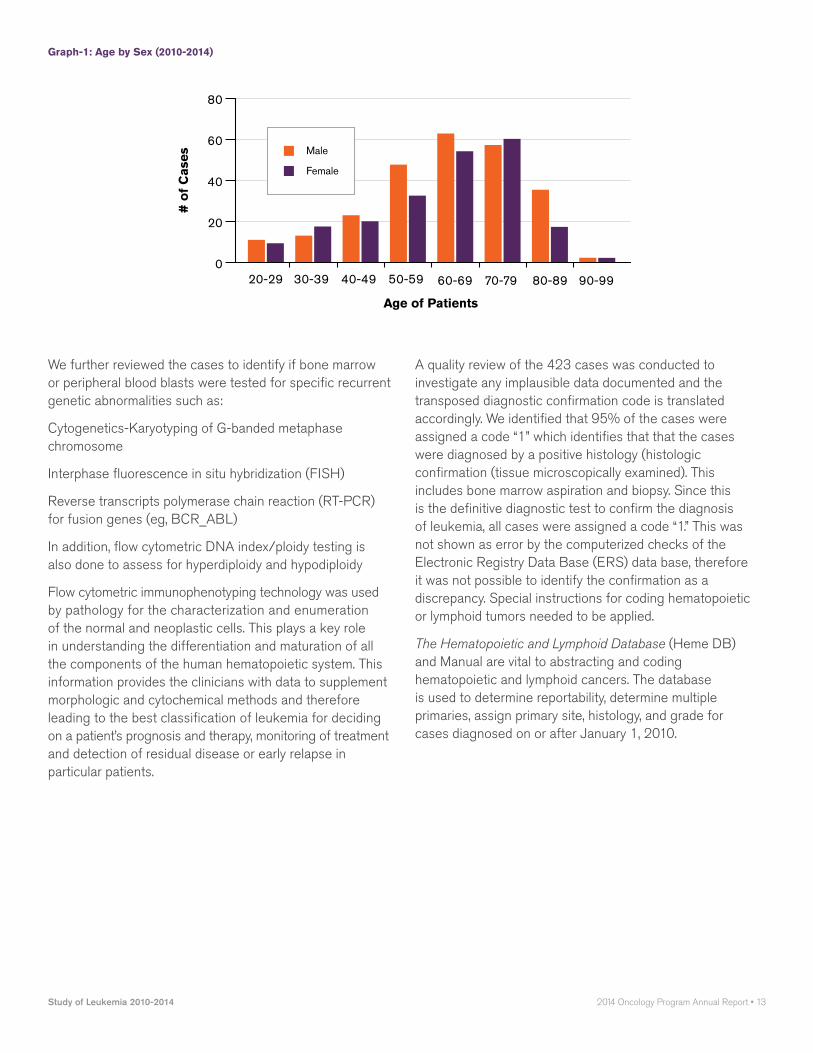
Adult age group ranged from 21 thru 99. Twenty-seven percent (114) of the patients were diagnosed between ages 60-69. See Table-3; Graph -1below for details.
table-3: age by Sex (2006-2010)
Age Range Male Female
20-29 13 11
30-39 13 17
40-49 24 19
50-59 48 32
60-69 62 52
70-79 37 40
80-89 35 16
90-99 2 2
Total 234 (55%) 189 (45%)
Study of Leukemia 2010-2014 2014 Oncology Program Annual Report • 13
graph-1: age by Sex (2010-2014)
80
60
40
20
0
# o
f C
ases
Age of Patients
20-29 30-39 40-49 50-59 60-69 70-79 80-89 90-99
Male
Female
We further reviewed the cases to identify if bone marrow or peripheral blood blasts were tested for specific recurrent genetic abnormalities such as:
Cytogenetics-Karyotyping of G-banded metaphase chromosome
Interphase fluorescence in situ hybridization (FISH)
Reverse transcripts polymerase chain reaction (RT-PCR) for fusion genes (eg, BCR_ABL)
In addition, flow cytometric DNA index/ploidy testing is also done to assess for hyperdiploidy and hypodiploidy
Flow cytometric immunophenotyping technology was used by pathology for the characterization and enumeration of the normal and neoplastic cells. This plays a key role in understanding the differentiation and maturation of all the components of the human hematopoietic system. This information provides the clinicians with data to supplement morphologic and cytochemical methods and therefore leading to the best classification of leukemia for deciding on a patient’s prognosis and therapy, monitoring of treatment and detection of residual disease or early relapse in particular patients.
A quality review of the 423 cases was conducted to investigate any implausible data documented and the transposed diagnostic confirmation code is translated accordingly. We identified that 95% of the cases were assigned a code “1” which identifies that that the cases were diagnosed by a positive histology (histologic confirmation (tissue microscopically examined). This includes bone marrow aspiration and biopsy. Since this is the definitive diagnostic test to confirm the diagnosis of leukemia, all cases were assigned a code “1.” This was not shown as error by the computerized checks of the Electronic Registry Data Base (ERS) data base, therefore it was not possible to identify the confirmation as a discrepancy. Special instructions for coding hematopoietic or lymphoid tumors needed to be applied.
The Hematopoietic and Lymphoid Database (Heme DB) and Manual are vital to abstracting and coding hematopoietic and lymphoid cancers. The database is used to determine reportability, determine multiple primaries, assign primary site, histology, and grade for cases diagnosed on or after January 1, 2010.

14 • Loyola University Health System Patient Care Evaluation
Diagnostic Confirmation Codes to be applied for Cancer Cases:microscopically confirmed
1: Positive histology
• Tissue specimen
• Bone marrow specimen
• CBC, WBC, peripheral blood smear for leukemia only
2: Positive cytology
3: Positive histology PLUS
• Positive immunophenotyping and/or
• Positive genetic studies
4: Positive microscopic confirmation, method not specific
not microscopically confirmed5: Positive laboratory test/marker study
6: Direct visualization without microscopic confirmation
7: Radiology and other imaging techniques without microscopic confirmation
8: Clinical diagnosis only (other than 5, 6, or 7)
9: Unknown whether or not microscopically
The database is extremely informational. Each disease type has information on morphology codes used in what time periods, reportability, primary site, grade, module rule, alternative names, definitions, abstractor notes, definitive diagnostic methods, genetics data, immunophenotyping, treatments, transformations to and from, same primaries, corresponding ICD-9 and ICD-10 codes, signs and symptoms, diagnostic exams, recurrence and metastasis, and epidemiology and mortality.
According to North American Association of Central Cancer Registries Cancer in North America, the correct code to have been used was a “3”, if diagnosed after January 1, 2010. It states: “Assign code 3 when there is histology positive for cancer and positive immunophenotyping and/or positive genetic testing results”. Since there is a continuous increase in the molecular and biological understanding of leukemia, the disease classification, diagnostic and therapeutic standards are likely subject to periodic revisions. In order to spread excellence of uniform quality it is necessary to adopt up-to-date common standards as defined by the governing entities.
Further analysis on the 423 cases was conducted to assess data quality for purposes of adding the appropriate text in the pathology field and correcting the diagnostic confirmation. All cases, after changes reflect concordance for diagnostic confirmation as a “3” showing a 99% of the cases were immunophenotyped. The test provides valuable insight into whether the tumor cells contain a normal or abnormal amount of DNA and the relative rate at which the tumor is growing and therefore must be reported according to standard guidelines. The data provided by cancer registries are vital for public health surveillance, health service planning, evaluation of the impact of intervention on cancer incidence and survival, clinical auditing and epidemiological research, health promotion and genetic counseling. To fulfill these functions adequately, data produced must be of high quality.
Flow cytometry techniques are utilized in clinical hematology. Diagnostic evaluation of patients with leukemia, either at first diagnosis or at relapse, all include immunophenotyping in conjunction with morphology and histochemistry, cytogenetic analysis and molecular studies. These measurements allow for the differential analysis of normal and abnormal cells within a peripheral blood or bone-marrow specimen leading to the identification of particular leukemia subtypes.
According to the College of American Pathologists, a partial list of the “2008 World Health Organization (WHO) classification, neoplasms that are seen in the bone marrow specimens are those that include Acute Myeloid Leukemia (AML) with recurrent genetic abnormalities, therapy related AML, AML, not otherwise specified, acute leukemias of ambiguous lineage, precursor lymphoid neoplasms, mature B-cell and mature T and NK-cell neoplasms. Documentation of expression of antigens such as CD20, CD33 and CD52 can aid the clinicians of potential therapeutic options. In Chronic Lymphocytic Leukemia, important biomarkers include protein expression of CD38 and zeta-associated protein of ZAP-70, normally expressed in T-cells and NK cells, immunoglobulin heavy chains (IGVH) hypermutation status, somatic mutations in tumor protein gene TP53, receptor protein signaling NOTCH1, and abnormalities in chromosomes 11, 12, 13q, and 17. Clear, concise and accurate reporting of results is extremely important for effective clinical management.
Cases at LUMC were histologically classified as distinct subtypes of leukemia. The different histologies represented among the cases showed a favorable prognostic type of Acute Myeloid Leukemia which accounted for about 38% (160) of all the cases. See Table 4 below for details.

Study of Leukemia 2010-2014 2014 Oncology Program Annual Report • 15
table 4: Distribution by Histology and gender
Cross-Tabulation Of Histology By Sex For Leukemia
HistologyMale (NBR)
Female (NBR)
Total (NBR)
Percent (%)
Mixed phenotype acute leukemia B/myeloid NOS 1 1 2 0.5
Mixed phenotype acute leukemia T/myeloid NOS 1 0 1 0.2
B lymphoblastic leukemia/lymphoma NOS 13 13 26 6.1
B lymphoblastic leukemia/lymphoma with t(922) (q34q11.2) BCR-ABL1 0 1 1 0.2
Chronic lymphocytic leukemia 48 18 66 15.6
Burkitt’s cell leukemia 4 4 8 1.9
Adult T-cell leukemia/lymphoma 1 1 2 0.5
Chronic lymphoproliferative disorder of NK-cells 1 0 1 0.2
Precursor cell lymphoblastic leukemia NOS (see also M-9727/3) 3 5 8 1.9
Precursor B-cell lymphoblastic leukemia (see also M-9728/3) 2 1 3 0.7
T lymphoblastic leukemia/lymphoma 2 1 3 0.7
Erythroleukemia 1 1 2 0.5
Myeloid leukemia NOS 3 2 5 1.2
Acute myeloid leukemia 93 68 160 38.0
Chronic myeloid leukemia 10 10 20 4.7
Acute promyelocytic leukemia 7 11 18 4.3
Acute myelomonocytic leukemia 4 4 8 1.9
Acute myelomonocytic leukemia with eosinophils 2 0 2 0.5
Acute myeloid leukemia without maturation 3 3 6 1.4
Acute myeloid leukemia with maturation 0 5 5 1.2
Chronic myelogenous leukemia BCR/ABL positive 7 10 17 4
Acute monocytic leukemia 2 6 8 1.9
Acute myeloid leukemia with multilineage dysplasia (see also M-9984) 5 5 10 2.4
Acute myeloid leukemia t(8) 3 1 4 0.9
Acute megakaryoblastic leukemia (C42.1) 0 1 1 0.2
Acute myeloid leukemia (megakaryoblastic) with t(122)(p13q13) RBM15-MKL1 0 2 2 0.5
Therapy-related acute myeloid leukemia and myelodysplastic syndrome NOS 2 4 6 1.4
Myeloid sarcoma 0 1 1 0.2
Hairy cell leukemia (C42.1) 3 2 5 1.2
Chronic myelomonocytic leukemia NOS 13 8 21 5
Overall Totals 234 189 423 100%

16 • Loyola University Health System Patient Care Evaluation
Leukemia stages vary based on disease type. Factors affecting leukemia staging and prognosis are:
• White blood cell or platelet count
• Age (advanced age may negatively affect prognosis)
• History of prior blood disorders
• Chromosome mutations or abnormalities
• Bone damage
• Enlarged liver or spleen
Acute Myelogenous Leukemia (AML) subtypes and stagingUsing a system known as French-American-British (FAB) classification, AML is classified in eight subtypes, M0 through M7, based on:
• The number of healthy blood cells
• The size and number of leukemia cells
• The changes that appear in the chromosomes of the leukemia cells
• Any other genetic abnormalities that have occurred
The eight acute myelogenous leukemia stages are classified as follows:
Undifferentiated AML — M0: In this stage of acute myelogenous leukemia, the bone marrow cells show no significant signs of differentiation.
Myeloblastic leukemia — M1: Bone marrow cells show some signs of granulocytic differentiation with or without minimal cell maturation.
Myeloblastic leukemia — M2: Maturation of the bone marrow cells is beyond the promyelocyte (early granulocyte) stage. Varying amounts of granulocyte maturation may be observed.
Promyelocytic leukemia — M3: Most of the abnormal cells are early granulocytes, between myeloblasts and myelocytes in their stage of development. The cells contain many small particles and have nucleuses of varying size and shape.
Myelomonocytic leukemia — M4: In this stage of acute myelogenous leukemia, the bone marrow and circulating blood have variable amounts of monocytes and differentiated granulocytes in them. The percentage of monocytes and promonocytes in the bone marrow is greater than 20 percent. There may also be an increased number of granular leukocytes called eosinophils, a type of granulocyte that often has a two-lobed nucleus.
Monocytic leukemia — M5: This subset is further divided into two different categories. The first is characterized by poorly differentiated monoblasts with lacy-appearing genetic material. The second subset is characterized by a large number of monoblasts, promonocytes and monocytes. The proportion of monocytes in the bloodstream may be higher than that in the bone marrow.
Erythroleukemia — M6: This form of leukemia is characterized by abnormal red blood cell-forming cells, which make up over half of the nucleated cells in the bone marrow.
Megakaryoblastic leukemia — M7: The blast cells in this form of leukemia look like immature megakaryocytes (giant cells of the bone marrow) or lymphoblasts (lymphocyte-forming cells). M7 leukemia may be distinguished by extensive fibrous tissue deposits (fibrosis) in the bone marrow. Although the FAB classification is still commonly used to group AML into subtypes, the World Health Organization (WHO) has proposed a new acute myelogenous leukemia staging system in an attempt to more clearly communicate the patient’s prognosis (outlook). This system divides Acute myelogenous leukemia (AML) into broad groups:
• Acute myelogenous leukemia with certain genetic abnormalities: Cellular testing is capable of identifying specific genetic abnormalities:
• AML with a translocation between chromosomes 8 and 21
• AML with a translocation or inversion in chromosome 16
• AML with changes in chromosome 11
• APL (M3), which usually has translocation between chromosomes 15 and 17
• AML with multi-lineage dysplasia: More than one type of abnormal myeloid cell is involved.

Study of Leukemia 2010-2014 2014 Oncology Program Annual Report • 17
• AML from previous chemotherapy/radiation
• AML not otherwise specified: This includes AML cases that don’t fall into any of the above groups, such as:
• Undifferentiated AML - M0
• AML with Minimal Maturation - M1
• AML with Maturation - M2
• Acute Myelomonocytic Leukemia - M4
• Acute Monocytic Leukemia - M5
• Acute Erythroid Leukemia - M6
• Acute Megakaryoblastic Leukemia - M7
• Acute Basophilic Leukemia
• Acute Panmyelosis with Fibrosi
• Myeloid Sarcoma - Also called Granulocytic Sarcoma or Chloroma
• Undifferentiated/biphenotypic acute leukemias: This type of leukemia may exhibit features of both lymphocytic and myelogenous leukemia. This may also be refferd to as ALL with myeloid markers, AML with lymphoid or mixed lineage leukemia.
Acute Lymphocytic leukemia (ALL) classification based on immunophenotypeImmunophenotyping is a way to classify ALL. It factors in the type of lymphocyte (T cell or B cell), as well as how mature the cells are.
B-cell all stagingB lymphocytes, or B cells, are produced in the bone marrow. They also mature there. B cells play a large role in humoral immune response and serve the principal functions of making antibodies against antigens and developing into memory B cells after they have been activated by antigen interaction.
t-cell all staging T lymphocytes, or T cells, leave the bone marrow before maturation and move to the thymus, where they mature. T cells play a central role in cell-mediated immunity. There are several different subsets of T cells that have distinct functions. The different subsets of T cells include Helper, Cytotoxic, Memory, Regulatory, Natural killer and Gamma Delta T cells.
Rai staging system for Chronic Lymphocytic Leukemia (CLL) stagesChronic lymphocytic leukemia stages in the Rai system are defined by three main factors: the number of the lymphocytes in the blood; whether or not the lymph nodes, spleen or liver are enlarged; and the presence of the blood disorders anemia (too few red blood cells) or thrombocytopenia (too few platelets). The five stages are labeled with Roman numerals 0-IV:
• Rai Stage 0 CLL: The levels of the lymphocytes are too high, usually more than 10,000 in one sample. There are no other symptoms at this point and other blood cell counts are normal.
• Rai Stage I CLL: In addition to the high levels of lymphocytes (lymphocytosis), the lymph nodes are swollen. The levels of red blood cells and platelets are still normal.
• Rai Stage II CLL: The number of lymphocytes remains high and now the liver or spleen might be larger than normal.
• Rai Stage III CLL: The excess amount of lymphocytes begins to crowd out the red blood cells, resulting in anemia. The lymph nodes may be swollen and the liver or spleen may be larger than normal.
• Rai Stage IV CLL: The levels of red blood cells and platelets drop below normal, causing anemia and thrombocytopenia. The lymph nodes may be swollen and the liver or spleen may be larger than normal.
The Rai system of chronic lymphocytic leukemia staging is sometimes simplified into low (Stage 0), medium (Stage I and II) and high (stage III and IV) risk categories.
There are three stages of CML.• Chronic: This is the earliest phase of CML. The
majority of CML patients are diagnosed during this phase as a result of mild symptoms particularly fatigue.
• Accelerated: If CML has not responded to treatment well or was not detected during the chronic phase, it sometimes becomes more aggressive, which can lead to the accelerated phase. At this point, symptoms may become more noticeable.
• Blastic: This is the most aggressive stage of chronic myeloid leukemia. Blastic refers to having more than 20 percent myeloblasts or lymphoblasts. Symptoms are similar to those of acute myeloid leukemia.

18 • Loyola University Health System Patient Care Evaluation
Monitoring the patient to see how they respond to treatment is very important. Determining the stage of the disease and patient’s response depends heavily on generating clear and meaningful laboratory tests. If CML is responding well to treatment based on the blood counts and or bone marrow, 3 months after starting treatment, the patient should have a complete hematologic response (CHR) and some type of cytogenetic response and reduction of the number of copies of the BCR-ABL genes on the polymerase chain reaction (PCR) test by 90% or more. If treatment is working well, 18 months after starting treatment, the patient should have: complete hematologic response (CHR) and a complete cytogenetic response (CCyR) and/or major molecular response (MMR).
Some of the documented symptoms in the acute myeloid leukemia (AML) cases reviewed were fatigue, weight loss, bleeding, easy bruising, frequent infections and night sweats.
• Low levels of red blood cells, which can cause fatigue and shortness of breath
• Low platelet counts, which can cause bleeding
• Low normal white blood cell counts, which can lead to infection
• Vulnerability to bruising, bleeding and infections
In addition to these signs of bone marrow failure, enlarged lymph nodes, an enlarged liver or spleen, or pain in the bones or joints can occur.
Blood tests like, complete blood count (CBC), peripheral blood smear and cytogenetic analysis to check for changes in the chromosomes of the lymphocytes can detect leukemia, a critical part of the evaluation that helps determine the appropriate course of treatment. Bone marrow aspiration, a type of biopsy to diagnose leukemia, is also used. Other procedures used are CT scans, X-rays, MRI’s and ultrasounds.
Making treatment decisions begins with the stage, or progression of the disease. The stage is one of the most important factors in evaluating treatment options. The treatment of leukemia varies according to one’s age, prognostic factors, general condition at diagnosis, and results of the cytogenetic testing as mentioned previously and the availability of a stem cell donor with matching tissue type. The goal of treatment is a cure. Treatment for leukemia can be divided into four phases:
• First phase — induction chemotherapy (remission) The goal of this first phase is to clear the blood of leukemia cells (blasts) and to reduce the number of blasts (very immature cells) in the bone marrow to normal
• Second phase — consolidation chemotherapy (post-remission). The purpose of the second phase is to kill any residual cells and keep the cancer from coming back (relapsing). The options for consolidation treatment are either more chemotherapy or a stem cell transplant, or combination of these two approaches.
• Third phase — maintenance chemotherapy Maintenance involves giving a low dose of a chemo drug for months or years after consolidation is finished. Often used for one specific type of AML.
• Fourth phase — central nervous system (CNS) prophylaxis This includes intrathecal chemotherapy: infusing chemotherapy directly to the clear spinal fluid to prevent recurrence of leukemia.
Loyola University Medical Center receives referrals for Stem Cell Transplants from throughout the Midwest, including other academic medical centers in Chicago. Loyola is among the first centers to use umbilical cord donations for the treatment of certain adult cancers. Loyola has a particular expertise in treating patients who cannot find matching donors from either their families or the National Marrow Donor Program. Twenty years ago, only about 30 percent of patients could find matching stem cell donors. At Loyola, that percentage has increased to 95 percent, due to the use

Study of Leukemia 2010-2014 2014 Oncology Program Annual Report • 19
of cord blood transplants and other innovative techniques, according to P. Stiff, MD, Director of Hematology/Oncology, Medical Director of Loyola’s Cardinal Bernardin Cancer Center, Vice Chairman of the Bone Marrow and Stem Cell Transplantation Committee. Loyola has treated more blood cancer patients with stem cell transplants than any other center in Illinois and has one of the largest unrelated donor transplant programs in the world.
Bone marrow transplantation (BMT) and peripheral blood stem cell transplantation (PBSCT) are procedures that restore stem cells that have been destroyed by high doses of chemotherapy and/or radiation therapy. The types of transplants are:
• Autologous transplants, patients receive their own stem cells
• Syngeneic transplants, patients receive stem cells from their identical twin
• Allogeneic transplants, patients receive stem cells from their brother, sister or parent. A person unrelated to the patients (an unrelated donor, this includes umbilical cord blood) also may be used.
Matched donor — To help minimize the problems that can be caused by the expected immune response, a donor who has similar genetic makeup to the patient is preferred. The cells will seem “less foreign” to the transplanted donor cells. Siblings (ie, brothers and sisters who share the same parents as the patient) are typically the only members of the family that are tested for being a donor because they have a one in four chance of sharing genetic characteristics with patient; these characteristics are critical for the body to accept the graft. In general, parents, children, and other relatives are not suitable donors since they do not share the same parents, and therefore do not have the same genetic material.
Matched unrelated donor — If no siblings are available, or if testing the blood of the siblings does not reveal a match, a matched unrelated donor may be used. The search for an appropriate donor can be accomplished using transplant registries throughout the world
Mismatched related donor or umbilical cord blood donor — Some patients are offered treatment with cells from a partially matched family member (called mismatched related donor). The hematopoietic stem cell product may be specially prepared to minimize the immune response in the patient. Another alternative is to use umbilical cord blood, collected from a healthy newborn infant at the time of delivery; this blood is a rich source of hematopoietic stem cells.
For patients who receive marrow or peripheral blood stem cells (PBSC), neutrophil engraftment can occur as early as 10 days after transplant but is more common around 14-20 days. Patients who receive cord blood may need more time to engraft (typically about 25 days but sometimes as long as 42 days.
Treatment of leukemia may include chemotherapy, radiation therapy, stem cell transplant and/ or immunotherapy. Based on the findings during the retrospective analysis, the stem source was not always documented in the progress notes. Recommendations have been integrated through educational projects and directives in aiming at identifying the retrieval of the documentation on which the oncology registry staff relies. A joint effort between the health care provider and the oncology data staff is essential to achieve complete and accurate documentation and to report the diagnosis and procedures. Improving clinical documentation and increasing communication across departments is an important way to establish standards, exchange knowledge and avoiding overall errors.
Among the 423 patients in this analysis, 20% (82) were treated with stem cell transplant. Treatment options and recommendations depended on several factors, including the type and stage of leukemia, possible side effects, patient’s preferences, age and overall health.

20 • Loyola University Health System Patient Care Evaluation
Treatment combination for leukemia cases is indicated in Table 5 below.
table 5: treatment combination for leukemia cases (year 2010-2014)
Treatment Type# of Cases
Chemotherapy 192
None 62
Chemotherapy/Hormone 62
Chemotherapy/Radiation/Transplant 24
Chemotherapy/Transplant 20
Chemotherapy/Radiation/Hormonal/Transplant 18
Chemotherapy/Hormone/Transplant 20
Hormone 5
Chemotherapy/Radiation 4
Chemotherapy/Other 3
Immunotherapy 3
Other 3
Chemotherapy/Hormone/Other 3
Chemotherapy/Immunotherapy 3
Chemotherapy/Hormone/Immunotherapy 1
Total Cases 423
Note: Other/Differentiation inducing agents
Transplanted stem cells can come from the patient (autologous, an identical twin (syngenic), or different individual (allogenic). The three sources of stem cells are donor bone marrow, donor blood, and cord blood taken from the umbilical cord and placenta after childbirth
Peripheral blood stem cells (PBSCs) are collected by apheresis, a process in which the donor is connected to a special cell separation machine via a needle inserted in arm veins. Blood is taken from one vein and is circulated though the machine which removes the stem cells and returns the remaining blood and plasma back to the donor through another needle inserted into the opposite arm. Several sessions may be required to collect enough stem cells to ensure a chance of successful engraftment in the recipient.
A medication may be given to the donor for about one week prior to apheresis that will stimulate the bone marrow to increase production of new stem cells. These new stem cells will be released from the marrow and into the circulating or peripheral blood system; from there they can be collected during apheresis.
Bone marrow harvesting involves collecting stem cells with a needle placed into the soft center of the bone, the marrow. Most sites used for bone marrow harvesting are located in the hip bones and the sternum. The procedure takes place in the operating room.
Study of Leukemia 2010-2014 2014 Oncology Program Annual Report • 21
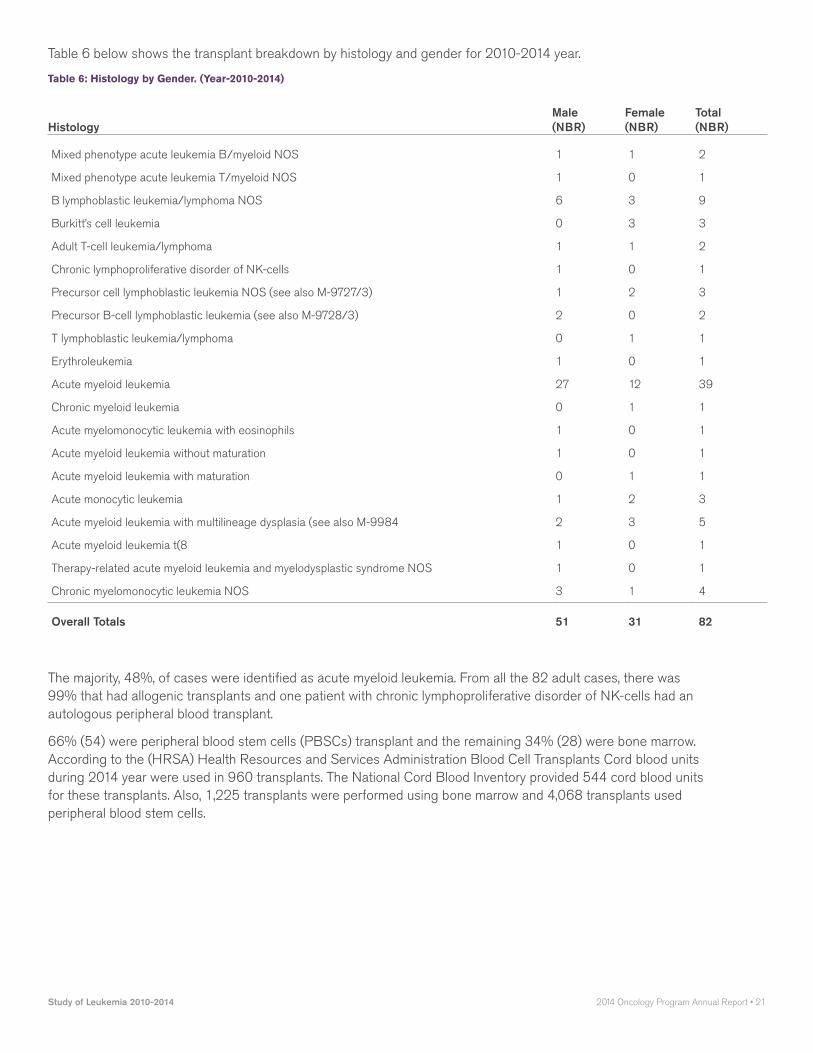
Table 6 below shows the transplant breakdown by histology and gender for 2010-2014 year.
table 6: Histology by gender. (year-2010-2014)
HistologyMale (NBR)
Female (NBR)
Total (NBR)
Mixed phenotype acute leukemia B/myeloid NOS 1 1 2
Mixed phenotype acute leukemia T/myeloid NOS 1 0 1
B lymphoblastic leukemia/lymphoma NOS 6 3 9
Burkitt’s cell leukemia 0 3 3
Adult T-cell leukemia/lymphoma 1 1 2
Chronic lymphoproliferative disorder of NK-cells 1 0 1
Precursor cell lymphoblastic leukemia NOS (see also M-9727/3) 1 2 3
Precursor B-cell lymphoblastic leukemia (see also M-9728/3) 2 0 2
T lymphoblastic leukemia/lymphoma 0 1 1
Erythroleukemia 1 0 1
Acute myeloid leukemia 27 12 39
Chronic myeloid leukemia 0 1 1
Acute myelomonocytic leukemia with eosinophils 1 0 1
Acute myeloid leukemia without maturation 1 0 1
Acute myeloid leukemia with maturation 0 1 1
Acute monocytic leukemia 1 2 3
Acute myeloid leukemia with multilineage dysplasia (see also M-9984 2 3 5
Acute myeloid leukemia t(8 1 0 1
Therapy-related acute myeloid leukemia and myelodysplastic syndrome NOS 1 0 1
Chronic myelomonocytic leukemia NOS 3 1 4
Overall Totals 51 31 82
The majority, 48%, of cases were identified as acute myeloid leukemia. From all the 82 adult cases, there was 99% that had allogenic transplants and one patient with chronic lymphoproliferative disorder of NK-cells had an autologous peripheral blood transplant.
66% (54) were peripheral blood stem cells (PBSCs) transplant and the remaining 34% (28) were bone marrow. According to the (HRSA) Health Resources and Services Administration Blood Cell Transplants Cord blood units during 2014 year were used in 960 transplants. The National Cord Blood Inventory provided 544 cord blood units for these transplants. Also, 1,225 transplants were performed using bone marrow and 4,068 transplants used peripheral blood stem cells.

22 • Loyola University Health System Patient Care Evaluation
graph 1: HrSa Health resources and Services administration Blood cell transplants
6,5006,0005,5005,0004,5004,0003,5003,0002,5002,0001,5001,000
5000
’91 ’92 ’93 ’94 ’95 ’96 ’97 ’98 ’99 ’00 ’01 ’02 ’03 ’04 ’05 ’06 ’07 ’08 ’09 ’10 ’11 ’12 ’13’90
Source: National Marrow Donor Program/By The Match FY 2013
Cord Blood
Peripheral Blood Stem Cells
Bone Marrow
According to the Center for International Blood and Marrow Transplant Research (CIBMTR) transplant activity from 2012 year by donor type and cell source showed:
table 7: # of transplants by Donor type and cell Source (cIBmtr) year-2012
Year-2012 Autologous Related Unrelated Total
Bone Marrow 28 740 938 1,706
Cord Blood 106 28 797 931
Peripheral Blood 10,412 2,429 2,811 15,652
Total 10,546 3,197 4,546 18,289

Study of Leukemia 2010-2014 2014 Oncology Program Annual Report • 23
table 8: # of transplants by Disease category & Donor type (cIBmtr) year 2012
Year 2012 Autologous Related Unrelated Total
Acute Lymphoblastic Leukemia 5 469 592 1,066
Acute Myelogenous Leukemia 64 1,036 1,648 2,748
Chronic Lymphocytic Leukemia/Other Leukemia 3 117 185 305
Chrmonic Myeloid Leukemia 0 110 147 257
Other Acute leukemia 1 32 59 92
Allogenic hematopoietic cell transplants are curative but are associated with life-threatening complications. The chief risk factor for death included older age and graft-versus-host disease (GVHD) and relapses, defined as disease recurrences.
graph 2: causes of Death after unrelated Donor transplants (2011-2012)
Primary Disease
GVHD
Infection
Organ Failure
Second Malignancy
Other
CIBMTR CENTER FOR INTERNATIONAL BLOOD & MARROW TRANSPLANT RESEARCH
12%
4%
17%
8%
37%
20%
According to the annual report on data submitted to the CIBMTR by centers worldwide, the primary cause of death after autologous transplant is primary disease. Among allogeneic transplant recipients, unrelated donor transplants have fewer deaths related to the primary disease, however organ failure and infections are higher after unrelated donor transplants

24 • Loyola University Health System Patient Care Evaluation
graph 3: Survival after Hla match Sibling Donor (2002-2012)
100
80
60
40
20
0
Early (n=7,607)
Intermediate (n=2,124)
Advanced (n=2,578)
Years0 1 2 3 4 5 6
By Disease Status
p<0.0001
Prob
abilit
y (%
)
CIBMTR CENTER FOR INTERNATIONAL BLOOD & MARROW TRANSPLANT RESEARCH
graph 4: Survival after unrelated transplants for aml, 2002-2012
100
80
60
40
20
0
Early (n=7,365)
Intermediate (n=4,172)
Advanced (n=4,095)
Years0 1 2 3 4 5 6
By Disease Status
p<0.0001
Prob
abilit
y (%
)
CIBMTR CENTER FOR INTERNATIONAL BLOOD & MARROW TRANSPLANT RESEARCH

Study of Leukemia 2010-2014 2014 Oncology Program Annual Report • 25
The CIBMTR has data for 27,941 patients receiving a human leukocyte antigen, HLA-matched sibling (n=12,309) or unrelated donor (n=15,632) transplant for AML between 2002 and 2012. Their disease status at the time of transplant and the donor type are the major predictors of post-transplant survival. The 3-year probabilities of survival after HLA-matched sibling transplant in this cohort was 58% ± 1%, 50% ± 1%, and 24% ± 1% for patients with early, intermediate, and advanced disease, respectively. The probabilities of survival after an unrelated donor transplant were 49% ± 1%, 47%± 1%, and 22% ± 1% for patients with early, intermediate, and advanced disease, respectively.
table 9: aml-adult unrelated Hct Improved Survival Over time
Transplants facilitated by NMDP/Be The Match
Year of HCT Number of Cases One-Year Survival Two-Year Survival
2011-2013 3,809 60% 49%
2007-2010 3,574 57% 45%
2002-2006 2,285 48% 38%
1987-2001 1,606 31% 24%
In this analysis, relative survival rates with 95% confidence intervals are calculated as measures of survival. This method is used to estimate cancer survival in the absence of other causes of death. This relative survival provides a measure of excess mortality experienced by cancer patients without requiring cause of death information and the formulation is based on the assumption of independent competing cause of death. Because survival statistics are based on large groups of people, they cannot be used to predict exactly what will happen to an individual patient. No two patients are entirely alike, and treatment and responses to treatment can vary greatly.
The 5-year survival rate depends on the subtype of leukemia. We conducted survival analysis on all cases that had stem cell transplants from year 2005 through 2009. The different histologies represented among the cases showed a favorable prognostic type of Acute Myeloid Leukemia. For this reason a survival analysis on adults was conducted, with an age of >21, Acute Myeloid Leukemia.
26 • Loyola University Health System Patient Care Evaluation
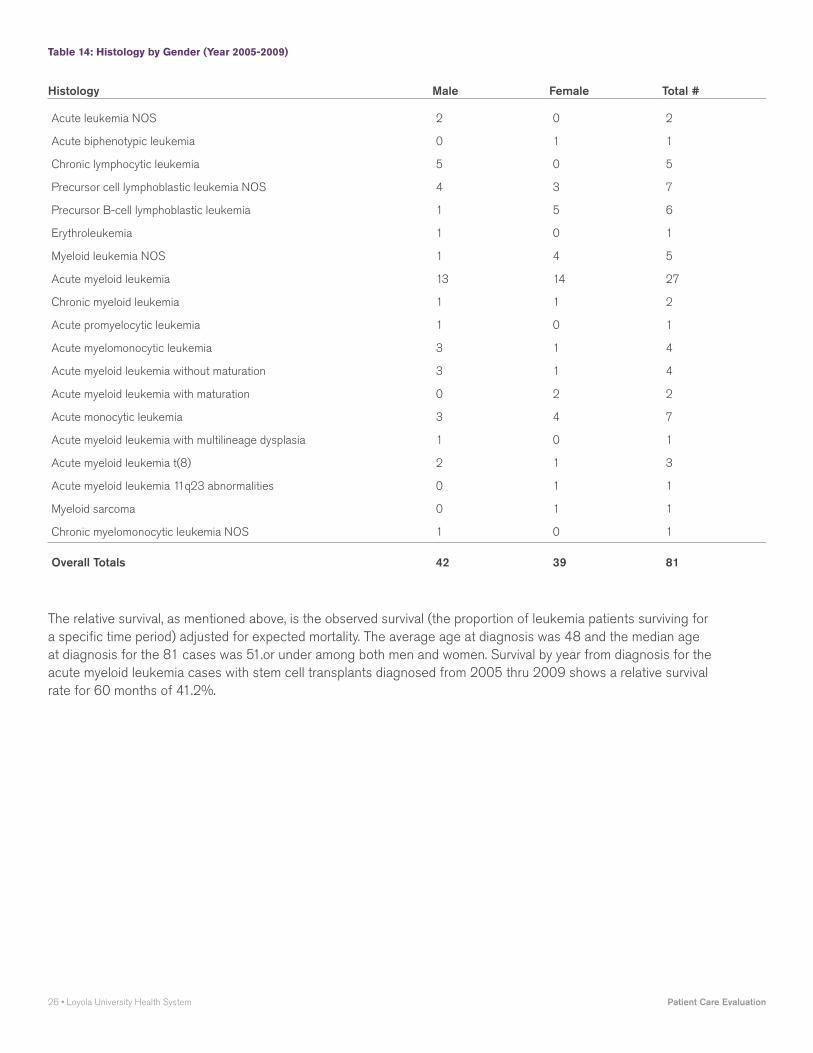
table 14: Histology by gender (year 2005-2009)
Histology Male Female Total #
Acute leukemia NOS 2 0 2
Acute biphenotypic leukemia 0 1 1
Chronic lymphocytic leukemia 5 0 5
Precursor cell lymphoblastic leukemia NOS 4 3 7
Precursor B-cell lymphoblastic leukemia 1 5 6
Erythroleukemia 1 0 1
Myeloid leukemia NOS 1 4 5
Acute myeloid leukemia 13 14 27
Chronic myeloid leukemia 1 1 2
Acute promyelocytic leukemia 1 0 1
Acute myelomonocytic leukemia 3 1 4
Acute myeloid leukemia without maturation 3 1 4
Acute myeloid leukemia with maturation 0 2 2
Acute monocytic leukemia 3 4 7
Acute myeloid leukemia with multilineage dysplasia 1 0 1
Acute myeloid leukemia t(8) 2 1 3
Acute myeloid leukemia 11q23 abnormalities 0 1 1
Myeloid sarcoma 0 1 1
Chronic myelomonocytic leukemia NOS 1 0 1
Overall Totals 42 39 81
The relative survival, as mentioned above, is the observed survival (the proportion of leukemia patients surviving for a specific time period) adjusted for expected mortality. The average age at diagnosis was 48 and the median age at diagnosis for the 81 cases was 51.or under among both men and women. Survival by year from diagnosis for the acute myeloid leukemia cases with stem cell transplants diagnosed from 2005 thru 2009 shows a relative survival rate for 60 months of 41.2%.

Study of Leukemia 2010-2014 2014 Oncology Program Annual Report • 27
table 15: Survival by year for cases diagnosed from 2005-2009 year (# of cases-81)
YearRelative Survival (%)
Year 1 81.8
Year 2 57.0
Year 3 45.8
Year 4 43.5
Year 5 41.2
Observed survival for all leukemia cases diagnosed in 2003-2007 showed a 5 year survival of 42.0%.for LUMC
table 16: lumc Observed Survival for all leukemias (2003-2007 Data)
Stage Cases 0-Yr 1-Yr 2-Yr 3-Yr 4-yr 5-Yr
N/A 355 100 71.1 55.2 48.7 45.4 42.0
National reporting for observed survival showed a 5 year survival of 41.1%.
table 17: national Observed for all leukemia (2003-2007 Data)
Stage Cases 0-Yr 1-Yr 2-Yr 3-Yr 4-yr 5-Yr
N/A 83,284 100 64.8 53.8 48.1 44.1 41.1
table 18: lumc Observed (2003-2007 Data) for acute myeloid leukemia
Stage Cases 0-Yr 1-Yr 2-Yr 3-Yr 4-yr 5-Yr
N/A 173 100 59.4 39.9 31.4 28.4 27.1
table 19: national Observed (2003-2007 Data) for acute myeloid leukemia
Stage Cases 0-Yr 1-Yr 2-Yr 3-Yr 4-yr 5-Yr
N/A 31,151 100 44.1 30.4 25.6 23.1 21.6

28 • Loyola University Health System Patient Care Evaluation
Improvements in survival in AML over the past decades have come primarily from improvements in post-remission therapy, supportive care, and stem cell transplants. Findings of the survival reflect extraordinary dedication by physicians and staff to improve the outcomes of the patients by continually refining transplantation to be a safer and more effective treatment.
Follow-up care for survivors includes surveillance for recurrence or development of a new cancer, assessing psychosocial needs, counseling regarding preventive health, and testing for specific risk factors and late effects. Patients at our facility are provided with a plan that includes information about cancer screening, surveillance for recurrence, the schedule on which tests and examinations should be performed, long-term effects of treatment and their symptoms. Our physicians, nurses, researchers and psychologists are experts and work collaboratively with the patient’s primary care physician from time of diagnosis onward to ensure all health concerns is being met and create a plan for living well beyond cancer.
In conclusion, AML is markedly heterogeneous disease with variable response to therapy and survival. There have been dramatic breakthroughs in the identifications of reproducible prognostic variable in this disease, in particular, the advances in molecular biology as well as genomics technology have revolutionized the approach to leukemia and have added substantially the understanding of biology and prognosis through identification of novel prognostic markers.
Improved supportive care techniques, including less toxic conditioning regimens, better treatment of and prophylaxis against graft-versus-host disease, and better treatment of infections in neutropenic patients have all led to improved survival for transplant recipients. In the future, further improvements in survival may be observed as personalized novel and effective therapeutics with tolerable side effects profiles are developed.
Data source: Surveillance, Epidemiology, and End Results (SEER) Program (www.seer.cancer.gov) SEER*Stat Database: Incidence - SEER 18 Regs Research Data + Hurricane Katrina Impacted Louisiana Cases, Nov 2013 Sub (1973-2011 varying) - Linked To County Attributes - Total U.S., 1969-2012 Counties, National Cancer Institute, DCCPS, Surveillance Research Program, Surveillance Systems Branch, released April 2014 (updated 5/7/2014), based on the November 2013 submission, American Cancer Society, American College of Surgeons; facs.org, North American Association of Central Cancer Registries National Institutes of Health, Center for International Blood and Marrow Transplant (CIBMTR); http://bloodcell.transplant.hrsa.gov/about/contractors/cibmtr/index.html

2014 Oncology Program Annual Report • 29Study of Larynx Cancer 2010-2014
Carol Bier-Laning, MD, FACS Otolaryngology Associate Professor
Violeta Dimovic, CTR Manager, Oncology Data Cancer Program
PatIent care evaluatIOn StuDy OF larynx cancer 2010-2014

30 • Loyola University Health System Patient Care Evaluation
IntroductionLaryngeal cancer is a type of cancer that affects the larynx, an organ that plays an important role in breathing and communicating. It contains the vocal cords, which give one the sound needed to speak. The larynx is composed of three different parts:
• glottis - the part of the larynx that contains the vocal cords
• supraglottis - the area above the glottis
• subglottis - area below the glottis
The American Cancer Society’s most recent estimates for laryngeal cancer in the United States for 2014 are:
• About 12,630 newly diagnosed cases of laryngeal cancer
• About 3,610 deaths from laryngeal cancer
About 60% of laryngeal cancers start in the glottis (the area containing the vocal cords themselves), while about 35% develop in the supraglottic area (above the vocal cords). The rest develop in either the subglottis (below the vocal cords) or overlap more than one area so that it is hard to tell where they started.
The initial presenting symptoms of cancer of the larynx depend upon the site involved. Supraglottic cancers tend to present late with symptoms of dysphagia, odynophagia, hemoptysis, or referred otalgia. Stridor and hoarseness are late findings. Palpable cervical lymphadenopathy is a common presenting sign. Glottic cancers often present early with hoarseness, and palpable lymphadenopathy is uncommon. Late symptoms include dysphagia, odynophagia,
stridor, or cough. Subglottic cancer presents with dyspnea, stridor, or palpable cervical lymphadenopathy.
The most important adverse prognostic factors for laryngeal cancers include increasing T stage and N stage. Other prognostic factors may include sex, age, performance status, and a variety of pathologic features of the tumor, including grade and depth of invasion.
The objectives of this study are to determine the demographic breakdown of Loyola University Medical Center (LUMC) laryngeal cancer patients, to characterize the type of surgical procedures done, to assess the use of radiation therapy and chemotherapy in the management of this disease and compare the five-year survival rate with national averages.
MethodsA retrospective study was conducted of patients primarily treated for carcinoma of the larynx between 2010 and 2014 at Loyola University Medical Center. A total of 138 cases that satisfied the inclusion criteria were analyzed. Among these, most (85/138 62%) had their cancers diagnosed and received all or part of their treatment at Loyola University Medical Center (LUMC), thirty five percent (48/138 35%) received all or part of their treatment at LUMC, but had their cancers diagnosed elsewhere, and three percent (5/138, 3%) had their cancer diagnosed and treated elsewhere. Laryngeal cancer cases make up approximately 2% of Loyola’s overall cancer caseload.
ResultsDiagnosis and DemographicsTable 1 highlights the larynx cancer diagnoses per year for the five year period from 2010-2014. During this period, the highest incidence of laryngeal cancer occurred in 2013, with 37 of the cases (37/138, 27%) seen during that year. Over this five year period at LUMC, 106 cases (77%) were diagnosed in males and 32 (23%) in females. This male/female distribution is very similar to the national figures. The age of patients ranged from 40 to 89, with the majority presenting between ages 60-69 (56/138, 41%; see Table 2 for details).
table-1: laryngeal cancer cases /year
Total 2010 2011 2012 2013 2014
LUMC 138 (100%) 17 18 30 37 36

2014 Oncology Program Annual Report • 31Study of Larynx Cancer 2010-2014
table 2: # of laryngeal cancer cases by age & gender, 2010-2014
Age Range Male Female
40-49 7 1
50-59 24 12
60-69 46 10
70-79 19 5
80-89 10 4
Total 106 32
(LUMC (106) Male 77%)
(NCDB (42,000) Male 79%)
(LUMC (32) Females23%),
(NCDB (10,875) Females 21%)
Subsite classificationWhen classified by anatomic location, 49 cases (35.5%) were supraglottic carcinomas, 71 cases (51.4%) were glottic, 3 cases (2.2%) were subglottic, 14 additional cases (10.1%) could not be further classified and one was documented as unknown.
table 3: laryngeal Subsite: year(s) 2010-2014
Subsite # of Cases % of Cases
Supraglottis 49 35.5%
Glottis 71 51.4%
Subglottis 3 2.2%
Overlapping Lesion 14 10.1%
Unknown 1 .8%
Total 138 100%
Because survival rates differ based on subsite, the 15 cases classified as overlapping or unknown were further reviewed to determine if any of the imaging or pathological findings documented the site, or if the cancer registry abstractor defined the site as overlapping. This audit was conducted to measure the accuracy of registry data and to identify any other problematic areas. Recommendations have been integrated through educational projects and directives aiming at improving the documentation on which the cancer registry staff relies. Based on this further review, the glottis remained the most frequent subsite at 59% and the overlapping location site decreased from 9% to 0% of the cases.
table 4: laryngeal Subsite: (after audit) year(s) 2010-2014
Subsite # of Cases % of Cases
Supraglottis 54 39%
Glottis 81 59%
Subglottis 3 2%
Overlapping Lesion 0 -
Unknown 0 -
Total 138 100%

32 • Loyola University Health System Patient Care Evaluation
PathologyPathological diagnosis for laryngeal cancer is achieved after biopsy which is generally obtained at direct laryngoscopy under general anesthesia. The vast majority of all laryngeal malignancies are conventional squamous cell carcinomas (SCC) and they vary according to their degree of differentiation. Glottic cancers are generally well differentiated and have a less aggressive behavior in comparison with carcinomas at the other subsites of the larynx. SCC often arises in a background of mucosal squamous dysplasia or carcinoma in situ and typically presents as islands, tongues and clusters of atypical cells invading the laryngeal stroma. Features of squamous differentiation also comprise individual cell keratinization, intercellular bridges and keratin pearls. Recognition of the less common variants like verrucous, spindle cell and basaloid SCC is significant because their biological course often is different from that of conventional SCC.
Histological examination revealed the vast majority of laryngeal cancers to be squamous cell carcinoma (squamous cell carcinomas 111, 80%, keratinizing squamous cell carcinoma (13, 9%). Five cases were classified as carcinoma in situ or squamous cell carcinoma in situ (5, 4%). Other classifications included large cell, non-keratinizing squamous cell carcinoma (5, 4%), squamous cell carcinoma spindle cell (3, 2%) and basal cell adenocarcinoma (1, 1%). Pathologic classification showed 94 cases (68%) as well or moderately differentiated squamous cell carcinoma (grade I or II), 26 cases (19%) as poorly differentiated squamous cell carcinoma (grade III or IV) and 18 (13%) cases were classified as unknown.
table 5: Distribution by Histology and aJcc Stage (year: 2010-2014)
0 1 2 3 4A 4B 4C Total
Carcinoma in Situ 3 - - - - - - 3
Squamous Cell Carcinoma in Situ 2 - - - - - - 2
Squamous Cell Carcinoma NOS - 38 11 20 38 1 3 111
Squamous Cell Carcinoma, Keratinizing - 5 2 1 4 1 - 13
Squamous cell carcinoma large cell non-keratinizing - 2 - 2 1 - - 5
Squamous cell carcinoma spindle cell - 1 2 - - - - 3
Basal cell adenocarcinoma - - - - 1 - - 1
Total 5 46 15 23 44 2 3 138

2014 Oncology Program Annual Report • 33Study of Larynx Cancer 2010-2014
Once the diagnosis of laryngeal cancer has been documented the disease is staged according to the TNM classification system (stages I-IV) using the International Union against Cancer/American Joint Committee on Cancer (UICC/AJCC) criteria. This system takes into account tumor size and location (T), lymph node involvement (N) and presence of distant metastasis (M) (see Appendix A).
The stage distribution of larynx cancer cases at LUMC compared to national data is shown in Table 6 below.
table 6: lumc aJcc Stage comparison with national Data (2009-2013)
(2009-2013 years used for purposes of same year comparison with national data)
Recommendations from the commission on cancer
Stage LUMC Year-(2009-2013) N=135 NCDB Year-(2009-2013) N=52,517
0 7 (5%) 3203 (6%)
I 50 (37%) 15216 (29%)
II 11 (8%) 7667 (15%)
III 22 (16%) 8957 (17%)
IV 45 (33%) 14762 (28%)
Unknown Stage - 2352 (4%)
Total 135 (100%) 52517 (100%)
LUMC/ Loyola University Medical Center//NCDB /National Cancer Data Base (Data from 1,465 Hospitals)

34 • Loyola University Health System Patient Care Evaluation
TreatmentAccording to the National Comprehensive Cancer Network (NCCN), treatment options and recommendations depend on several factors, including the type and stage of cancer, subsite location of cancer, potential side effects, and the patient’s preferences and overall health. There are three main treatment options for laryngeal cancer: surgery, radiation therapy, and chemotherapy. Generally speaking, early stage laryngeal cancers (Stage I or II) can be treated with radiation therapy alone or surgery. Surgery options depend on the subsite and extent as well as other patient factors, but may include endoscopic resection including laser resection and open partial laryngectomy (supraglottic laryngectomy or vertical hemilaryngectomy). Advanced stage cancers (Stages III and IV) require multimodality therapy and may include concurrent chemoradiation with surgical salvage if needed or surgery with radiation or chemoradiation depending on pathologic analysis. Surgery for advanced stage cancers may include endoscopic or open partial laryngectomy and neck dissection or total laryngectomy and neck dissection. The treatment of laryngeal cancer at LUMC by stage is shown in Table 7. The comparison of treatment course between LUMC and date from the NCDB is shown in Table 8.
table-7: lumc: laryngeal treatment by Stage (year 2009-2013)
Same years used for NCDB comparison purposes
Stage 0 I II III IV % (# of cases)
Surgery Only 5 13 5 7 12 31% (42)
Radiation Only 1 21 4 3 2 23% (31)
Surgery &Radiation - 12 1 1 15 21% (29)
Radiation & Chemotherapy - 1 1 7 4 10% (13)
Surgery, Radiation & Chemotherapy - - 2 10 - 9% (12)
No 1st Course Rx - 3 - 1 1 4% (5)
Active Surveillance 1 - - - - .7% (1)
Chemotherapy Only - - - 1 - .7% (1)
Surgery & Chemotherapy - - - - 1 .6% (1)
Total 7 50 11 22 45 100% (135)

2014 Oncology Program Annual Report • 35Study of Larynx Cancer 2010-2014
table 8: treatment combination comparison: lumc vs ncDB (year 2009-2013)
First Course Treatment of Larynx Cancer Diagnosed in 2009, 2010, 2011, 2012, 2013 Loyola University Medical Center, Maywood IL vs. All Types Hospitals in All States All Diagnosis Types - Data from 1465 Hospitals
# First Course Treatment My (N) Oth. (N) My (%) Oth. (%)
Column TOTAL 135 52517 100% 100%
1. Surgery Only 42 8887 31.11% 16.92%
2. Radiation Only 31 13959 22.96% 26.58%
3. Surgery & Radiation 29 6148 21.48% 11.71%
4. Radiation & Chemotherapy 13 12663 9.63% 24.11%
5. Surgery, Radiation & Chemotherapy 12 3258 8.89% 6.2%
6. No 1st Course Rx 5 4924 3.7% 9.38%
7. Surgery & Chemotherapy 1 302 0.74% 0.58%
8. Chemotherapy Only 1 1142 0.74% 2.17%
9. Active Surveillance 1 74 0.74% 0.14%
10. Surgery, Radiation & Hormone Therapy - 11 - 0.02%
SurvivalThe tables below illustrate the observed 5-year survival rate calculated by the Actuarial Life Table Method (calculates the proportion surviving to each point in time that death occurs) from Loyola University Medical Center:
table 9: lumc (kaplan-meier ) Survival rates (%) cases Diagnosed in 2006-2010 5 year survival
Years 0-Year 1-Year 2-Year 3-Year 4-Year 5-Year
Stage 0 100 100 100 100 100 100
Stage I 100 92.8 92.8 88.6 84.4 84.4
Stage II 100 94.4 94.4 81.8 81.8 69.2
Stage III 100 88 88 83.6 69.8 64.8
Stage IV 100 73.6 45.2 37.3 31.1 24.8

36 • Loyola University Health System Patient Care Evaluation
Survival date from the National Cancer Institute (NCI) by stage and laryngeal subsite is shown in Table 10.
table 10: larynx Survival rates by Stage & Sub types (ncI: year-2003)
Sub-site I II III IV
Supraglottis 75-85% 55-65% 45-75% 15-35%
Glottis 85-95% 60-80% 55-70% 10-25%
Subglottis – 30-40% – –
DiscussionLoyola University Medical Center is a high volume head and neck cancer center that treats nearly 40 laryngeal cancers every year. Similar to national statistics, approximately ¾ of our patients are male, and over half present with glottic tumors. About ⅓ of our patients present with Stage I disease, while another ⅓ present with Stage IV disease. The vast majority are squamous cell carcinoma. We have all treatment modalities available at LUMC and work as a multidisciplinary team with all cases presented prospectively at multidisciplinary tumor board. Slightly over ⅓ of patients are treated with surgery alone, over the national average, while approximately 10% are treated with radiation and chemotherapy.
The results of this study demonstrate that stage at presentation remains a significant predictor of survival. Other prognostic factors will likely be identified as research continues.
Areas in which we can improve include prospectively capturing data regarding tobacco, alcohol and drug use as well as oral health. Additionally, we could benefit from collecting tumor samples. An IRB approved method to capture these data has been developed, and will be put in place in the future. In conjunction with the cancer committee and cancer registrar, we hope to add data fields that will answer important clinical questions for future retrospective analyses. Such an expanded data base will provide important information for future studies. A recommendation of the cancer committee is to repeat this study to assess compliance with patient guidelines and the success of collecting prospective data and tumor samples as outlined above. A goal of Loyola University Medical Center is to collect high quality data so we can provide useful information about cancer to our patients and the community.
In conclusion, the larynx plays a fundamental role in the maintenance of the airway, protecting the lungs from aspiration and the production of speech. These facts must always be given consideration when a decision is made for the optimal management of a laryngeal tumor. Organ preservation strategies, either surgical or non-surgical, have dominated the treatment of early laryngeal lesions. Developments and integrated strategies, including endoscopic and open partial laryngectomy procedures including use of the surgical robot, concurrent chemotherapy and radiation therapy, induction chemotherapy, IMRT and aggressive supportive care with speech therapy, nutrition, physical therapy and specialized head and neck nursing care have expanded the options for our patients. These advances in management strategies aim at improved clinical outcome, retention of function, and superior quality of life. In the future, further refinements in diagnostic and therapeutic techniques will allow physicians to better treat patients with laryngeal cancers. Positron emission tomography (PET) scans may help diagnose lesions earlier and more accurately assess recurrence. Gene therapy may offer alternative treatment options. Additionally, the identification of biomarkers to guide personalized treatment planning promises to further enhance our ability to maximize outcome and minimize side effects.

2014 Oncology Program Annual Report • 37
Appendix A: Laryngeal Cancer Staging, AJCC 7th EditionSupraglottis
• T1: Tumor limited to one subsite of supraglottis with normal vocal cord mobility
- Subsites: False cords, arytenoids, suprahyoid epiglottis, infrahyoid epiglottis, aryepiglotic folds
• T2: Tumor invades mucosa of more than one adjacent subsite* of supraglottis or glottis or region outside the supraglottis (e.g., mucosa of base of tongue, vallecula, or medial wall of pyriform sinus) without fixation of the larynx
• T3: Tumor limited to larynx with vocal cord fixation and/or invades any of the following: postcricoid area, pre-epiglottic tissues, paraglottic space, and/or minor thyroid cartilage erosion (e.g., inner cortex)
• T4a: Tumor invades through the thyroid cartilage, and/or invades tissues beyond the larynx (e.g., trachea, soft tissues of the neck including deep extrinsic muscle of the tongue, strap muscles, thyroid, or esophagus) Note: extrinsic muscles of the tongue are: genioglossus, hyoglossus, styloglossus, and palatoglossus
• T4b: Tumor invades prevertebral space, encases carotid artery, or invades mediastinal structures
glottis• T1: Tumor limited to the vocal cord(s), which
may involve anterior or posterior commissure, with normal mobility
- T1a: Tumor limited to one vocal cord
- T1b: Tumor involves both vocal cords
• T2: Tumor extends to supraglottis and/or subglottis and/or with impaired vocal cord mobility
• T3: Tumor limited to the larynx with vocal cord fixation and/or invades paraglottic space, and/or minor thyroid cartilage erosion (e.g., inner cortex)
• T4a: Tumor invades through the thyroid cartilage and/or invades tissues beyond the larynx (e.g., trachea, soft tissues of neck, including deep extrinsic muscle of the tongue, strap muscles, thyroid, or esophagus) Note: extrinsic muscles of the tongue are: genioglossus, hyoglossus, styloglossus, and palatoglossus
• T4b: Tumor invades prevertebral space, encases carotid artery, or invades mediastinal structures
Subglottis• T1: Tumor limited to the subglottis
• T2: Tumor extends to vocal cord(s) with normal or impaired mobility
• T3: Tumor limited to larynx with vocal cord fixation
• T4a: Tumor invades cricoid or thyroid cartilage and/or invades tissues beyond the larynx (e.g., trachea, soft tissues of neck, including deep extrinsic muscles of the tongue, strap muscles, thyroid, or esophagus) Note: extrinsic muscles of the tongue are: genioglossus, hyoglossus, styloglossus, and palatoglossus
• T4b: Tumor invades prevertebral space, encases carotid artery, or invades mediastinal structures
lymph node Stage• NX - Cannot be assessed
• N0 - No regional lymph nodes metastasis
• N1 - Single ipsilateral lymph node, <= 3cm in greatest dimension
• N2
- N2a - Single ipsilateral lymph node, 3-6 cm in greatest dimension
- N2b - Multiple ipsilateral lymph nodes, <= 6cm in greatest dimension
- N2c - Bilateral or contralateral lymph nodes, <= 6cm in greatest dimension
• N3 - Lymph node(s) >6 cm in greatest dimension
metastasis Stage• MX: Distant metastasis cannot be assessed
• M0: No distant metastasis
• M1: Distant metastasis
aJcc Overall Stage• I - T1 N0
• II - T2 N0
• III - T3 N0, T1-3 N1
• IVA - T4a N0-2, T1-4a N2
• IVB - T4b any N, any T N3
• IVC - M1 (Cancer has spread to other parts of the body, such as the lung, liver, or bone)

38 • Loyola University Health System
Glossary of Terms
Accession: The addition of new cancer cases to the Oncology Registry. Each patient is assigned a separate and permanent number.
ACOS: American College of Surgeons
ACS: American Cancer Society
Class of Case: The class of case divides cases recorded in the database of the facility into categories of analytic and non-analytic. Analytic data includes cases diagnosed at the accessioning facility and/or administration of any of the first course of treatment after the *registry’s reference date. Non-analytic cases are first diagnosed and receive all of first course of therapy at another institution, or are diagnosed at autopsy or by death certificate only. Non-analytic cases are not usually included in routine treatment or survival statistics. Based on category, the cancer program selects cases to be used by their facility or to be reported to the central registry, as well as, the National Cancer Data Base (NCDB).
Analytic: A case first diagnosed and / or receiving first course treatment at that facility, or diagnosed at autopsy.
Non-analytic: Any case diagnosed at another facility and receiving all of first course treatment at that facility, then seen at Loyola University Medical Center for subsequent treatment.
Class 0 Diagnosis at accessioning facility and the entire first course of treatment was performed elsewhere or the decision not to treat was made at another facility.
>Patients who elect to be treated elsewhere.
> Patients who are referred elsewhere for treatment for any reason. For example, lack of special equipment; proximity of a patient’s residence; financial, social or rehabilitative considerations
Class 1 Diagnosis at the accessioning facility, and all or part of the first course of treatment was performed at the accessioning facility.
Patients diagnosed at the accessioning facility whose treatment plan is either not to treat or watchful waiting.
Patients diagnosed at the accessioning facility who refuse treatment.
Patients diagnosed at the accessioning facility who are not treatable or who were given palliative care only due to age, advanced disease, or other medical conditions.
Patients diagnosed at the accessioning facility for whom it is unknown whether treatment was recommended or administered.
Patients diagnosed at the accessioning facility for whom treatment was recommended, but it is unknown whether it was administered.
Patients diagnosed at a staff physician’s office who receive their first course of treatment at the accessioning facility. “Staff physician” refers to any medical staff with admitting privileges at the accessioning facility.
Patients diagnosed at the accessioning facility who received all or part of their first course of treatment in a staff physician’s office

Class 2 Diagnosis elsewhere, and all or part of the first course of treatment was performed at the accessioning facility.
Patient provided palliative care in lieu of first course treatment, or as part of the first course of treatment, at the accessioning facility.
Class 3 Diagnosis and all of first course treatment done elsewhere.
Patient treated or managed at the accessioning facility, but first course of treatment information is unknown.
Patient for whom the accessioning facility developed a treatment plan or provided “second opinion” services, but the diagnosis and treatment was provided elsewhere.
Patient treated for a recurrence or progression for a previously diagnosed malignancy.
NCDB: The National Cancer Database
References
Illinois Cancer Facts & Figures American Cancer Society, Incidence 2014
AJCC Manual for Staging Seventh Edition
National Cancer Data Base American College of Surgeons, Commission on Cancer
Electronic Registry Systems Cancer Data Management Database Systems 2014
College of American Pathologists www.cap.org CAP Cancer Protocols
NCCN Guidelines in Oncology-v.2.2015 National Comprehensive Cancer Network, 2015
National Cancer Facts & Figures, ACS American Cancer Society, Inc., Surveillance Research, CDC, 2014

© 2016 Loyola University Health System. All Rights Reserved. • February 2016 • 20160201-02
2160 S. First Ave. • Maywood, IL 60153 708-216-3862 • loyolamedicine.org