On Vulnerability to Food Insecurity and Natural Hazards...
133
Integrated Context Analysis (ICA) On Vulnerability to Food Insecurity and Natural Hazards Pakistan, 2017
-
Upload
truongnguyet -
Category
Documents
-
view
219 -
download
1
Transcript of On Vulnerability to Food Insecurity and Natural Hazards...

Integrated Context Analysis (ICA) On Vulnerability to Food Insecurity and Natural Hazards
Pakistan, 2017

II
Integrated Context Analysis (ICA) On Vulnerability to Food Insecurity and Natural Hazards
Pakistan, 2017

III
National Disaster Management Authority (NDMA) is the lead federal agency to deal with whole spectrum of
Disaster Management (DM) in Pakistan. It was raised in 2007 through National Disaster Management Ordinance and
was finally provided parliamentary cover by an act of Parliament in 2010. It is the executive arm of the National
Disaster Management Commission (NDMC), which was established under the Chairmanship of the Prime Minister
of Pakistan, as an apex policy making body in the field of Disaster Management. NDMA aims to develop sustainable
operational capacity and professional competence to coordinate emergency response of Federal Government in the
event of a national level disaster.
United Nations World Food Programme (WFP) operations in Pakistan are aligned with the Government of
Pakistan’s priorities defined in Vision 2025. WFP is supporting the Government-led efforts to improve food and
nutrition security among vulnerable communities affected by the law and order situation and the effects of recurring
climatic events, in the most hazard-prone areas of the country. WFP is also working to build resilience; address
malnutrition; create an enabling environment for women to achieve social and economic equality and facilitate the
voluntary return of the displaced.
Disclaimer:
The designation employed and the presentations of material in this publication do not imply the official endorsement
on the part of the World Food Programme (WFP) concerning the legal status of any country, territory, city or area of
its frontiers or boundaries. All reasonable precautions have been taken to compile the data for this publication.
However, the World Food Programme or any of its partners are not responsible for its accuracy.
© Copyright – National Disaster Management Authority Pakistan
ISBN: ------------------------------------------------------------
We appreciate your feed-back
Questions and comments concerning this publication may be addressed to National Disaster Management
Authority, Pakistan or World Food Programme, Country Office Pakistan via contact details below.
Contacts:
National Disaster Management Authority Pakistan Prime Minister’s Office,2nd Floor Sector G-5/1 Constitution Avenue, Islamabad Post Code 44000 [email protected] Phone: +92 51 9205037 www.ndma.gov.pk
World Food Programme Pakistan Vulnerability Analysis & Mapping (VAM) Unit Plot No.1, Diplomatic Enclave G-5, Islamabad Post Office Box 3030 [email protected] Phone: +92 51 8312000 vam.wfp.org.pk
IV
Steering Committee Members
1. Brig. Mukhtar Ahmed, Member (Operations), National Disaster Management Authority (NDMA)
Pakistan
2. Dr. Mubarak Ali, Member Food Security & Climate Change, Ministry of Planning Development
& Research Pakistan
3. Mr. Ishrat Ali, Joint Secretary Development, Ministry of Climate Change (MoCC) Pakistan
4. Mr. Ismail Khan, Deputy Director General, Pakistan Bureau of Statistics (PBS)
5. Dr. Umar Farooq, Member Social Sciences Division, Pakistan Agriculture Research Council
(PARC)
6. Dr. Stephen Prescott Davies, Senior Research Fellow & Programme Leader, International Food
Policy Research Institute (IFPRI) Pakistan
7. Mr. Raja Ajmal Jahangeer, Statistician, Food and Agriculture Organization Pakistan
8. Mr. Kevin Wyjad, ICA Coordinator, World Food Programme Headquarters Italy
9. Mr. William Affif, Head of Programme, World Food Programme Pakistan
Technical Committee Members
1. Mr. Syed Muhammad Ayub Shah, Deputy Director (ICT), NDMA Pakistan
2. Mr. Ismail Khan, Deputy Director General, Pakistan Bureau of Statistics (PBS)
3. Dr. Azmat Hayat, Director, Pakistan Meteorological Department (PMD)
4. Mr. Syed Zuhair Bukhari, Director, Pakistan Space and Upper Atmosphere Research Commission
(SUPARCO)
5. Dr. Muhammad Ishaq, Director, Pakistan Agriculture Research Council (PARC)
6. Ms. Mehwish Ali, GIS Analyst, Food and Agriculture Organization Pakistan
7. Ms. Thi Van Hoang, Head of VAM Unit, World Food Programme Pakistan
10. Ms. Nadine Lombardo, GIS Analyst, World Food Programme Headquarters Italy
8. Mr. Iftikhar Abbas, GIS/Spatial Analyst, World Food Programme Pakistan
9. Ms. Sarah Bashir, GIS Associate, World Food Programme Pakistan
V
List of Abbreviations
CBPP Community-Based Participatory Planning
CSP Country Strategic Plan
DEM Digital Elevation Model
DMC Disaster Management Cycle
DRM Disaster Risk Management
DRR Disaster Risk Reduction
ESA European Space Agency
FAO Food & Agriculture Organization of the United Nations
GLOF Glacial Lake Outburst Flood
MPI Multi-Dimensional Poverty Index
NASA National Aeronautics and Space Administration
NDMA National Disaster Management Authority
OCHA Office for the Coordination of Humanitarian Affairs
OSEP Emergency Preparedness Branch, WFP
PBS Pakistan Bureau of Statistics
PDMA Provincial Disaster Management Authority
PMD Pakistan Meteorological Department
PoU Prevalence of Undernourishment
PSLM Pakistan Social and Living Standards Measurement
SDG Sustainable Development Goals
SLP Seasonal Livelihood Programming
SPI Standardized Precipitation Index
SUPARCO Pakistan Space and Upper Atmosphere Research
Commission
UNDP United Nations Development Programme
VAM Vulnerability Analysis & Mapping, WFP
3PA Three-Pronged Approach for Resilience Programming
VI
FOREWORD
Food is basic human need and essential for sustaining life under all circumstances. While ensuring
appropriate nourishment remains a challenge in itself, it gets extremely demanding during natural disasters.
This intricate relationship between prevalence of vulnerability to food insecurity and natural hazards is
rightfully projected by integrated analysis of all correlated contexts. ‘Integrated Context Analysis’ therefore,
is an ordinate, globally adopted and proven programmatic tool of immense value to the decision makers.
World Food Programme’s endeavors in terms of introducing ICA in Pakistan and world over are
commendable. The process was initiated in Pakistan in a logical, all-inclusive and structured manner in
October 2016. National consultation with all stakeholders and relevant departments at federal and
provincial levels was held. This joint meeting aimed at introducing the process and making it meaningful,
indigenous and owned by all. Representatives unanimously approved implementation of ICA for Pakistan
and recommended NDMA to act as lead agency.
World Food Programme and NDMA thereafter jointly adopted a logical and structured
methodology. Two Committees were formed. Steering Committee comprised of representatives from all
stakeholders including federal departments. While, Technical Committee included technical representation
from all relevant departments.
The process commenced with identification of relevant data sets. Technical committee accordingly
pursued the process at intricate level seeking international support from WFP HQ and FAO HQ both
located at Rome. ICA Report comprises two parts, a Technical Report and a Programmatic Report.
Findings in both parts were formulated and finalized after repeated consultations with the national and
provincial stakeholders. All results at every stage were tested and verified with due ratification by joint
sessions of both committees and all stakeholders including national and provincial.
Integrated Context Analysis is meaningful from multiple standpoints particularly for those
associated with food security and natural disasters. Both long term and short term programmatic
intervention are suggested in the report. NDMA is accordingly poised for endeavoring to foster resilience
in identified areas in cooperation with all stakeholders and implementation partners.
It may be more pertinent to mention here that, Integrated Context Analysis is a living process. It
can be repeated with fresh data and more relevant inputs in future. I am sure NDMA and WFP as long
term partners in humanitarian efforts will continue to cooperate towards ICA+ in near future.
I must also congratulate all contributors to the process and thank them for their valuable support.
Lieutenant General Omar Mahmood Hayat, HI (M) Chairman NDMA

VII
PREFACE
Supporting people who are vulnerable to food insecurity in Pakistan and reducing the risks they
face from climate-related natural shocks, thereby protecting their development gains and enabling further
progress in highly food insecure and risk-prone areas, has become an increasingly important part of WFP’s
assistance in the country through the current Protracted Relief and Recovery Operation (PRRO) for 2016-
2017. In the Country Strategic Plan (CSP) being developed for 2018-2022, WFP is tailoring support between
humanitarian, recovery and development efforts in ways that make the most sense according to specific
geographical contexts.
WFP has been collaborating with the Pakistan’s National Disaster Management Authority
(NDMA) in various activities as agreed in our Memorandum of Understanding (MoU) signed in 2016 and
Annual Work Plans of 2016 and 2017, which have contributed to the strengthening of emergency
preparedness and response capacities of the federal as well as provincial governments.
Under the overall leadership of NDMA, in partnership with relevant line ministries and technical
agencies, WFP Pakistan has carried out an important “Integrated Context Analysis of vulnerability to food insecurity
and natural hazards” (ICA) based on existing datasets to identify and rank districts by the level of these risks.
This Report presents results on the vulnerability to food insecurity in 130 districts in four provinces as well
as FATA. It has complete data for all 156 districts in the country on major natural hazards (flood, drought),
core lenses (hazards of soil erosions, land slide, Glacial Lake Outburst Flood, earthquake, land degradation),
including additional contextual information (land cover, population density).
The Report provides a solid foundation to more effectively inform the programming, targeting and
decision making of medium-term and long-term broad programmatic strategies regarding social safety net,
disaster risk reduction, early warning and disaster preparedness. It also helps guide subsequent Seasonal
Livelihood Programming at the district level and Community-based Participatory Planning at the
community level. The ICA also provides relevant products and materials for advocacy, capacity
development and future replication in order to update this analysis or carry out similar analyses.
I congratulate NDMA for its important leading role, coordination and strong engagement
throughout this study. It has been a source of pride to work alongside the Government of Pakistan, NDMA,
relevant agencies and departments providing recovery and development support related to food security,
resilience building and disaster risk reduction.
I would like to extend my thanks to the Ministry of Planning, Development and Reforms, Ministry
of Climate Change, Pakistan Bureau of Statistics, Pakistan Meteorology Department, Space and Upper
Atmosphere Research Commission, Pakistan Agriculture Research Council, Disaster Management
Authority of all the provinces and regions, the United Nations Food and Agriculture Organization and the
International Food Policy Research Institute of Pakistan, for their partnership and invaluable contributions
in executing this study.
I would also like to reaffirm WFP’s commitment to continue and expand fruitful collaboration
with the Government for improved food security, livelihood and resilience in the country.
Finbarr Curran
Representative and Country Director
The United Nations World Food Programme

VIII
ACKNOWLEDGEMENT
“Integrated Context Analysis on Vulnerability to Food Insecurity and Natural Hazards” (ICA) is a joint
initiative by the United Nations World Food Programme (WFP) and the National Disaster Management
Authority (NDMA) in close collaboration with the United Nations Food and Agriculture Organization
(FAO) and relevant line departments, ministries and technical institutions of Pakistan. The study has been
carried out under the overall leadership of NDMA from December 2016 to September 2017.
Chairman of Steering Committee and Lead of Technical Committee along with ICA team members
from WFP would like to extend their gratitude to all individuals, departments and agencies forming part of
the two Committees that led the process both directly and indirectly. In particular Director Generals of all
Provincial Disaster Management Authorities including SDMA (AJK), FDMA (FATA), GBDMA (GB) and
esteemed representatives of Provincial Planning and Departments.
Steering Committee was chaired by Brig. Mukhtar Ahmed, Member (Operations) NDMA, and
consisted of other members including Dr. Mubarak Ali, Member (Food Security & Climate Change),
Ministry of Planning Development and Reforms (MPD&R); Mr. Ishrat Ali, Joint Secretary (Development),
Ministry of Climate Change (MoCC); Dr. Umer Farooq, Member (Social Sciences Division), Pakistan
Agriculture Research Council (PARC); Mr. Ismail Khan, Deputy Director General, Pakistan Bureau of
Statistics (PBS); Dr. Stephen Prescott Davies, Senior Research Fellow & Program Leader, International
Food Policy Research Institute (IFPRI); Mr. Raja Ajmal Jahangeer, Statistician, FAO Pakistan; Mr. Kevin
Wyjad, ICA Coordinator, WFP Headquarters Italy; Mr. William Affif, Head of Programme & Policy, WFP
Pakistan; representatives of the Disaster Management Authorities of the province of Balochstan, Khyber
Pakhtunkhwa (KP), Punjab and Sindh and the regions including Federally Administered Tribal Areas
(FATA), Gilgit Baltistan (GB) and Azad Jammu & Kashmir (AJ&K).
Engr. Syed Muhammad Ayub Shah, Head of ICT Directorate, NDMA chaired the Technical
Committee comprising representation from multiple institutions. Committee comprised of specialists
including Dr. Azmat Hayat, Director Pakistan Meteorological Department (PMD); Mr. Syed Zohair
Bukhari, Director Pakistan Space and Upper Atmosphere Research Commission (SUPARCO); Mr. Ismail
Khan, Deputy Director General Pakistan Bureau of Statistics (PBS); Dr. Muhammad Ishaq, Director
Pakistan Agriculture Research Council (PARC); Ms. Mehwish Ali, GIS Analyst FAO Pakistan; Ms. Nadine
Lombardo-Han, GIS/ICA specialist WFP Headquarters Italy; Mr. Iftikhar Abbas, Programme & Policy
Officer (GIS) and Ms. Thi Van Hoang, Head of Vulnerability Analysis & Mapping Unit (VAM) WFP
Pakistan. Special thanks to Ms. Nadine Lombardo-Han for her enormous support and advice in technical
training on ICA methodology and tools, data triangulation, analysis, write-up of the Technical Report and
finalization of all ICA by-products.
Study team gratefully acknowledges contributions from Mr. Muhammad Zafar Iqbal, Director
(Relief & Response) NDMA; Mr. Muhammad Razi, Deputy Director (Relief & Response) NDMA, for the
coordination and secretariat support.
The team highly appreciates the overall guidance and strong support from Lieutenant General
Omar Mahmood Hayat HI(M) Chairman NDMA; Mr. Finbarr Curran, Representative and Country
Director WFP Pakistan; Ms. Sheila Grudem, Deputy Director of Emergency and Response Support
Division (OSE) and Mr. Zlatan Milisic, Deputy Director of Direct Implementation Programme Service
(OSZP), WFP Headquarters Italy.
Finally, and most importantly, we would like to sincerely thank all stakeholders who actively
participated in ICA Technical and Programmatic Consultation workshops extensively organized at
provincial and national levels. They generously rendered their time and valuable inputs towards validation
of preliminary results and identification of relevant broad medium-term and long-term programmatic
strategies, without whom this report would have not been possible. The report will contribute towards
reducing the vulnerability to food insecurity and risks to climate-related natural shocks.

IX
EXECUTIVE SUMMARY
ICA is a WFP corporate programme design tool, used in over 20 countries around the globe. It provides
evidence to support strategic placement and combination of four broad programmatic themes: Safety Net,
Disaster Risk Reduction (DRR), Early Warning and Disaster Preparedness.
ICA for Pakistan was planned during November – December 2016 based on recommendations of a
Stakeholder Sensitization Workshop (October 2016) and implemented during January – October 2017
under the leadership of NDMA, involving relevant line ministries, WFP, FAO and various technical
institutions.
The ICA aims to: i) Categorise districts by the level of recurrence of vulnerability to food insecurity, natural
hazards, core lenses and relevant contextual factors; ii) Provide information for more effective medium and
long-term food security interventions related to resilience building and disaster risk reduction; and iii)
Provide a set of relevant products and materials for advocacy, capacity building, future replication or update.
ICA includes two core dimensions (vulnerability to food insecurity and natural hazards: flood and drought),
five core lenses (land slide, Glacial Lake Outburst Flood, earthquake, soil erosion, land degradation), and
two contextual factors (dominant land cover, population density). District is a geographical unit of analysis.
ICA uses Multi-dimensional Poverty Index (MPI) as a proxy for vulnerability to food security for four
provinces (Balochistan, KP, Sindh, Punjab including Islamabad). It is derived from six rounds of Pakistan’s
Social and Living Standard Measurement Surveys (2004/05 – 2014/15) released by Government in 2016.
For FATA, due to lack of MPI data, food security prevalence rate of three in-depth assessments conducted
by WFP and partners in 2014 - 2017 is used.
National datasets available for all districts in Pakistan for flood, drought, landslide, GLOF and earthquake
are used. For soil erosion, land degradation, dominant land cover and population density, Pakistan
components of global datasets, are used.
Technical findings and broad programmatic recommendations are based on combined level of recurrence
of two core dimensions. It classifies 123 districts of four provinces and 7 Agencies of FATA into nine
different ICA Areas which are further condensed into five ICA Categories to help formulate broad
programmatic recommendations. Maps of final ICA Areas and broad programmatic recommendations are presented
on next pages.
Category 1 comprises 42 districts (19 in Balochistan, 13 in Sindh, 7 in KP and 3 in Punjab) having high
recurrence of vulnerability to food insecurity coupled with high or medium levels of natural hazards. These
districts would benefit from combinations of food security focused safety nets and comprehensive disaster
risk reduction (DRR) interventions including infrastructure improvement, early warning and disaster
preparedness.
Category 2 comprises 20 districts (7 in Sindh, 5 in KP, 4 in Punjab, and 4 in Balochistan) have moderate
recurrence of vulnerability to food insecurity coupled with high or medium natural hazards. In these
districts, flexible food security safety nets, productive or protective are suggested. Alternatively, needs-based
livelihood recovery efforts in unfavourable years could protect marginal households against negative coping
strategies that undermine development gains. High natural hazards suggest broad DRR interventions
including infrastructure improvement, early warning and disaster preparedness.
Category 3 comprises 19 districts (8 in Balochistan, 6 in FATA and 5 in KP) showing high or moderate
recurrence of vulnerability to food insecurity coupled with relatively low natural hazards. In Area 3A
districts food security safety net approach similar to districts in Category 1 are appropriate, i.e. year round
X
protective safety nets. In ICA Area 3B districts either flexible safety nets, or livelihood recovery/protection
programmes would be relevant.
Category 4 comprises 28 districts (12 in Punjab, 9 in Sindh, 6 in KP, 1 in Balochistan) exhibiting low
recurrence of vulnerability to food insecurity with high or medium level of natural hazards. Broad DRR
(including infrastructure improvement as well as early warning and disaster preparedness) is a priority.
Specific, targeted interventions to improve food security for the most vulnerable people would be needed.
Category 5 comprises 21 districts (18 in Punjab, 2 in KP, 1 in FATA) showing low recurrence of vulnerability
to food insecurity and also low natural hazards. It’s recommended to ensure effective early warning that is
set within systems to trigger disaster preparedness measures.
Due to lack of food security or MPI data, ICA categorisations are not performed for FATA Frontier
Regions (FR), Gilgit Baltistan, and Azad Jammu and Kashmir (AJ&K) regions. However, available data on
natural hazards, core lenses and contextual factors in these regions are still very useful to help in
programming of disaster risk reduction and resilience building related strategies.

XI

XII

XIII
Table of Contents
FOREWORD ..................................................................................................................................... vi
PREFACE ......................................................................................................................................... vii
ACKNOWLEDGEMENT .............................................................................................................. viii
EXECUTIVE SUMMARY ................................................................................................................. ix
Part - I: Technical Analysis ............................................................................................................... 1
1. Introduction ..................................................................................................................................... 2
Selection of Core Dimensions, Lenses, Indicators and Data Sets .......................................................... 3
Interpretation & Utilization of ICA Data Layers .................................................................................. 5
2. Vulnerability to Food Insecurity Analysis ......................................................................................... 7
3. Natural Hazard Analysis ................................................................................................................. 11
Floods ................................................................................................................................................ 11
Drought ............................................................................................................................................. 13
Combined Natural Hazards ................................................................................................................ 15
4. ICA Areas ...................................................................................................................................... 17
5. ICA Categories ............................................................................................................................... 19
6. ICA Lenses .................................................................................................................................... 21
Landslide Hazard ............................................................................................................................... 21
GLOF Hazard ................................................................................................................................... 21
Earthquake Hazard ............................................................................................................................ 21
Land Degradation .............................................................................................................................. 25
7. Additional Contextual Information ................................................................................................ 27
Population Density ............................................................................................................................. 27
Dominant Land Cover ....................................................................................................................... 27
8. Estimated Numbers of People Vulnerable to Food Insecurity ........................................................ 30
Part - II: Programmatic Recommendations .................................................................................. 35
9. ICA Programmatic Implication ...................................................................................................... 38
10. Future Directions for ICA and Related Work in Pakistan ........................................................... 38
11. Programmatic Themes Relevant to ICA ..................................................................................... 38
Safety Nets ......................................................................................................................................... 38
Disaster Risk Reduction (DRR) .......................................................................................................... 39
Early Warning .................................................................................................................................... 39
Preparedness ...................................................................................................................................... 39
12. Programmatic Themes Derived From ICA Areas and Categories ............................................... 40

XIV
13. ICA Areas Map .......................................................................................................................... 41
14. ICA Areas Map (FATA) ............................................................................................................. 42
15. Category 1: Year Round Food Security Safety Nets and Broad DRR .......................................... 43
16. Category 2: Flexible Food Security Safety Nets or Livelihood Recovery & DRR ........................ 44
17. Category 3: Year Round or Flexible Food Security Safety Nets, Livelihood Recovery ................. 45
18. Category 4: Broad Disaster Risk Reduction ................................................................................ 46
19. Category 5: Early Warning and Disaster Preparedness ................................................................ 47
20. DRR in FATA Frontier Regions, Gilgit Baltistan, and Azad Jammu & Kashmir......................... 48
21. References .................................................................................................................................. 50
Annex I Technical Analysis Methodology .............................................................................................. 51
Food Insecurity/Vulnerability to Food Insecurity .............................................................................. 51
Rapid-onset shocks (Flood, Landslide, Earthquake, GLOF) ............................................................... 51
Slow-onset shock (drought) ................................................................................................................ 52
Land degradation ............................................................................................................................... 52
Dominant Land Cover ....................................................................................................................... 54
Annex II - Data Sources ......................................................................................................................... 55
Annex III - Provincial Data Tables and Outcome Maps ......................................................................... 56
Annex IV - Percentage Contribution of Indicators in MPI, 2014/15 .................................................... 112
Annex V - Glossary .............................................................................................................................. 118

Part - I:
Technical Analysis
2
1. Introduction
Background
The ICA is a programming tool that emerges from partnership between WFP Programme, Vulnerability
Analysis & Mapping (VAM) and Emergency Preparedness and Support Response Division (OSEP) staff
at WFP country office, regional bureau and Headquarters.
The objective of ICA is to perform, through spatial analysis techniques, identification of geographical areas
with persistent trends of food insecurity and different levels of natural shocks (hazards). By overlaying these
core dimensions, areas can be identified to formulate broad programmatic strategies, including Safety Nets,
Disaster Risk Reduction (DRR), Early Warning and Disaster Preparedness to improve food security and
reduce vulnerability to natural disasters.
Beyond the core ICA dimensions as mentioned above, additional layers related to food security and natural
hazards (e.g. landslide, land degradation) and relevant to programme strategies are overlaid as lenses
enabling further strategic adjustments and more specific recommendations. ICA can also be used to identify
areas where further in-depth studies or food security monitoring and assessment systems are needed.
ICA applies three pronged approach (3PA). First Prong aims at identification of priority areas (districts)
and framing of broad programmatic strategies. Second Prong focuses on Seasonal Livelihood Programming
(SLP) for prioritized districts to develop specific programs. Third Prong uses Community Based
Participatory Planning (CBPP) at sub district level, to identify more specific programs or interventions.
Close collaboration with governments, partners and local populace is closely and consistently involved and
consulted throughout the process.
ICA in Pakistan is conducted from January to October 2017. This publication comprises of two parts,
Technical Report and Programmatic Recommendations. Technical Report presents detailed technical
aspects, methodology, rationales for adopted data sets and results. Programmatic Recommendations, on
the other hand, highlights broad programmatic strategies to guide towards the next step, the SLP and CBPP
subsequently.
Rationale
WFP Pakistan organized first Stakeholders Consultation Workshop on ICA in October 2016. Analysts and
programming / planning officers from relevant government departments, ministries, organizations,
institutions, UN agencies and Non-Governmental Organizations (NGO) participated. WFP ICA
methodology, process and outputs of pilot ICA were presented. These were jointly discussed in detail for
delineating technical requirements and feasibility of ICA in Pakistan.
The majority of participants considered ICA relevant and a promising programming tool for Pakistan
especially for medium-term and long-term planning and developing food security and resilience-building
programs. As a result, stakeholders suggested WFP to plan and conduct ICA in 2017 in partnership with
relevant technical partners (NDMA, FAO, PBS, etc.). WFP accordingly began ICA in January 2017 and the
whole process was completed in October 2017.
ICA results are of particular interest for the government Planning and Development Departments, Disaster
Management Authorities and all relevant stakeholders at all levels. These results are of great value to the
policy and decision makers as well as public representatives.
Results of ICA are considered crucially important for the start of SDG2 implementation, preparation for
the One UN Programme (OP-III) and development of WFP Country Strategy Plan (CSP) for 2018-2022

3
in Pakistan. Alongside, they of immense interest and use for the academia and research institutions related
to the subject at large.
Objectives
ICA in Pakistan primarily aims at:
I. Identifying and ranking districts into ICA Areas and Categories based on the level of recurrence
of vulnerability to food insecurity and natural hazards (flood and drought) as Core Dimensions to
frame broad programmatic recommendations;
II. Overlaying ICA Areas with Core Lenses (Landslide, GLOF, Earthquake, Land Degradation
hazards) and additional contextual factors (dominant land cover and population density) to further
refine broad programmatic recommendations;
III. Providing sound evidence for more effective programming of relevant medium and long-term food
security interventions, particularly resilience building and disaster risk reduction; and
IV. Providing a set of relevant products and materials for advocacy, capacity building and future
replication of the process for updating this analysis or carrying out similar other analyses.
Partnerships
Following agencies, organisations and government bodies contributed to this analysis:
National Disaster Management Authority
Ministry of Climate Change
Ministry of National Food Security & Research
Ministry of Planning, Development & Reforms
Pakistan Agriculture Research Council
Pakistan Bureau of Statistics
Pakistan Meteorological Department
Pakistan Space and Upper Atmosphere Research Commission
Provincial Disaster Management Authorities of Punjab, Sindh, Khyber Pakhtunkhwa, Balochistan
Federally Administered Tribal Areas Disaster Management Authority
Gilgit Baltistan Disaster Management Authority
Azad Jammu & Kashmir State Disaster Management Authority
Food and Agriculture Organization of the United Nations Pakistan
International Food Policy Research Institute Pakistan
World Food Programme Pakistan and Headquarters Italy
Selection of Core Dimensions, Lenses, Indicators and Data Sets
This part presents an overview of ICA core dimensions, core lenses and their interpretation in terms of
identifying programme themes relevant to particular geographic areas. Each layer included has a specific
purpose, with due agreement reached at or about, by all stakeholders during various ICA Technical
Committee meetings in an evolving and progressive manner.
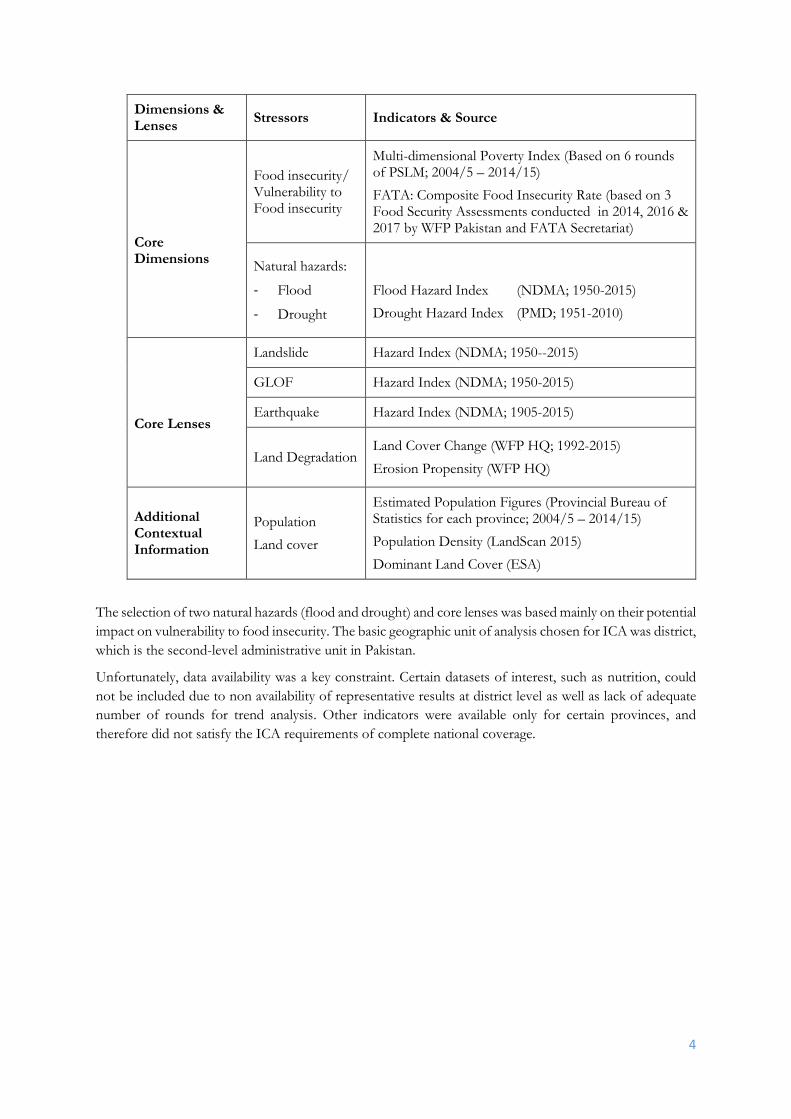
Relevant indicators and available data sets were extensively identified and explored over the course of
Technical Committee meetings and the best options were selected by triangulating multiple sources where
possible. Outcomes of data selection process are summarized in the table below:
4
Dimensions & Lenses
Stressors Indicators & Source
Core Dimensions
Food insecurity/ Vulnerability to Food insecurity
Multi-dimensional Poverty Index (Based on 6 rounds of PSLM; 2004/5 – 2014/15)
FATA: Composite Food Insecurity Rate (based on 3 Food Security Assessments conducted in 2014, 2016 & 2017 by WFP Pakistan and FATA Secretariat)
Natural hazards:
- Flood
- Drought
Flood Hazard Index (NDMA; 1950-2015)
Drought Hazard Index (PMD; 1951-2010)
Core Lenses
Landslide Hazard Index (NDMA; 1950--2015)
GLOF Hazard Index (NDMA; 1950-2015)
Earthquake Hazard Index (NDMA; 1905-2015)
Land Degradation Land Cover Change (WFP HQ; 1992-2015)
Erosion Propensity (WFP HQ)
Additional Contextual Information
Population
Land cover
Estimated Population Figures (Provincial Bureau of Statistics for each province; 2004/5 – 2014/15)
Population Density (LandScan 2015)
Dominant Land Cover (ESA)
The selection of two natural hazards (flood and drought) and core lenses was based mainly on their potential
impact on vulnerability to food insecurity. The basic geographic unit of analysis chosen for ICA was district,
which is the second-level administrative unit in Pakistan.
Unfortunately, data availability was a key constraint. Certain datasets of interest, such as nutrition, could
not be included due to non availability of representative results at district level as well as lack of adequate
number of rounds for trend analysis. Other indicators were available only for certain provinces, and
therefore did not satisfy the ICA requirements of complete national coverage.
5
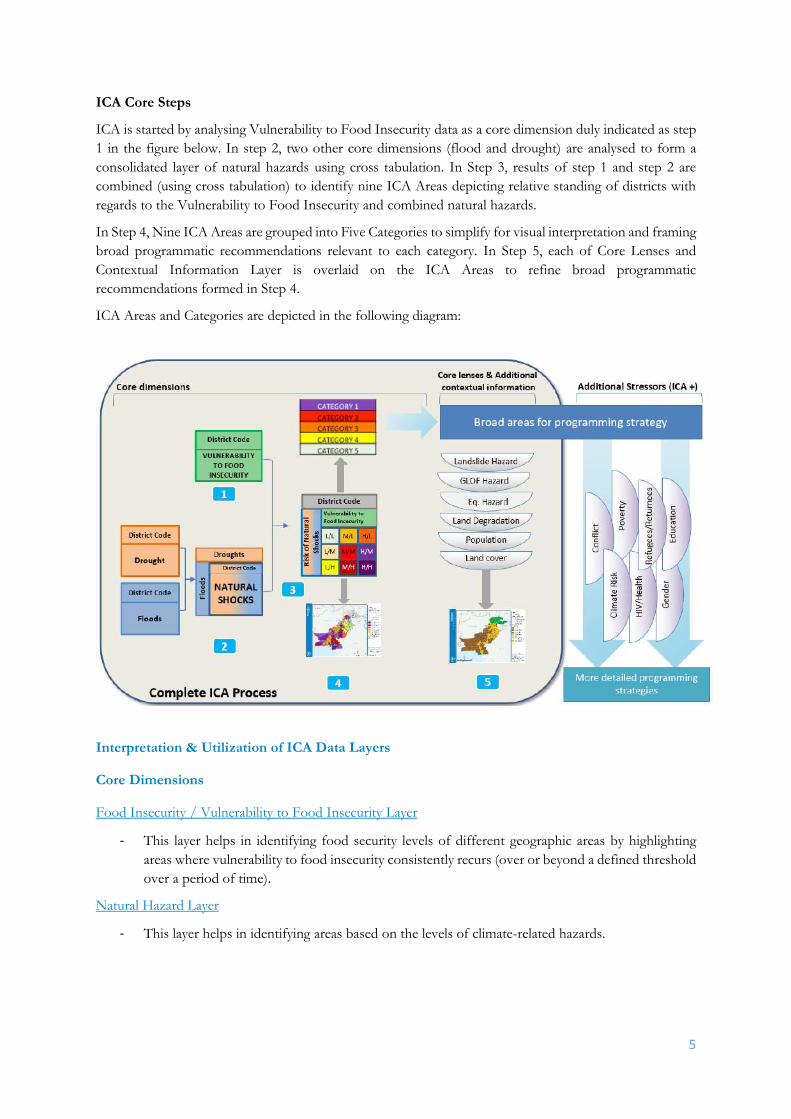
ICA Core Steps
ICA is started by analysing Vulnerability to Food Insecurity data as a core dimension duly indicated as step
1 in the figure below. In step 2, two other core dimensions (flood and drought) are analysed to form a
consolidated layer of natural hazards using cross tabulation. In Step 3, results of step 1 and step 2 are
combined (using cross tabulation) to identify nine ICA Areas depicting relative standing of districts with
regards to the Vulnerability to Food Insecurity and combined natural hazards.
In Step 4, Nine ICA Areas are grouped into Five Categories to simplify for visual interpretation and framing
broad programmatic recommendations relevant to each category. In Step 5, each of Core Lenses and
Contextual Information Layer is overlaid on the ICA Areas to refine broad programmatic
recommendations formed in Step 4.
ICA Areas and Categories are depicted in the following diagram:
Interpretation & Utilization of ICA Data Layers
Core Dimensions
Food Insecurity / Vulnerability to Food Insecurity Layer
- This layer helps in identifying food security levels of different geographic areas by highlighting
areas where vulnerability to food insecurity consistently recurs (over or beyond a defined threshold
over a period of time).
Natural Hazard Layer
- This layer helps in identifying areas based on the levels of climate-related hazards.
6
ICA Areas and Categories
ICA Areas
- Nine ICA areas depict recurrence of vulnerability to food insecurity and natural hazards as an
intersection. These are formed by cross tabulation of Vulnerability to Food Insecurity and
Combined Natural Hazards classifications.
ICA Categories
- Five ICA Categories are formed by combining ICA Areas (e.g., Area 1a and 1b becoming
Category 1). These assist in identifying districts where broad programmatic recommendations
(safety nets, DRR, early warning and disaster preparedness) are required.
Lenses
Landslide Hazard Lens
- Enables focus on specific areas where landslide hazard is high, helping in refining DRR activities
and where additional land stabilization / rehabilitation is required.
GLOF Hazard Lens
- Enables focus on specific areas where GLOF hazard is high, helping to refine DRR activities and
where additional mitigation measures are required.
Earthquake Hazard Lens
- Enables focus on specific areas where earthquake hazard is high, helping to refine and focus
emergency preparedness activities.
Land Degradation Lens
- Land degradation can heighten the impact of natural shocks, and is a major contributor to food
insecurity. This lens shows where efforts are required to halt and reverse land degradation, either
as part of safety nets, DRR or stand-alone programmes and through policy.
Additional Contextual Information
Population Density
- Shows the geographic concentration of population, which may aggravate impacts of natural shocks
and vulnerability to food insecurity.
- Allows for programmes to be targeted more efficiently from resource & logistics perspective.
Land Cover
- Provides insight into how programmatic themes can be adjusted to local land use/livelihood
systems.
Estimated Number of People Vulnerable to Food Insecurity
- Estimates how many people are in need of long-term assistance and how many may need assistance
if vulnerability factor(s) of food insecurity significantly deteriorates by looking at the relative levels
of recurring food insecurity or vulnerability to food insecurity over the past years (minimum of 5
years).

7
2. Vulnerability to Food Insecurity Analysis
Analysis - 4 Provinces
Data Selection Process
ICA food security analysis aimed at assessing how chosen indicator values fluctuated over time against a
defined threshold. Number of times these chosen indicator exceed threshold value are counted for
determining recurrence of high food insecurity. This necessitates the time period to be a minimum of five
years (with a minimum of 3 data points/rounds) in order to effectively determine long-term programming.
Prevalence of Undernourishment (PoU) data at provincial level were initially expected from the parallel
Trend Analysis of HIES data 2001-2014 led by Ministry of Planning Development and Reforms. However,
due to unexpected delays in obtaining the data as well as concerns over the lack of representativeness of
PoU data at district level decision was made to use an alternative indicator.
Consequently, ICA uses Multi-Dimensional Poverty Index (MPI) data as a relevant proxy for vulnerability
to food insecurity. MPI was officially endorsed by the Ministry of Planning Development and Reforms and
UNDP in 2016. It is based on various indicators related to vulnerability to food insecurity. It was collected
as part of Pakistan Social and Living Standard Measurement (PSLM) surveys.
PSLM data was available from 2004/05 through 2014/15, collected once every alternate year. A total of 6
rounds1 were available meeting the minimum data requirements of ICA. This dataset covers 123 districts
of 4 provinces of Pakistan (Khyber Pakhtunkhwa, Sindh, Balochistan and Punjab including Islamabad).
The remaining 33 districts (7 Agencies and 6 Frontier Regions in Federally Administered Tribal Areas -
FATA, 10 districts in Gilgit Baltistan-GB, and 10 districts in Azad Jammu Kashmir- AJK) did not have
MPI data available and are not covered in this analysis.
Methodology
The analysis considered MPI, a composite index comprising 15 indicators capturing dimensions of health, education and standard of living. Mathematically, MPI combines two aspects of poverty:
i. Incidence of poverty (the percentage of people who are identified as multidimensional
poor, or poverty headcount);
ii. Intensity of poverty (the average percentage of dimensions in which poor people are
deprived).
MPI threshold of 0.329 is used to identify districts vulnerable to food insecurity. It is an average of all 652 district-level observations over 6 PSLM rounds. The analysis determined number of times historical MPI values were above the set threshold of 0.329 for each district.
The number of recurrences were then classified in three equal groups (Tercile):
Vulnerability to food insecurity above threshold
Recurrences of MPI > 0.329 0 – 1 2 – 4 5 - 6
Vulnerability to food insecurity reclassification Low (1) Medium (2) High (3)
Results
The maps containing results are on the following page.
1 Report on Multidimensional Poverty in Pakistan. Ministry of Planning, Development & Reforms, in collaboration with Oxford Poverty and Human Development Initiative (OPHI) and UNDP, 2016. Certain districts were not covered in all rounds - for more details, see section 11.

8
Limitations
It should be noted that while the MPI is not a direct indicator of food security outcome although it
comprises of 15 indicators of which 9 have a strong relationship with food access and food utilization.
These are considered as key drivers of food insecurity in the country. Second limitation is the lack of MPI
data in 33 districts as mentioned above.

9
10
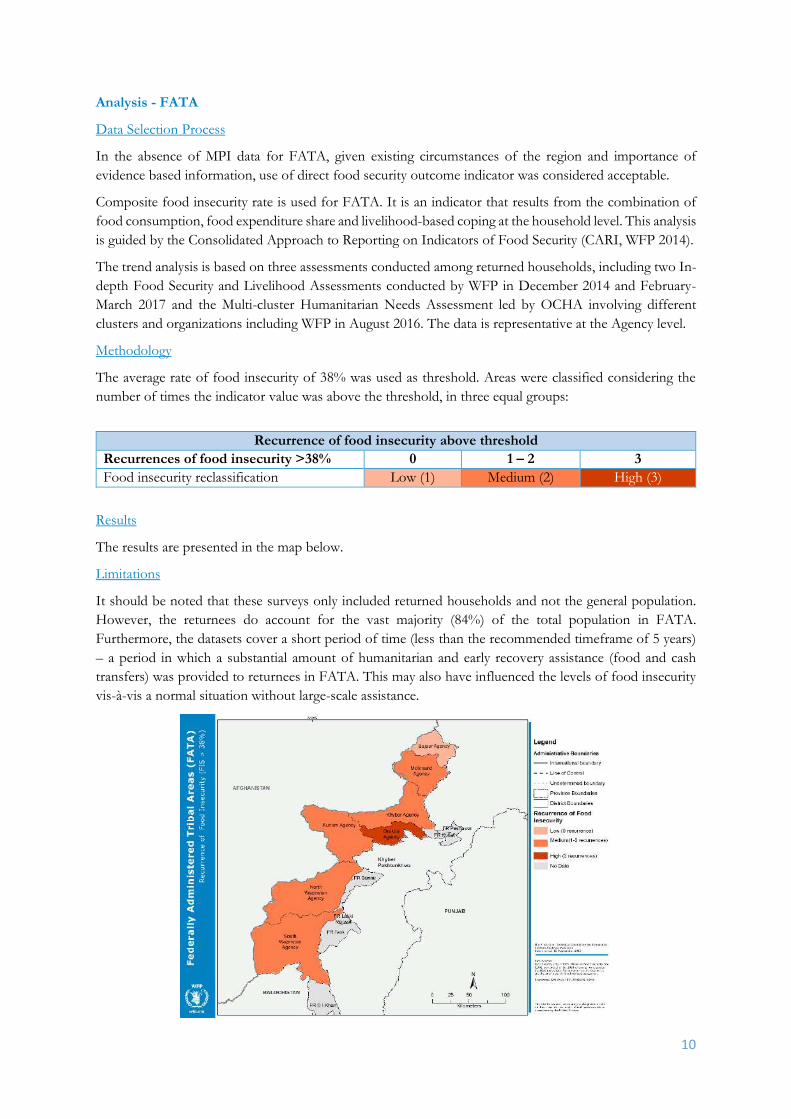
Analysis - FATA
Data Selection Process
In the absence of MPI data for FATA, given existing circumstances of the region and importance of
evidence based information, use of direct food security outcome indicator was considered acceptable.
Composite food insecurity rate is used for FATA. It is an indicator that results from the combination of
food consumption, food expenditure share and livelihood-based coping at the household level. This analysis
is guided by the Consolidated Approach to Reporting on Indicators of Food Security (CARI, WFP 2014).
The trend analysis is based on three assessments conducted among returned households, including two In-
depth Food Security and Livelihood Assessments conducted by WFP in December 2014 and February-
March 2017 and the Multi-cluster Humanitarian Needs Assessment led by OCHA involving different
clusters and organizations including WFP in August 2016. The data is representative at the Agency level.
Methodology
The average rate of food insecurity of 38% was used as threshold. Areas were classified considering the
number of times the indicator value was above the threshold, in three equal groups:
Recurrence of food insecurity above threshold
Recurrences of food insecurity >38% 0 1 – 2 3
Food insecurity reclassification Low (1) Medium (2) High (3)
Results
The results are presented in the map below.
Limitations
It should be noted that these surveys only included returned households and not the general population.
However, the returnees do account for the vast majority (84%) of the total population in FATA.
Furthermore, the datasets cover a short period of time (less than the recommended timeframe of 5 years)
– a period in which a substantial amount of humanitarian and early recovery assistance (food and cash
transfers) was provided to returnees in FATA. This may also have influenced the levels of food insecurity
vis-à-vis a normal situation without large-scale assistance.
11
3. Natural Hazard Analysis
The natural hazard analysis is carried out using floods & drought data. However other natural hazards are
also identified as relevant to the context of the country. They are accordingly considered as core lenses due
to one of the two reasons: 1) they are highly localized events (e.g. landslides, GLOF) and 2) they are events
beyond the scope of disaster reduction and mitigation (e.g. earthquakes).
Data for the two hazards identified for the core dimensions are analysed at district level, as described in the
following section, then combined to create a natural hazard map.
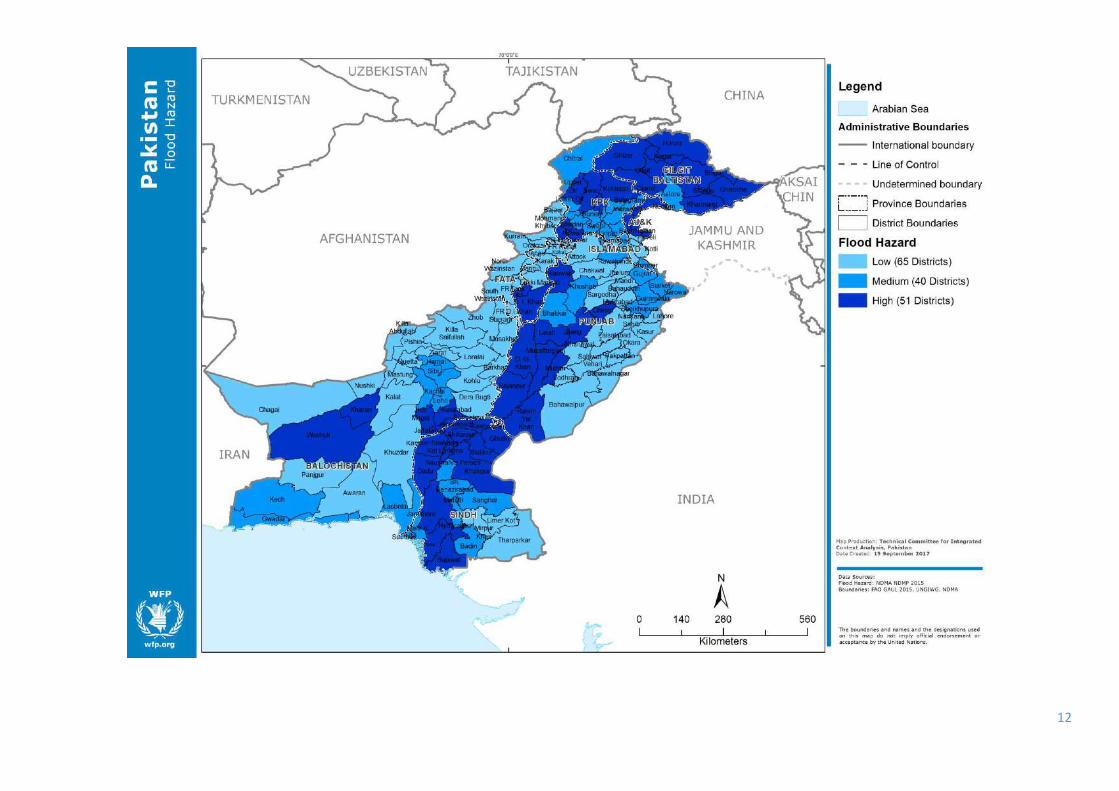
Floods
Data Selection Process
Flood data from the NDMA is identified as the key dataset with adequate coverage for the ICA (minimum
of 20 years of historical records). The data is flood hazard index based on the number of recorded flood
events from 1950 to 2015 and the severity including 2010 super-flood2. The original dataset combined these
two parameters with Jenks Natural Breaks used to classify districts into a 5-point scale of hazard levels.
Methodology
5 levels hazard index is reclassified into a 3-point scale as follows.
Flood hazard
Flood hazard Very Low – Low Medium High – Very High
Flood hazard reclassification Low (1) Medium (2) High (3)
Results
The results are presented in the map on the following page.
Limitations
There are no significant limitations to the dataset selected or methodology used.
2 NDMA & Japan International Cooperation Agency. (2013). The Project for National Disaster Management Plan in the Islamic Republic of Pakistan.
12
13
Drought
Data Selection Process
Drought data was available from three sources: 1) drought hazard index from the NDMA, based on mean
annual rainfall; 2) a drought hazard index from the National Drought Monitoring Centre of the Pakistan
Meteorological Department (PMD) based on SPI data from 1951 to 2010; and 3) an analysis of number of
poor growing seasons from WFP HQs based on satellite Rainfall Estimate data from 1981 to 2015.
The two latter datasets provided a satisfactory historical coverage for the ICA, exceeding the minimum
requirement of 20 years. The results were also found to be in close alignment when compared with each
other. Ultimately, the dataset from the PMD was selected by the Technical Committee, given that: a) it was
based on the longest record of historical precipitation data; b) the data was nationally elaborated and
accepted and c) the methodology and results have been recognized academically and published3.
The selected PMD dataset was based on soil moisture and precipitation data available from 1951 to 2010,
which are used to calculate three parameters: 1) dependency on seasonal (winter/monsoon) rainfall; 2)
drought frequency (using the Standardized Precipitation Index or SPI); and 3) soil moisture.
Methodology
The original dataset was a 5-point scale of hazard level which is reclassified into a 3-point scale as follows.
Drought hazard
Drought hazard Very Low – Low Moderate High – Extremely High
Drought hazard reclassification Low (1) Medium (2) High (3)
Results
The results are presented in the map on the following page.
Limitations
It should be noted that the dataset used for this analysis is observational datasets for precipitation (GPCC) and
remotely sensed for soil moisture (CPC, NOAA) with a spatial resolution of 0.5 degrees (roughly 50km). The GPCC
precipitation is considered one of the best observational gridded data and highly correlated with ground precipitation
data (Becker et al., 2013). In addition, a few districts that do not have PMD data are classified using WFP HQs
dataset as the two datasets are in close alignment.
3 Adnan, S., Ullah, K. & Gao, S. (2015). Characterization of Drought and Its Assessment over Sindh, Pakistan During 1951 - 2010. Journal of Meteorological Research, Vol. 29, No. 5, 837-857.

14

15
Combined Natural Hazards
Methodology
The flood and drought hazard classifications are combined using cross tabulation as shown below. This
methodology gives equal consideration to these two types of hazards and highlights areas that are vulnerable
to both.
Reclassified drought hazard
Reclassified flood hazard Low (1) Medium (2) High (3)
Low (1) Very Low (2) Low (3) Moderate (4)
Medium (2) Low (3) Moderate (4) High (5)
High (3) Moderate (4) High (5) Very High (6)
Combined hazard
Combined natural hazard score 2 - 3 4 5 - 6
Combined hazard reclassification Low (1) Medium (2) High (3)
Results
The results of the analysis are presented in the map on the following page.

16

17
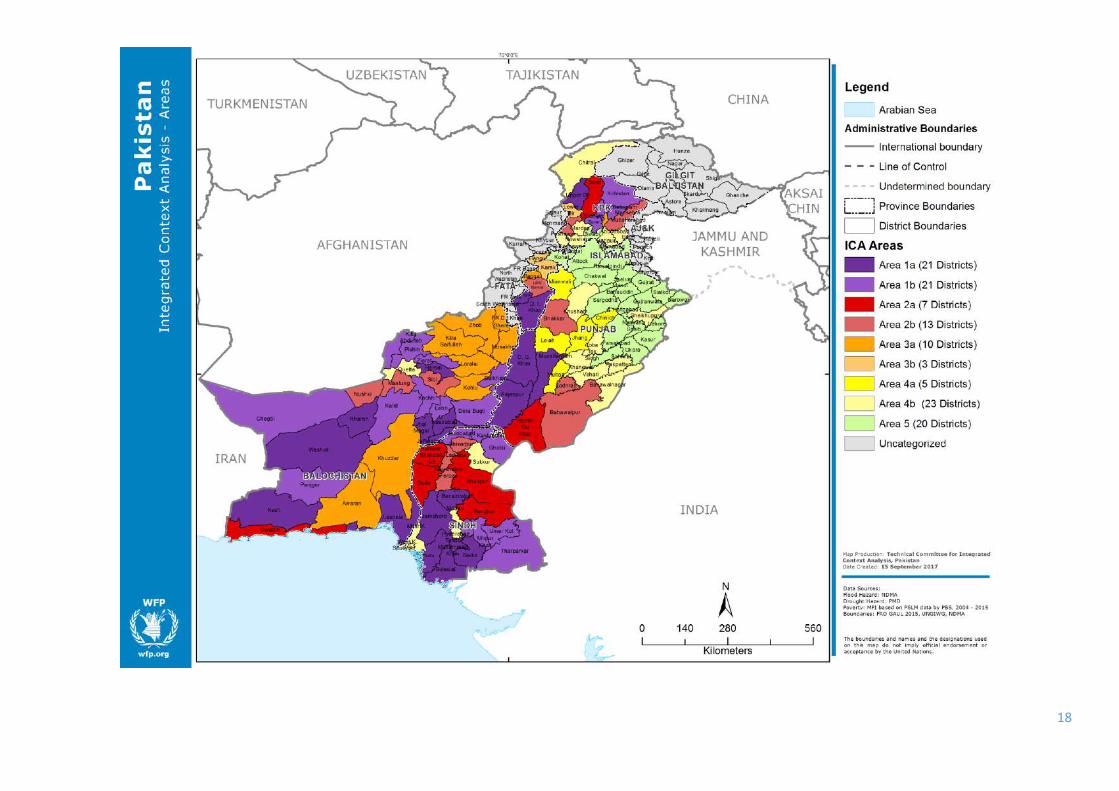
4. ICA Areas
Methodology
The ICA areas map is created by combining three-point scale results for vulnerability to food insecurity and
combine natural hazard shown in the previous sections. The high/medium/low values of two dimensions
are cross-tabbed, producing nine areas shown in the table below.
Results The results for FATA are presented in the map below, followed by the results for each district of the four
provinces on the following page.
Combined
level of natural
hazards
Recurrence of vulnerability to food insecurity above threshold
Low Medium High
Low Area 5 Area 3B Area 3A
Medium Area 4 B Area 2 B Area 1 B
High Area 4 A Area 2 A Area 1 A
18

19
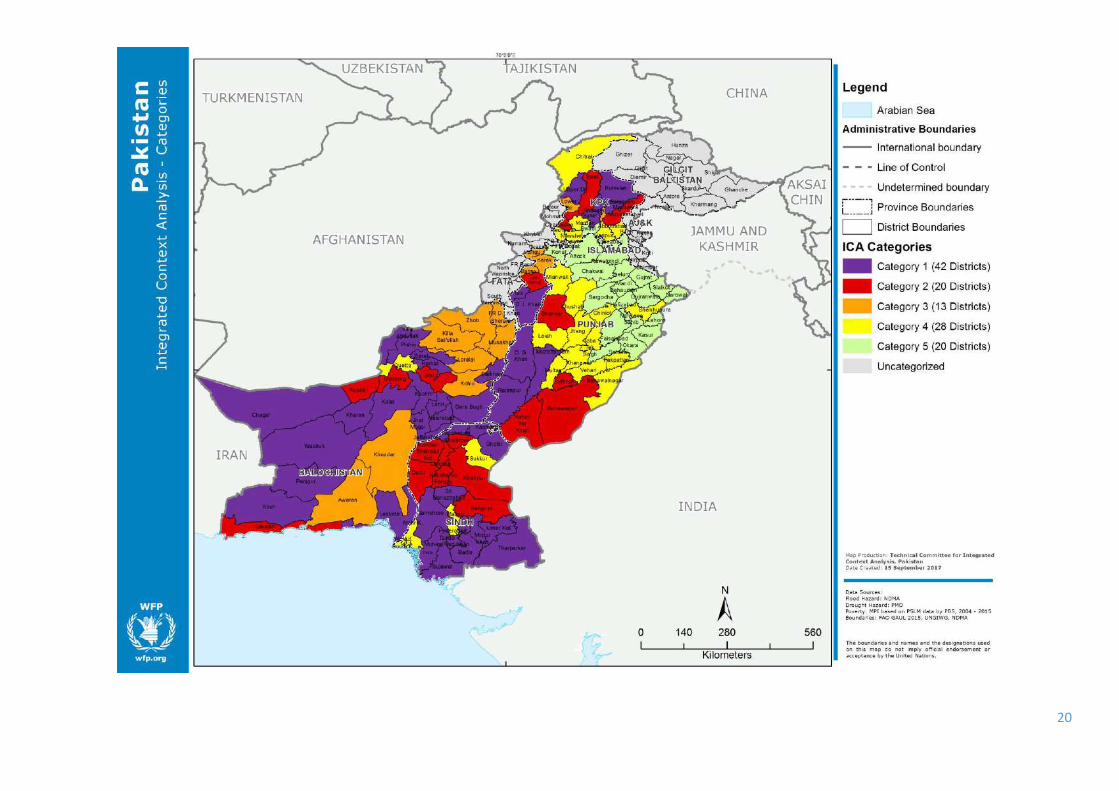
5. ICA Categories
Methodology ICA categorises the country’s districts into Categories 1 to 5 based on their levels of recurring vulnerability
to food insecurity and combined natural hazard. This is done by combining ICA Areas to form five
Categories as shown in the table below. The ICA Categories and Areas provide evidence for broad
programmatic strategies.
Results The results are presented on the following maps.
20

21
6. ICA Lenses
Beside flood and drought (Core Dimensions) other natural hazards are considered as ICA lenses. Lenses
provide information to refine broad programmatic strategies by overlaying each lens on top of the ICA
Areas. For example, the landslide hazard lens can be used to pinpoint areas where landslide hazard needs
to be addressed through DRR programming.
Landslide Hazard Data Selection Landslide data is obtained from the NDMA in the form of a landslide hazard index. The dataset is based
on the number of recorded landslide events from 1950 until 2015, and the physical vulnerability to
landslides (slope, soil type, mean annual rainfall). The original dataset is a 5-point scale of hazard levels
ranging from very low to very high.
Results On top of the ICA Areas, high & very high levels of landslide hazard are mapped in order to highlight areas
where landslides present an additional natural shock.
GLOF Hazard Data Selection Glacial Lake Outburst Flood (GLOF) data is obtained from the NDMA in the form of a hazard index. The
dataset is based on the number of glacial lakes from 1950 to 2015. The original dataset is a
5-point scale of hazard levels ranging from very low to very high.
Results On top of the ICA Areas, high & very high levels of GLOF hazard are mapped in order to highlight areas
where this hazard presents an additional natural shock.
Limitations It should be noted that the hazard is not based on historical record of events given their relatively rare occurrence. However, it effectively captures the areas likely to be affected due to climate change leading to the formation of glacial lakes or glacier melting. Earthquake Hazard Data Selection Earthquake hazard data is obtained from the NDMA in the form of an earthquake hazard index. The
dataset is based on seismic zoning as well as the number of recorded earthquake epicentres with a magnitude
greater than 4 between 1905 and 2015 recorded by PMD. The dataset is a 5-point scale of hazard levels
ranging from very low to very high.
Results On top of the ICA Areas, high & very high levels of earthquake hazards are mapped in order to highlight
where earthquakes present an additional natural shock.
Limitation It should be noted that both instrumentation and the scale used for measuring the intensity of earthquakes
have changed over time resulting into possible variations due to conversions and standardizations.

22

23

24

25
Land Degradation
Data Selection
In the absence of national land degradation datasets, it is decided to use global proxy analyses collected by
WFP HQs. The possibility of implementing the FAO methodology for Land Degradation Assessment in
Drylands (LADA) was considered, but the timeline necessary for primary data collection and analysis was
determined to be too lengthy for the current ICA.
Methodology
Two indicators are used as proxies to assess land degradation – the first is negative land cover change. This
analysis is performed using remotely sensed land cover data for 1992 and 2015 from the European Space
Agency (ESA), with 300m resolution. Land cover classes in the original dataset are assigned ordinal
ecological values based on their relative ability to offer ecosystem services. The difference in ecological
values between 1992 and 2015 is then calculated for each pixel, and values are aggregated to the district
level to understand the overall trend in each district.
Second is the soil erosion propensity that emerges from a simplified version of the Revised Universal Soil Loss
Equation (RUSLE). This methodology is widely accepted amongst the scientific community for estimating
soil loss and is recognized for providing a good approximation of the real erosion dynamics in normal
conditions. The analysis elaborated for the ICA considers data on rainfall incidence (WorldClim), soil
lithology (FAO), land cover (NASA MODIS) and slope length (calculated in SAGA-GIS using NASA
SRTM digital elevation model) to produce an estimate of potential soil loss in tons/ha per year with a spatial
resolution of 500m. All soil loss of 5 tons/ha per year or greater is considered as significant, as it is possible
for soil loss below this rate to be replenished through natural soil generation. The percentage of surface
area in each district that experiences this level of erosion propensity is calculated.
The percentage of surface area where erosion is estimated to be 5 tons/ha per year or greater is calculated,
and the distribution of values classified according to Jenks Natural Breaks as follows: Low (< 20%),
Medium (20 – 34.9%), High (35 – 50%) and Very High (> 50%). The three highest classes were mapped
given that they represent districts where the percentage of area affected is more or less greater than the
national extent of erosion-affected areas4.
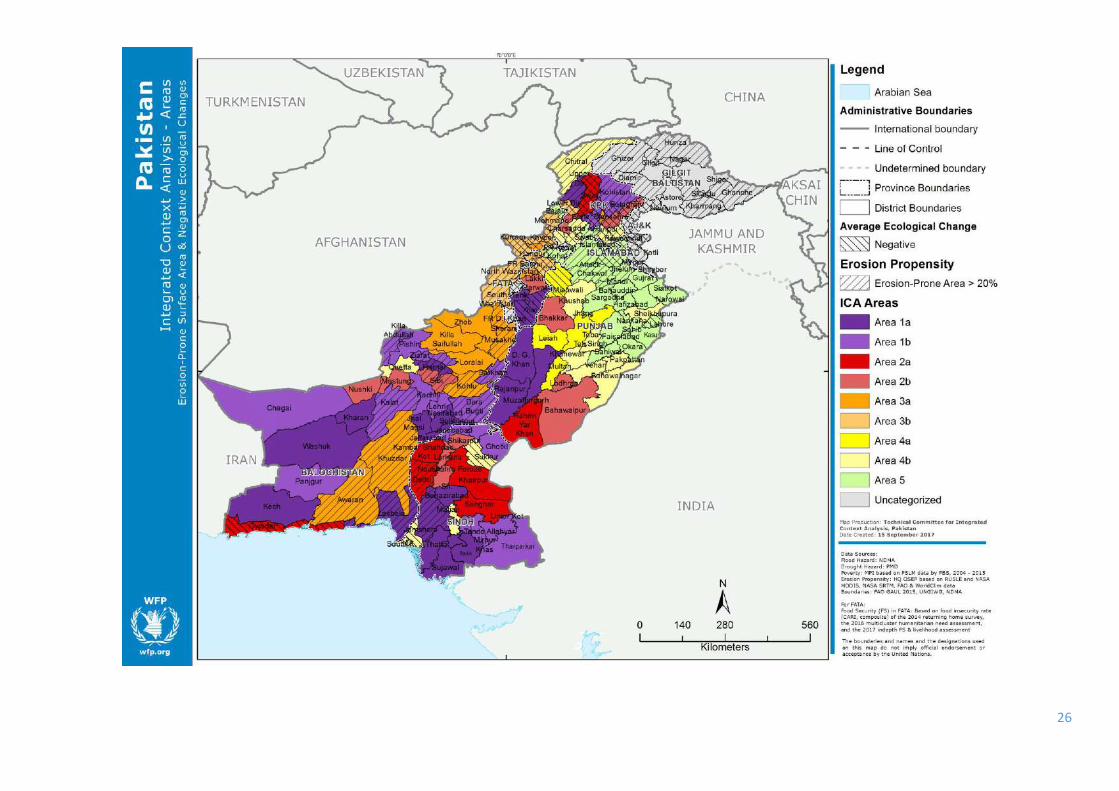
Results On top of the ICA Areas, negative ecological change are mapped, as well as those with an extent of erosion-
prone surface area greater than the national extent (roughly 20%).
The final map highlights where these different land degradation problems are present and where they
coincide.
Limitations It should be noted that the two datasets considered do not capture all types of land degradation (e.g.
salinization, soil fertility decline, etc.). The negative land cover change is a proxy for vegetation loss and
decline in ecosystem function, but yields only qualitative dimensional results. Furthermore, it assigns values
to certain land cover classes which should be locally verified. Lastly, the resolution of the data limits its
ability to capture small-scale changes.
The soil erosion propensity analysis is likewise limited in its resolution of 500m. Moreover, the analysis provides only an estimate of the potential soil loss, in tons/ha per year, since data on the protective factor (i.e. the effect of mitigating infrastructure which reduces soil loss) is not available.
4 FAO, UNDP & UNEP (1994); Shah & Arshad (2006). Land Degradation in Pakistan: A Serious Threat to Environments
and Economic Sustainability. Retrieved from
26

27
7. Additional Contextual Information
The maps and charts in this section provide additional contextual information related to livelihood activities
and population, which can help in further refining the broad programmatic strategies using additional
details.
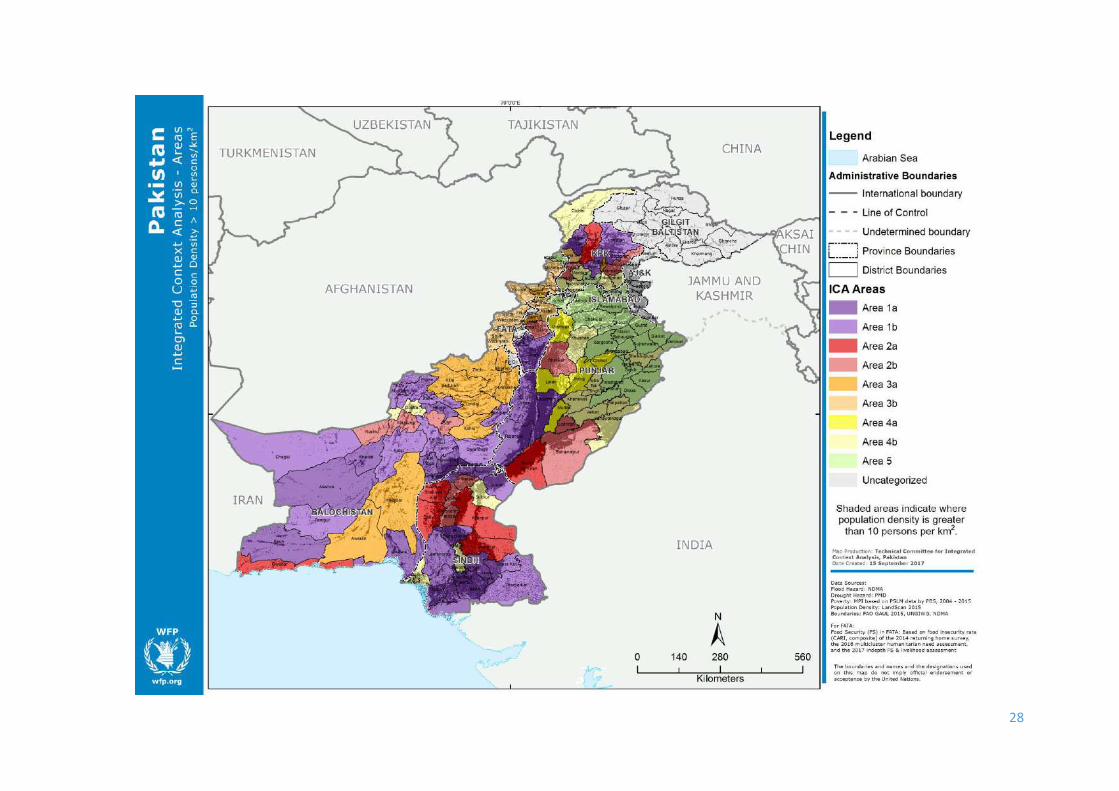
Population Density Data Selection Population density from the Landscan global dataset 2015 is used. Results Population density greater than 10 persons per square kilometre is overlaid on ICA Areas to highlight
districts with relatively higher population density.
Limitations It should be noted that the LandScan is a global dataset that estimates the likely distribution of population
based on land cover, roads, slope, village locations, etc. It is therefore not based on actual population census
data.
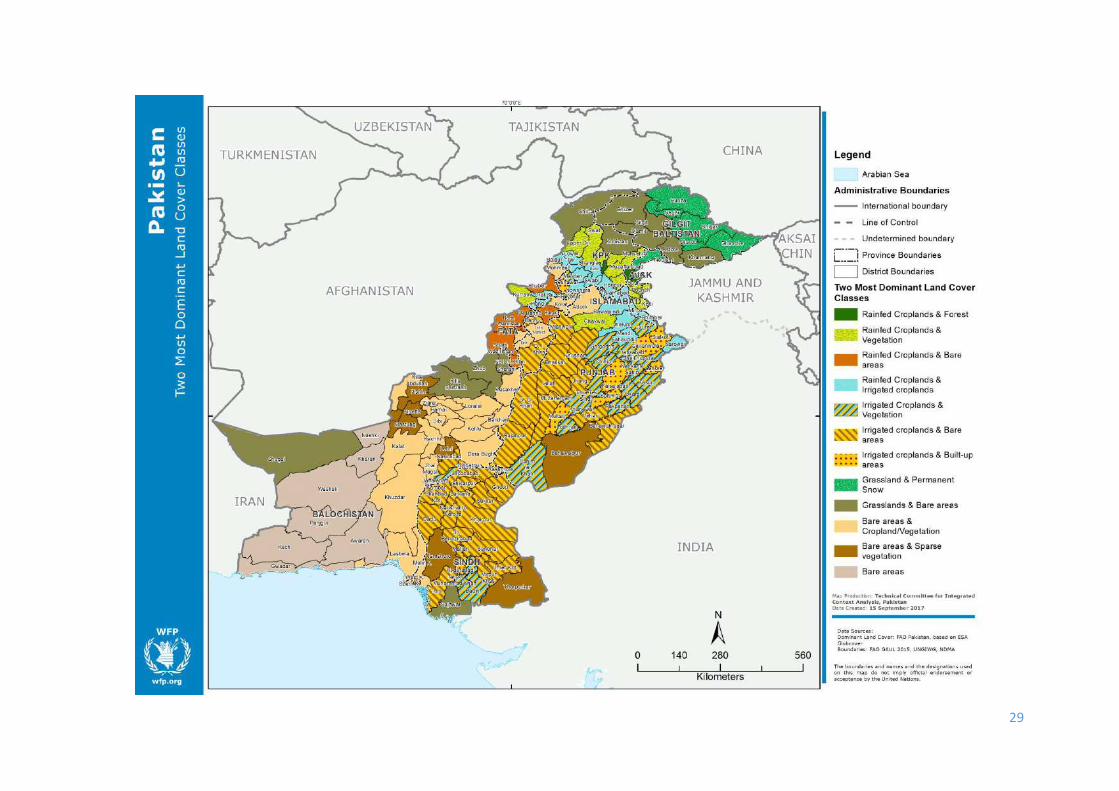
Dominant Land Cover Data Selection
In the absence of complete and updated livelihood zoning information, an understanding of dominant land
cover can highlight important areas for agriculture (and potentially pastoralism). This helps to contextualize
how natural hazards may impact households and can help identify programming interventions.
Given that the current ICA is performed using the district as the unit of analysis, it is decided to identify
two dominant land cover class to make the results easier for comparison with ICA Categories and other
results. The land cover used is sourced from ESA GlobeCover 2009 and analysed by FAO Pakistan. The
original dataset of land cover with 300m resolution is mapped as shown in the map below.
Detailed land cover classification data for four provinces of Pakistan is also available from SUPARCO
Pakistan and utilized for triangulation, but due to the unavailability of the data for the whole country, ESA
GlobeCover 2009 is used for the ICA.
Methodology Spatial calculations are performed to obtain the area under each land cover class for each district. Based on
the results, land cover classes are ranked, and the first and second most dominant land cover classes are
identified (i.e. the classes covering the largest areas in each district). The combinations of two most
dominant land cover classes are simplified and grouped to make the map more user-friendly, and to
highlight key combinations of importance (presence of irrigated and/or rainfed croplands)
Results Two most dominant land cover classes by district are shown in the map below.
Limitations It should be noted that the analysis does not consider the order of the two most dominant land cover
classes, in order to produce a simpler and more user-friendly map. Furthermore, it should be considered
that many other factors (e.g. size of land-ownings) influence livelihoods, in addition to the land cover/land
use type.
28
29

30
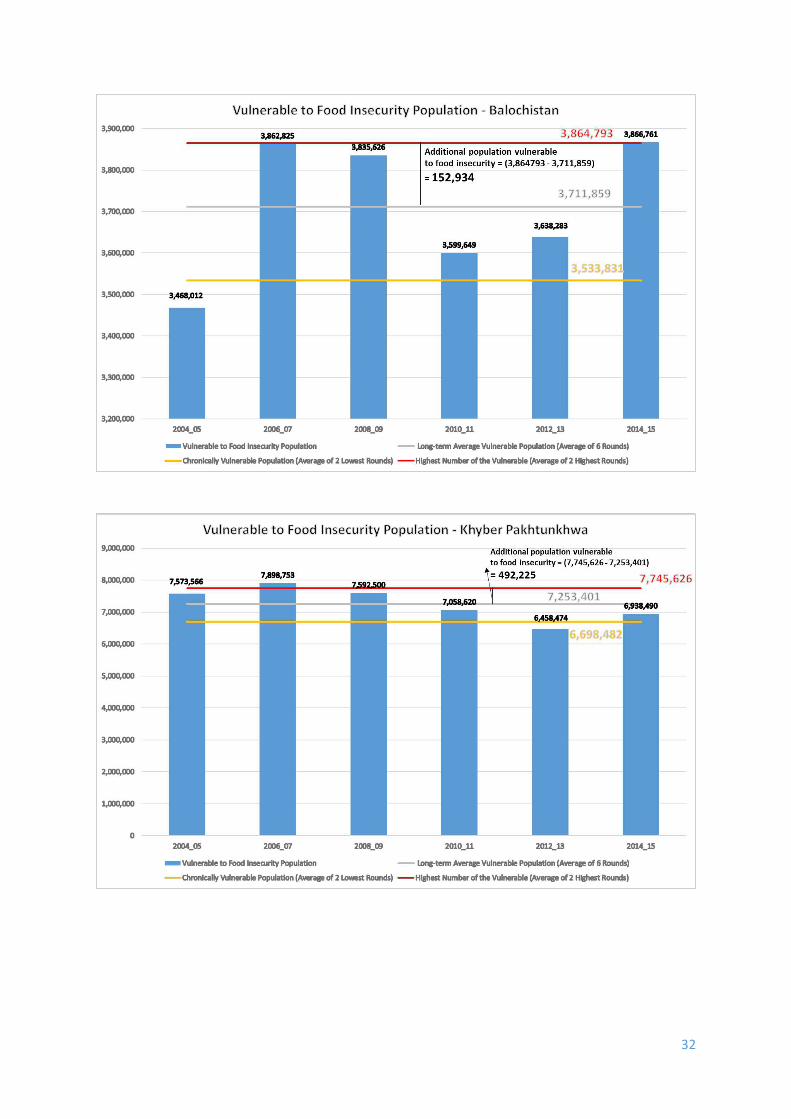
8. Estimated Numbers of People Vulnerable to Food Insecurity
A broad understanding of the estimated number of people vulnerable to food insecurity in the past
reference period would help in preparedness planning and programming relevant responses.
Analysis of Four Provinces
Data Selection
To calculate, number of people vulnerable to food insecurity was estimated from 2004/05 to 2014/15
using the MPI (incidence and intensity). Population figures were obtained for the years corresponding to
each round of MPI, from the Provincial Bureaux of Statistics.
The lowest numbers (in yellow) and the highest numbers (in red) are highlighted:
Estimated Population Vulnerable to Food Insecurity from 2004 to 2015
2004/05 2006/07 2008/09 2010/11 2012/13 2014/15
41,612,849 41,886,595 41,271,435 38,097,610 36,419,188 36,452,918
Methodology
The overall average of number of people estimated as vulnerable to food insecurity over the last twelve
years (39,290,099) is calculated to provide an idea of the historical situation. Given that the numbers of
multi-dimensionally poor people, i.e. people vulnerable to food insecurity, have not varied much over this
period (there has been a decrease of about 5 million), the average gives a broad indication of the vulnerable
population in the country.
In Pakistan, there has consistently been a certain number of people who are multi-dimensionally poor and
thus vulnerable to food insecurity, irrespective of improvements in MPI indicators in the last twelve years.
To estimate population in this category, the average of the two lowest figures recorded over the recall period
(36,436,053) is calculated. For planning purposes, this figure can reflect an estimate of those chronically
vulnerable to food insecurity.
The difference between the averages of the two highest figures recorded over the recall period (41,749,722)
and the overall average above reflects the estimated number of additional people who were multi-
dimensionally poor should some MPI dimensions significantly deteriorated (2,459,623). This number of
people can provide a rough figure for preparedness planning in case of a relatively normal fluctuation or
deterioration of MPI dimensions, but is not meant as a forecast for a defined period in the future.
Limitations
It should be noted that these figures encompass only the population of four provinces where the PLMS
was conducted, and does not include the population in AJK, FATA or Gilgit Baltistan. Furthermore, the
figures presented refer to people vulnerable to food insecurity as opposed to food insecure population,
given the use of the MPI as a proxy for food insecurity.
The ICA is not intended to be a statistical analysis and hence, its estimation methods and figures should be
simple, easily understood by non-statisticians/non-technical people. In the interest of keeping the analysis
simple, the ICA applies a simple averaging technique to calculate the overall long-term average of all
historical datasets.
It should also be noted that the analysis of historical averages may not necessarily provide precise future
estimates of people vulnerable to food insecurity, as there have been clear declining trends witnessed at
the national level and in Punjab province, This unusual trend in ICA Pakistan had been noted well by the
analysts which is mostly due to the fact that because of lacking a direct food security outcome indicator
(e.g. Prevalence of Undernourishment), the MPI – a proxy on vulnerability to food insecurity is used here.

31
As widely recognized, the relationship of natural hazards with poverty is not as strong as with food
insecurity.
Results In summary, planning estimates are as follows:
Long-term average: average number of population vulnerable to food insecurity from
2004 to 2015 39,290,099
Chronically vulnerable: of the above, estimated number of people chronically vulnerable
to food insecurity 36,436,053
In case of deterioration of MPI dimensions: estimated number of people who were
vulnerable to food insecurity when some MPI dimensions significantly deteriorated 41,749,722
Preparedness planning: in addition to the above long-term average number, additional number
of people vulnerable to food insecurity when some of the MPI dimensions significantly
deteriorated
2,459,623
It is essential to note that these are just planning estimates and that actual numbers should be derived from emergency assessments in the event of a crisis and that plans should be adjusted throughout the programming cycle based on future assessments that reflect the current situation.
The results are also presented as histogram below.
32

33
34
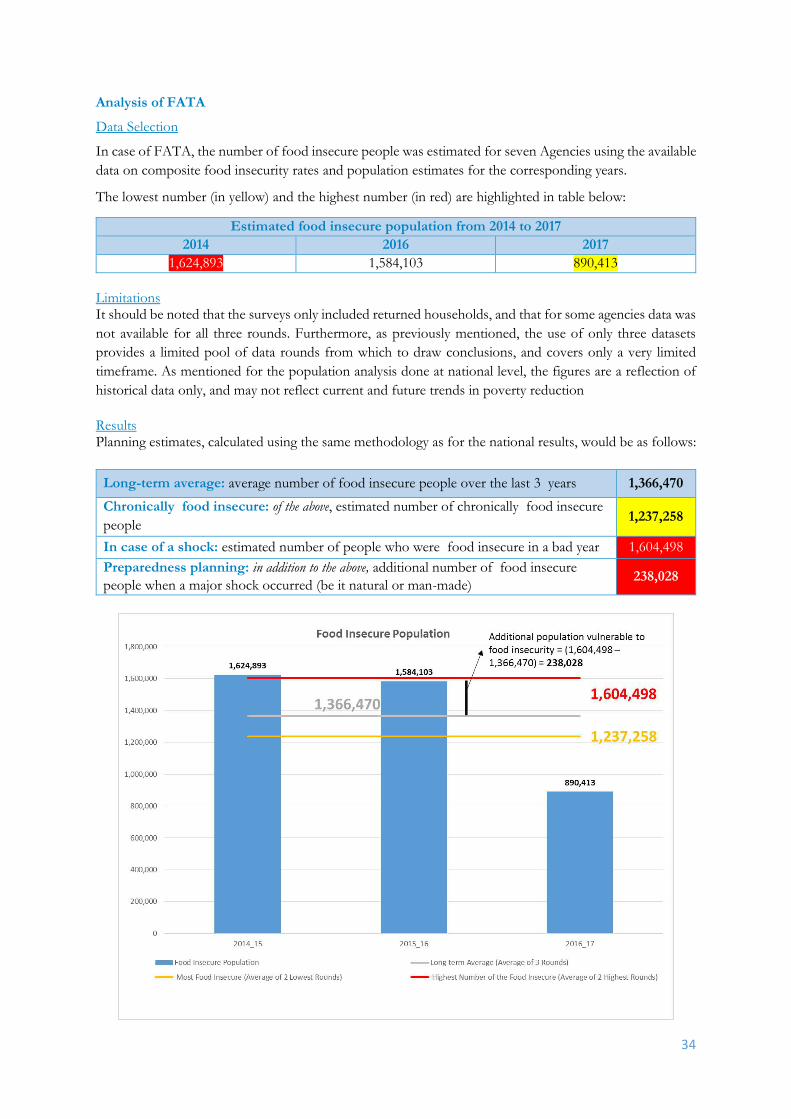
Analysis of FATA
Data Selection
In case of FATA, the number of food insecure people was estimated for seven Agencies using the available
data on composite food insecurity rates and population estimates for the corresponding years.
The lowest number (in yellow) and the highest number (in red) are highlighted in table below:
Estimated food insecure population from 2014 to 2017
2014 2016 2017
1,624,893 1,584,103 890,413
Limitations It should be noted that the surveys only included returned households, and that for some agencies data was
not available for all three rounds. Furthermore, as previously mentioned, the use of only three datasets
provides a limited pool of data rounds from which to draw conclusions, and covers only a very limited
timeframe. As mentioned for the population analysis done at national level, the figures are a reflection of
historical data only, and may not reflect current and future trends in poverty reduction
Results Planning estimates, calculated using the same methodology as for the national results, would be as follows:
Long-term average: average number of food insecure people over the last 3 years 1,366,470
Chronically food insecure: of the above, estimated number of chronically food insecure
people 1,237,258
In case of a shock: estimated number of people who were food insecure in a bad year 1,604,498
Preparedness planning: in addition to the above, additional number of food insecure
people when a major shock occurred (be it natural or man-made) 238,028

Part - II: Programmatic Recommendations

36

37
38
9. ICA Programmatic Implication
Aim of ICA is to help identify areas where broad long-term programmatic strategies to support food insecure and
vulnerable population are to be positioned. These will complement and protect the underlying long-term development
trajectory present in a country. It informs where to focus ‘geographically’ different combinations of selected
programmatic themes aiming to lift the most vulnerable out of food insecurity, reduce the risks from climate-related
natural shocks, protect development gains and enable further progress. The ICA advocates tailoring support linking
humanitarian and development efforts in ways that make the most sense according to unique geographical contexts.
ICA uses a consultative process with partners, firstly to validate the technical findings followed by discussions to
identify the most appropriate, broad programmatic strategies in specific geographical areas, including where to
position safety nets, disaster risk reduction (DRR), early warning and preparedness. These involve local partner
consultations and participation in the analytical and interpretative processes so that findings reflect collective
knowledge and experience. As part of the Three-Pronged Approach (3PA), which strengthens the design, planning
and implementation of longer-term and emergency programmes, ICA also indicates where to conduct Seasonal
Livelihood Programming (SLP) consultations to populate the broad ICA programmatic strategies with specific
activities and which inform Community-based Participatory Planning (CBPP) processes.
This report summarises results of ICA stakeholder consultations in the country that discussed programmatic
implications of the ICA findings described in Part I of this report.
10. Future Directions for ICA and Related Work in Pakistan Launch of core ICA in Pakistan is a starting point for further efforts. ICA Steering and Technical Committees
recommend and support the following actions:
1. Use of ICA to support programming decisions by the Government of Pakistan, its agencies, ministries,
departments, provincial authorities, UN agencies, humanitarian and development actors including
international and national NGOs.
2. NDMA, WFP and relevant partners to further collaborate in planning and implementing Seasonal Livelihood
Programming (SLP) in identified more vulnerable districts of Pakistan. SLP should accrue strong engagement
and commitment from other national, provincial and international actors. It will help specify strategic themes
identified in ICA with concrete activities by spelling out who is doing what, when, where and how – in terms
of both livelihood and food security interventions in targeted districts.
3. NDMA and WFP to explore and plan implementation of ICA+ to analyse additional stressors related to
livelihood, nutrition, climate change and capabilities or resources required. Subject to data availability, ICA+
will provide additional data layers to be overlaid on Areas/Categories of ICA 2017. ICA+ will provide further
information to broaden and refine programme themes, prioritise potential work and advocate additional
resources needed.
4. NDMA will maintain ownership of ICA and with ongoing support from WFP, will plan an update of ICA
on periodic basis in 2019 and 2021 as well as, when important new data becomes available (e.g. census data,
new PSLM).
5. ICA stakeholders to advocate for stronger data collection in areas where there are gaps (e.g. MPI or food
security data for Gilgit Baltistan, AJ&K, FATA and Frontier Regions) so that future ICA can have full
countrywide coverage.
11. Programmatic Themes Relevant to ICA
Safety Nets
A safety net is a programme approach that provides predictable, reliable, and consistent assistance over
time to people in need, allowing them to factor this assistance in their own planning and risk-taking

39
decisions as they move toward self-reliance. Safety nets can take different forms and tackle different
objectives depending on the context, e.g. protective-only, shock-responsive or productive.
Disaster Risk Reduction (DRR)
Disaster risk reduction is a theme that includes all efforts to reduce disaster risk, typically focusing on either
exposure or vulnerability. In the setting of the ICA disaster risk refers to the risk posed by climate-related
natural shocks, but of course there are other causes of disasters. DRR efforts may be long or short term.
The nexus between recurrent shocks, persistent high levels of food insecurity, malnutrition and land
degradation may guide a combination of climate adaptation, DRR and safety nets to support resilience.
Early Warning
Early warning may target a variety of audiences, from policy makers to individual households. In the ICA,
early warning refers to warning of impending climate-related natural shocks. The key elements are that
warning precedes a shock, and is intended to trigger some form of immediate action to reduce shock risk.
Thus, early warning is often closely tied to preparedness, and is a component of DRR.
Preparedness
Preparedness is a DRR theme that refers to plans and actions that precede a climate-related natural shock
event and reduce the risk and/or impact it poses. Preparedness can be implemented nationally, regionally,
within organisations or at the community or household level; all aspects are important. Because
preparedness exists in the period before a shock event, preparedness systems are often linked to early
warning.

40
12. Programmatic Themes Derived From ICA Areas and Categories
ICA classifies districts into 5 Categories based on their levels of recurring vulnerability to food insecurity
and exposure to natural climate-related hazards. ICA Categories and Areas, mapped on next page, provide
evidence to inform discussions and selection of broad programmatic strategies using thematic building
blocks of safety nets, DRR, early warning and disaster preparedness.
Combined
level of
natural hazards
Recurrence of vulnerability to food insecurity above threshold
Low Medium High
Low Area 5 Area 3B Area 3A
Medium Area 4 B Area 2 B Area 1 B
High Area 4 A Area 2 A Area 1 A
Category 1
Persistent vulnerability to food insecurity suggests that safety nets providing predictable
support to vulnerable populations may be appropriate, whilst high shock risk justifies
including DRR, including early warning and preparedness themes.
Category 2
Intermittent vulnerability to food insecurity patterns may be related to either shocks
(natural or man-made) or seasonal factors. If seasonal, safety nets can reduce predictable
food insecurity; if shocks are a cause, a recovery focus may be suitable. At the same
time, high shock risk argues for DRR including early warning and preparedness.
Category 3
Districts identified as Area 3A show persistent vulnerability to food insecurity that can
justify safety nets; Area 3B districts are more likely linked to seasonal factors where
safety nets may also be applicable, or shocks where recovery is more of a focus. Whilst
natural shock risk is lower, local contexts may benefit from early warning/ preparedness
to reduce risk from possible events.
Category 4
In the absence of a clear long-term vulnerability to food insecurity entry point (noting
that pockets of food insecurity may exist), DRR including early warning / preparedness
is a priority. Further, attention should be paid to land degradation given that this could
worsen future shocks, potentially impacting food security.
Category 5
In the absence of a clear long-term vulnerability to food insecurity entry point (noting
that pockets of food insecurity may exist) programme themes should concentrate on
DRR to a level justified by the risk. This can include ensuring appropriate early
warning/disaster preparedness relative to risk, as well as mitigating land degradation and
other risk reduction measures.
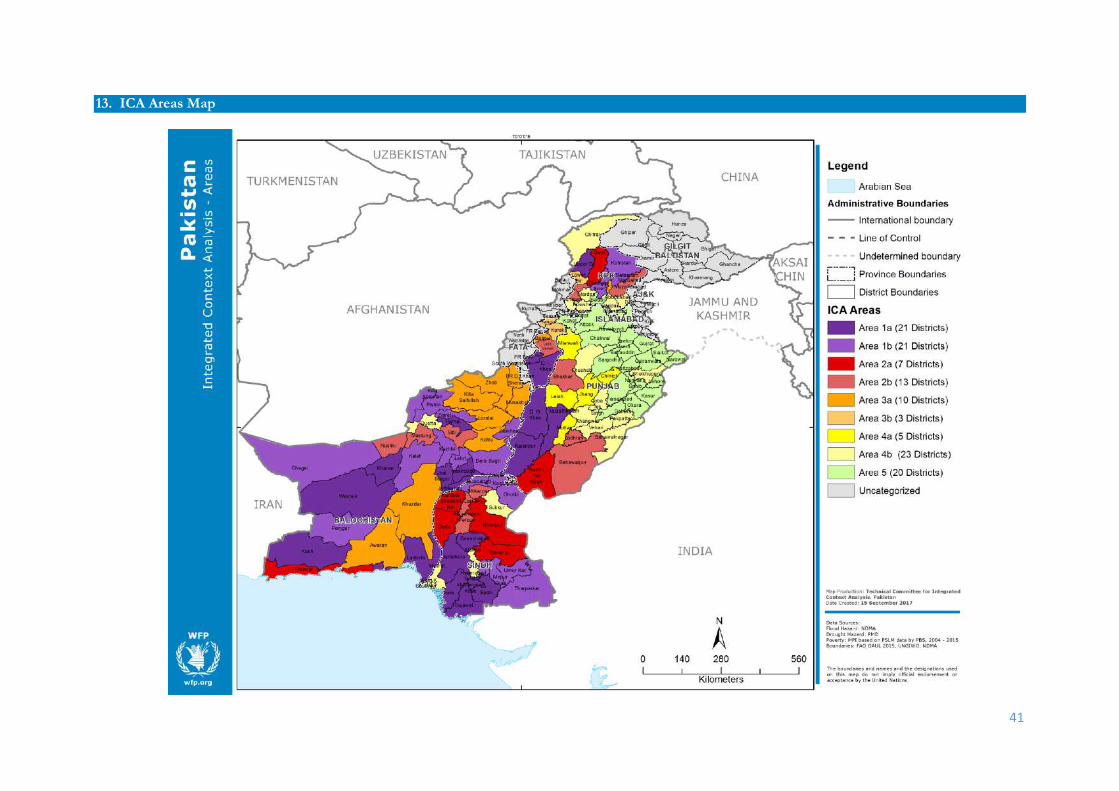
41
13. ICA Areas Map
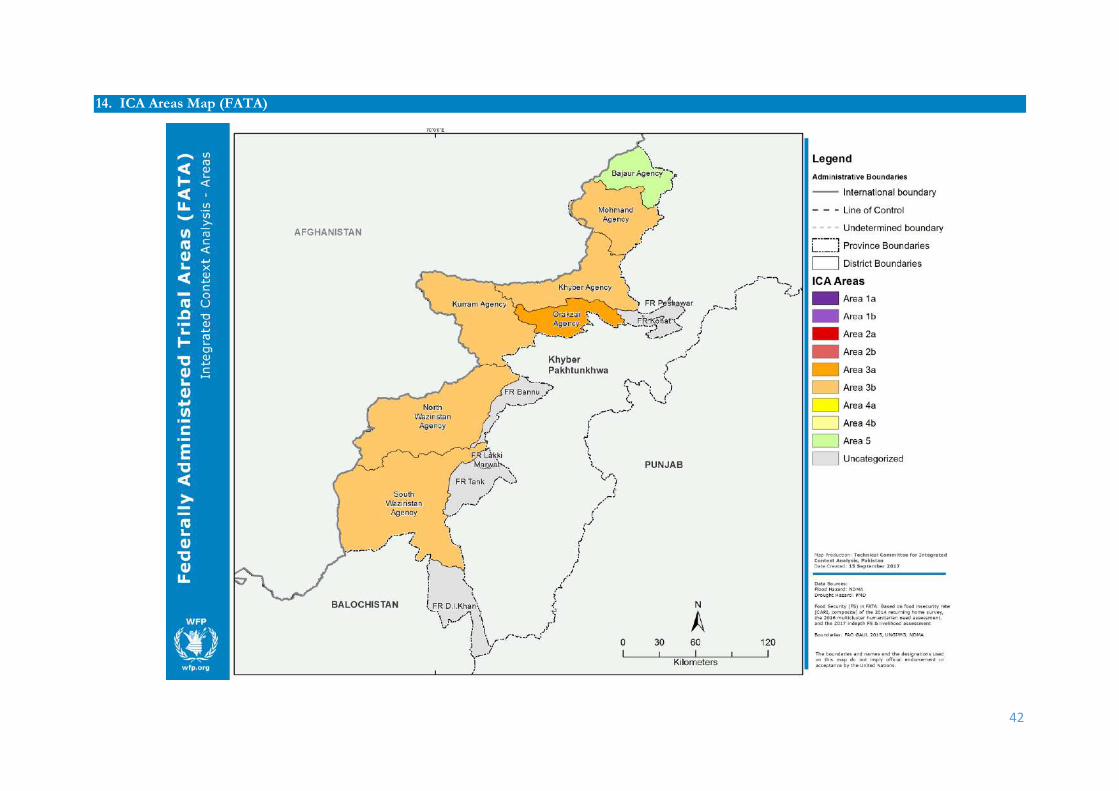
42
14. ICA Areas Map (FATA)

43
15. Category 1: Year Round Food Security Safety Nets and Broad DRR
Category 1 areas show high recurrence of
vulnerability to food insecurity above the
threshold over the past reference period
and face high or medium levels of
natural hazards.
Persistent vulnerability to food insecurity
suggests that safety nets providing
predictable support to vulnerable
populations may be appropriate, whilst
high shock hazards justify broad
(comprehensive) DRR including
infrastructure improvement, early
warning and disaster preparedness. Combined
level of natural hazards
Recurrence of vulnerability to food insecurity above threshold
Low Medium High
Low Area 5 Area 3B Area 3A
Medium Area 4B Area 2B Area 1B
High Area 4A Area 2A Area 1A
Districts in Category 1 are primarily concentrated in southwestern and central Balochistan, southeastern
Sindh, southwestern Punjab and northern Khyber Pakhtunkwha (KP). These areas are characterised by
recurrent vulnerability to food insecurity and high or medium natural hazards. These areas would benefit
from combinations of food security focused safety nets and comprehensive disaster risk reduction (DRR)
interventions.
Vulnerability to food insecurity is consistent, throughout the year as well as across years, in most districts.
This suggests that year-round safety net5 approaches will be most relevant in helping people to move toward
greater resilience. Consistent, predictable support throughout the year will enable people to incorporate
these resources into household planning and thus optimise their own investments into livelihood activities.
Furthermore, safety net approaches will protect against negative coping strategies that can include selling
off personal and livelihood assets. These actions although satisfy short-term necessities yet can set back
development progress.
Disaster risk reduction efforts can include physical measures to reduce risk, as well as early warning and
emergency preparedness. DRR should concentrate on reducing the risk posed by floods in Category 1
districts in southeastern Sindh, southwestern Punjab, all Category 1 districts in KP and several districts of
Balochistan. There may be opportunities to build dry-season DRR efforts to reduce monsoon flood risk
into longer-term food security programming and adding a productive component to safety nets, as
discussed above.
Drought risk in Category 1 areas is highest across western and eastern Balochistan, southern Sindh,
southern KP and Muzaffargarh district in Punjab. These districts would benefit most from related DRR,
and again, there may be opportunities to embed DRR efforts into productive safety nets. Areas where high
flood and drought hazards overlap warrant special focus.
Core lens analysis shows negative land cover change and districts significantly prone to soil erosion such
as Battagram, Shangla and Upper Dir in KP. These factors can worsen flood risk therefore addressing them
should be included in DRR. In other Category 1 areas such as Kohistan in KP and a number of districts
across central Balochistan land cover change is less critical but erosion remains a significant concern. GLOF
and landslides are a significant concern in Upper Dir and Kohistan of KP. Lastly, DRR should also address
seismic risk in Category 1 districts in northwest and central Balochistan, as well as KP.
5 Although some participants during National consultation perceived that in Jaffarabad and Jhalmagsi (Balochistan) and all Category 1 districts in Sindh aside from Badin, flexible safety nets targeting lean seasons would be more appropriate due to food gaps that follow agricultural cycle patterns.
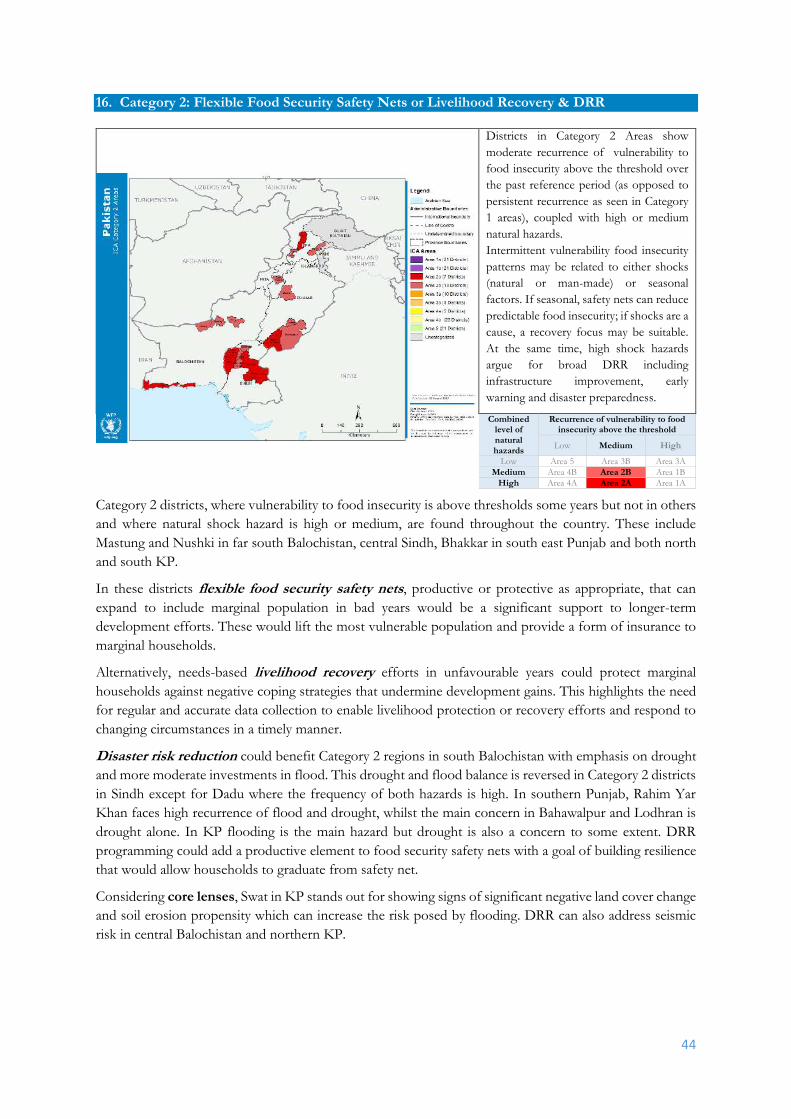
44
16. Category 2: Flexible Food Security Safety Nets or Livelihood Recovery & DRR
Districts in Category 2 Areas show
moderate recurrence of vulnerability to
food insecurity above the threshold over
the past reference period (as opposed to
persistent recurrence as seen in Category
1 areas), coupled with high or medium
natural hazards.
Intermittent vulnerability food insecurity
patterns may be related to either shocks
(natural or man-made) or seasonal
factors. If seasonal, safety nets can reduce
predictable food insecurity; if shocks are a
cause, a recovery focus may be suitable.
At the same time, high shock hazards
argue for broad DRR including
infrastructure improvement, early
warning and disaster preparedness.
Combined level of natural hazards
Recurrence of vulnerability to food insecurity above the threshold
Low Medium High
Low Area 5 Area 3B Area 3A
Medium Area 4B Area 2B Area 1B
High Area 4A Area 2A Area 1A
Category 2 districts, where vulnerability to food insecurity is above thresholds some years but not in others
and where natural shock hazard is high or medium, are found throughout the country. These include
Mastung and Nushki in far south Balochistan, central Sindh, Bhakkar in south east Punjab and both north
and south KP.
In these districts flexible food security safety nets, productive or protective as appropriate, that can
expand to include marginal population in bad years would be a significant support to longer-term
development efforts. These would lift the most vulnerable population and provide a form of insurance to
marginal households.
Alternatively, needs-based livelihood recovery efforts in unfavourable years could protect marginal
households against negative coping strategies that undermine development gains. This highlights the need
for regular and accurate data collection to enable livelihood protection or recovery efforts and respond to
changing circumstances in a timely manner.
Disaster risk reduction could benefit Category 2 regions in south Balochistan with emphasis on drought
and more moderate investments in flood. This drought and flood balance is reversed in Category 2 districts
in Sindh except for Dadu where the frequency of both hazards is high. In southern Punjab, Rahim Yar
Khan faces high recurrence of flood and drought, whilst the main concern in Bahawalpur and Lodhran is
drought alone. In KP flooding is the main hazard but drought is also a concern to some extent. DRR
programming could add a productive element to food security safety nets with a goal of building resilience
that would allow households to graduate from safety net.
Considering core lenses, Swat in KP stands out for showing signs of significant negative land cover change
and soil erosion propensity which can increase the risk posed by flooding. DRR can also address seismic
risk in central Balochistan and northern KP.

45
17. Category 3: Year Round or Flexible Food Security Safety Nets, Livelihood Recovery
Districts in Category 3 show high or
moderate level recurrence of vulnerability
to food insecurity above the threshold
over the past reference period, coupled
with relatively low natural shock hazards.
Districts identified as Area 3A show
persistent vulnerability to food insecurity
that can justify year round safety nets.
Area 3B districts may be linked to
seasonal factors where flexible safety nets
may be applicable, while for natural
shocks livelihood recovery is priority.
Whilst natural shock hazard is lower, local
contexts may benefit from early warning
and disaster preparedness. Combined
level of natural hazards
Recurrence of vulnerability to food insecurity above the threshold
Low Medium High
Low Area 5 Area 3B Area 3A
Medium Area 4B Area 2B Area 1B
High Area 4A Area 2A Area 1A
Category 3 districts are concentrated in southeast and north Balochistan, most parts of FATA and central
parts of KP.
There is a significant distinction between districts in ICA Area 3A and 3B. In Area 3A (all districts in
Balochistan and about half of the districts in KP under Category 3), vulnerability to food insecurity is
consistently above threshold. This suggests year round protective food security safety net approach is most
appropriate.
Meanwhile, patterns of vulnerability to food insecurity in ICA Area 3B (five agencies of FATA and half of
KP districts under Category 3) are similar to those found in Category 2. Therefore, same approach is
recommended: either flexible safety nets (productive or protective) that address the most vulnerable and
can be scaled up to absorb marginal households or livelihood recovery programmes that respond to
increased needs. Both these themes can minimise negative coping strategies and protect development gains.
Disaster risk reduction, given a relatively low level of exposure to natural hazards in Category 3 districts,
can focus on ensuring effective early warning and disaster preparedness commensurating to the level of
hazard in each district, rather than major investments in infrastructure improvements (although these may
still be appropriate in specific high hazard places). This means developing appropriate systems wherein
accurate and science-based forecasts could be configured into disaster preparedness frameworks for
triggering timely actions before onset of events.
In southern Balochistan early warning and preparedness should address both flood and drought hazards;
in the north floods are of more significant concern. In FATA agencies under Category 3 floods are more
frequent than drought, whilst in KP the picture is mixed therefore appropriate interventions should address
this complexity.
Core lens analysis shows that in Lower Dir and Tor Ghar districts of KP negative land cover change and
soil erosion propensity could increase flood risk suggesting focus on structural interventions for mitigation
in addition to early warning and disaster preparedness. Seismic risks mitigation should be planned for
Category 3 districts of northern Balochistan as well as, Lower Dir and Tor Ghar in KP.
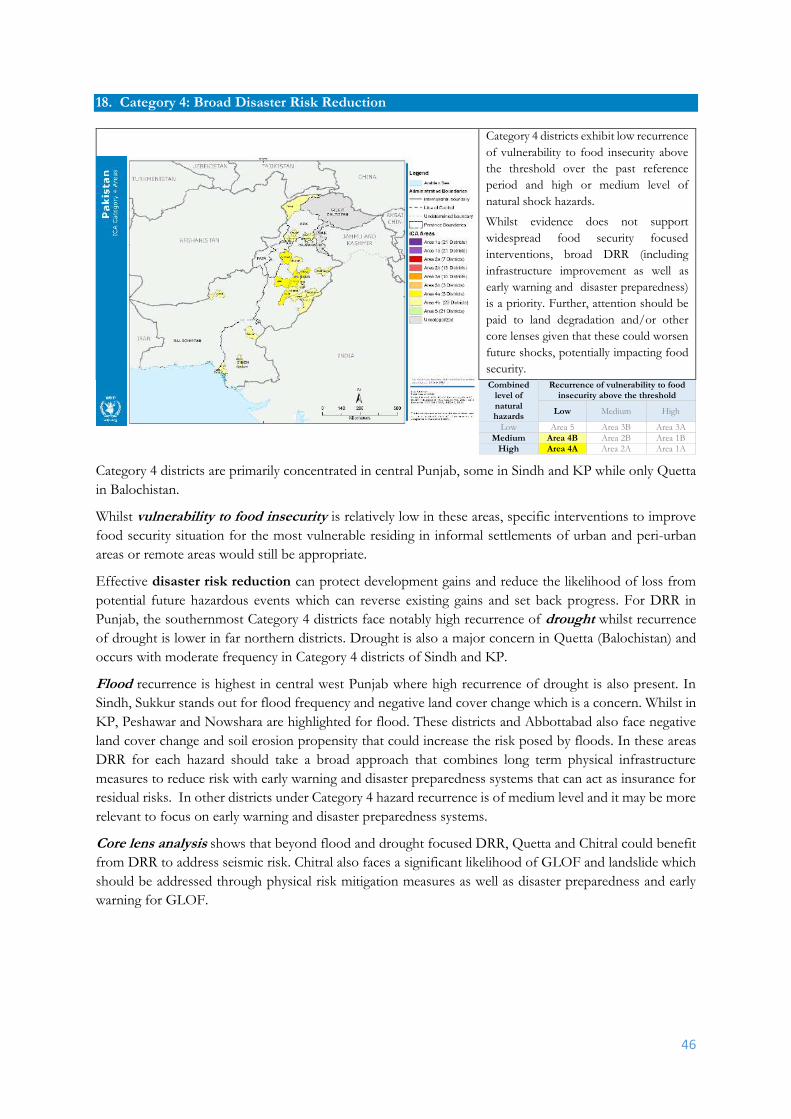
46
18. Category 4: Broad Disaster Risk Reduction
Category 4 districts exhibit low recurrence
of vulnerability to food insecurity above
the threshold over the past reference
period and high or medium level of
natural shock hazards.
Whilst evidence does not support
widespread food security focused
interventions, broad DRR (including
infrastructure improvement as well as
early warning and disaster preparedness)
is a priority. Further, attention should be
paid to land degradation and/or other
core lenses given that these could worsen
future shocks, potentially impacting food
security.
Combined level of natural hazards
Recurrence of vulnerability to food insecurity above the threshold
Low Medium High
Low Area 5 Area 3B Area 3A
Medium Area 4B Area 2B Area 1B
High Area 4A Area 2A Area 1A
Category 4 districts are primarily concentrated in central Punjab, some in Sindh and KP while only Quetta
in Balochistan.
Whilst vulnerability to food insecurity is relatively low in these areas, specific interventions to improve
food security situation for the most vulnerable residing in informal settlements of urban and peri-urban
areas or remote areas would still be appropriate.
Effective disaster risk reduction can protect development gains and reduce the likelihood of loss from
potential future hazardous events which can reverse existing gains and set back progress. For DRR in
Punjab, the southernmost Category 4 districts face notably high recurrence of drought whilst recurrence
of drought is lower in far northern districts. Drought is also a major concern in Quetta (Balochistan) and
occurs with moderate frequency in Category 4 districts of Sindh and KP.
Flood recurrence is highest in central west Punjab where high recurrence of drought is also present. In
Sindh, Sukkur stands out for flood frequency and negative land cover change which is a concern. Whilst in
KP, Peshawar and Nowshara are highlighted for flood. These districts and Abbottabad also face negative
land cover change and soil erosion propensity that could increase the risk posed by floods. In these areas
DRR for each hazard should take a broad approach that combines long term physical infrastructure
measures to reduce risk with early warning and disaster preparedness systems that can act as insurance for
residual risks. In other districts under Category 4 hazard recurrence is of medium level and it may be more
relevant to focus on early warning and disaster preparedness systems.
Core lens analysis shows that beyond flood and drought focused DRR, Quetta and Chitral could benefit
from DRR to address seismic risk. Chitral also faces a significant likelihood of GLOF and landslide which
should be addressed through physical risk mitigation measures as well as disaster preparedness and early
warning for GLOF.
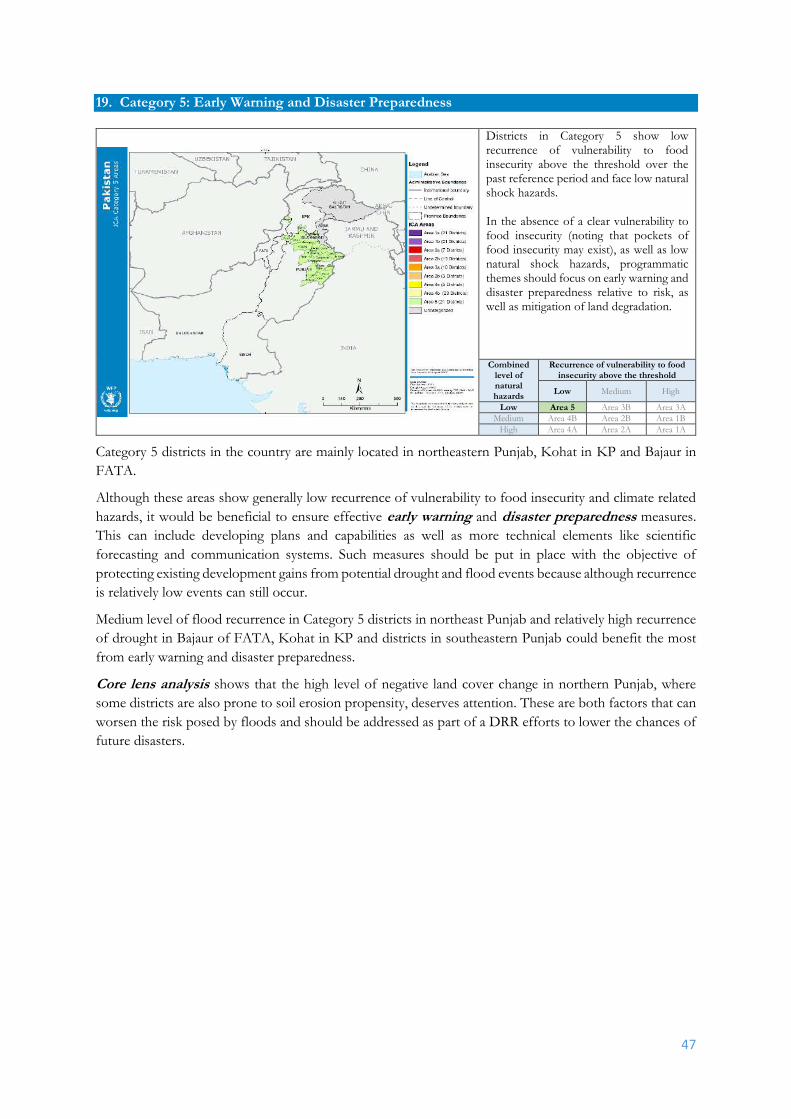
47
19. Category 5: Early Warning and Disaster Preparedness
Districts in Category 5 show low recurrence of vulnerability to food insecurity above the threshold over the past reference period and face low natural shock hazards. In the absence of a clear vulnerability to food insecurity (noting that pockets of food insecurity may exist), as well as low natural shock hazards, programmatic themes should focus on early warning and disaster preparedness relative to risk, as well as mitigation of land degradation.
Combined level of natural hazards
Recurrence of vulnerability to food insecurity above the threshold
Low Medium High
Low Area 5 Area 3B Area 3A
Medium Area 4B Area 2B Area 1B
High Area 4A Area 2A Area 1A
Category 5 districts in the country are mainly located in northeastern Punjab, Kohat in KP and Bajaur in
FATA.
Although these areas show generally low recurrence of vulnerability to food insecurity and climate related
hazards, it would be beneficial to ensure effective early warning and disaster preparedness measures.
This can include developing plans and capabilities as well as more technical elements like scientific
forecasting and communication systems. Such measures should be put in place with the objective of
protecting existing development gains from potential drought and flood events because although recurrence
is relatively low events can still occur.
Medium level of flood recurrence in Category 5 districts in northeast Punjab and relatively high recurrence
of drought in Bajaur of FATA, Kohat in KP and districts in southeastern Punjab could benefit the most
from early warning and disaster preparedness.
Core lens analysis shows that the high level of negative land cover change in northern Punjab, where
some districts are also prone to soil erosion propensity, deserves attention. These are both factors that can
worsen the risk posed by floods and should be addressed as part of a DRR efforts to lower the chances of
future disasters.
48
20. DRR in FATA Frontier Regions, Gilgit Baltistan, and Azad Jammu & Kashmir
MPI and food security data is not available to identify ICA Areas and Categories for FATA Frontier Regions
(FR), Gilgit Baltistan and Azad Jammu & Kashmir (AJ&K). Following outlines how disaster risk
reduction (DRR) is relevant to the context, based on hazard analysis of flood, drought and core lenses.
Flood recurrence is high across Gilgit Baltistan (except for Astore, which is medium) and northern AJ&K,
suggesting comprehensive flood-focused DRR. Although flood recurrence is low in southern AJ&K and
FATA FR, investing in early warning and disaster preparedness can help protect development gains.
Drought recurrence is medium in eastern Gilgit Baltistan and part of central AJ&K, arguing for
comprehensive DRR. In areas where drought recurrence is lower but can still happen early warning and
disaster preparedness is important.
Core lens analysis shows that negative land cover change is a concern across Gilgit Baltistan except for
some central districts, all districts of AJ&K and FATA FR. At the same time, AJ&K and FATA FR also
significantly prone to soil erosion propensity. These factors can increase the risk posed by floods and should
be addressed by DRR. This is true in areas where flood recurrence has historically been high (for example
in Gilgit Baltistan) but also in areas where floods have historically been less frequent (such as the FATA
FR), as these factors could lead to more frequent flooding relative to past patterns. For landslide, eastern
Gilgit Baltistan shows high hazard, while very high in parts of northwest and southwest Gilgit Baltistan as
well as northern AJ&K. Eastern Gilgit Baltistan also faces high GLOF hazard. In cases, where hazard
translates to risks to populations, physical mitigation measures are appropriate in addition to early warning
(where possible) and disaster preparedness.
Broad Programmatic Recommendations are summarized in a map next page.
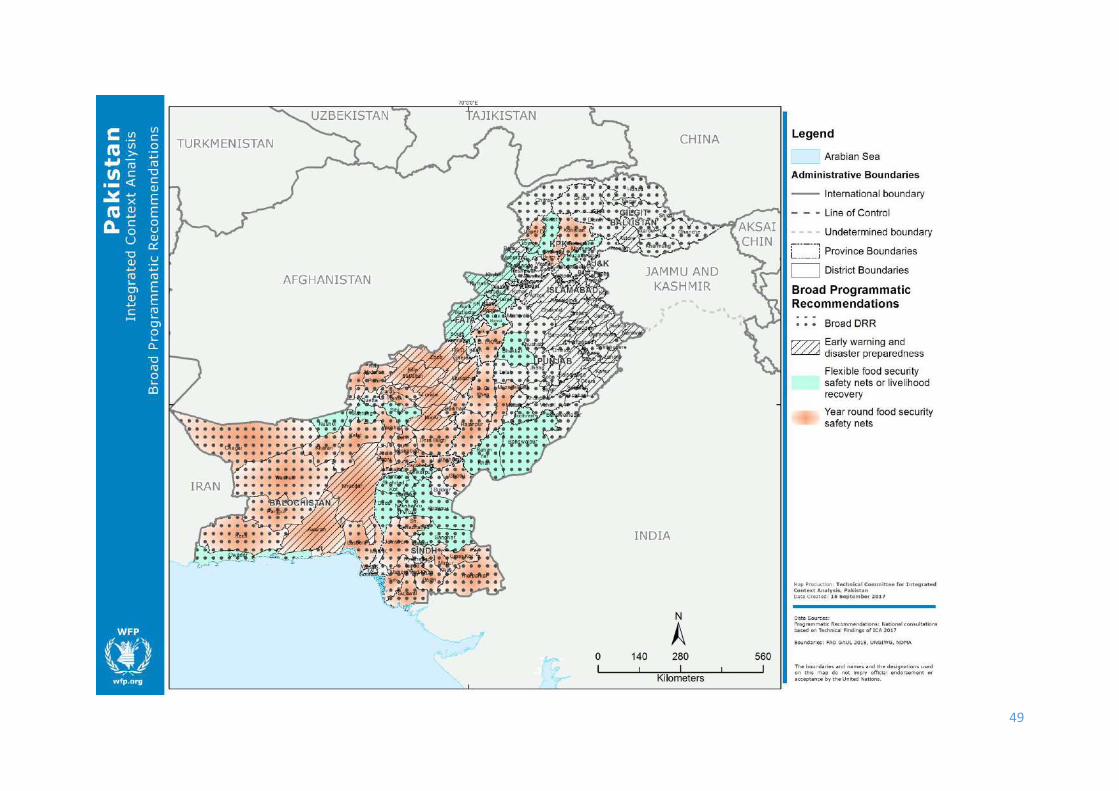
49

50
21. References
1. Japan International Cooperation Agency. (2013). The Project for National Disaster Management Plan in
the Islamic Republic of Pakistan. Retrieved from
http://open_jicareport.jica.go.jp/pdf/12120465_01.pdf
2. Adnan, S., Ullah, K. & Gao, S. (2015). Characterization of Drought and Its Assessment over Sindh,
Pakistan During 1951 - 2010. Journal of Meteorological Research, Vol. 29, No. 5, 837-857.
3. Shah, Z. H., & Arshad, M. (2006). Land Degradation in Pakistan: A Serious Threat to Environments and
Economic Sustainability. Retrieved from
http://www.eco-web.com/edi/060715.html
4. Food and Agriculture Organization of the United Nations. (1994). Land Degradation in South Asia:
Its Severity, Causes & Effects upon the People. Retrieved from
http://www.fao.org/docrep/v4360e/V4360E05.htm
5. Bontemps, S. et al. (2011). GLOBCOVER 2009 - Products Description and Validation Report.
Retrieved from
http://due.esrin.esa.int/files/GLOBCOVER2009_Validation_Report_2.2.pdf
6. Becker, A., P. Finger, A. Meyer-Christoffer, et al. (2013). A description of the global land-surface
precipitation data products of the Global Precipitation Climatology Centre with sample applications including
centennial (trend) analysis from 1901 to present. Earth System Science Data, 5, 71–99.
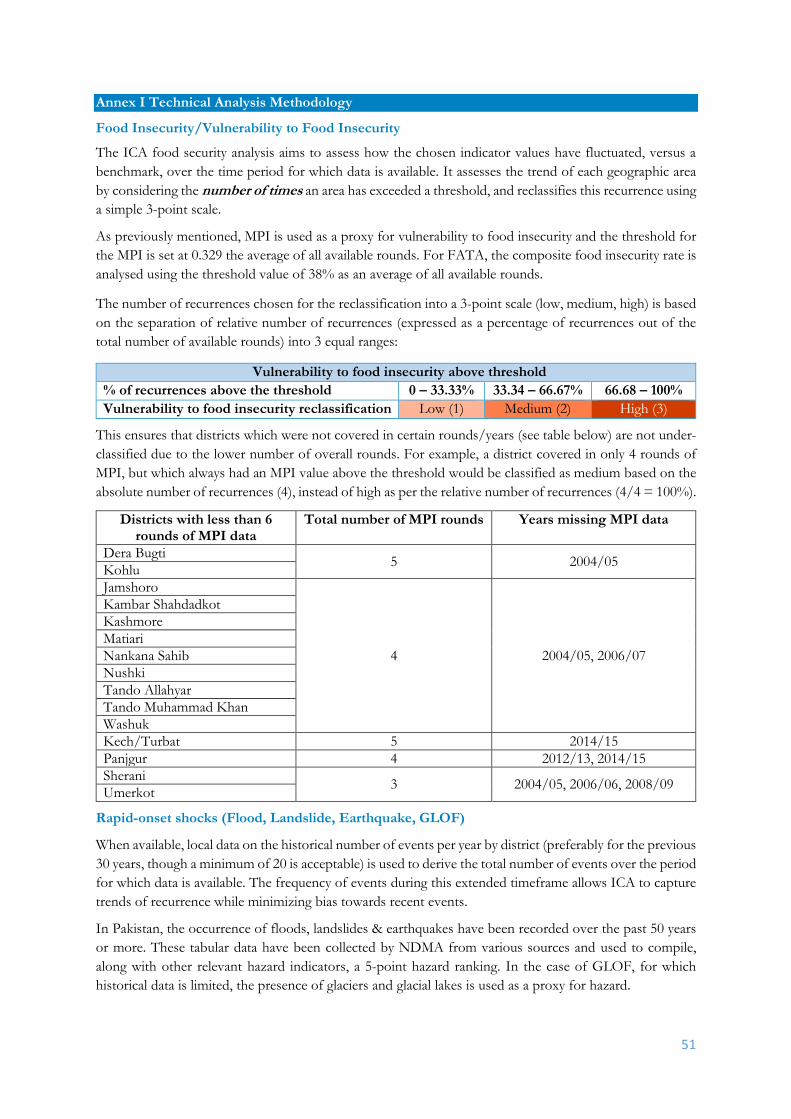
51
Annex I Technical Analysis Methodology
Food Insecurity/Vulnerability to Food Insecurity
The ICA food security analysis aims to assess how the chosen indicator values have fluctuated, versus a
benchmark, over the time period for which data is available. It assesses the trend of each geographic area
by considering the number of times an area has exceeded a threshold, and reclassifies this recurrence using
a simple 3-point scale.
As previously mentioned, MPI is used as a proxy for vulnerability to food insecurity and the threshold for
the MPI is set at 0.329 the average of all available rounds. For FATA, the composite food insecurity rate is
analysed using the threshold value of 38% as an average of all available rounds.
The number of recurrences chosen for the reclassification into a 3-point scale (low, medium, high) is based
on the separation of relative number of recurrences (expressed as a percentage of recurrences out of the
total number of available rounds) into 3 equal ranges:
Vulnerability to food insecurity above threshold
% of recurrences above the threshold 0 – 33.33% 33.34 – 66.67% 66.68 – 100%
Vulnerability to food insecurity reclassification Low (1) Medium (2) High (3)
This ensures that districts which were not covered in certain rounds/years (see table below) are not under-
classified due to the lower number of overall rounds. For example, a district covered in only 4 rounds of
MPI, but which always had an MPI value above the threshold would be classified as medium based on the
absolute number of recurrences (4), instead of high as per the relative number of recurrences (4/4 = 100%).
Districts with less than 6 rounds of MPI data
Total number of MPI rounds Years missing MPI data
Dera Bugti 5 2004/05
Kohlu
Jamshoro
4 2004/05, 2006/07
Kambar Shahdadkot
Kashmore
Matiari
Nankana Sahib
Nushki
Tando Allahyar
Tando Muhammad Khan
Washuk
Kech/Turbat 5 2014/15
Panjgur 4 2012/13, 2014/15
Sherani 3 2004/05, 2006/06, 2008/09
Umerkot
Rapid-onset shocks (Flood, Landslide, Earthquake, GLOF)
When available, local data on the historical number of events per year by district (preferably for the previous
30 years, though a minimum of 20 is acceptable) is used to derive the total number of events over the period
for which data is available. The frequency of events during this extended timeframe allows ICA to capture
trends of recurrence while minimizing bias towards recent events.
In Pakistan, the occurrence of floods, landslides & earthquakes have been recorded over the past 50 years
or more. These tabular data have been collected by NDMA from various sources and used to compile,
along with other relevant hazard indicators, a 5-point hazard ranking. In the case of GLOF, for which
historical data is limited, the presence of glaciers and glacial lakes is used as a proxy for hazard.

52
Slow-onset shock (drought)
When national recorded data on historical drought occurrences is not available, various remotely sensed
datasets can be used to analyse historical deficits in rainfall. The Pakistan Meteorological Department
(PMD) has undertaken such an analysis to classify the drought vulnerability of each district, using high-
resolution observational precipitation data from the Global Precipitation Climatological Centre and
remotely sensed soil moisture data from the Climate Prediction Centre for 1951 to 2010.
The drought hazard is then prepared by calculating the following factors:
Dependency on seasonal/monsoon rainfall
Soil moisture
SPI to calculate the drought years, frequency, intensity, return period of drought, and percentage
area affected by drought.
The simplest equation to calculate the drought hazard index (DHI) is as follows:
𝐷𝐻𝐼 =
(𝑇𝑑𝑇𝑦
+𝑀𝑖𝑛𝑑𝑒𝑥 +𝑆𝑀𝐽−𝐷
𝑆𝑀𝑎𝑛𝑛𝑢𝑎𝑙)
3
where Td is total number of droughts; Ty is total number of years; MIndex is seasonal(winter/monsoon)
rainfall index; SMJ−D is soil moisture (July–December); and SMannual is annual soil moisture (Adnan et.al.,
2015).
Land degradation
Land cover change
Land degradation analysis aims to identify and qualitatively classify negative change in land cover classes
and deforestation, particularly in areas associated with high recurrence of natural hazards (flood and
drought) and food insecurity. The analysis compares the status of land cover classes as measured in 1992
with the present (2015), considering changes on a yearly basis and with a spatial resolution of 300m. Data
is sourced from ESA CCI which offers global coverage.
Each of the ESA standard land cover classes emerging for 1992 and 2015 is given a numerical “ecological
value” (the values are ordinal: higher the number, the higher the ecological value).
ESA CCI Class Generalized Class
(based on IPCC)
Ecological
value
Tree cover, broadleaved, evergreen, closed to open (>15%) Forest 6
Tree cover, broadleaved, deciduous, closed to open (>15%) Forest 6
Tree cover, needleleaved, evergreen, closed to open (>15%) Forest 6
Tree cover, needleleaved, deciduous, closed to open (>15%) Forest 6
tree cover, mixed leaf type (broadleaved and needleleaved) Forest 6
Mosaic tree and shrub (>50%)/herbaceous cover (<50%) Forest 6
Tree cover, flooded, fresh or brakish water Forest 6
Tree cover, flooded saline water Forest 6

53
Shurb or herbaceous cover, flooded, fresh-saline or brakish
water
Wetland 6
Shrubland Shrubland 5
Sparse vegetation (tree, shrub, herbaceous cover) Shrubland 5
Sparse vegetation (tree, shrub, herbaceous cover) Shrubland 5
Mosaic herbaceous cover (>50%)/ tree and shrub (<50%) Grassland 4
Grassland Grassland 4
Lichens and mosses Grassland 4
Rainfeld cropland Cropland 3
Irrigated cropland Cropland 3
Mosaic cropland (>50%) / natural vegetation (tree, shrub,
herbaceous cover) (<50%)
Cropland 3
Mosaic natural vegetation (tree, shrub, herbaceous cover)
(>50%)/cropland (<50%)
Cropland 3
Bare areas Barren or sparsely
vegetated
2
Urban Urban areas 1
Water Water 0
Snow and Ice Snow and ice 0
Changes over time are expressed as the difference between the initial (1992) and final (2015) land cover
class values which can result in a range of values from +6 to -6 where negative values indicate a
deterioration in the ecological value of the land, zero indicates no change in land cover and positive values
indicate improvement in the ecological value.
The average change is calculated for each district, taking into consideration the extent and intensity of both
positive and negative change. The range of positive values is broken down into three classes using Natural
Breaks and the same is done for the negative values.
Erosion propensity
The main indicator utilised for the analysis of soil erosion emerges from a simplified version of the Revised
Universal Soil Loss Equation (RUSLE) which is widely recognized as a reliable means of estimating erosion
propensity. In its original form it is expressed as:
Erosion = R * K * Sl * C * P
Where “R” represents the rainfall factor, “K” represents the soil lithological factor, “S” represents the slope
length factor, “C” represents the land use factor and “P” indicates a protective factor, such as the presence
of infrastructure apt to decrease soil erosion. In general, data on the “P” factor is hard to find at national
or global scale, so the current analysis considers the other four key elements6:
Rainfall incidence, WorldClim, 1960 - 1990 (~1 km resolution)
6 For more information on the actual elaboration of the raster files and final erosion propensity calculation, please contact OSEP-GIS Unit WFP HQ Rome.

54
Soil lithology calculated based on the FAO Digital Soil Map of the World v3.6, 2003
Land cover extracted from NASA MODIS MCD12Q1 product (~250m resolution)
Slope length calculated by SAGA-GIS using NASA SRTM digital elevation model (500m resolution).
Dominant Land Cover
FAO Pakistan analysed the ESA GlobeCover 2009 map in order to extract dominant Land Cover class for
each district. In 2008, the ESA GlobCover 2005 project delivered to the international community the first
300-m global land cover map for 2005 as well as bimonthly and annual MERIS (Medium Resolution
Imaging Spectrometer Instrument) Fine Resolution (FR) surface reflectance mosaics. The ESA-GlobCover
2005 project, carried out by an international consortium, started in April 2005 and relied on very rich
feedback and comments from a large partnership including end-users belonging to international institutions
(JRC, FAO, EEA, UNEP, GOFC-GOLD and IGBP) in addition to ESA internal assessment. The annual
land cover map is derived by automatic and regionally-tuned classification of a time series of global MERIS
FR mosaics for the year 20097.
Dominant Land Cover
In order to find out the dominant land cover class for each district, analysis is performed using Spatial
Analyst toolbox of ArcGIS. For this purpose, conversion of land cover raster to polygon is carried out
using feature to polygon tools. Spatial Join is performed between the converted land cover polygons and
the district layer. Each of the land cover polygon is spatially joined to the respective district in which it falls
into based on its geographical location. In this way, each district is linked to/contained multiple land cover
classes that fall in that district. Area calculations are performed to find out the area under each land cover
class in a district. Based on the area covered by a particular land cover class in a district, land cover classes
are ranked in order to find out first and second most dominant LC classes i.e. the classes having largest area
covered in a district.
Generalization & Reclassification
ESA GlobeCover comprises 22 land cover classes defined with the United Nations (UN) Land Cover
Classification System (LCCS). As a result, 7 unique groups are achieved for the first most dominant LC
class; while 13 unique groups are achieved for the second most dominant class for 156 districts. However,
mapping only first dominant land cover class or second dominant land cover class separately is not
meaningful, therefore the two most dominant land cover classes are mapped together and reclassified into
13 unique combinations in order to make them more meaningful, easy to comprehend and visually less
complex.
7 Sophie Bontemps (2011). GLOBCOVER 2009 - Products Description and Validation Report

55
Annex II - Data Sources
Administrative boundaries Unit/level of analysis: District/Agency (Admin 2) File format & Source: Shapefile, NDMA
Population Figures Main source Indicator: Estimated population Source: Pakistan Bureau of Statistics Time span: 2004 - 2016 Comment: Figures are estimates based on 1998 census and growth rates
Food security Main source Indicator: Multi-dimensional Poverty Index Source: UNDP Time span: 2004/05 – 2014/15, every alternate year Comment: The indicator is a proxy for vulnerability to food insecurity, it covers the 4 provinces but not FATA, AJK or GB Additional sources Indicator: Composite Food Insecurity Rate (CARI) Source: WFP (2014, 2017) & WFP/OCHA (2016) Time span: 2014 - 2017 Comment: The dataset was used for FATA only, and represents the situation of returnee households, not the general population.
Natural Shocks - Core
Floods Indicator: Flood Hazard Index Source: NDMA Time span: 1950 - 2015 Comment: Encompasses both riverine and flash floods.
Drought Indicator: Drought Hazard Index Source: Pakistan Meteorological Department Time span: 1951 - 2010 Comment: Based on observational gridded precipitation & remotely-sensed soil moisture data
Natural Shocks - Lenses
Landslides Indicator: Landslide Hazard Index Source: NDMA Time span: 1950 - 2015 Comment: N/A
Glacier Lake Overflow Flood Indicator: GLOF Hazard Index Source: NDMA Time span: 1950 - 2015 Comment: Not based on historical record of events, only the presence of Glacial Lakes.
Earthquake Indicator: Earthquake Hazard Index Source: NDMA Time span: 1905 - 2015 Comment: Both instrumentation and measurement scale of earthquake events have evolved over the time period considered.
Land degradation Indicator: Land Cover Change Source: ESA CCI Time span: 1992 - 2015 Comment: The analysis is a proxy for degradation of vegetation and associated ecosystem services. Indicator: Erosion Propensity Source: WFP OSEP analysis based on RUSLE Time span: 2012 (Land Cover) Comment: The analysis does not capture the presence of existing infrastructure designed to manage/reduce erosion.
Land Cover Indicator: 2 Most Dominant Land Cover Classes Source: ESA Globcover data Time span: 2009 Comment: Land cover is a proxy, but can only identify areas where livelihoods rely heavily on agriculture (and potentially pastoralism)
Population Density Source: LandScan Time span: 2015 Comment: Population distribution is estimated
based on associated factors, e.g. land cover, road
networks, slope, etc.
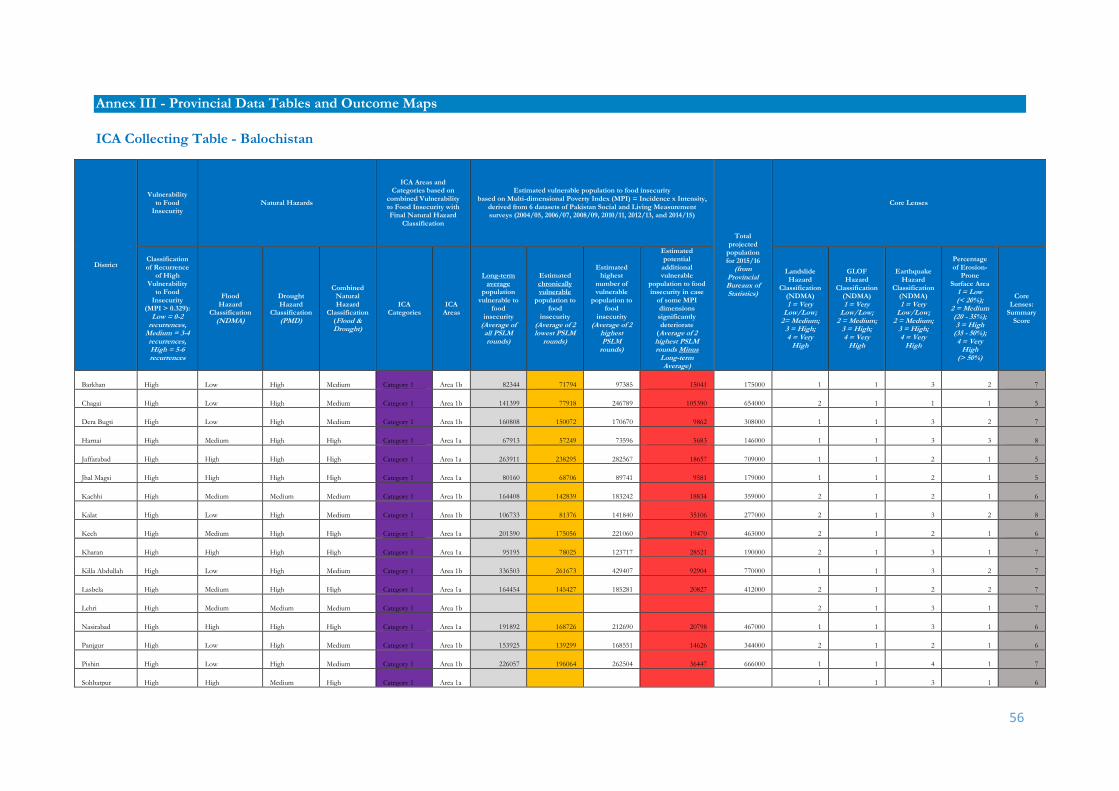
56
Annex III - Provincial Data Tables and Outcome Maps
ICA Collecting Table - Balochistan
District
Vulnerability to Food
Insecurity Natural Hazards
ICA Areas and Categories based on
combined Vulnerability to Food Insecurity with Final Natural Hazard
Classification
Estimated vulnerable population to food insecurity based on Multi-dimensional Poverty Index (MPI) = Incidence x Intensity,
derived from 6 datasets of Pakistan Social and Living Measurement surveys (2004/05, 2006/07, 2008/09, 2010/11, 2012/13, and 2014/15)
Total projected
population for 2015/16
(from Provincial Bureaux of Statistics)
Core Lenses
Classification of Recurrence
of High Vulnerability
to Food Insecurity
(MPI > 0.329): Low = 0-2
recurrences, Medium = 3-4 recurrences, High = 5-6 recurrences
Flood Hazard
Classification (NDMA)
Drought Hazard
Classification (PMD)
Combined Natural Hazard
Classification (Flood & Drought)
ICA Categories
ICA Areas
Long-term average
population vulnerable to
food insecurity
(Average of all PSLM rounds)
Estimated chronically vulnerable
population to food
insecurity (Average of 2 lowest PSLM
rounds)
Estimated highest
number of vulnerable
population to food
insecurity (Average of 2
highest PSLM
rounds)
Estimated potential
additional vulnerable
population to food insecurity in case
of some MPI dimensions significantly deteriorate
(Average of 2 highest PSLM rounds Minus
Long-term Average)
Landslide Hazard
Classification (NDMA) 1 = Very
Low/Low; 2= Medium;
3 = High; 4 = Very
High
GLOF Hazard
Classification (NDMA) 1 = Very
Low/Low; 2 = Medium;
3 = High; 4 = Very
High
Earthquake Hazard
Classification (NDMA) 1 = Very
Low/Low; 2 = Medium;
3 = High; 4 = Very
High
Percentage of Erosion-
Prone Surface Area
1 = Low (< 20%);
2 = Medium (20 - 35%); 3 = High
(35 - 50%); 4 = Very
High (> 50%)
Core Lenses:
Summary Score
Barkhan High Low High Medium Category 1 Area 1b 82344 71794 97385 15041 175000 1 1 3 2 7
Chagai High Low High Medium Category 1 Area 1b 141399 77918 246789 105390 654000 2 1 1 1 5
Dera Bugti High Low High Medium Category 1 Area 1b 160808 150072 170670 9862 308000 1 1 3 2 7
Harnai High Medium High High Category 1 Area 1a 67913 57249 73596 5683 146000 1 1 3 3 8
Jaffarabad High High High High Category 1 Area 1a 263911 238295 282567 18657 709000 1 1 2 1 5
Jhal Magsi High High High High Category 1 Area 1a 80160 68706 89741 9581 179000 1 1 2 1 5
Kachhi High Medium Medium Medium Category 1 Area 1b 164408 142839 183242 18834 359000 2 1 2 1 6
Kalat High Low High Medium Category 1 Area 1b 106733 81376 141840 35106 277000 2 1 3 2 8
Kech High Medium High High Category 1 Area 1a 201590 175056 221060 19470 463000 2 1 2 1 6
Kharan High High High High Category 1 Area 1a 95195 78025 123717 28521 190000 2 1 3 1 7
Killa Abdullah High Low High Medium Category 1 Area 1b 336503 261673 429407 92904 770000 1 1 3 2 7
Lasbela High Medium High High Category 1 Area 1a 164454 145427 185281 20827 412000 2 1 2 2 7
Lehri High Medium Medium Medium Category 1 Area 1b 2 1 3 1 7
Nasirabad High High High High Category 1 Area 1a 191892 168726 212690 20798 467000 1 1 3 1 6
Panjgur High Low High Medium Category 1 Area 1b 153925 139299 168551 14626 344000 2 1 2 1 6
Pishin High Low High Medium Category 1 Area 1b 226057 196064 262504 36447 666000 1 1 4 1 7
Sohbatpur High High Medium High Category 1 Area 1a 1 1 3 1 6
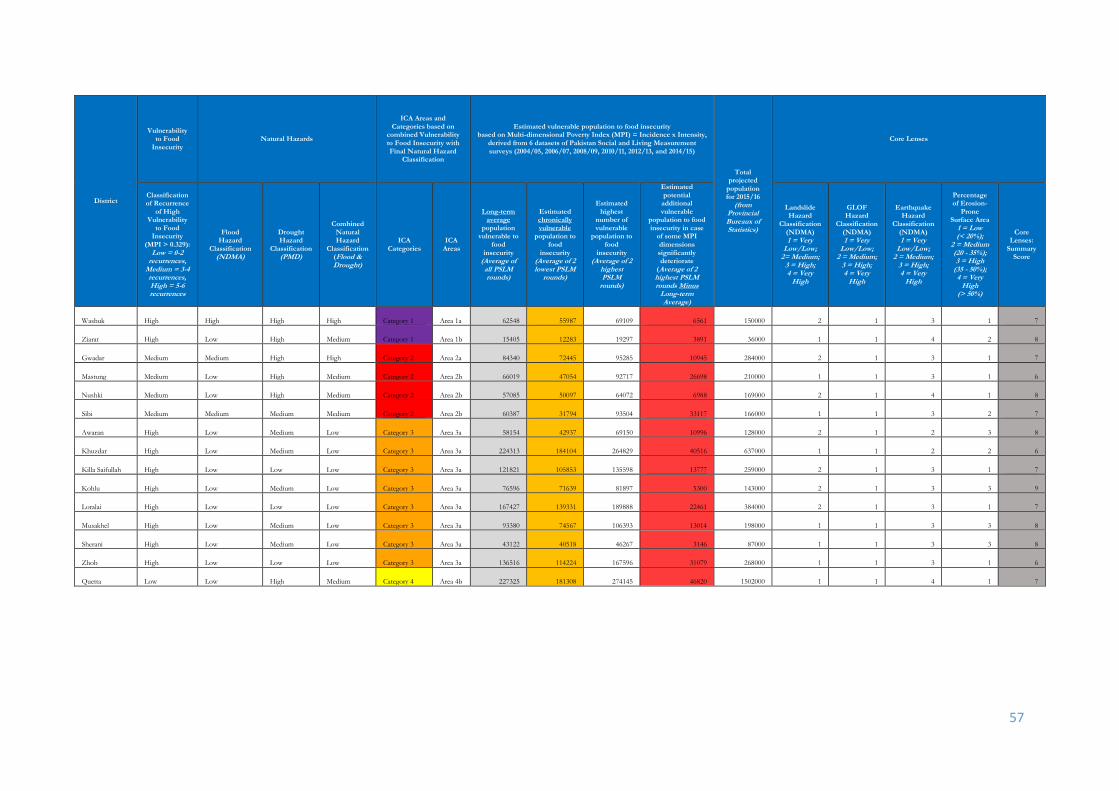
57
District
Vulnerability to Food
Insecurity Natural Hazards
ICA Areas and Categories based on
combined Vulnerability to Food Insecurity with Final Natural Hazard
Classification
Estimated vulnerable population to food insecurity based on Multi-dimensional Poverty Index (MPI) = Incidence x Intensity,
derived from 6 datasets of Pakistan Social and Living Measurement surveys (2004/05, 2006/07, 2008/09, 2010/11, 2012/13, and 2014/15)
Total projected
population for 2015/16
(from Provincial Bureaux of Statistics)
Core Lenses
Classification of Recurrence
of High Vulnerability
to Food Insecurity
(MPI > 0.329): Low = 0-2
recurrences, Medium = 3-4 recurrences, High = 5-6 recurrences
Flood Hazard
Classification (NDMA)
Drought Hazard
Classification (PMD)
Combined Natural Hazard
Classification (Flood & Drought)
ICA Categories
ICA Areas
Long-term average
population vulnerable to
food insecurity
(Average of all PSLM rounds)
Estimated chronically vulnerable
population to food
insecurity (Average of 2 lowest PSLM
rounds)
Estimated highest
number of vulnerable
population to food
insecurity (Average of 2
highest PSLM
rounds)
Estimated potential
additional vulnerable
population to food insecurity in case
of some MPI dimensions significantly deteriorate
(Average of 2 highest PSLM rounds Minus
Long-term Average)
Landslide Hazard
Classification (NDMA) 1 = Very
Low/Low; 2= Medium;
3 = High; 4 = Very
High
GLOF Hazard
Classification (NDMA) 1 = Very
Low/Low; 2 = Medium;
3 = High; 4 = Very
High
Earthquake Hazard
Classification (NDMA) 1 = Very
Low/Low; 2 = Medium;
3 = High; 4 = Very
High
Percentage of Erosion-
Prone Surface Area
1 = Low (< 20%);
2 = Medium (20 - 35%); 3 = High
(35 - 50%); 4 = Very
High (> 50%)
Core Lenses:
Summary Score
Washuk High High High High Category 1 Area 1a 62548 55987 69109 6561 150000 2 1 3 1 7
Ziarat High Low High Medium Category 1 Area 1b 15405 12283 19297 3891 36000 1 1 4 2 8
Gwadar Medium Medium High High Category 2 Area 2a 84340 72445 95285 10945 284000 2 1 3 1 7
Mastung Medium Low High Medium Category 2 Area 2b 66019 47054 92717 26698 210000 1 1 3 1 6
Nushki Medium Low High Medium Category 2 Area 2b 57085 50097 64072 6988 169000 2 1 4 1 8
Sibi Medium Medium Medium Medium Category 2 Area 2b 60387 31794 93504 33117 166000 1 1 3 2 7
Awaran High Low Medium Low Category 3 Area 3a 58154 42937 69150 10996 128000 2 1 2 3 8
Khuzdar High Low Medium Low Category 3 Area 3a 224313 184104 264829 40516 637000 1 1 2 2 6
Killa Saifullah High Low Low Low Category 3 Area 3a 121821 105853 135598 13777 259000 2 1 3 1 7
Kohlu High Low Medium Low Category 3 Area 3a 76596 71639 81897 5300 143000 2 1 3 3 9
Loralai High Low Low Low Category 3 Area 3a 167427 139331 189888 22461 384000 2 1 3 1 7
Musakhel High Low Medium Low Category 3 Area 3a 93380 74567 106393 13014 198000 1 1 3 3 8
Sherani High Low Medium Low Category 3 Area 3a 43122 40518 46267 3146 87000 1 1 3 3 8
Zhob High Low Low Low Category 3 Area 3a 136516 114224 167596 31079 268000 1 1 3 1 6
Quetta Low Low High Medium Category 4 Area 4b 227325 181308 274145 46820 1502000 1 1 4 1 7

58
ICA Outcome Maps – Balochistan

59

60

61

62

63

64

65
ICA Collecting Table – Khyber Pakhtunkhwa
District
Vulnerability to Food Insecurity
Natural Hazards
ICA Areas and Categories based on
combined Vulnerability to Food Insecurity with Final Natural Hazard
Classification
Estimated vulnerable population to food insecurity based on Multi-dimensional Poverty Index (MPI) = Incidence x Intensity, derived from 6 datasets of Pakistan Social and Living
Measurement surveys (2004/05, 2006/07, 2008/09, 2010/11, 2012/13, and 2014/15)
Total projected
population for 2015/16
(from Provincial Bureaux of Statistics)
Core Lenses
Classification of Recurrence of
High Vulnerability to Food Insecurity (MPI > 0.329):
Low = 0-2 recurrences,
Medium = 3-4 recurrences, High = 5-6 recurrences
Flood Hazard
Classification (NDMA)
Drought Hazard
Classification (PMD)
Combined Natural Hazard
Classification (Flood & Drought)
ICA Categories
ICA Areas
Long-term average
population vulnerable to
food insecurity
(Average of all PSLM rounds)
Estimated chronically vulnerable
population to food
insecurity (Average of 2 lowest PSLM
rounds)
Estimated highest
number of vulnerable
population to food
insecurity (Average of 2
highest PSLM
rounds)
Estimated potential
additional vulnerable
population to food insecurity in case of some
MPI dimensions significantly deteriorate
(Average of 2 highest PSLM rounds Minus
Long-term Average)
Landslide Hazard
Classification (NDMA) 1 = Very
Low/Low; 2 = Medium;
3 = High; 4 = Very
High
GLOF Hazard
Classification (NDMA) 1 = Very
Low/Low; 2 = Medium;
3 = High; 4 = Very
High
Earthquake Hazard
Classification (NDMA) 1 = Very
Low/Low; 2 = Medium;
3 = High; 4 = Very
High
Percentage of Erosion-
Prone Surface Area
1 = Low (< 20%);
2 = Medium (20 - 35%); 3 = High
(35 - 50%); 4 = Very
High (> 50%)
Core Lenses:
Summary Score
Batagram High Medium Medium Medium Category 1 Area 1b 156273 119778 188496 32224 469057 3 3 3 4 13
Buner High Medium Medium Medium Category 1 Area 1b 308548 275766 341671 33123 994325 3 1 2 4 10
D. I. Khan High High High High Category 1 Area 1a 500874 451362 534374 33500 1511451 1 1 1 1 4
Kohistan High High Low Medium Category 1 Area 1b 294835 279222 312201 17366 480189 4 3 3 2 12
Shangla High High Low Medium Category 1 Area 1b 274704 244418 308726 34021 771366 3 3 3 4 13
Tank High High Medium High Category 1 Area 1a 143042 130367 154468 11426 412718 1 1 2 1 5
Upper Dir High High Medium High Category 1 Area 1a 370492 329029 401936 31444 935759 4 3 3 3 13
Charsadda Medium High Low Medium Category 2 Area 2b 411837 351496 475963 64126 1696319 3 1 2 1 7
Lakki Marwat Medium Low High Medium Category 2 Area 2b 280309 256613 311527 31218 853459 2 1 2 1 6
Malakand P Area Medium Medium Medium Medium Category 2 Area 2b 166397 118652 210987 44590 815423 2 1 3 4 10
Mansehra Medium Medium Medium Medium Category 2 Area 2b 419292 362163 475149 55857 1759799 4 3 3 4 14
Swat Medium High Medium High Category 2 Area 2a 581363 504148 660628 79265 2271052 4 3 3 3 13
Bannu High Low Medium Low Category 3 Area 3a 325430 301565 344325 18895 1110284 2 1 2 1 6
Hangu Medium Low Low Low Category 3 Area 3b 142597 129842 153901 11304 556350 3 1 2 3 9
Karak Medium Low Medium Low Category 3 Area 3b 208051 179314 249268 41218 763342 3 1 2 3 9
Lower Dir Medium Medium Low Low Category 3 Area 3b 324001 262116 392544 68544 1307230 3 1 3 4 11
Tor Ghar High Medium Low Low Category 3 Area 3a 3 3 3 4 13
Abbottabad Low Medium Medium Medium Category 4 Area 4b 195566 153009 231995 36429 1214735 4 1 3 4 12
Chitral Low Medium Medium Medium Category 4 Area 4b 105740 80055 126089 20349 496732 4 4 4 3 15
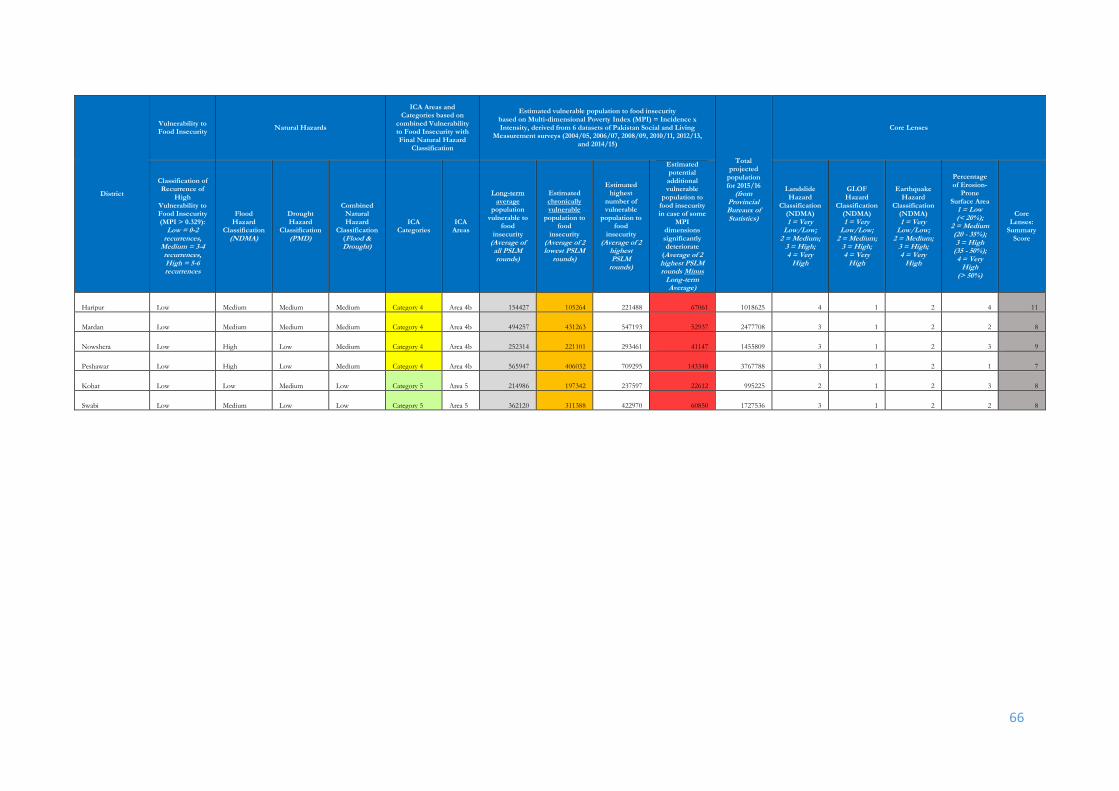
66
District
Vulnerability to Food Insecurity
Natural Hazards
ICA Areas and Categories based on
combined Vulnerability to Food Insecurity with Final Natural Hazard
Classification
Estimated vulnerable population to food insecurity based on Multi-dimensional Poverty Index (MPI) = Incidence x Intensity, derived from 6 datasets of Pakistan Social and Living
Measurement surveys (2004/05, 2006/07, 2008/09, 2010/11, 2012/13, and 2014/15)
Total projected
population for 2015/16
(from Provincial Bureaux of Statistics)
Core Lenses
Classification of Recurrence of
High Vulnerability to Food Insecurity (MPI > 0.329):
Low = 0-2 recurrences,
Medium = 3-4 recurrences, High = 5-6 recurrences
Flood Hazard
Classification (NDMA)
Drought Hazard
Classification (PMD)
Combined Natural Hazard
Classification (Flood & Drought)
ICA Categories
ICA Areas
Long-term average
population vulnerable to
food insecurity
(Average of all PSLM rounds)
Estimated chronically vulnerable
population to food
insecurity (Average of 2 lowest PSLM
rounds)
Estimated highest
number of vulnerable
population to food
insecurity (Average of 2
highest PSLM
rounds)
Estimated potential
additional vulnerable
population to food insecurity in case of some
MPI dimensions significantly deteriorate
(Average of 2 highest PSLM rounds Minus
Long-term Average)
Landslide Hazard
Classification (NDMA) 1 = Very
Low/Low; 2 = Medium;
3 = High; 4 = Very
High
GLOF Hazard
Classification (NDMA) 1 = Very
Low/Low; 2 = Medium;
3 = High; 4 = Very
High
Earthquake Hazard
Classification (NDMA) 1 = Very
Low/Low; 2 = Medium;
3 = High; 4 = Very
High
Percentage of Erosion-
Prone Surface Area
1 = Low (< 20%);
2 = Medium (20 - 35%); 3 = High
(35 - 50%); 4 = Very
High (> 50%)
Core Lenses:
Summary Score
Haripur Low Medium Medium Medium Category 4 Area 4b 154427 105264 221488 67061 1018625 4 1 2 4 11
Mardan Low Medium Medium Medium Category 4 Area 4b 494257 431263 547193 52937 2477708 3 1 2 2 8
Nowshera Low High Low Medium Category 4 Area 4b 252314 221101 293461 41147 1455809 3 1 2 3 9
Peshawar Low High Low Medium Category 4 Area 4b 565947 406032 709295 143348 3767788 3 1 2 1 7
Kohat Low Low Medium Low Category 5 Area 5 214986 197342 237597 22612 995225 2 1 2 3 8
Swabi Low Medium Low Low Category 5 Area 5 362120 311388 422970 60850 1727536 3 1 2 2 8

67
ICA Outcome Maps – Khyber Pakhtunkhwa
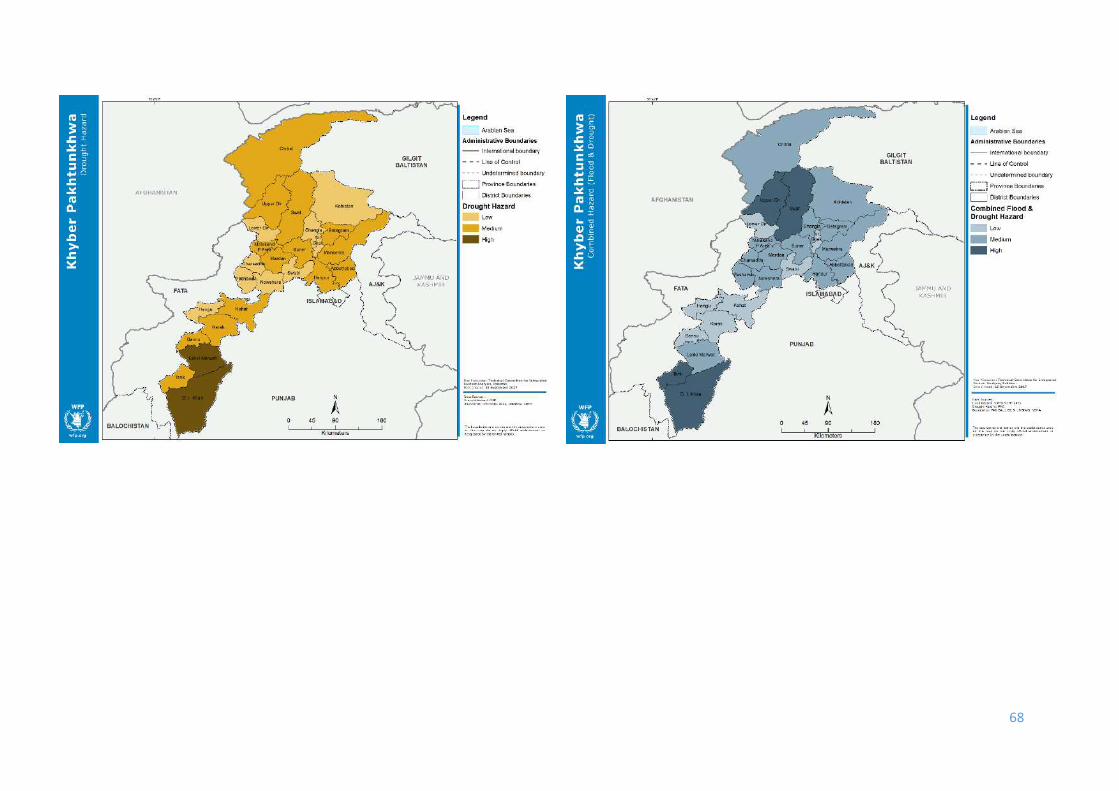
68

69

70
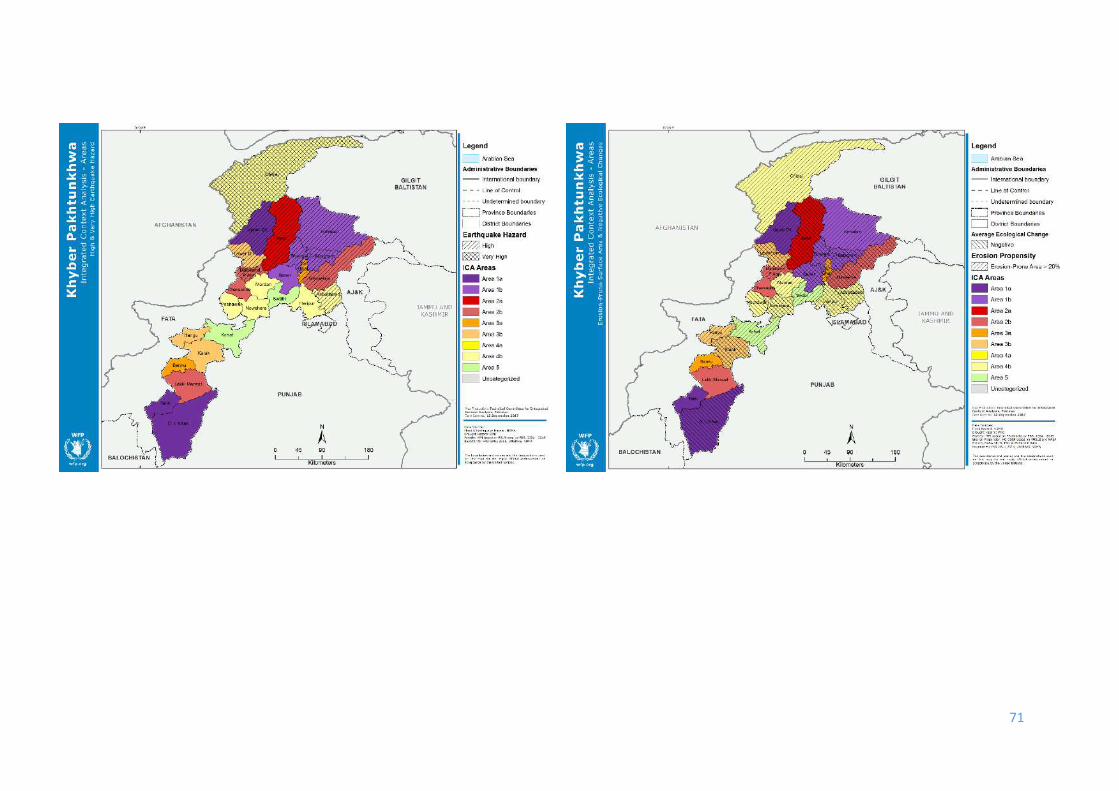
71

72
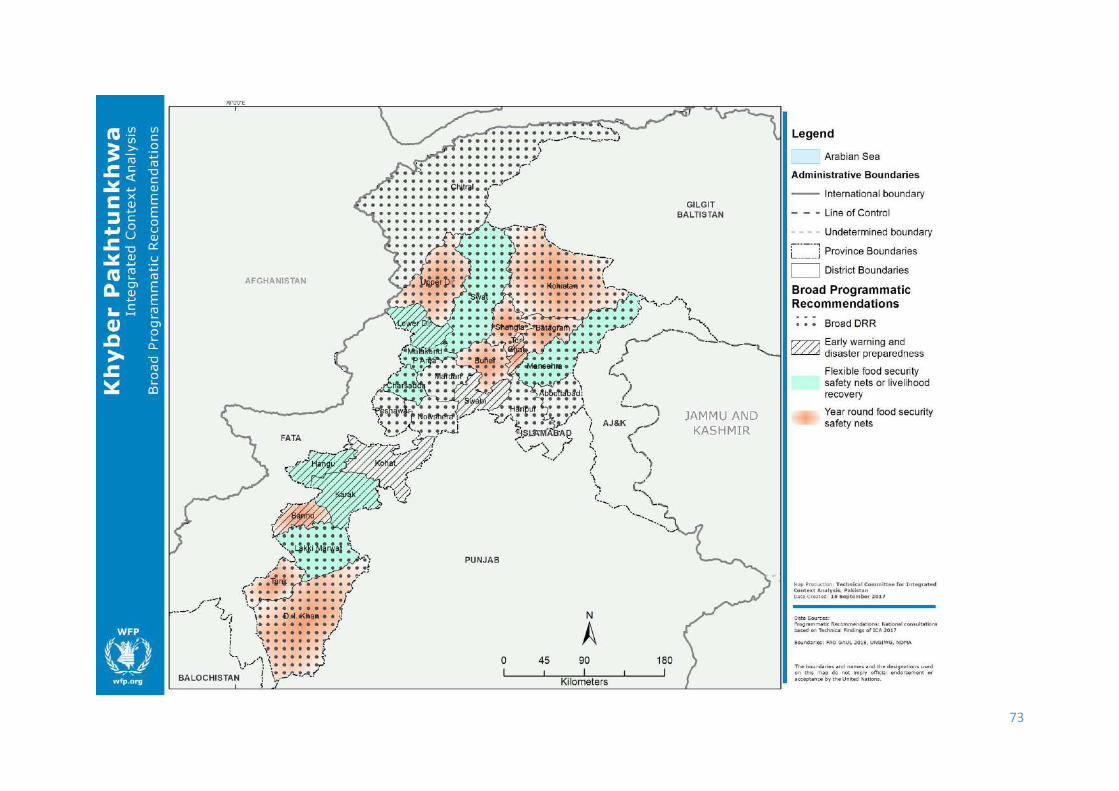
73

74
ICA Collecting Table – Punjab
District
Vulnerability to Food Insecurity
Natural Hazards
ICA Areas and Categories based on
combined Vulnerability to Food Insecurity with Final Natural Hazard
Classification
Estimated vulnerable population to food insecurity based on Multi-dimensional Poverty Index (MPI) = Incidence x Intensity,
derived from 6 datasets of Pakistan Social and Living Measurement surveys (2004/05, 2006/07, 2008/09, 2010/11, 2012/13, and 2014/15)
Total projected
population for 2015/16
(from Provincial Bureaux of Statistics)
Core Lenses
Classification of Recurrence of
High Vulnerability to Food Insecurity (MPI > 0.329):
Low = 0-2 recurrences,
Medium = 3-4 recurrences, High = 5-6 recurrences
Flood Hazard
Classification (NDMA)
Drought Hazard
Classification (PMD)
Combined Natural Hazard
Classification (Flood & Drought)
ICA Categories
ICA Areas
Long-term average
population vulnerable to
food insecurity
(Average of all PSLM rounds)
Estimated chronically vulnerable
population to food
insecurity (Average of 2 lowest PSLM
rounds)
Estimated highest
number of vulnerable
population to food
insecurity (Average of 2
highest PSLM
rounds)
Estimated potential additional
vulnerable population to food insecurity in case
of some MPI dimensions significantly deteriorate
(Average of 2 highest PSLM rounds Minus
Long-term Average)
Landslide Hazard
Classification (NDMA) 1 = Very
Low/Low; 2 = Medium;
3 = High; 4 = Very
High
GLOF Hazard
Classification (NDMA) 1 = Very
Low/Low; 2 = Medium;
3 = High; 4 = Very
High
Earthquake Hazard
Classification (NDMA) 1 = Very
Low/Low; 2 = Medium;
3 = High; 4 = Very
High
Percentage of Erosion-
Prone Surface Area
1 = Low (< 20%);
2 = Medium (20 - 35%); 3 = High
(35 - 50%); 4 = Very
High (> 50%)
Core Lenses:
Summary Score
Dera Ghazi Khan High High Medium High Category 1 Area 1a 902985 808872 1012917 109932 2439000 1 1 1 1 4
Muzaffargarh High High High High Category 1 Area 1a 1378884 1259196 1478851 99967 3941000 1 1 1 1 4
Rajanpur High High Medium High Category 1 Area 1a 649237 571518 760565 111328 1632000 1 1 1 1 4
Bahawalpur Medium Low High Medium Category 2 Area 2b 979993 912800 1023782 43790 3517000 1 1 1 1 4
Bhakkar Medium Medium Medium Medium Category 2 Area 2b 445644 383445 482863 37219 1459000 1 1 1 1 4
Lodhran Medium Low High Medium Category 2 Area 2b 464541 396811 538099 73558 1631000 1 1 1 1 4
Rahim Yar Khan Medium High High High Category 2 Area 2a 1412294 1282643 1538877 126583 4604000 1 1 1 1 4
Bahawalnagar Low Low High Medium Category 4 Area 4b 684930 623334 744970 60039 2761000 1 1 1 1 4
Chiniot Low High Medium High Category 4 Area 4a 245177 224604 264516 19338 1231000 1 1 1 1 4
Jhang Low High Medium High Category 4 Area 4a 678138 478752 941822 263684 2454000 1 1 1 1 4
Khanewal Low Low High Medium Category 4 Area 4b 681056 580380 762006 80949 2785000 1 1 1 1 4
Khushab Low Medium Medium Medium Category 4 Area 4b 248512 214766 293204 44692 1164000 2 1 2 1 6
Leiah Low High High High Category 4 Area 4a 398473 338569 469534 71061 1626000 1 1 1 1 4
Mianwali Low High Medium High Category 4 Area 4a 348177 306586 383934 35757 1407000 3 1 2 1 7
Multan Low High High High Category 4 Area 4a 925423 811768 1021958 96535 4332000 1 1 1 1 4
Pakpattan Low Low High Medium Category 4 Area 4b 451949 369156 516066 64117 1744000 1 1 1 1 4
Sheikhupura Low Medium Medium Medium Category 4 Area 4b 425289 294729 621659 196370 3123000 2 1 1 1 5
Toba Tek Singh Low Low High Medium Category 4 Area 4b 342155 218490 468258 126103 2103000 1 1 1 1 4
Vehari Low Low High Medium Category 4 Area 4b 635881 557896 729139 93258 2895000 1 1 1 1 4

75
District
Vulnerability to Food Insecurity
Natural Hazards
ICA Areas and Categories based on
combined Vulnerability to Food Insecurity with Final Natural Hazard
Classification
Estimated vulnerable population to food insecurity based on Multi-dimensional Poverty Index (MPI) = Incidence x Intensity,
derived from 6 datasets of Pakistan Social and Living Measurement surveys (2004/05, 2006/07, 2008/09, 2010/11, 2012/13, and 2014/15)
Total projected
population for 2015/16
(from Provincial Bureaux of Statistics)
Core Lenses
Classification of Recurrence of
High Vulnerability to Food Insecurity (MPI > 0.329):
Low = 0-2 recurrences,
Medium = 3-4 recurrences, High = 5-6 recurrences
Flood Hazard
Classification (NDMA)
Drought Hazard
Classification (PMD)
Combined Natural Hazard
Classification (Flood & Drought)
ICA Categories
ICA Areas
Long-term average
population vulnerable to
food insecurity
(Average of all PSLM rounds)
Estimated chronically vulnerable
population to food
insecurity (Average of 2 lowest PSLM
rounds)
Estimated highest
number of vulnerable
population to food
insecurity (Average of 2
highest PSLM
rounds)
Estimated potential additional
vulnerable population to food insecurity in case
of some MPI dimensions significantly deteriorate
(Average of 2 highest PSLM rounds Minus
Long-term Average)
Landslide Hazard
Classification (NDMA) 1 = Very
Low/Low; 2 = Medium;
3 = High; 4 = Very
High
GLOF Hazard
Classification (NDMA) 1 = Very
Low/Low; 2 = Medium;
3 = High; 4 = Very
High
Earthquake Hazard
Classification (NDMA) 1 = Very
Low/Low; 2 = Medium;
3 = High; 4 = Very
High
Percentage of Erosion-
Prone Surface Area
1 = Low (< 20%);
2 = Medium (20 - 35%); 3 = High
(35 - 50%); 4 = Very
High (> 50%)
Core Lenses:
Summary Score
Attock Low Low Low Low Category 5 Area 5 176085 88184 247739 71654 1674000 3 1 2 3 9
Chakwal Low Low Medium Low Category 5 Area 5 106204 69581 144533 38329 1384000 2 1 2 4 9
Faisalabad Low Low Medium Low Category 5 Area 5 786024 597998 995295 209271 7358000 1 1 1 1 4
Gujranwala Low Medium Low Low Category 5 Area 5 400012 310149 542846 142834 4788000 2 1 1 1 5
Gujrat Low Medium Low Low Category 5 Area 5 230720 200173 267523 36804 2689000 2 1 2 1 6
Hafizabad Low Low Low Low Category 5 Area 5 187427 153110 239585 52158 1098000 1 1 1 1 4
Jhelum Low Low Low Low Category 5 Area 5 76752 38910 135784 59032 1211000 2 1 2 3 8
Kasur Low Low Medium Low Category 5 Area 5 537946 402304 662011 124065 3262000 1 1 1 1 4
Lahore Low Low Medium Low Category 5 Area 5 369221 213730 496661 127440 9545000 1 1 1 1 4
Mandi Bahauddin Low Low Low Low Category 5 Area 5 236226 189717 281325 45098 1463000 1 1 2 1 5
Nankana Sahib Low Low Medium Low Category 5 Area 5 203116 155309 250923 47807 1304000 2 1 1 1 5
Narowal Low Medium Low Low Category 5 Area 5 311226 214486 398871 87645 1611000 1 1 2 1 5
Okara Low Low Medium Low Category 5 Area 5 706774 576225 848657 141883 2996000 1 1 2 1 5
Rawalpindi Low Medium Low Low Category 5 Area 5 238370 141303 367293 128922 4691000 4 1 2 4 11
Sahiwal Low Low Medium Low Category 5 Area 5 481157 371543 575476 94319 2399000 1 1 1 1 4
Sargodha Low Low Low Low Category 5 Area 5 687444 545891 790408 102964 3397000 2 1 1 1 5
Sialkot Low Medium Low Low Category 5 Area 5 406800 277916 539468 132668 3673000 1 1 2 1 5
Islamabad Low Low Low Low Category 5 Area 5 41,212 24,723 55,763 14,551 4,730,000 4 1 2 4 11

76
ICA Outcome Maps – Punjab

77

78

79
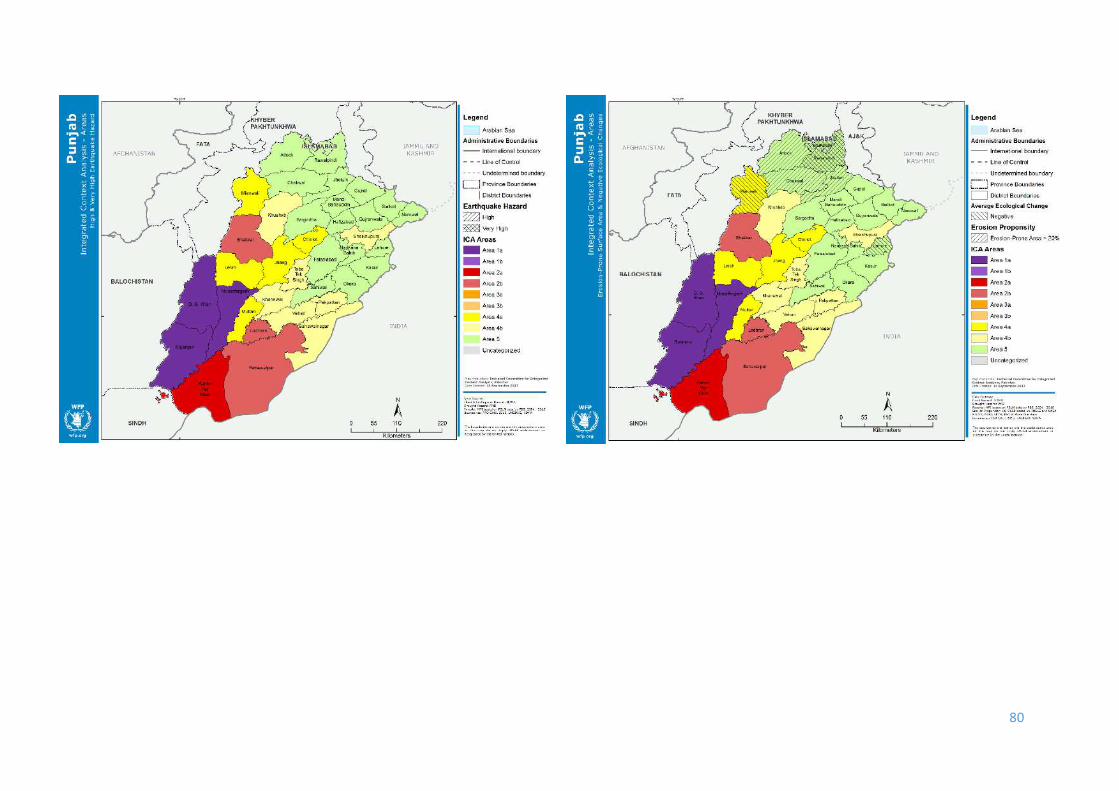
80

81
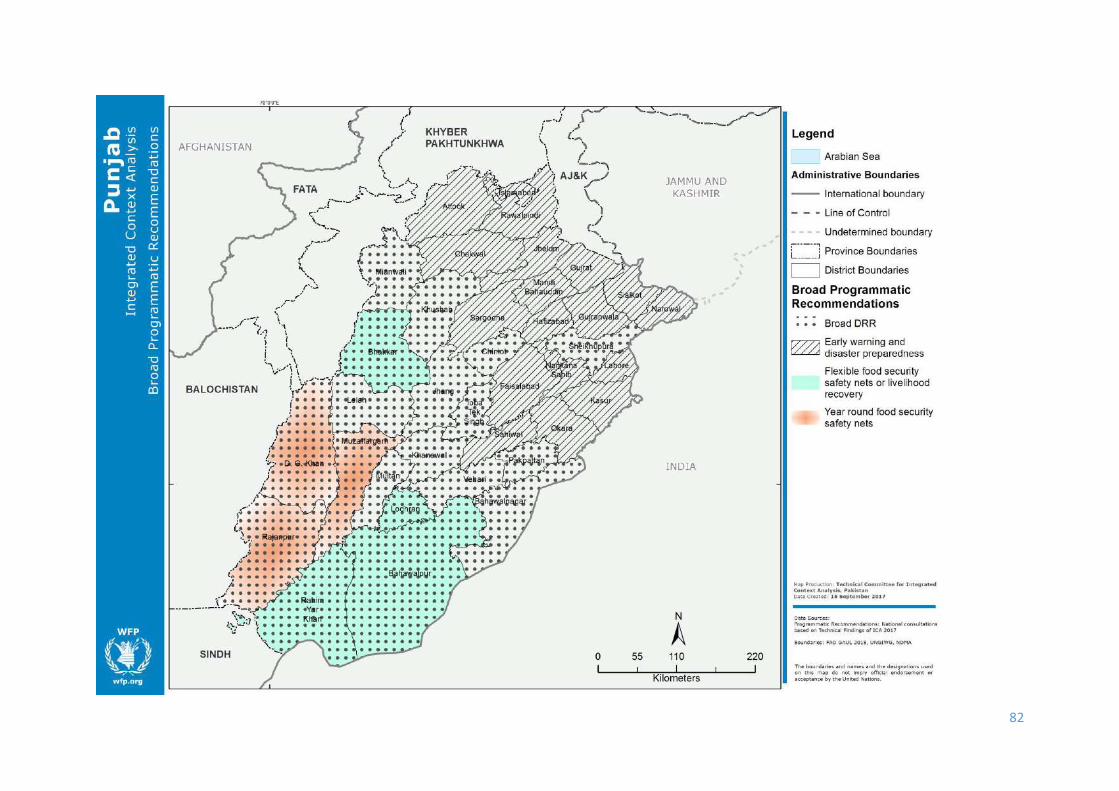
82

83
ICA Collecting Table – Sindh
District
Vulnerability to Food
Insecurity Natural Hazards
ICA Areas and Categories based on
combined Vulnerability to Food Insecurity with Final Natural Hazard
Classification
Estimated vulnerable population to food insecurity based on Multi-dimensional Poverty Index (MPI) = Incidence x Intensity, derived from 6 datasets of Pakistan Social and Living
Measurement surveys (2004/05, 2006/07, 2008/09, 2010/11, 2012/13, and 2014/15)
Total projected
population for 2015/16
(from Provincial Bureaux of Statistics)
Core Lenses
Classification of Recurrence
of High Vulnerability
to Food Insecurity
(MPI > 0.329):
Low = 0-2 recurrences, Medium = 3-4 recurrences,
High = 5-6 recurrences
Flood Hazard
Classification (NDMA)
Drought Hazard
Classification (PMD)
Combined Natural Hazard
Classification (Flood & Drought)
ICA Categories
ICA Areas
Long-term average
population vulnerable to
food insecurity
(Average of all PSLM rounds)
Estimated chronically vulnerable
population to food
insecurity (Average of 2 lowest PSLM
rounds)
Estimated highest
number of vulnerable
population to food
insecurity (Average of 2
highest PSLM
rounds)
Estimated potential
additional vulnerable
population to food insecurity in case of some
MPI dimensions significantly deteriorate
(Average of 2 highest PSLM rounds Minus
Long-term Average)
Landslide Hazard
Classification (NDMA) 1 = Very
Low/Low; 2 = Medium;
3 = High; 4 = Very
High
GLOF Hazard
Classification (NDMA) 1 = Very
Low/Low; 2 = Medium;
3 = High; 4 = Very
High
Earthquake Hazard
Classification (NDMA) 1 = Very
Low/Low; 2 = Medium;
3 = High; 4= Very
High
Percentage of Erosion-
Prone Surface Area
1 = Low (< 20%);
2 = Medium (20 - 35%); 3 = High
(35 - 50%); 4 = Very
High (> 50%)
Core Lenses:
Summary Score
Badin High Medium High High Category 1 Area 1a 667436 589348 738298 70862 1698632 1 1 2 1 5
Ghotki High High Low Medium Category 1 Area 1b 548912 499179 603557 54645 1729003 1 1 1 1 4
Jacobabad High High Low Medium Category 1 Area 1b 389964 343164 440245 50281 1067135 1 1 1 1 4
Jamshoro High High Medium High Category 1 Area 1a 307019 288934 325105 18086 932079 1 1 1 2 5
Kashmore High High Low Medium Category 1 Area 1b 350870 312473 389268 38397 983353 1 1 1 1 4
Mirpur Khas High Low High Medium Category 1 Area 1b 512873 429159 581389 68516 1458285 1 1 1 1 4
Shaheed Benazir Abad High Medium High High Category 1 Area 1a 481834 446113 524058 42224 1433508 1 1 1 1 4
Sujawal High High High High Category 1 Area 1a 335553 Insufficient
Data Insufficient
Data Insufficient Data 768096 1 1 2 1 5
Tando Allahyar High Low High Medium Category 1 Area 1b 224497 214810 234184 9687 693384 1 1 1 1 4
Tando Muhammad Khan High High High High Category 1 Area 1a 233007 216785 249228 16221 586006 1 1 1 1 4
Tharparkar High Low High Medium Category 1 Area 1b 703359 650091 745386 42026 1592263 1 1 1 1 4
Thatta High High High High Category 1 Area 1a 355594 338583 377483 21889 896371 1 1 1 1 4
Umer Kot High Low High Medium Category 1 Area 1b 495740 454269 538837 43097 1185408 1 1 1 1 4
Dadu Medium High High High Category 2 Area 2a 512430 433106 621543 109113 1772139 1 1 1 2 5
Kambar Shahdad Kot Medium High Medium High Category 2 Area 2a 526686 437733 615639 88953 1612495 1 1 2 1 5
Khairpur Medium High Medium High Category 2 Area 2a 672712 579619 779061 106350 2502669 1 1 1 1 4
Larkana Medium High Low Medium Category 2 Area 2b 441295 316189 578490 137195 1749405 1 1 1 1 4
Naushahro Feroze Medium Medium Medium Medium Category 2 Area 2b 394569 333285 453711 59142 1449819 1 1 1 1 4
Sanghar Medium Medium High High Category 2 Area 2a 737810 638227 843191 105381 2363666 1 1 1 1 4
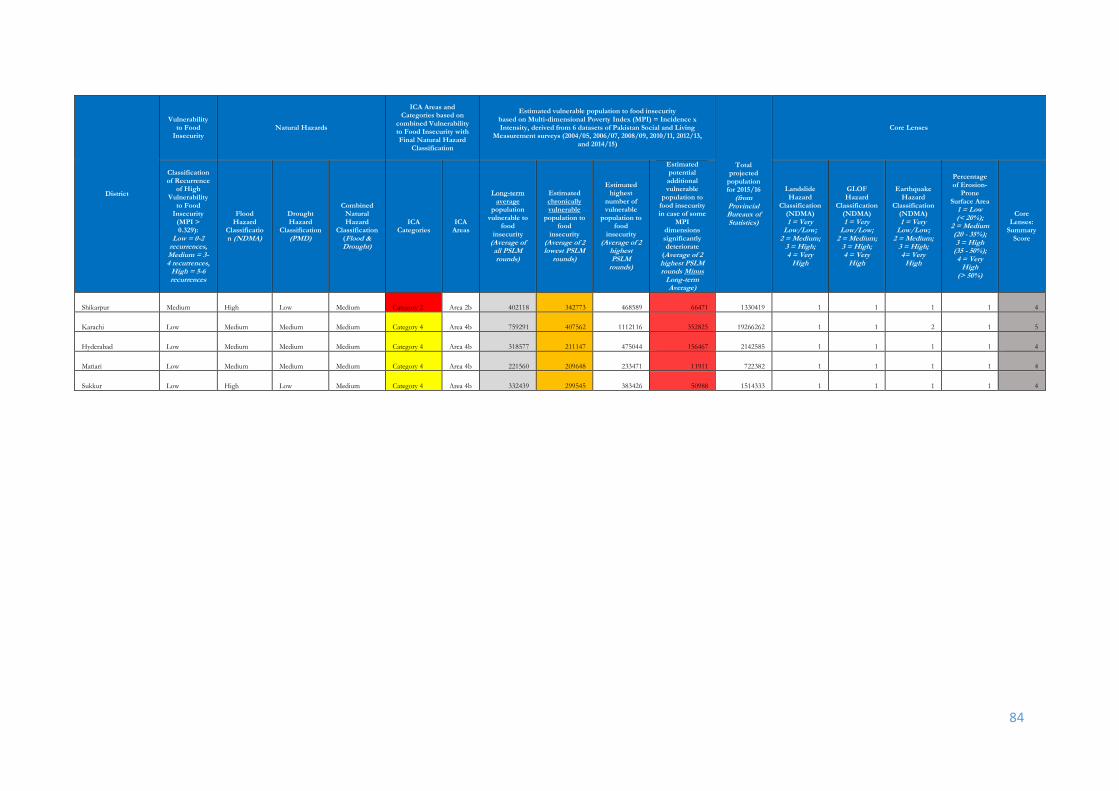
84
District
Vulnerability to Food
Insecurity Natural Hazards
ICA Areas and Categories based on
combined Vulnerability to Food Insecurity with Final Natural Hazard
Classification
Estimated vulnerable population to food insecurity based on Multi-dimensional Poverty Index (MPI) = Incidence x Intensity, derived from 6 datasets of Pakistan Social and Living
Measurement surveys (2004/05, 2006/07, 2008/09, 2010/11, 2012/13, and 2014/15)
Total projected
population for 2015/16
(from Provincial Bureaux of Statistics)
Core Lenses
Classification of Recurrence
of High Vulnerability
to Food Insecurity
(MPI > 0.329):
Low = 0-2 recurrences, Medium = 3-4 recurrences,
High = 5-6 recurrences
Flood Hazard
Classification (NDMA)
Drought Hazard
Classification (PMD)
Combined Natural Hazard
Classification (Flood & Drought)
ICA Categories
ICA Areas
Long-term average
population vulnerable to
food insecurity
(Average of all PSLM rounds)
Estimated chronically vulnerable
population to food
insecurity (Average of 2 lowest PSLM
rounds)
Estimated highest
number of vulnerable
population to food
insecurity (Average of 2
highest PSLM
rounds)
Estimated potential
additional vulnerable
population to food insecurity in case of some
MPI dimensions significantly deteriorate
(Average of 2 highest PSLM rounds Minus
Long-term Average)
Landslide Hazard
Classification (NDMA) 1 = Very
Low/Low; 2 = Medium;
3 = High; 4 = Very
High
GLOF Hazard
Classification (NDMA) 1 = Very
Low/Low; 2 = Medium;
3 = High; 4 = Very
High
Earthquake Hazard
Classification (NDMA) 1 = Very
Low/Low; 2 = Medium;
3 = High; 4= Very
High
Percentage of Erosion-
Prone Surface Area
1 = Low (< 20%);
2 = Medium (20 - 35%); 3 = High
(35 - 50%); 4 = Very
High (> 50%)
Core Lenses:
Summary Score
Shikarpur Medium High Low Medium Category 2 Area 2b 402118 342773 468589 66471 1330419 1 1 1 1 4
Karachi Low Medium Medium Medium Category 4 Area 4b 759291 407562 1112116 352825 19266262 1 1 2 1 5
Hyderabad Low Medium Medium Medium Category 4 Area 4b 318577 211147 475044 156467 2142585 1 1 1 1 4
Matiari Low Medium Medium Medium Category 4 Area 4b 221560 209648 233471 11911 722382 1 1 1 1 4
Sukkur Low High Low Medium Category 4 Area 4b 332439 299545 383426 50988 1514333 1 1 1 1 4
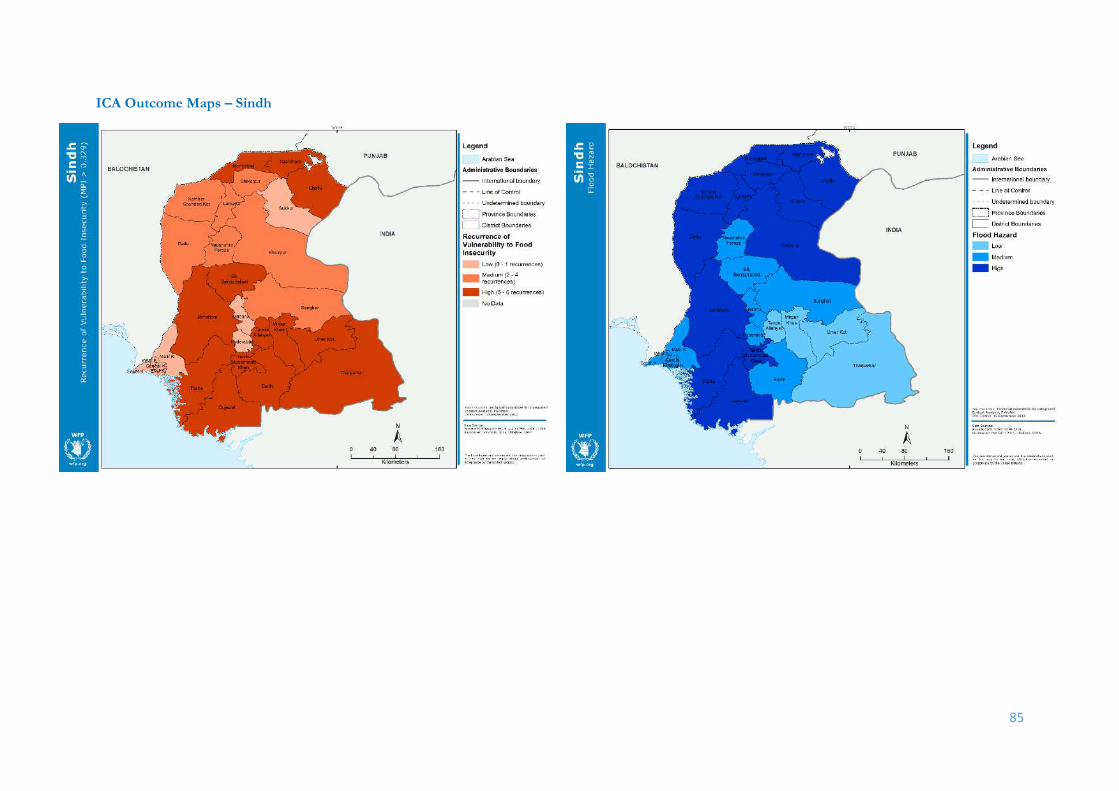
85
ICA Outcome Maps – Sindh

86
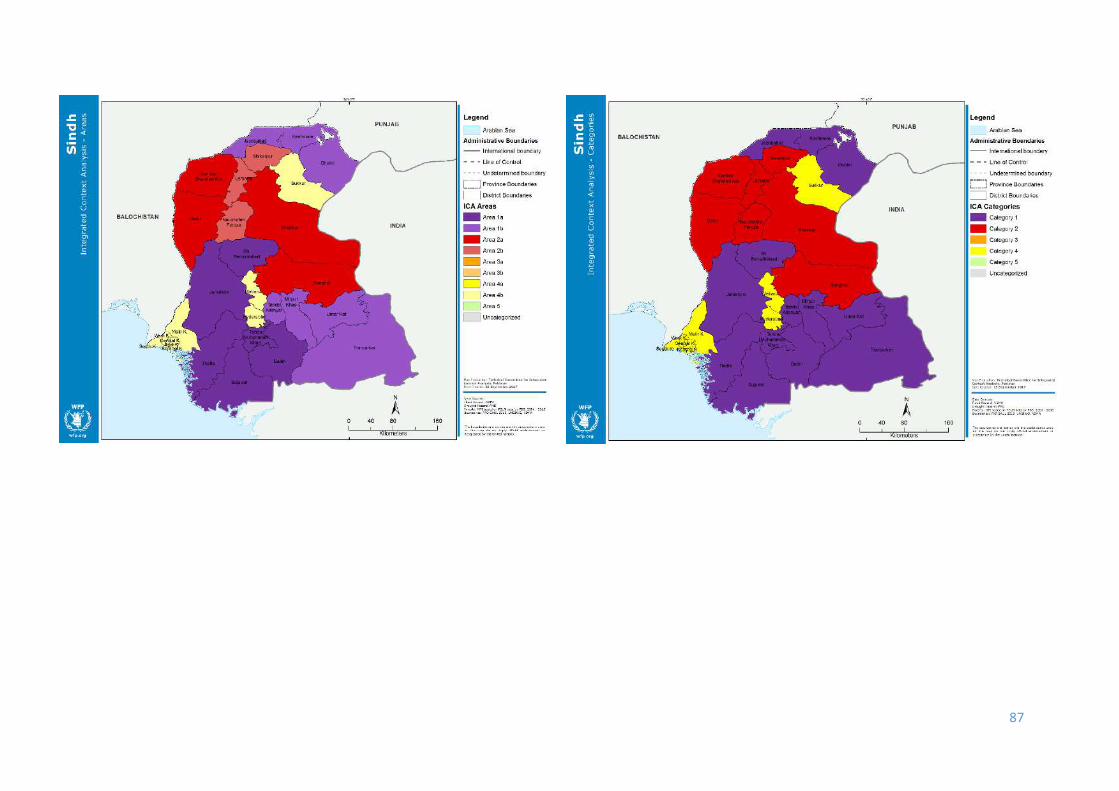
87
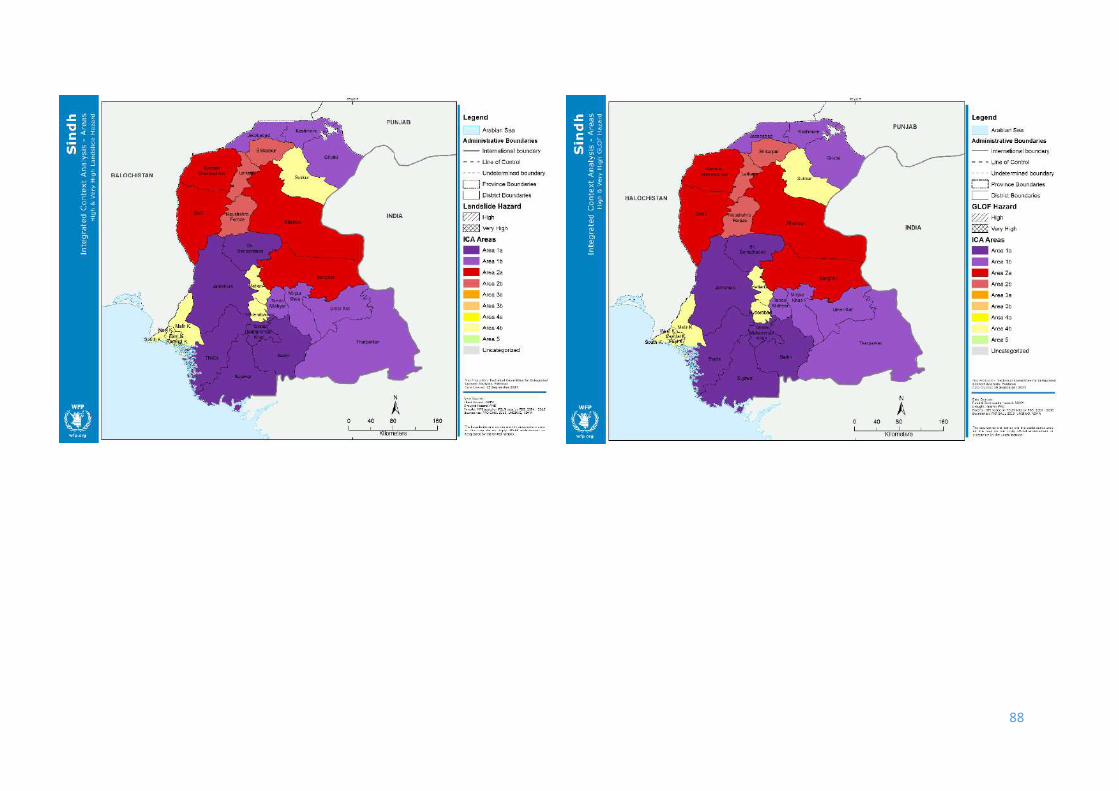
88
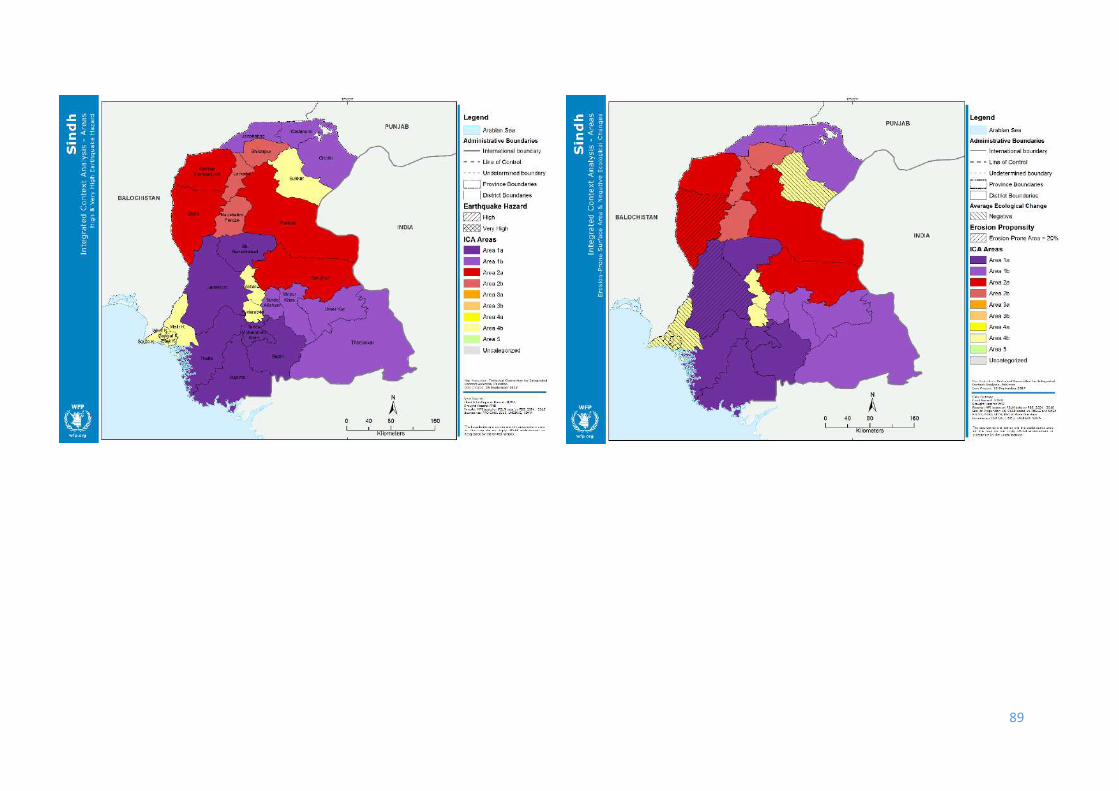
89

90

91

92
ICA Collecting Table – FATA
District
Food Insecurity Natural Hazards
ICA Areas and Categories based on combined Food
Insecurity with Final Natural Hazard Classification
Estimated food insecure
population based on
composite food insecurity rate of three food
security assessments conducted in 2014, 2016 and
2017 by applying Consolidated Approach to Reporting on Indicators of
food security - CARI (WFP
2014)
Estimated Food Insecure Population
Total projected population for 2017
(from FATA
Bureau of Statistics)
Core Lenses
Classification of Recurrence of
High Food Insecurity
(Moderately + Severely
Insecure > 38%):
Low = 0 recurrences,
Medium = 1-2 recurrences,
High = 3 recurrences
Flood Hazard
Classification (NDMA)
Drought Hazard
Classification (PMD)
Combined Natural Hazard
Classification (Flood & Drought)
ICA Categories
ICA Areas
Estimated mostly food
insecure population
(Average of 2 lowest
assessments*)
Estimated highest number of food insecure
population (Average of 2
highest assessments*)
Estimated additional
food insecure population in
case of a major shock (Average of 2
highest assessments Minus Long-
term Average)
Landslide Hazard
Classification (NDMA) 1 = Low;
2 = Medium; 3 = High; 4 = Very
High
GLOF Hazard
Classification (NDMA) 1 = Low;
2 = Medium; 3 = High; 4 = Very
High
Earthquake Hazard
Classification (NDMA) 1 = Low;
2 = Medium; 3 = High; 4 = Very
High
Percentage of Erosion-
Prone Surface Area
1 = Low (< 20%);
2 = Medium (20 - 35%); 3 = High
(35 - 50%); 4 = Very
High (> 50%)
Core Lenses:
Summary Score
Khyber Agency Medium Low Low Low Category 3 Area 3b 433278 313401 636571 203294 822070 3 1 2 3 9
Kurram Agency Medium Low Low Low Category 3 Area 3b 279408 224519 366485 87076 674084 3 1 2 3 9
Mohmand Agency Medium Low Medium Low Category 3 Area 3b 182303 165127 199479 17176 502887 3 1 3 3 10
North Waziristan Agency Medium Low Low Low Category 3 Area 3b 204595 179247 229944 25349 543174 3 1 2 2 8
Orakzai Agency High Low Low Low Category 3 Area 3a 159816 148201 170618 10802 338976 3 1 2 4 10
South Waziristan Agency Medium Low Medium Low Category 3 Area 3b 152652 90021 214975 62323 646314 2 1 2 2 7
Bajaur Agency Low Low Medium Low Category 5 Area 5 125075 107301 142848 17773 894990 2 1 3 4 10
FR Bannu No Data Low Low Low Uncategorized Uncategorized 2 1 2 2 7
FR D.I.Khan No Data Low Medium Low Uncategorized Uncategorized 1 1 3 3 8
FR Kohat No Data Low Low Low Uncategorized Uncategorized 2 1 2 4 9
FR Lakki Marwat No Data Low Low Low Uncategorized Uncategorized 2 1 2 2 7
FR Peshawar No Data Low Low Low Uncategorized Uncategorized 2 1 2 4 9
FR Tank No Data Low Medium Low Uncategorized Uncategorized 2 1 2 2 7
* Figures in red are based on the value of the lowest/highest round, given that only 2 rounds were available.

93
ICA Outcome Maps – FATA
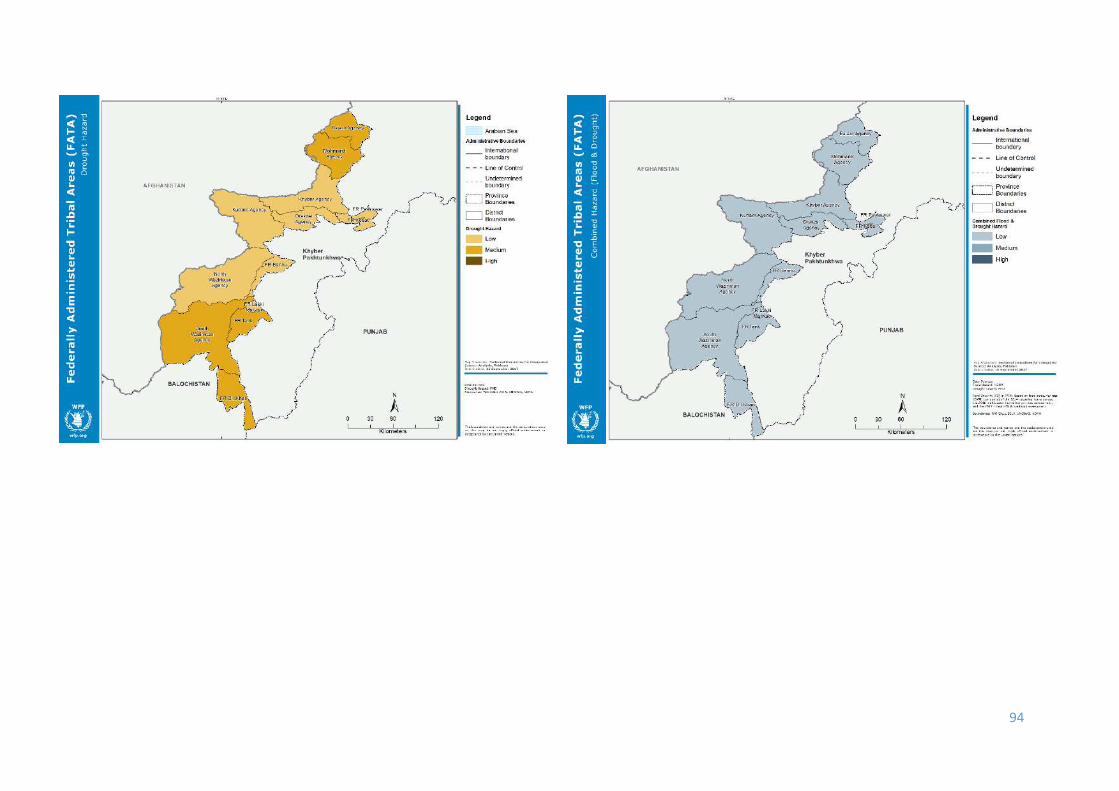
94

95

96

97
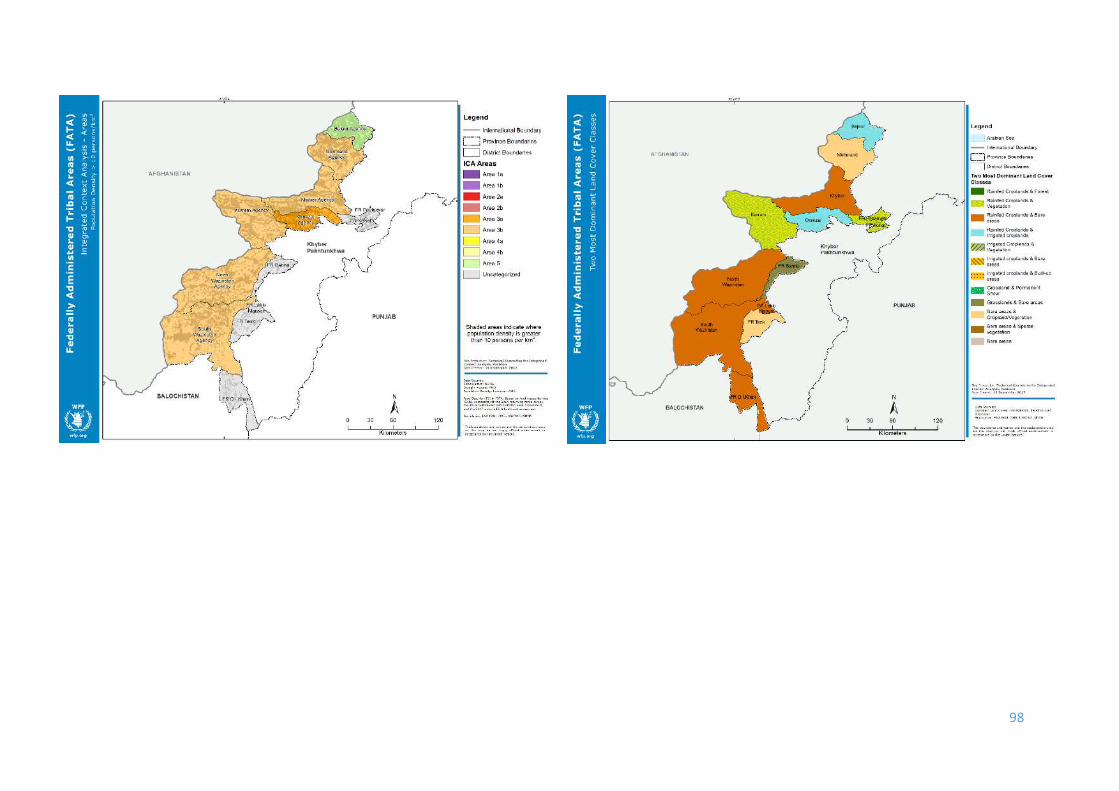
98

99

100
ICA Collecting Table – AJ&K
District
Vulnerability to Food
Insecurity Natural Hazards
ICA Areas and Categories based on combined
Vulnerability to Food Insecurity with Final Natural
Hazard classification
Estimated vulnerable population to food insecurity based on Multi-dimensional Poverty Index (MPI) = Incidence x Intensity, derived from 6 datasets of Pakistan Social and Living
Measurement surveys (2004/05, 2006/07, 2008/09, 2010/11, 2012/13, and 2014/15)
Total projected
population for 2015/16
(from Provincial Bureaux of Statistics)
Core Lenses
Classification of Recurrence
of High Vulnerability
to Food Insecurity
(MPI > 0.329): Low = 0-2
recurrences, Medium = 3-4 recurrences, High = 5-6 recurrences
Flood Hazard
Classification (NDMA)
Drought Hazard
Classification (PMD)
Combined Natural Hazard
Classification (Flood & Drought)
ICA Categories
ICA Areas
Long-term average
population vulnerable to
food insecurity
(Average of all PSLM rounds)
Estimated chronically vulnerable
population to food
insecurity (Average of 2 lowest PSLM
rounds)
Estimated highest
number of vulnerable
population to food
insecurity (Average of 2
highest PSLM
rounds)
Estimated potential
additional vulnerable
population to food insecurity in case of some
MPI dimensions significantly deteriorate
(Average of 2 highest PSLM rounds Minus
Long-term Average)
Landslide Hazard
Classification (NDMA) 1 = Very
Low/Low; 2 = Medium;
3 = High; 4 = Very High
GLOF Hazard Classification
(NDMA) 1 = Very
Low/Low; 2 = Medium;
3 = High; 4 = Very High
Earthquake Hazard
Classification (NDMA) 1 = Very
Low/Low; 2 = Medium;
3 = High; 4 = Very High
Percentage of Erosion-
Prone Surface
Area 1 = Low (< 20%);
2 = Medium
(20 - 35%); 3 = High
(35 - 50%); 4 = Very
High (> 50%)
Core Lenses:
Summary Score
Bagh No Data High Low Medium Uncategorized Uncategorized 395,000 4 1 4 4 13
Bhimber No Data Medium Low Low Uncategorized Uncategorized 467,000 2 1 2 4 9
Hattian Bala No Data High Low Medium Uncategorized Uncategorized 265,000 4 1 4 2 11
Haveli(Kahuta) No Data High Low Medium Uncategorized Uncategorized 157,000 4 1 4 3 12
Kotli No Data Low Low Low Uncategorized Uncategorized 870,000 2 1 3 4 10
Mirpur No Data Low Medium Low Uncategorized Uncategorized 473,000 3 1 2 4 10
Muzaffarabad No Data High Low Medium Uncategorized Uncategorized 726,000 4 3 4 4 15
Neelum No Data High Low Medium Uncategorized Uncategorized 201,000 4 3 4 2 13
Poonch No Data Low Low Low Uncategorized Uncategorized 599,000 4 1 3 4 12
Sudhnoti No Data Low Medium Low Uncategorized Uncategorized 313,000 3 1 3 4 11
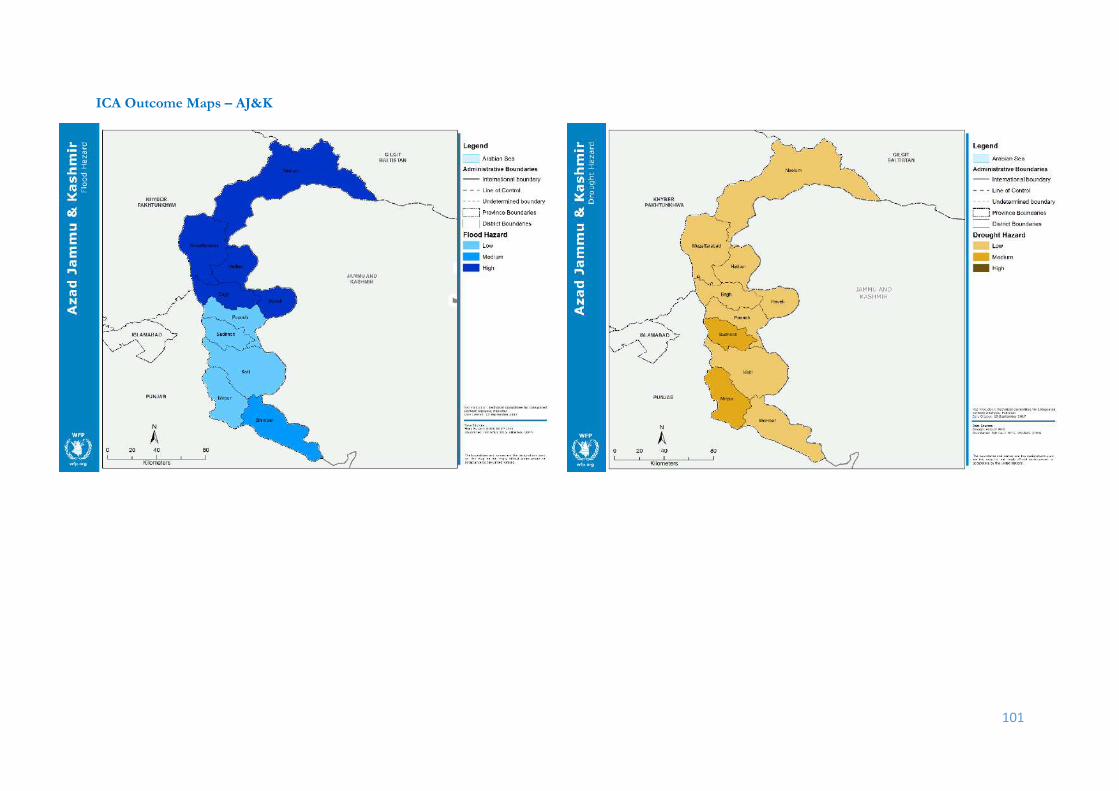
101
ICA Outcome Maps – AJ&K

102

103
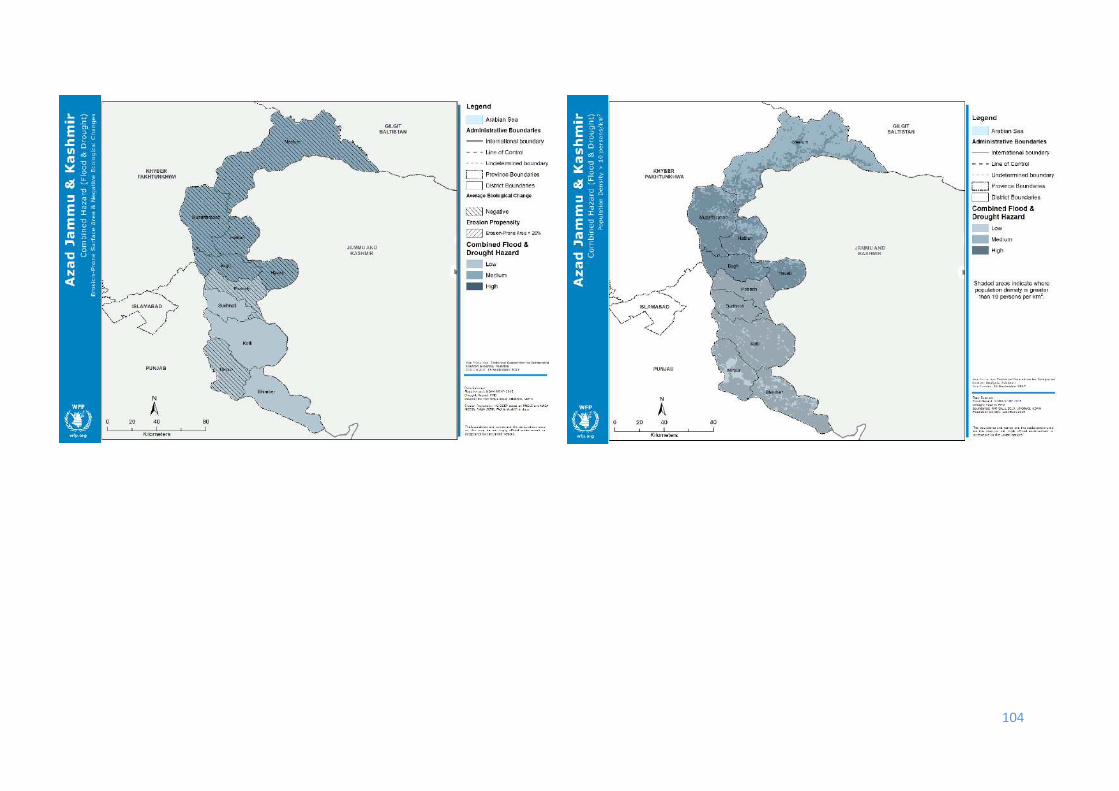
104

105

106
ICA Collecting Table – Gilgit Baltistan
District
Vulnerability to Food Insecurity
Natural Hazards
ICA Areas and Categories based on combined
Vulnerability to Food Insecurity with Final Natural
Hazard Classification
Estimated vulnerable population to food insecurity based on Multi-dimensional Poverty Index (MPI) = Incidence x Intensity, derived from 6 datasets of Pakistan Social and Living
Measurement surveys (2004/05, 2006/07, 2008/09, 2010/11, 2012/13, and 2014/15)
Total projected
population for 2015/16
(from Provincial Bureaux of Statistics)
Core Lenses
Classification of Recurrence of
High Vulnerability to Food Insecurity (MPI > 0.329):
Low = 0-2 recurrences,
Medium = 3-4 recurrences, High = 5-6 recurrences
Flood Hazard
Classification (NDMA)
Drought Hazard
Classification (PMD)
Combined Natural Hazard
Classification (Flood & Drought)
ICA Categories
ICA Areas
Long-term average
population vulnerable
to food insecurity (Average
of all PSLM
rounds)
Estimated chronically vulnerable population
to food insecurity
(Average of 2 lowest PSLM
rounds)
Estimated highest
number of vulnerable population
to food insecurity (Average
of 2 highest PSLM
rounds)
Estimated potential
additional vulnerable
population to food insecurity in case
of some MPI dimensions significantly deteriorate
(Average of 2 highest PSLM rounds Minus
Long-term Average)
Landslide Hazard
Classification (NDMA) 1 = Very
Low/Low; 2 = Medium;
3 = High; 4 = Very High
GLOF Hazard Classification
(NDMA) 1 = Very
Low/Low; 2 = Medium;
3 = High; 4 = Very High
Earthquake Hazard
Classification (NDMA) 1 = Very
Low/Low; 2 = Medium;
3 = High; 4 = Very High
Percentage of Erosion-
Prone Surface Area
1 = Low (< 20%);
2 = Medium (20 - 35%); 3 = High
(35 - 50%); 4 = Very
High (> 50%)
Core Lenses:
Summary Score
Astore No Data Medium Low Low Uncategorized Uncategorized 3 3 3 1 10
Gilgit No Data High Low Medium Uncategorized Uncategorized 3 3 3 1 10
Ghizer No Data High Low Medium Uncategorized Uncategorized 3 3 3 2 11
Shigar No Data High Low Medium Uncategorized Uncategorized 3 4 3 1 11
Diamir No Data High Low Medium Uncategorized Uncategorized 4 3 3 2 12
Ghanche No Data High Medium High Uncategorized Uncategorized 3 4 3 2 12
Skardu No Data High Medium High Uncategorized Uncategorized 3 4 3 2 12
Nagar No Data High Low Medium Uncategorized Uncategorized 4 4 3 2 13
Kharmang No Data High Medium High Uncategorized Uncategorized 3 4 3 3 13
Hunza No Data High Low Medium Uncategorized Uncategorized 4 4 3 3 14

107
ICA Outcome Maps – Gilgit Baltistan
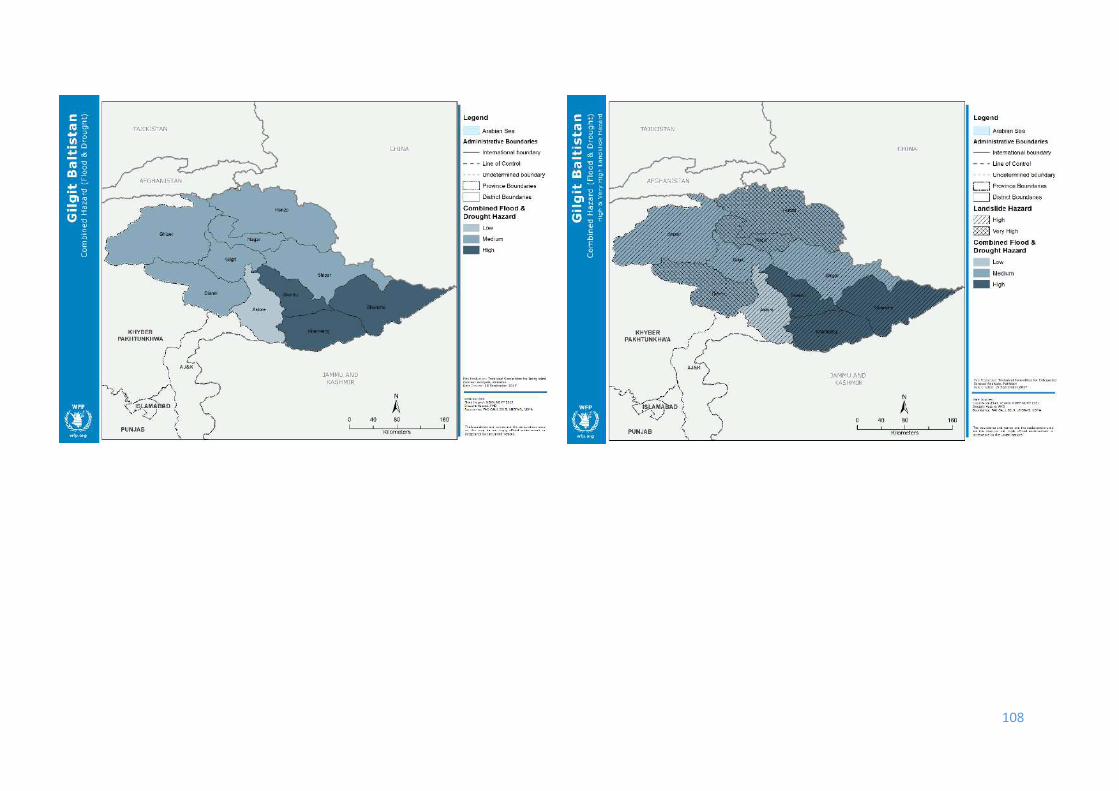
108

109

110

111

112
Annex IV - Percentage Contribution of Indicators in MPI, 2014/15
Percentage Contribution of Indicators to the National, Rural/Urban, Provincial and Regional MPI, 2014/15
Education Health Standard of Living
Years of schooling
School Attendance
Educational quality
Access to health
facilities
Full immunisation
Ante-natal care
Assisted delivery
Improved walls
Overcrowding Electricity Sanitation Water Cooking
Fuel Assets
Land & Livestock
National 29.7% 10.5% 2.6% 19.8% 2.2% 1.9% 1.8% 1.9% 2.6% 1.4% 5.3% 1.7% 8.5% 6.3% 3.8%
Rural 29.2% 10.0% 2.5% 20.3% 2.1% 1.9% 1.8% 1.9% 2.5% 1.4% 5.6% 1.7% 8.7% 6.2% 4.1%
Urban 36.9% 17.0% 3.0% 12.5% 3.3% 2.5% 2.1% 1.2% 3.6% 0.4% 2.2% 1.3% 6.3% 7.7% 0.0%
Punjab 31.1% 9.7% 2.3% 21.5% 2.0% 1.7% 1.3% 1.2% 2.8% 1.3% 5.0% 0.5% 9.2% 6.8% 3.7%
Sindh 28.1% 11.9% 2.9% 16.7% 2.0% 1.9% 2.3% 2.7% 3.1% 1.6% 6.2% 1.5% 7.8% 7.3% 4.0%
KP 29.3% 9.7% 2.5% 21.4% 2.5% 2.2% 2.1% 1.3% 1.9% 0.7% 3.9% 3.7% 8.5% 6.0% 4.3%
Balochistan 28.3% 11.5% 3.1% 17.3% 2.6% 2.4% 2.2% 3.3% 1.4% 2.0% 6.9% 4.1% 7.3% 4.8% 2.8%
FATA 35.5% 16.0% 1.1% 8.9% 4.5% 0.3% 1.7% 4.6% 1.2% 1.7% 1.3% 6.3% 4.9% 6.6% 5.4%

113
Percentage Contribution of Indicators to Districts’ MPI, 2014/15
District
Education Health Standard of Living
Years of schooling
School Attendance
Educational quality
Access to health
facilities
Full immunisation
Ante-natal care
Assisted delivery
Improved walls
Overcrowding Electricity Sanitation Water Cooking
Fuel Assets
Land & Livestock
Abbottabad 30.64% 2.25% 1.58% 29.65% 0.76% 1.54% 0.79% 0.82% 1.10% 0.25% 2.78% 3.52% 9.55% 8.37% 6.40%
Attock 40.07% 7.62% 1.54% 6.00% 2.24% 2.20% 2.32% 0.45% 2.12% 1.83% 6.22% 3.11% 10.81% 7.79% 5.69%
Awaran 25.70% 11.66% 1.05% 13.95% 1.56% 1.16% 1.42% 3.35% 1.31% 6.45% 8.82% 4.15% 8.81% 6.84% 3.77%
Badin 25.96% 9.68% 1.84% 20.60% 1.45% 1.21% 1.35% 3.26% 2.68% 2.94% 7.59% 0.71% 8.01% 7.49% 5.23%
Bahawalnagar 31.62% 8.77% 2.54% 22.65% 1.91% 1.60% 1.15% 1.72% 2.63% 1.96% 4.26% 0.59% 9.76% 6.61% 2.22%
Bahawalpur 30.13% 10.93% 2.37% 23.20% 1.96% 1.29% 1.87% 1.30% 2.55% 1.72% 4.61% 0.12% 8.98% 6.59% 2.37%
Bannu 30.65% 11.98% 0.89% 23.25% 2.80% 3.55% 1.29% 1.93% 1.53% 0.04% 3.75% 0.18% 8.98% 4.00% 5.18%
Barkhan 24.34% 9.99% 5.58% 24.24% 1.78% 1.56% 2.82% 2.83% 0.15% 3.34% 5.13% 5.59% 6.92% 3.93% 1.81%
Batagram 26.77% 10.86% 3.61% 21.21% 3.01% 3.02% 3.06% 0.20% 1.51% 1.12% 3.30% 3.59% 8.44% 7.27% 3.02%
Bhakkar 30.44% 6.66% 2.01% 27.28% 2.06% 1.94% 0.58% 1.39% 2.04% 1.17% 6.83% 0.00% 9.54% 5.95% 2.11%
Bolan/Kachhi 27.11% 10.98% 2.82% 13.64% 2.17% 2.56% 1.92% 4.03% 1.80% 0.90% 8.02% 7.16% 8.17% 6.12% 2.59%
Buner 29.90% 9.14% 2.00% 20.15% 2.36% 1.78% 2.10% 0.86% 2.33% 1.39% 4.53% 4.81% 9.14% 5.87% 3.62%
Chagai 26.73% 10.03% 3.81% 11.57% 1.66% 1.88% 1.10% 3.75% 0.88% 6.23% 7.35% 6.58% 7.70% 5.90% 4.86%
Chakwal 32.92% 4.15% 1.24% 24.79% 1.65% 1.14% 1.04% 0.73% 0.85% 2.35% 4.67% 2.57% 10.51% 7.37% 4.01%
Charsadda 33.50% 8.67% 1.01% 17.99% 2.89% 2.17% 2.06% 2.02% 2.66% 0.07% 4.23% 2.53% 8.29% 5.72% 6.19%
Chiniot 32.74% 10.22% 2.55% 18.63% 1.84% 0.91% 1.65% 0.65% 2.80% 0.69% 7.13% 0.02% 9.57% 7.31% 3.31%
Chitral 29.52% 5.99% 2.13% 22.66% 1.17% 1.40% 3.11% 3.28% 1.50% 0.08% 1.78% 3.65% 10.61% 9.39% 3.73%
D.G. Khan 28.12% 12.40% 2.72% 19.10% 2.98% 2.28% 1.51% 3.24% 1.87% 0.81% 5.48% 2.94% 8.50% 5.03% 3.03%
D.I. Khan 27.99% 11.71% 2.69% 19.70% 2.44% 2.45% 2.67% 2.38% 2.32% 2.22% 5.73% 1.07% 8.52% 6.08% 2.02%
Dadu 21.95% 6.88% 4.29% 26.75% 2.36% 2.89% 3.35% 2.51% 3.44% 0.17% 7.72% 1.26% 7.32% 5.84% 3.27%
Dera Bugti 29.53% 14.62% 4.24% 0.63% 2.56% 3.88% 4.39% 3.86% 2.97% 2.39% 7.54% 5.68% 6.62% 5.84% 5.26%
Faisalabad 34.42% 8.59% 2.82% 17.21% 1.50% 1.98% 1.48% 0.27% 3.47% 0.24% 3.14% 1.50% 8.88% 8.61% 5.89%
Gawadar 32.29% 8.93% 2.52% 19.18% 1.85% 2.35% 1.80% 2.26% 1.06% 1.54% 7.93% 1.84% 9.23% 3.97% 3.27%
Ghotki 30.37% 16.24% 3.52% 11.11% 2.74% 2.60% 3.25% 2.42% 3.76% 0.53% 4.73% 0.05% 8.03% 6.99% 3.66%
Gujranwala 34.45% 8.84% 2.68% 19.48% 2.99% 2.14% 1.86% 0.27% 3.09% 0.35% 2.59% 0.00% 6.94% 6.93% 7.40%
Gujrat 27.99% 3.66% 0.96% 35.09% 1.08% 1.22% 1.91% 0.11% 2.86% 0.00% 3.06% 0.00% 8.52% 5.67% 7.87%
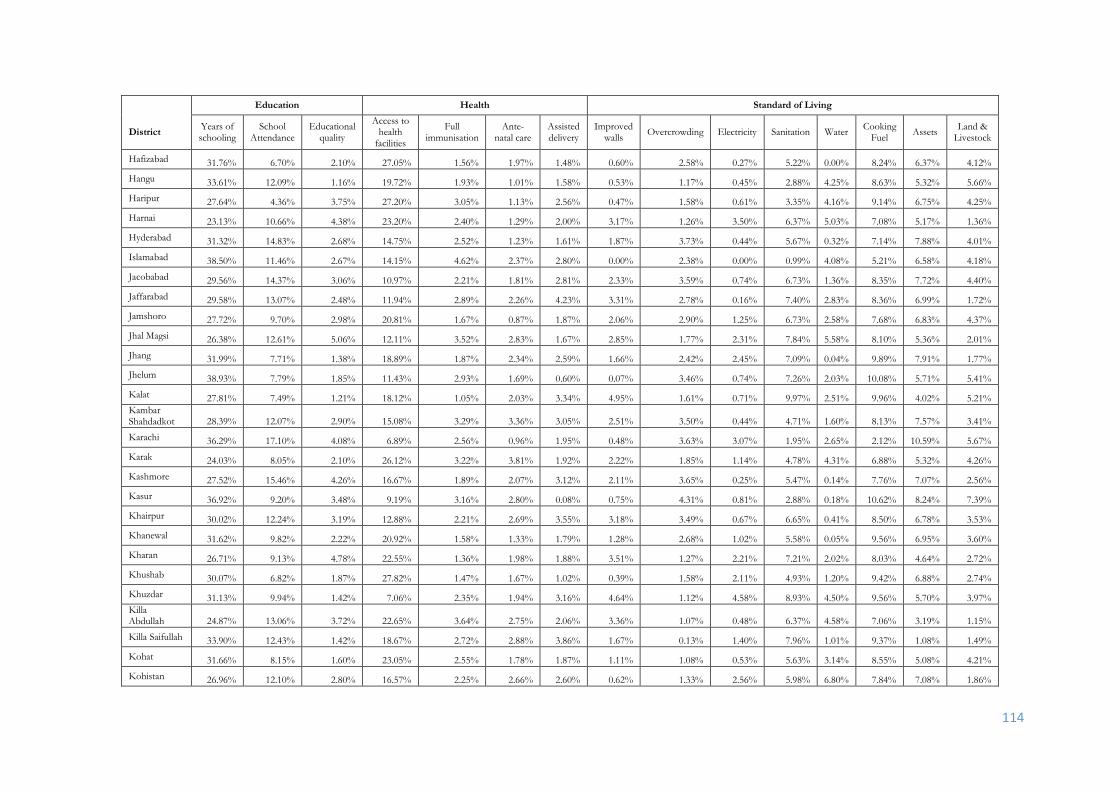
114
District
Education Health Standard of Living
Years of schooling
School Attendance
Educational quality
Access to health
facilities
Full immunisation
Ante-natal care
Assisted delivery
Improved walls
Overcrowding Electricity Sanitation Water Cooking
Fuel Assets
Land & Livestock
Hafizabad 31.76% 6.70% 2.10% 27.05% 1.56% 1.97% 1.48% 0.60% 2.58% 0.27% 5.22% 0.00% 8.24% 6.37% 4.12%
Hangu 33.61% 12.09% 1.16% 19.72% 1.93% 1.01% 1.58% 0.53% 1.17% 0.45% 2.88% 4.25% 8.63% 5.32% 5.66%
Haripur 27.64% 4.36% 3.75% 27.20% 3.05% 1.13% 2.56% 0.47% 1.58% 0.61% 3.35% 4.16% 9.14% 6.75% 4.25%
Harnai 23.13% 10.66% 4.38% 23.20% 2.40% 1.29% 2.00% 3.17% 1.26% 3.50% 6.37% 5.03% 7.08% 5.17% 1.36%
Hyderabad 31.32% 14.83% 2.68% 14.75% 2.52% 1.23% 1.61% 1.87% 3.73% 0.44% 5.67% 0.32% 7.14% 7.88% 4.01%
Islamabad 38.50% 11.46% 2.67% 14.15% 4.62% 2.37% 2.80% 0.00% 2.38% 0.00% 0.99% 4.08% 5.21% 6.58% 4.18%
Jacobabad 29.56% 14.37% 3.06% 10.97% 2.21% 1.81% 2.81% 2.33% 3.59% 0.74% 6.73% 1.36% 8.35% 7.72% 4.40%
Jaffarabad 29.58% 13.07% 2.48% 11.94% 2.89% 2.26% 4.23% 3.31% 2.78% 0.16% 7.40% 2.83% 8.36% 6.99% 1.72%
Jamshoro 27.72% 9.70% 2.98% 20.81% 1.67% 0.87% 1.87% 2.06% 2.90% 1.25% 6.73% 2.58% 7.68% 6.83% 4.37%
Jhal Magsi 26.38% 12.61% 5.06% 12.11% 3.52% 2.83% 1.67% 2.85% 1.77% 2.31% 7.84% 5.58% 8.10% 5.36% 2.01%
Jhang 31.99% 7.71% 1.38% 18.89% 1.87% 2.34% 2.59% 1.66% 2.42% 2.45% 7.09% 0.04% 9.89% 7.91% 1.77%
Jhelum 38.93% 7.79% 1.85% 11.43% 2.93% 1.69% 0.60% 0.07% 3.46% 0.74% 7.26% 2.03% 10.08% 5.71% 5.41%
Kalat 27.81% 7.49% 1.21% 18.12% 1.05% 2.03% 3.34% 4.95% 1.61% 0.71% 9.97% 2.51% 9.96% 4.02% 5.21%
Kambar Shahdadkot 28.39% 12.07% 2.90% 15.08% 3.29% 3.36% 3.05% 2.51% 3.50% 0.44% 4.71% 1.60% 8.13% 7.57% 3.41%
Karachi 36.29% 17.10% 4.08% 6.89% 2.56% 0.96% 1.95% 0.48% 3.63% 3.07% 1.95% 2.65% 2.12% 10.59% 5.67%
Karak 24.03% 8.05% 2.10% 26.12% 3.22% 3.81% 1.92% 2.22% 1.85% 1.14% 4.78% 4.31% 6.88% 5.32% 4.26%
Kashmore 27.52% 15.46% 4.26% 16.67% 1.89% 2.07% 3.12% 2.11% 3.65% 0.25% 5.47% 0.14% 7.76% 7.07% 2.56%
Kasur 36.92% 9.20% 3.48% 9.19% 3.16% 2.80% 0.08% 0.75% 4.31% 0.81% 2.88% 0.18% 10.62% 8.24% 7.39%
Khairpur 30.02% 12.24% 3.19% 12.88% 2.21% 2.69% 3.55% 3.18% 3.49% 0.67% 6.65% 0.41% 8.50% 6.78% 3.53%
Khanewal 31.62% 9.82% 2.22% 20.92% 1.58% 1.33% 1.79% 1.28% 2.68% 1.02% 5.58% 0.05% 9.56% 6.95% 3.60%
Kharan 26.71% 9.13% 4.78% 22.55% 1.36% 1.98% 1.88% 3.51% 1.27% 2.21% 7.21% 2.02% 8.03% 4.64% 2.72%
Khushab 30.07% 6.82% 1.87% 27.82% 1.47% 1.67% 1.02% 0.39% 1.58% 2.11% 4.93% 1.20% 9.42% 6.88% 2.74%
Khuzdar 31.13% 9.94% 1.42% 7.06% 2.35% 1.94% 3.16% 4.64% 1.12% 4.58% 8.93% 4.50% 9.56% 5.70% 3.97%
Killa Abdullah 24.87% 13.06% 3.72% 22.65% 3.64% 2.75% 2.06% 3.36% 1.07% 0.48% 6.37% 4.58% 7.06% 3.19% 1.15%
Killa Saifullah 33.90% 12.43% 1.42% 18.67% 2.72% 2.88% 3.86% 1.67% 0.13% 1.40% 7.96% 1.01% 9.37% 1.08% 1.49%
Kohat 31.66% 8.15% 1.60% 23.05% 2.55% 1.78% 1.87% 1.11% 1.08% 0.53% 5.63% 3.14% 8.55% 5.08% 4.21%
Kohistan 26.96% 12.10% 2.80% 16.57% 2.25% 2.66% 2.60% 0.62% 1.33% 2.56% 5.98% 6.80% 7.84% 7.08% 1.86%

115
District
Education Health Standard of Living
Years of schooling
School Attendance
Educational quality
Access to health
facilities
Full immunisation
Ante-natal care
Assisted delivery
Improved walls
Overcrowding Electricity Sanitation Water Cooking
Fuel Assets
Land & Livestock
Kohlu 27.14% 11.98% 2.91% 15.94% 0.89% 1.75% 0.72% 3.59% 1.75% 2.51% 7.86% 6.61% 8.09% 5.54% 2.72%
Lahore 42.44% 18.08% 5.12% 2.07% 5.94% 3.21% 0.49% 0.00% 5.77% 0.34% 0.11% 0.00% 3.97% 6.49% 5.96%
Lakki Marwat 28.17% 8.17% 1.70% 24.23% 3.04% 3.89% 1.80% 3.04% 1.74% 0.08% 4.03% 2.29% 9.00% 5.31% 3.48%
Larkana 31.14% 14.82% 2.52% 11.92% 2.81% 3.11% 2.72% 2.92% 3.96% 0.55% 3.90% 0.10% 7.62% 7.76% 4.15%
Lasbela 26.91% 8.59% 3.34% 19.11% 0.81% 0.64% 1.57% 2.17% 1.72% 4.10% 7.39% 5.40% 7.52% 7.12% 3.59%
Layyah 27.81% 5.73% 2.19% 29.96% 1.50% 2.37% 0.19% 1.25% 2.88% 3.21% 4.28% 0.03% 9.96% 6.66% 1.99%
Lodhran 31.14% 11.22% 1.73% 20.39% 1.19% 1.36% 0.93% 1.13% 2.50% 1.45% 6.77% 0.17% 9.58% 7.00% 3.45%
Loralai 33.88% 9.44% 1.80% 6.59% 1.98% 2.22% 0.79% 4.75% 1.32% 4.20% 8.15% 5.76% 10.10% 6.49% 2.53%
Lower Dir 30.37% 9.91% 3.63% 16.03% 2.37% 2.75% 2.50% 0.11% 2.04% 0.47% 2.93% 6.40% 10.04% 6.20% 4.25%
Malakand 30.10% 7.44% 2.35% 22.29% 2.38% 2.58% 2.55% 1.00% 1.70% 0.31% 3.40% 3.91% 9.16% 5.04% 5.78%
Mandi Bahauddin 32.32% 4.50% 0.61% 30.30% 2.05% 1.13% 1.77% 0.51% 2.27% 0.06% 3.95% 0.09% 9.50% 5.06% 5.87%
Mansehra 25.66% 6.73% 2.20% 25.33% 1.10% 1.87% 1.59% 0.60% 2.19% 0.26% 3.34% 5.04% 9.40% 8.37% 6.32%
Mardan 35.37% 7.52% 0.98% 20.24% 3.25% 1.37% 1.97% 1.97% 2.45% 0.30% 3.96% 1.26% 8.94% 5.33% 5.06%
Mastung 26.01% 8.16% 0.99% 14.54% 2.74% 2.55% 3.92% 4.13% 2.43% 2.97% 9.46% 1.50% 9.57% 5.68% 5.34%
Matiari 28.95% 11.28% 1.63% 18.69% 1.84% 1.06% 1.28% 2.45% 3.23% 0.94% 8.05% 0.01% 7.85% 7.38% 5.34%
Mianwali 27.94% 7.03% 2.71% 28.63% 1.30% 1.65% 0.89% 0.91% 1.62% 2.00% 4.60% 1.94% 9.19% 5.78% 3.80%
Mirpurkhas 26.63% 10.28% 2.60% 20.04% 1.27% 2.01% 2.30% 3.12% 2.64% 2.24% 5.04% 2.53% 7.86% 6.92% 4.52%
Multan 31.14% 11.77% 1.67% 19.76% 1.61% 1.71% 1.76% 1.25% 2.72% 0.67% 5.45% 0.20% 9.07% 6.75% 4.47%
Musakhel 30.43% 11.77% 1.63% 12.51% 2.14% 1.86% 0.47% 3.81% 0.95% 3.77% 5.48% 6.90% 9.03% 6.94% 2.31%
Muzaffargarh 29.22% 9.87% 2.61% 23.19% 1.61% 1.19% 0.97% 1.58% 2.75% 1.30% 5.94% 0.13% 8.96% 7.01% 3.68%
Nankana Sahib 33.48% 9.13% 2.95% 15.90% 1.87% 1.19% 0.46% 0.92% 3.24% 1.18% 4.92% 0.91% 10.30% 8.20% 5.36%
Narowal 27.85% 5.91% 0.42% 30.43% 2.85% 3.62% 0.08% 0.12% 2.75% 0.09% 4.24% 0.12% 10.70% 6.59% 4.23%
Nasirabad 30.40% 15.36% 2.21% 7.47% 3.00% 2.38% 2.73% 3.58% 1.83% 1.77% 8.05% 4.79% 8.51% 6.60% 1.31%
Naushehro Feroze 22.24% 11.11% 4.17% 25.31% 2.17% 1.97% 2.16% 2.51% 3.53% 0.50% 5.78% 0.29% 8.81% 5.58% 3.85%
Nawabshah/ Shaheed Benazirabad 28.51% 10.87% 2.99% 25.53% 1.10% 1.55% 0.09% 2.47% 2.89% 0.22% 6.79% 0.06% 7.46% 6.19% 3.27%
Nowshehra 33.21% 9.50% 2.03% 24.08% 1.98% 1.23% 2.24% 0.56% 2.05% 0.00% 2.46% 2.36% 6.09% 5.01% 7.22%

116
District
Education Health Standard of Living
Years of schooling
School Attendance
Educational quality
Access to health
facilities
Full immunisation
Ante-natal care
Assisted delivery
Improved walls
Overcrowding Electricity Sanitation Water Cooking
Fuel Assets
Land & Livestock
Nushki 31.67% 13.70% 2.55% 15.95% 2.86% 3.18% 1.57% 3.06% 0.90% 1.68% 7.75% 1.01% 7.67% 3.72% 2.72%
Okara 32.85% 7.54% 1.65% 24.76% 1.77% 2.32% 0.20% 0.92% 2.87% 0.35% 3.88% 0.00% 9.53% 7.22% 4.13%
Pakpattan 35.41% 10.12% 1.12% 14.25% 2.18% 2.47% 0.49% 1.50% 3.24% 0.77% 5.74% 0.15% 10.62% 7.82% 4.13%
Peshawar 32.16% 12.85% 1.82% 17.95% 3.18% 1.75% 1.92% 2.25% 2.61% 0.36% 3.72% 2.73% 6.18% 4.70% 5.84%
Pishin 27.41% 11.09% 2.12% 25.65% 3.43% 3.08% 2.87% 3.90% 1.03% 0.62% 5.58% 1.60% 5.35% 2.71% 3.55%
Quetta 33.30% 10.46% 3.87% 25.35% 3.81% 3.36% 0.73% 2.32% 1.20% 0.46% 3.32% 2.34% 1.75% 3.72% 4.01%
Rahim Yar Khan 29.92% 12.86% 2.85% 20.35% 2.08% 1.32% 1.31% 1.47% 3.19% 1.33% 5.12% 0.25% 9.05% 6.48% 2.43%
Rajanpur 28.39% 12.51% 3.35% 18.13% 1.33% 1.33% 1.40% 2.70% 2.33% 3.39% 6.10% 2.08% 8.52% 6.71% 1.73%
Rawalpindi 32.61% 10.41% 1.86% 17.17% 3.33% 0.64% 2.81% 1.02% 2.21% 0.49% 4.10% 4.58% 7.61% 4.86% 6.30%
Sahiwal 33.32% 10.88% 0.58% 19.28% 2.00% 1.52% 0.10% 0.46% 2.98% 1.49% 5.77% 0.00% 10.34% 6.85% 4.43%
Sanghar 26.99% 10.54% 2.54% 24.00% 1.26% 1.13% 0.83% 2.66% 2.80% 1.11% 5.59% 0.24% 7.88% 6.83% 5.60%
Sarghodha 31.43% 5.80% 0.88% 28.69% 1.53% 1.62% 0.92% 0.66% 2.26% 0.79% 4.58% 0.30% 9.18% 6.06% 5.32%
Shangla 29.37% 13.03% 4.38% 16.26% 2.66% 1.54% 2.93% 0.06% 1.55% 0.26% 3.37% 5.41% 8.72% 7.88% 2.59%
Sheikhupura 34.74% 9.02% 3.07% 18.29% 1.91% 1.47% 0.56% 0.19% 3.40% 0.42% 1.87% 0.21% 8.87% 8.14% 7.84%
Sherani 28.18% 9.38% 1.19% 20.75% 0.24% 0.42% 0.00% 1.59% 1.71% 2.61% 6.52% 7.04% 8.16% 7.46% 4.74%
Shikarpur 29.10% 14.22% 3.58% 12.68% 3.08% 2.10% 2.87% 2.64% 3.62% 0.26% 5.61% 0.00% 8.07% 7.44% 4.74%
Sialkot 24.06% 6.14% 1.54% 34.05% 2.65% 3.87% 0.65% 0.00% 3.18% 0.13% 1.52% 0.00% 8.77% 5.38% 8.07%
Sibi 27.87% 13.63% 3.88% 11.45% 1.86% 1.88% 1.41% 3.99% 1.75% 3.79% 6.40% 5.69% 7.27% 6.20% 2.93%
Sujawal 29.00% 9.00% 3.24% 11.02% 1.28% 0.71% 1.88% 3.47% 2.80% 4.96% 8.14% 3.29% 8.43% 7.85% 4.92%
Sukkur 32.34% 17.18% 3.78% 6.11% 3.39% 1.69% 3.18% 2.76% 4.26% 0.58% 5.80% 0.56% 8.07% 6.93% 3.36%
Swabi 31.44% 7.11% 2.22% 25.97% 0.59% 1.08% 1.12% 1.23% 1.62% 0.16% 2.63% 3.78% 9.43% 5.33% 6.30%
Swat 27.94% 7.71% 2.22% 26.91% 2.16% 1.54% 2.14% 0.18% 1.84% 0.17% 2.50% 3.60% 9.61% 6.93% 4.54%
T.T. Singh 34.80% 8.22% 1.41% 19.45% 1.94% 1.67% 2.74% 0.72% 2.92% 0.38% 4.71% 0.16% 9.79% 7.66% 3.43%
Tando Allahyar 28.66% 12.15% 2.02% 19.32% 1.45% 1.82% 1.25% 2.57% 3.02% 0.64% 7.20% 0.11% 6.30% 7.45% 6.05%
Tando Muhammad Khan 26.81% 11.39% 2.23% 19.79% 1.77% 1.76% 1.11% 3.05% 2.73% 1.75% 6.17% 0.30% 7.75% 7.64% 5.75%
Tank 26.21% 14.35% 3.26% 15.65% 3.74% 2.67% 2.11% 3.65% 2.15% 0.46% 6.03% 4.48% 8.72% 3.61% 2.91%
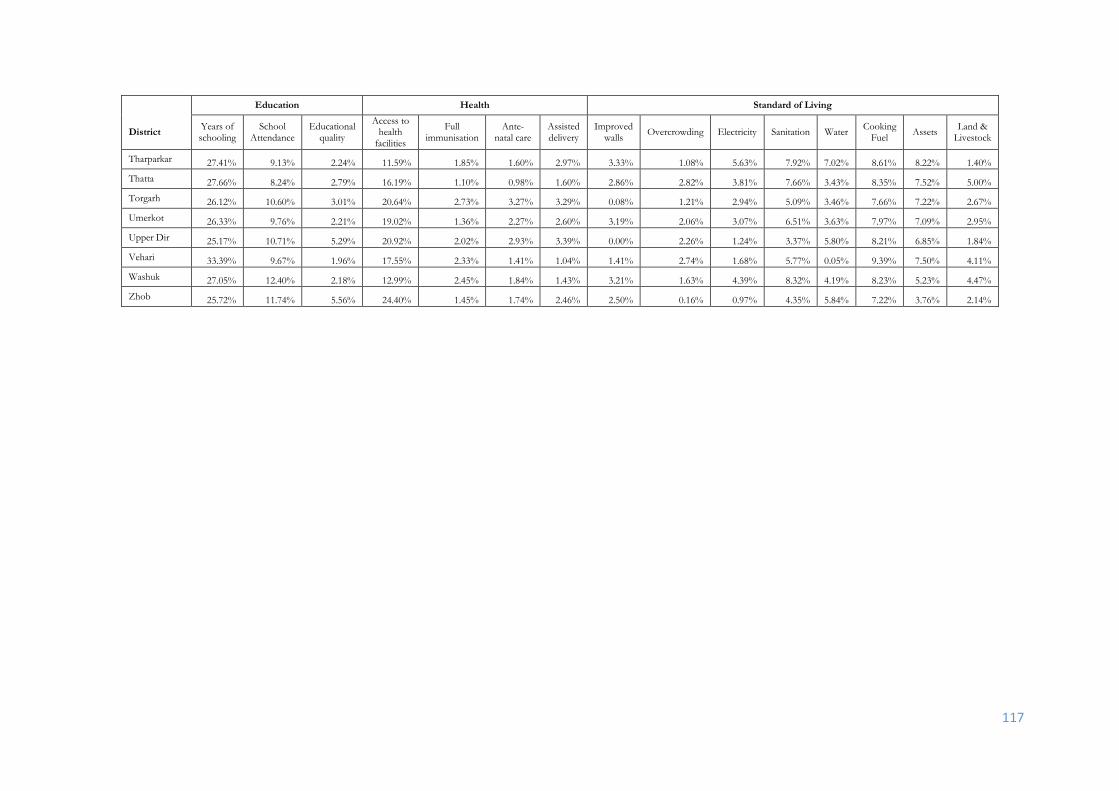
117
District
Education Health Standard of Living
Years of schooling
School Attendance
Educational quality
Access to health
facilities
Full immunisation
Ante-natal care
Assisted delivery
Improved walls
Overcrowding Electricity Sanitation Water Cooking
Fuel Assets
Land & Livestock
Tharparkar 27.41% 9.13% 2.24% 11.59% 1.85% 1.60% 2.97% 3.33% 1.08% 5.63% 7.92% 7.02% 8.61% 8.22% 1.40%
Thatta 27.66% 8.24% 2.79% 16.19% 1.10% 0.98% 1.60% 2.86% 2.82% 3.81% 7.66% 3.43% 8.35% 7.52% 5.00%
Torgarh 26.12% 10.60% 3.01% 20.64% 2.73% 3.27% 3.29% 0.08% 1.21% 2.94% 5.09% 3.46% 7.66% 7.22% 2.67%
Umerkot 26.33% 9.76% 2.21% 19.02% 1.36% 2.27% 2.60% 3.19% 2.06% 3.07% 6.51% 3.63% 7.97% 7.09% 2.95%
Upper Dir 25.17% 10.71% 5.29% 20.92% 2.02% 2.93% 3.39% 0.00% 2.26% 1.24% 3.37% 5.80% 8.21% 6.85% 1.84%
Vehari 33.39% 9.67% 1.96% 17.55% 2.33% 1.41% 1.04% 1.41% 2.74% 1.68% 5.77% 0.05% 9.39% 7.50% 4.11%
Washuk 27.05% 12.40% 2.18% 12.99% 2.45% 1.84% 1.43% 3.21% 1.63% 4.39% 8.32% 4.19% 8.23% 5.23% 4.47%
Zhob 25.72% 11.74% 5.56% 24.40% 1.45% 1.74% 2.46% 2.50% 0.16% 0.97% 4.35% 5.84% 7.22% 3.76% 2.14%
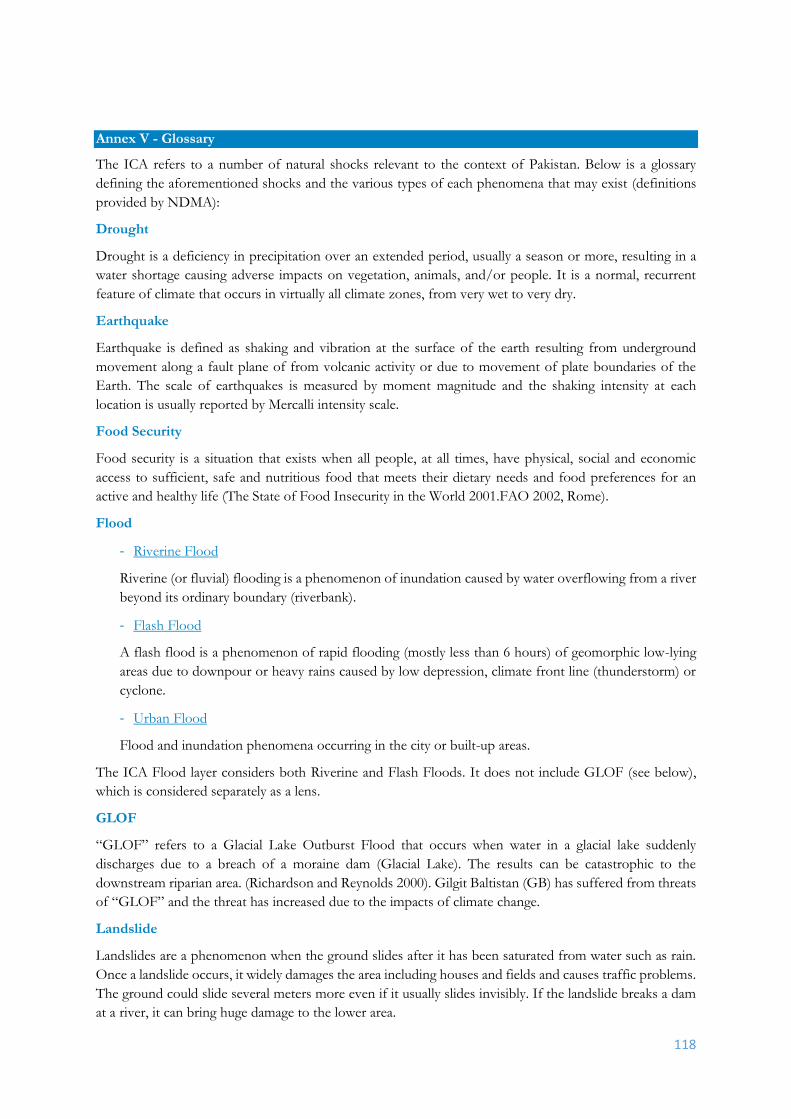
118
Annex V - Glossary
The ICA refers to a number of natural shocks relevant to the context of Pakistan. Below is a glossary
defining the aforementioned shocks and the various types of each phenomena that may exist (definitions
provided by NDMA):
Drought
Drought is a deficiency in precipitation over an extended period, usually a season or more, resulting in a
water shortage causing adverse impacts on vegetation, animals, and/or people. It is a normal, recurrent
feature of climate that occurs in virtually all climate zones, from very wet to very dry.
Earthquake
Earthquake is defined as shaking and vibration at the surface of the earth resulting from underground
movement along a fault plane of from volcanic activity or due to movement of plate boundaries of the
Earth. The scale of earthquakes is measured by moment magnitude and the shaking intensity at each
location is usually reported by Mercalli intensity scale.
Food Security
Food security is a situation that exists when all people, at all times, have physical, social and economic
access to sufficient, safe and nutritious food that meets their dietary needs and food preferences for an
active and healthy life (The State of Food Insecurity in the World 2001.FAO 2002, Rome).
Flood
- Riverine Flood
Riverine (or fluvial) flooding is a phenomenon of inundation caused by water overflowing from a river
beyond its ordinary boundary (riverbank).
- Flash Flood
A flash flood is a phenomenon of rapid flooding (mostly less than 6 hours) of geomorphic low-lying
areas due to downpour or heavy rains caused by low depression, climate front line (thunderstorm) or
cyclone.
- Urban Flood
Flood and inundation phenomena occurring in the city or built-up areas.
The ICA Flood layer considers both Riverine and Flash Floods. It does not include GLOF (see below),
which is considered separately as a lens.
GLOF
“GLOF” refers to a Glacial Lake Outburst Flood that occurs when water in a glacial lake suddenly
discharges due to a breach of a moraine dam (Glacial Lake). The results can be catastrophic to the
downstream riparian area. (Richardson and Reynolds 2000). Gilgit Baltistan (GB) has suffered from threats
of “GLOF” and the threat has increased due to the impacts of climate change.
Landslide
Landslides are a phenomenon when the ground slides after it has been saturated from water such as rain.
Once a landslide occurs, it widely damages the area including houses and fields and causes traffic problems.
The ground could slide several meters more even if it usually slides invisibly. If the landslide breaks a dam
at a river, it can bring huge damage to the lower area.
119