
On utrocular discrimination - Springer · Camisa and William Martens for their many hours of...
16
Perception & Psychophysics 1979, Vol. 26 (1), 53-68 On utrocular discrimination RANDOLPH BLAKE Cresap Neuroscience Laboratory, Evanston, Illinois 60201 and ROBERT H. CORMACK New Mexico Institute of Mining and Technology, Socorro, New Mexico 87801 Observers with good stereoacuity judged which eye received sine-wave grating patterns in a two-category forced-choice procedure. Large individual differences were found, but for most observers reliable discrimination was achieved at low spatial frequencies. No observer could perform the task above chance levels at high spatial frequencies. Discrimination was unaffected by retinal location, grating orientation, grating contrast, stimulus duration, or practice with feedback. Among observers who could perform the task, the following results were obtained: (1)Introduction of high spatial frequency components did not interfere with performance so long as a low spatial frequency component was present. (2)When gratings of low equal spatial frequency were presented to both eyes simultaneously at different contrast levels, observers could identify which eye received the higher contrast. (3)At low spatial frequencies, observers could distinguish monocular from binocular presentation. (4)Temporal frequency variations (counterphase flicker) influenced performance for some observers. Binocular summation and interocular transfer were unaffected by the spatial frequency variations which modulate utrocular discrimination. A new procedure for measuring stereopsis was developed which made possible comparison of utrocular discrimination with stereopsis at specific spatial frequencies. Stereopsis appeared mildly affected by spatial frequency. When queried, most people claim that it is impos- sible to tell with which eye they are actually seeing when both eyes are open. Typically, the question is met with puzzlement, for common experience tells us that we are seeing with both eyes, simultaneously. Yet there are some individuals who report the knack of seeing with one eye alone without evidencing any noticeable change in the posture of the "blind eye." These individuals quite frequently have histories of disturbances in binocular vision, such as strabismus early in life, and typically perform poorly on tasks requiring stereoscopic depth perception, a condition referred to as stereoblind. Byanalogy with stereoblind animals (Blake & Hirsch, 1975; Packwood & Gordon, 1975), Lema and Blake (1977) speculated that such people might have predominantly monocular neurons in the visual cortex in place of the full complement of cortical binocular neurons which most of use pre- sumably possess. To test this speculation, we (Blake & Cormack, 1979) measured utrocular discrimination' in normal This research was supported by grants from NSF (BNS 75-17073) and NIH (EYOI596). We are grateful to Robert Fox, RandalI Overton, and Robert Sekuler for helpful discussion and to John Camisa and William Martens for their many hours of generous service as observers. Requests for reprints should be sent to Randolph Blake, Cresap Neuroscience Laboratory, Northwestern 'University, Evanston, Illinois 60201. Copyright 1979 Psychonomic Society, Inc. 53 and stereoblind human observers. Our results con-. firmed that stereoblind humans could reliably report which one of the two eyes had received visual stim- ulation under conditions which rendered the perform- ance of normal observers unreliable. Somewhat to our surprise, however, we also found that under cer- tain conditions many normal observers with excellent stereopsis could make accurate utrocular judgments, too, just as well as the stereoblind individuals. In- trigued by this latter finding, we proceeded to study utrocular performance of normal observers in fur- ther detail, the aim being to gain some further under- standing about the workings of the binocular visual system. The results from these experiments are re- ported here. This paper begins with a review of the meager literature on the problem of utrocular discrimination. Next, we expand on the neurophysiological specula- tions which have guided our thinking about the pos- sible bases of utrocular discrimination. In Part 1 of the results, we examine the stimulus conditions which influence the ability of normal observers to judge ac- curately which of the two eyes has received stimula- tion. In Part 2, we attempt to relate our findings to performance on other psychophysical tasks involving binocular vision. We conclude by exploring the methodological and theoretical implications of our findings. 0031-5117/79/070053-16$01.85/0
Transcript of On utrocular discrimination - Springer · Camisa and William Martens for their many hours of...

Perception & Psychophysics1979, Vol. 26 (1), 53-68
On utrocular discrimination
RANDOLPH BLAKECresap Neuroscience Laboratory, Evanston, Illinois 60201
and
ROBERT H. CORMACKNew Mexico Institute ofMining and Technology, Socorro, New Mexico 87801
Observers with good stereoacuity judged which eye received sine-wave grating patterns ina two-category forced-choice procedure. Large individual differences were found, but for mostobservers reliable discrimination was achieved at low spatial frequencies. No observer couldperform the task above chance levels at high spatial frequencies. Discrimination was unaffectedby retinal location, grating orientation, grating contrast, stimulus duration, or practice withfeedback. Among observers who could perform the task, the following results were obtained:(1) Introduction of high spatial frequency components did not interfere with performance solong as a low spatial frequency component was present. (2) When gratings of low equal spatialfrequency were presented to both eyes simultaneously at different contrast levels, observerscould identify which eye received the higher contrast. (3) At low spatial frequencies, observerscould distinguish monocular from binocular presentation. (4) Temporal frequency variations(counterphase flicker) influenced performance for some observers. Binocular summation andinterocular transfer were unaffected by the spatial frequency variations which modulateutrocular discrimination. A new procedure for measuring stereopsis was developed which madepossible comparison of utrocular discrimination with stereopsis at specific spatial frequencies.Stereopsis appeared mildly affected by spatial frequency.
When queried, most people claim that it is impossible to tell with which eye they are actually seeingwhen both eyes are open. Typically, the question ismet with puzzlement, for common experiencetells usthat we are seeing with both eyes, simultaneously.Yet there are some individuals who report the knackof seeing with one eye alone without evidencing anynoticeable change in the posture of the "blind eye."These individuals quite frequently have histories ofdisturbances in binocular vision, such as strabismusearly in life, and typically perform poorly on tasksrequiring stereoscopic depth perception, a conditionreferred to as stereoblind. By analogy with stereoblindanimals (Blake& Hirsch, 1975; Packwood & Gordon,1975), Lema and Blake (1977) speculated that suchpeople might have predominantly monocular neuronsin the visual cortex in place of the full complementof cortical binocular neurons which most of use presumably possess.
To test this speculation, we (Blake & Cormack,1979) measured utrocular discrimination' in normal
This research was supported by grants from NSF (BNS 75-17073)and NIH (EYOI596). We are grateful to Robert Fox, RandalIOverton, and Robert Sekuler for helpful discussion and to JohnCamisa and William Martens for their many hours of generousservice as observers. Requests for reprints should be sent toRandolph Blake, Cresap Neuroscience Laboratory, Northwestern'University, Evanston, Illinois 60201.
Copyright 1979 Psychonomic Society, Inc. 53
and stereoblind human observers. Our results con-.firmed that stereoblind humans could reliably reportwhich one of the two eyes had received visual stimulation under conditions which rendered the performance of normal observers unreliable. Somewhat toour surprise, however, we also found that under certain conditions many normal observers with excellentstereopsis could make accurate utrocular judgments,too, just as well as the stereoblind individuals. Intrigued by this latter finding, we proceeded to studyutrocular performance of normal observers in further detail, the aim being to gain some further understanding about the workings of the binocular visualsystem. The results from these experiments are reported here.
This paper begins with a review of the meagerliterature on the problem of utrocular discrimination.Next, we expand on the neurophysiological speculations which have guided our thinking about the possible bases of utrocular discrimination. In Part 1 ofthe results, we examine the stimulus conditions whichinfluence the ability of normal observers to judge accurately which of the two eyes has received stimulation. In Part 2, we attempt to relate our findings toperformance on other psychophysical tasks involvingbinocular vision. We conclude by exploring themethodological and theoretical implications of ourfindings.
0031-5117/79/070053-16$01.85/0

54 BLAKE ANDCORMACK
BackgroundInterest in the problem of utrocular discrimination
originally emerged within the context of theories ofstereopsis. Prior to the discovery of disparity-selectivebinocular neurons, it was fashionable to speak ofstereopsis in terms of the combination of two distinctcortical images, themselves the projections from thetwo eyes. Now, in order to distinguish crossed fromuncrossed disparities, it would be necessary for thebrain to preserve and somehow code eye-of-origin information; otherwise, stereopsis would be ambiguouswithin the scheme of these so-called projectiontheories (Gregory, 1978).
The discovery of binocular cortical neurons withdifferent preferred disparities (Barlow, Blakemore, &Pettigrew, 1967; Nikara, Bishop, & Pettigrew, 1968)has changed the way we think about stereopsis. It nolonger is necessary to deal with the eye-of-originproblem, for the sign of the disparity (crossed vs.uncrossed) is an inherent property of the receptivefield layout of binocular neurons. Unlike the earlierimage projection theories, models of stereopsis basedon disparity detectors do not require that eye-of-origininformation be retained within the visual nervoussystem. As a consequence of this new way of thinkingabout binocular interaction, the problem of utroculardiscrimination has been relegated to the sidelines andhas received little theoretical or empirical attention.In this paper, we hope to demonstrate that utroculardiscrimination still offers a fruitful means for learningabout binocular neural interaction.
Turning now to prior studies of utrocular discrimination, we are aware of only a few studies (Barrett& Williams, 1965; Enoch, Goldmann, & Sunga, 1969;Pickersgill, 1961; Smith, 1945; Thelin & Altman,1929) that have dealt with utrocular discriminationin this century. All these studies employed the samebasic approach, whereby a stimulus is presented tojust one eye without informing the observer whicheye will actually receive it. The observer is required toreport which of the two eyes "saw" the stimulus, andabove-chance performance over a series of trials istaken as evidence for utrocular discrimination." Withone exception (Barrett & Williamson, 1965), the stimuli in these experiments have consisted of smallspots of light which appeared against a dim, sometimes dark, background; the study by Barrett andWilliamson (1965) employed real, three-dimensionalobjects. Of the five studies, only the one by Enochet aI. (1969) was designed to eliminate or controlmany of those extraneous cues which could enable aclever observer to distinguish which eye was stimulated. Such potentially confounding cues can arisefrom astigmatism, chromatic aberration, fixationdisparity, or anisotropies in acuity between the twoeyes, not to mention subtle differences between thephysical stimuli presented to the left eye vs. right eye.
The following summary of findings therefore reliesheavily on the work of Enoch et aI. and applies onlyto the case of briefly flashed spots of light.
There seems to be the consensus that some, but notall, normal observers can report which of the twoeyes has received a light flash with greater than chanceaccuracy. Many of these observers describe the mediating cue as a feeling of "strain" or "interference"in the stimulated eye. In view of these descriptions,it is interesting that paralysis of pupillary reflex andaccommodation has no effect on utrocular discrimination. Practice on utrocular discrimination taskscan produce some improvement in performance, butit is clear that practice alone will not elevate all observers to above-chance levels. Among observers whosucceed at the task, performance appears to improvesomewhat as exposure duration increases to about300-500 msec, and levels off thereafter; this effect ofduration is not dramatic, however. In general, theseexperiments provide little information concerningexperimental manipulations which strongly influenceutrocular discrimination, nor have they identifiedvariables which show a clear relationship to the ability. Moreover, it is not at all obvious why there existssuch large individual differences in the ability tomake eye-of-origin judgments. We suspect that thisconfusing state of affairs has made its own contribution to the paucity of attention to the problem ofutrocular discrimination.
Neural ConsiderationsIt will be useful at this point to outline what would
seem to be the minimal neural requirements for successful utrocular discrimination. We start with thefollowing assumption: In order for stimulation of theleft eye to be psychophysically discriminable fromstimulation of the right, the neural events producedby left-eye stimulation must be distinguishable fromthose accompanying right-eye stimulation. This, ofcourse, represents a specific instance of Brindley's(1970) general psychophysical linking hypothesis.Now there can be no doubt that the initial neuralevents associated with left-eye stimulation are different from those associated with stimulation of theright, for we are dealing with different receptor surfaces and optic nerves; prior to visual cortex, neuralinformation from the two eyes largely remains segregated, which means that a place code of sorts couldpotentially support utrocular discrimination. However, we typically think of visual detection and discrimination as involving processes beyond just thesefirst few synapses of the visual nervous system, so itbecomes necessary to think in terms of neural eventswithin cortical areas or in midbrain structures. Atthese higher visual stages, it is very likely that wholesale neural interaction between the two eyes has servedto obliterate the potential place code available earlier

in the visual pathways. Microelectrode recordingshave shown that many neurons in visual cortex andsuperior coIIiculus receive input from both eyes,which means that eye-of-origin information is nolonger available within a single binocular neuron. Itis also the case, however, that binocular neurons varyin terms of their ocular dominance, with some cellsmuch more responsive to stimulation through oneeye than through the other. It is conceivable that eyeof-origin information could be contained in a complexway within the pattern, or distribution, of activityamong a population of neurons with varying degreesof ocular dominance.
A simpler mechanism might involve the extremecase of ocular dominance wherein neurons are activated through one eye only. An ocular dominanceprofile which emphasizes these extremes of the distribution should serve to enhance the probability ofsuccessful utrocular discrimination. It was this ideawhich prompted us to compare utrocular performanceof normal and stereoblind humans. While our results(Blake & Cormack, 1979) were consistent with thisidea, we also discovered that the performance of normal observers exceeded chance levels under some circumstances. This intriguing result does not force usto abandon our initial working model based on theconcept of ocular dominance, but it does indicatethat the model requires some further elaboration.The experiments described in this paper were designedwith this as the goal.
METHODS
Visual Displays and ApparatusIn all the experiments in this paper, the visual displays con
sisted of one-dimensional grating patterns generated electronically on two matched cathode-ray tube (CRT) monitors (Tektronix604, P-31 phosphor). In most experiments, the gratings were sinusoidal in waveform, although square-wave luminance profiles andone dimensional random noise were employed in two of the experiments.
Stereoscope. The two CRT displays were presented separatelyto the two eyes via a mirror stereoscope, with a viewing distance of 114 cm. At this distance, the rectangular borders of theCRT subtended to 7° x 5°. The observer viewed the CRTsthrough natural pupils (except where noted), with the head securely positioned on a dental impression board. Optical elements(prisms, lenses, filters, artificial pupils) could be mounted in abinocular eyepiece, through which the observer viewed the CRTs.A pair of adjustable front-surface mirrors could be rotated tobring the two CRT displays into proper binocular alignment.
Grating patterns. A raster was created on each CRT screen byapplying a loo-kHz triangle wave to the vertical plates of theCRT while maintaining a loo-Hz frame rate. This produced uniform illumination of the CRT screen, with an average luminanceof 7 cd/rn". The beam current (Z-axis) of each CRT could bemodulated by the sine-wave or the square-wave output of eitherof two identical function generators (Clark Hess Model 748)both function generators were time-locked to the sweep signalapplied to the horizontal plates of the CRT. Before applicationto the Z-axis of the CRTs, each modulating signal was passedthrough a pair of decade attenuators (Hewlett Packard, Model
UTROCULAR DISCRIMINATION 55
350D) and then fed into an electronic shaping circuit whichserved to gate the modulating signals on and off gradually according to a Gaussian function with a space constant of 1.5° of visualangle. This shaping circuit was time-locked to the lDO-Hz sweepsignal, such that the modulating signal rose to its full amplitudeand then fell to the de level with every sweep. With this arrangement, the grating pattern produced on the CRT was amplitudemodulated over space in a manner which vignetted the gratingat the lateral borders of the display; this served to minimize theharmonic distortions which naturally arise when a repetitive grating pattern is abruptly truncated by a border (Kelly, 1970). Inaddition, by confining the pattern just to the central portion ofthe CRTs, potential extraneous cues due to fixation disparity wereminimized.
The spatial frequency and the contrast of the gratings couldbe varied independently without affecting the overall luminance.The gratings could be flickered in counterphase by amplitudemodulation (AM) of the output of the function generators with alow-frequency sinusoid. With this form of flicker which we employed in the experiments dealing with temporal frequency, thelight and dark bars of the grating interchanged positions continuously. In the absence of the low-frequency AM signal, thebars of the grating appeared stationary on the screen. A linearsumming amplifier could be used to mix different sinusoids inorder to generate a complex grating composed of several different spatial frequencies. In all except one experiment, the barsof the gratings were vertically oriented; for that experiment,horizontal gratings were produced by interchanging the inputs tothe vertical and horizontal deflection plates of the CRTs.
Dynamic visual noise. In one experiment, a complex displayconsisting of one-dimensional random noise was employed inplace of the usual simple grating. This random-noise display wascreated by using the output from a noise generator (Gras onStadler Model 1285; 20-2oo-kHz bandwidth with less than .50/0total harmonic distortion) to modulate the Z-axis beam intensity.This display consists of a dynamic array of many gratings whichchange in spatial frequency and phase continuously over time.The average contrast of the display at anyone moment can beestimated by taking the RMS voltage necessary to produce a simplesinusoidal grating of arbitrary contrast m, and dividing this voltage by Y2; the resulting voltage will yield random noise, theaverage contrast of which will be m or less 95% of the time(Stromeyer & Julesz, 1972).
Timing circuit. For all the experiments in Part 1 and some ofthose in Part 2, the gratings were briefly exposed for durationsthat are given in the results. The display was. presented by triggering an electronic timer which was preset for the desired duration. Rather than being turned on and off abruptly, the gratingswere gradually introduced and withdrawn by the use of a shapedriselfall gate with programmable time constants. The timer whichactuated this gate and controlled the duration of exposure couldbe triggered by depressing a button which was accessible to theobserver.
General ProcedureThis section gives procedural information common to various
groups of experiments.Vtrocular discrimination task. In these experiments, percent
correct performance was recorded in a two-alternative (right-eye!left-eye) forced-choice procedure. The observer was required toreport which one of the two eyes saw a grating pattern. Theobserver initiated a trial by depressing a pushbutton which immediately triggered the brief presentation of a pattern on one of theCRTs. The observer then indicated which of the eyes receivedthe display by operating a two-position lever switch; when uncertain, the observer was required to guess. Trial-by-trial feedbackwas not given (except where noted). In all experiments, the observer was informed of the stimulus condition (i.e., spatial frequency, flicker rate, orientation) under test and executed a number
56 BLAKE ANDCORMACK
RESULTS
Spu t i e l frequency (c/deq)
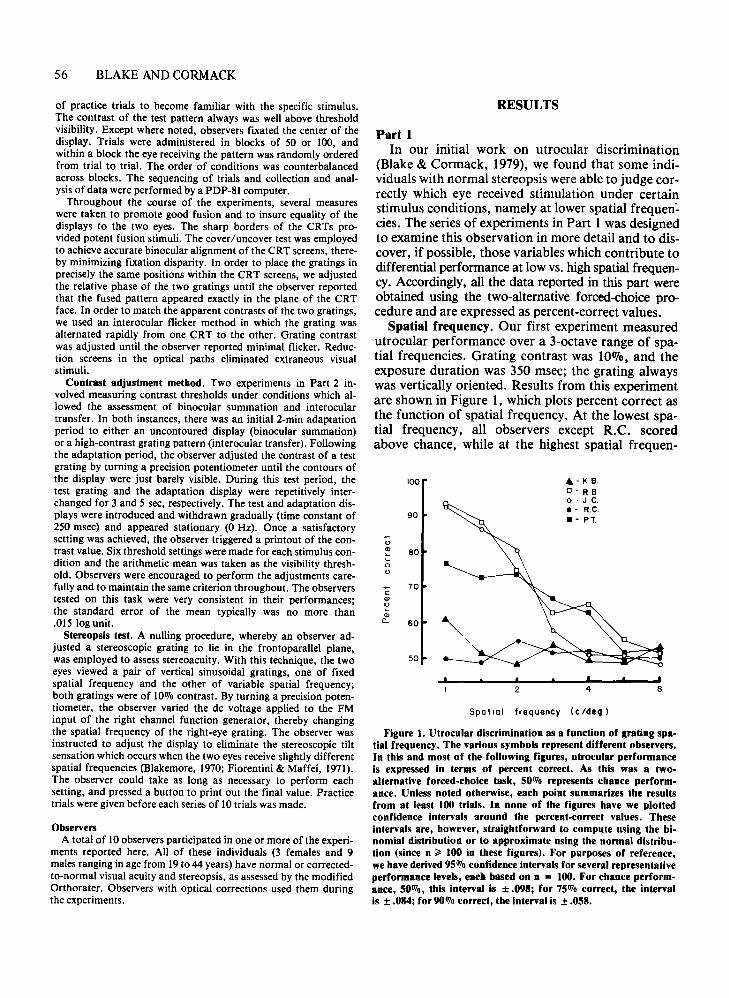
Figure 1. Utrocular discrimination as a function of grating spatial frequency. The various symbols represent different observers.In this and most of tbe following figures, utrocular performanceis expressed in terms of percent correct. As tbis was a twoalternative forced-cboice task, 50070 represents chance performance. Unless noted otherwise, each point summarizes tbe resultsfrom at least 100 trials. In none of the figures have we plottedconfidence intervals around the percent-correct values. Theseintervals are, however, straigbtforward to compute using the binomial distribution or to approximate using the normal distribution (since n ~ 100 in these figures). For purposes of reference,we have derived 95070 confidence intervals for several representativeperformance levels, eacb based on n = 100. For chance performance, 50070, this interval is ± .098; for 75070 correct, tbe intervalis ± .084; for 90070 correct, the interval is ± .058.
Part 1In our initial work on utrocular discrimination
(Blake & Cormack, 1979), we found that some individuals with normal stereopsis were able to judge correctly which eye received stimulation under certainstimulus conditions, namely at lower spatial frequencies. The series of experiments in Part 1 was designedto examine this observation in more detail and to discover, if possible, those variables which contribute todifferential performance at low vs. high spatial frequency. Accordingly, all the data reported in this part wereobtained using the two-alternative forced-choice procedure and are expressed as percent-correct values.
Spatial frequency. Our first experiment measuredutrocular performance over a 3-octave range of spatial frequencies. Grating contrast was 100/0, and theexposure duration was 350 msec; the grating alwayswas vertically oriented. Results from this experimentare shown in Figure 1, which plots percent correct asthe function of spatial frequency. At the lowest spatial frequency, all observers except R.C. scoredabove chance, while at the highest spatial frequen-
842
100 ... - KB.D-RB0- J C.• - RC.
90 • - PT.
0CD 80......00
70cQ)
0...Q) -.CL 60
50
of practice trials to become familiar with the specific stimulus.The contrast of the test pattern always was well above thresholdvisibility. Except where noted, observers fixated the center of thedisplay. Trials were administered in blocks of 50 or lOO, andwithin a block the eye receiving the pattern was randomly orderedfrom trial to trial. The order of conditions was counterbalancedacross blocks. The sequencing of trials and collection and analysis of data were performed by a PDP-81 computer.
Throughout the course of the experiments, several measureswere taken to promote good fusion and to insure equality of thedisplays to the two eyes. The sharp borders of the CRTs provided potent fusion stimuli. The cover/uncover test was employedto achieve accurate binocular alignment of the CRT screens, thereby minimizing fixation disparity. In order to place the gratings inprecisely the same positions within the CRT screens, we adjustedthe relative phase of the two gratings until the observer reportedthat the fused pattern appeared exactly in the plane of the CRTface. In order to match the apparent contrasts of the two gratings,we used an interocular flicker method in which the grating wasalternated rapidly from one CRT to the other. Grating contrastwas adjusted until the observer reported minimal flicker. Reduction screens in the optical paths eliminated extraneous visualstimuli.
Contrast adjustment metbod. Two experiments in Part 2 involved measuring contrast thresholds under conditions which allowed the assessment of binocular summation and interoculartransfer. In both instances, there was an initial 2-min adaptationperiod to either an uncontoured display (binocular summation)or a high-contrast grating pattern (interocular transfer). Followingthe adaptation period, the observer adjusted the contrast of a testgrating by turning a precision potentiometer until the contours ofthe display were just barely visible. During this test period, thetest grating and the adaptation display were repetitively interchanged for 3 and 5 sec, respectively. The test and adaptation displays were introduced and withdrawn gradually (time constant of250 msec) and appeared stationary (0 Hz), Once a satisfactorysetting was achieved, the observer triggered a printout of the contrast value. Six threshold settings were made for each stimulus condition and the arithmetic mean was taken as the visibility threshold. Observers were encouraged to perform the adjustments carefully and to maintain the same criterion throughout. The observerstested on this task were very consistent in their performances;the standard error of the mean typically was no more than.015 log unit.
Stereopsis test. A nulling procedure, whereby an observer adjusted a stereoscopic grating to lie in the frontoparallel plane,was employed to assess stereoacuity. With this technique, the twoeyes viewed a pair of vertical sinusoidal gratings, one of fixedspatial frequency and the other of variable spatial frequency;both gratings were of 10070 contrast. By turning a precision potentiometer, the observer varied the de voltage applied to the FMinput of the right channel function generator, thereby changingthe spatial frequency of the right-eye grating. The observer wasinstructed to adjust the display to eliminate the stereoscopic tiltsensation which occurs when the two eyes receive slightly differentspatial frequencies (Blakemore, 1970; Fiorentini & Maffei, 1971).The observer could take as long as necessary to perform eachsetting, and pressed a button to print out the final value. Practicetrials were given before each series of 10 trials was made.
ObserversA total of 10 observers participated in one or more of the experi
ments reported here. All of these individuals (3 females and 9males ranging in age from 19 to 44 years) have normal or correctedto-normal visual acuity and stereopsis, as assessed by the modifiedOrthorater. Observers with optical corrections used them duringthe experiments.
100
90
'0Q) 80......0o
70
CQ) 60 0- verticalo...Q) .- horizontal0-
50
40
2 4 B
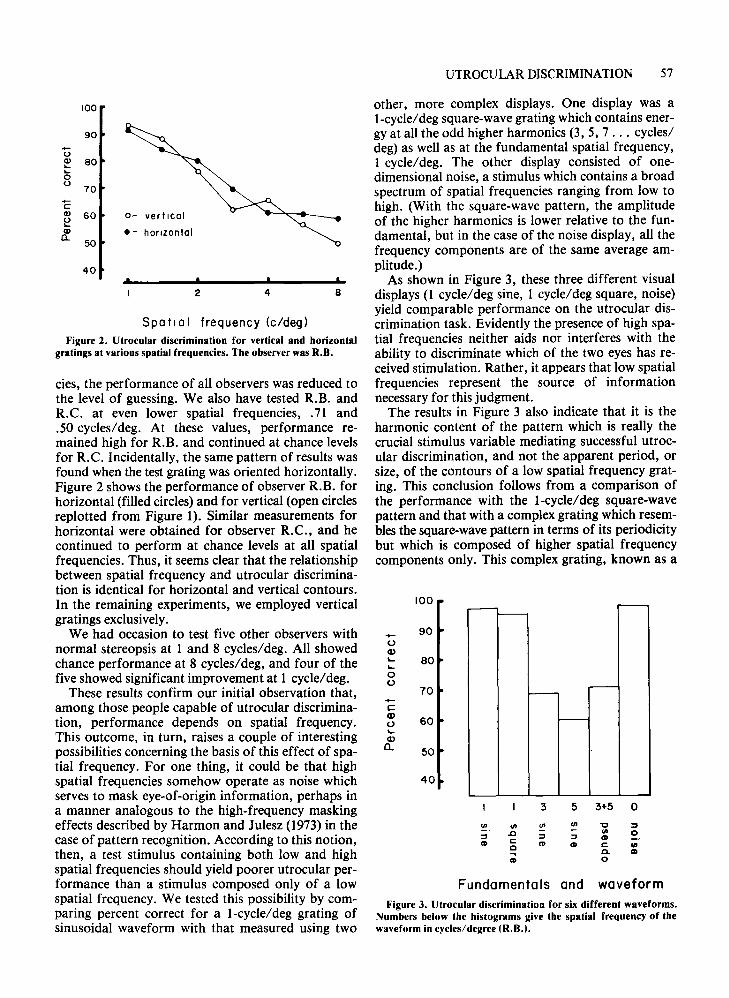
Spatial frequency (c/deq)Figure 2. Utrocular discrimination for vertical and horizontal
gratings at various spatial frequencies. The observer was R.B.
cies, the performance of all observers was reduced tothe level of guessing. We also have tested R.B. andR.C. at even lower spatial frequencies, .71 and.50 cycles/deg. At these values, performance remained high for R.B. and continued at chance levelsfor R.C. Incidentally, the same pattern of results wasfound when the test grating was oriented horizontally.Figure 2 shows the performance of observer R.B. forhorizontal (filled circles) and for vertical (open circlesreplotted from Figure 1). Similar measurements forhorizontal were obtained for observer R.C., and hecontinued to perform at chance levels at all spatialfrequencies. Thus, it seems clear that the relationshipbetween spatial frequency and utrocular discrimination is identical for horizontal and vertical contours.In the remaining experiments, we employed verticalgratings exclusively.
We had occasion to test five other observers withnormal stereopsis at 1 and 8 cycles/deg. All showedchance performance at 8 cycles/deg, and four of thefive showed significant improvement at 1 cycle/deg.
These results confirm our initial observation that,among those people capable of utrocular discrimination, performance depends on spatial frequency.This outcome, in turn, raises a couple of interestingpossibilities concerning the basis of this effect of spatial frequency. For one thing, it could be that highspatial frequencies somehow operate as noise whichserves to mask eye-of-origin information, perhaps ina manner analogous to the high-frequency maskingeffects described by Harmon and Julesz (1973) in thecase of pattern recognition. According to this notion,then, a test stimulus containing both low and highspatial frequencies should yield poorer utrocular performance than a stimulus composed only of a lowspatial frequency. We tested this possibility by comparing percent correct for a l-cycle/deg grating ofsinusoidal waveform with that measured using two
UTROCULAR DISCRIMINATION 57
other, more complex displays. One display was al-cycle/deg square-wave grating which contains energy at all the odd higher harmonics (3,5,7 ... cycles/deg) as well as at the fundamental spatial frequency,1 cycle/deg, The other display consisted of onedimensional noise, a stimulus which contains a broadspectrum of spatial frequencies ranging from low tohigh. (With the square-wave pattern, the amplitudeof the higher harmonics is lower relative to the fundamental, but in the case of the noise display, all thefrequency components are of the same average amplitude.)
As shown in Figure 3, these three different visualdisplays (1 cycle/deg sine, 1 cycle/deg square, noise)yield comparable performance on the utrocular discrimination task. Evidently the presence of high spatial frequencies neither aids nor interferes with theability to discriminate which of the two eyes has received stimulation. Rather, it appears that low spatialfrequencies represent the source of informationnecessary for this judgment.
The results in Figure 3 also indicate that it is theharmonic content of the pattern which is really thecrucial stimulus variable mediating successful utrocular discrimination, and not the apparent period, orsize, of the contours of a low spatial frequency grating. This conclusion follows from a comparison ofthe performance with the l-cycle/deg square-wavepattern and that with a complex grating which resembles the square-wave pattern in terms of its periodicitybut which is composed of higher spatial frequencycomponents only. This complex grating, known as a
100"'----r--
..... 900Q)~ 80~
00
r--70 -.....c:Q)
60 r--0~
Q)
a.. 50
40
3 5 3+5 0
'" '" ~ '" "1:l :::J.c - '" 0:::JC
:::J :::J CDCD
0CD CD C 110., Cl. III
CD 0
Fundamentals and waveformFigure 3. Utrocular discrimination for six different waveforms.
Numbers below the histograms give the spatial frequency of thewaveform in cycles/degree (R.B.).

58 BLAKE ANDCORMACK
Figure 4. Utrocular discrimination as the function of gratingcontrast (A) and exposure duration (B) (R.B.).
100
~I~B- 900
t 800 0- I cid0 e- 8 cid
C70
~Q)
e 60Ql
~0..
50
pseudo-square-wave (Campbell, Howell, & Robson,1971), was generated by adding electronically gratingsof 3 and 5 cycles/deg, By appropriately arranging therelative phase and amplitude of the two patterns, itwas possible to produce a complex grating whichappeared to contain coarse bars similar in size tothose of the genuine square wave. But, as can be seenin Figure 3, utrocular discrimination with the pseudosquare-wave was inferior compared to that with thetrue square wave, despite their resemblance phenomenally, and instead was equivalent to performancemeasured for either the 3- or 5-cycle/deg sine component alone. These results indicate that successfulutrocular discrimination depends upon the presenceof energy at low spatial frequencies; large contoursof phenomenal origin are alone insufficient to support consistently accurate performance. Incidentally,it is of some interest that simultaneous presentationof 3 and 5 cycles/deg fails to improve performancerelative to the situation where only one of these gratings is presented. The absence of even probabilitysummation indicates that the two components of thecomplex grating do not act as independent inputs, atleast in terms of their contributions to utrocular discrimination.
Energic variables. The results presented so far wereobtained using grating patterns which were wellabove threshold visibility, by almost 2 log units. Todetermine whether utrocular discrimination woulddeteriorate as the test pattern approached threshold,we measured performance as the function of gratingcontrast and duration of presentation.
Figure 4a gives the outcome of testing over almosta l-log-unit range of contrast values, with contrastexpressed in terms of decibels above threshold (20 dBequals 1.0 log unit). The contrast threshold was determined using an adjustment technique (see Methods).The open symbols give the results for 1 cycle/deg,and the filled symbols represent the outcome for8 cycles/deg. Clearly, variations in grating contrastfail to influence performance at either spatial frequency; discrimination remains excellent at the lowspatial frequency, even when the grating is barelyvisible, and remains uniformly poor at the high spa-
Figure 5. Utrocular discrimination at 6 cycles/deg as a functionof amount of practice with feedback (J .C.).
765432
Successive days (100 trials/day)
JC
0~0~0_0,, 0-- 00--
100.....ucv......0u 75.....<:cvl:<11Q. 50
tial frequency. This same pattern of results was obtained for observers J.C. and P.T.
Variations in the duration of presentation are similarly ineffective in terms of modulating utrocularperformance. Using the same set of symbols, Figure 4b plots performance at low and high spatial frequencies as a function of grating duration. For thisexperiment, the shaped rise/fall gate controlling theonset and offset of the grating was set at 100 use«,the minimum value which could be achieved with thisdevice. Over the range of durations studied, performance was virtually constant for observer R.B. Sampling fewer values but over the same range of durations, we found comparable results for observersW.M. and P.T. Observer R.C., who performed atchance levels at all spatial frequencies in our firstexperiment, showed no improvement in this experiment; his performance at 1 and 8 cycles/deg remainednear 50070 over the complete sample of durations.
Practice. Previous experiments (Enoch et al., 1969;Thelin & Altman, 1929) have found a modest improvement in utrocular discrimination with practice.Naturally, we wondered whether the poor performance at high spatial frerquencies in our paradigmcould be remedied by training. To examine this possibility, we tested observer J .C. daily for 1 week, withat least 100 trials/day. The test grating was 6 cycles/deg and .10 in contrast. After his response on eachtrial, he was informed of the correctness of his response. The results from this prolonged series oftrials are shown in Figure 5. They provide no evidenceof improvement over the l-week period.
Additional evidence against a practice effect is provided by the stability in performance of several observers throughout the course of our studies. In particular, observers R.B., R.C., J.C., and P.T. eachcompleted several thousand trials. Although thesetrials were without immediate feedback, they did furnish the observer thorough familiarity with the displays and they often repeated identical conditions.Despite this extensive experience with the task, therewas no real trend toward improvement at the higher
24 100 300 500Duration (mssc)
6 12 18Contrast (dB)
UTROCULAR DISCRIMINATION 59
Successive blocks of 100 trials before
and after cycloplegia
Figure 6. Effect of paralysis of intrinsic eye muscles on utroeular discrimination for two spatial frequencies. Open symbolsplot performance before paralysis (J.C.).
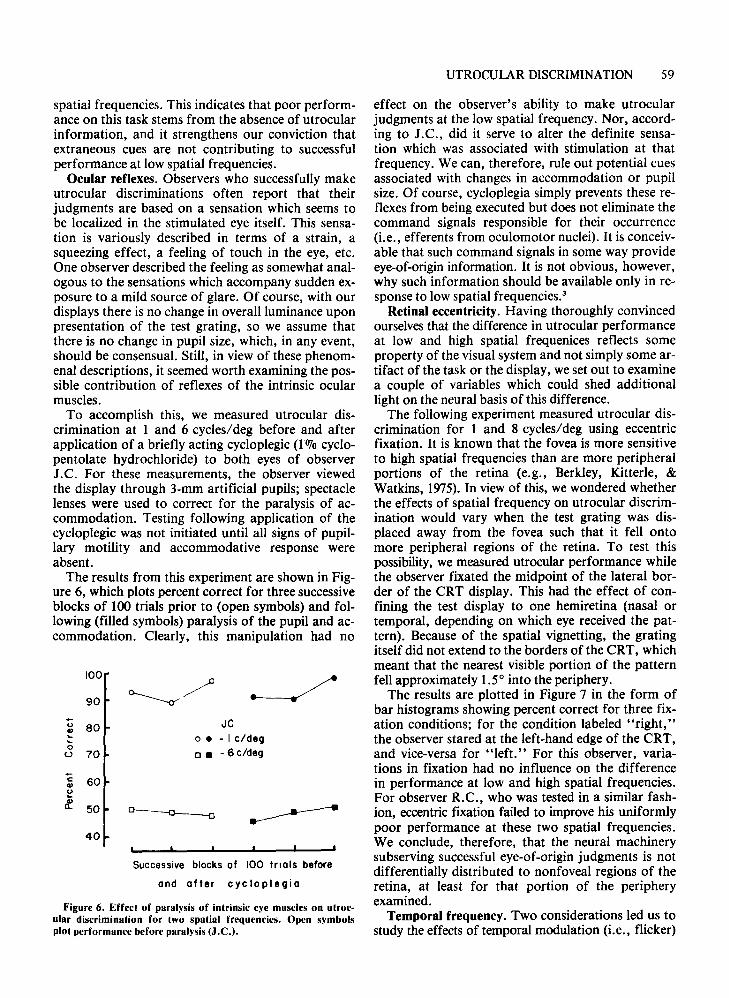
effect on the observer's ability to make utrocularjudgments at the low spatial frequency. Nor, according to l.C., did it serve to alter the definite sensation which was associated with stimulation at thatfrequency. We can, therefore, rule out potential cuesassociated with changes in accommodation or pupilsize. Of course, cycloplegia simply prevents these reflexes from being executed but does not eliminate thecommand signals responsible for their occurrence(i.e., efferents from oculomotor nuclei). It is conceivable that such command signals in some way provideeye-of-origin information. It is not obvious, however,why such information should be available only in response to low spatial frequencies.'
Retinal eccentricity. Having thoroughly convincedourselves that the difference in utrocular performanceat low and high spatial frequenices reflects someproperty of the visual system and not simply some artifact of the task or the display, we set out to examinea couple of variables which could shed additionallight on the neural basis of this difference.
The following experiment measured utrocular discrimination for 1 and 8 cycles/deg using eccentricfixation. It is known that the fovea is more sensitiveto high spatial frequencies than are more peripheralportions of the retina (e.g., Berkley, Kitterle, &Watkins, 1975). In viewof this, we wondered whetherthe effects of spatial frequency on utrocular discrimination would vary when the test grating was displaced away from the fovea such that it fell ontomore peripheral regions of the retina. To test thispossibility, we measured utrocular performance whilethe observer fixated the midpoint of the lateral border of the CRT display. This had the effect of confining the test display to one hemiretina (nasal ortemporal, depending on which eye received the pattern). Because of the spatial vignetting, the gratingitself did not extend to the borders of the CRT, whichmeant that the nearest visible portion of the patternfell approximately 1.50 into the periphery.
The results are plotted in Figure 7 in the form ofbar histograms showing percent correct for three fixation conditions; for the condition labeled "right,"the observer stared at the left-hand edge of the CRT,and vice-versa for "left." For this observer, variations in fixation had no influence on the differencein performance at low and high spatial frequencies .For observer R.C., who was tested in a similar fashion, eccentric fixation failed to improve his uniformlypoor performance at these two spatial frequencies.We conclude, therefore, that the neural machinerysubserving successful eye-of-origin judgments is notdifferentially distributed to nonfoveal regions of theretina, at least for that portion of the peripheryexamined.
Temporal frequency. Two considerations led us tostudy the effects of temporal modulation (i.e., flicker)
JCo • - I c/dego. - 6 c/deg
100
90
-o 80........0
0 70
~ 60..o
~ 50
40
spatial frequencies. This indicates that poor performance on this task stems from the absence of utrocularinformation, and it strengthens our conviction thatextraneous cues are not contributing to successfulperformance at low spatial frequencies.
Ocular reflexes. Observers who successfully makeutrocular discriminations often report that theirjudgments are based on a sensation which seems tobe localized in the stimulated eye itself. This sensation is variously described in terms of a strain, asqueezing effect, a feeling of touch in the eye, etc.One observer described the feeling as somewhat analogous to the sensations which accompany sudden exposure to a mild source of glare. Of course, with ourdisplays there is no change in overall luminance uponpresentation of the test grating, so we assume thatthere is no change in pupil size, which, in any event,should be consensual. Still, in view of these phenomenal descriptions, it seemed worth examining the possible contribution of reflexes of the intrinsic ocularmuscles.
To accomplish this, we measured utrocular discrimination at I and 6 cycles/deg before and afterapplication of a briefly acting cycloplegic (1010 cyclopentolate hydrochloride) to both eyes of observerl.C. For these measurements, the observer viewedthe display through 3-mm artificial pupils; spectaclelenses were used to correct for the paralysis of accommodation. Testing following application of thecycloplegic was not initiated until all signs of pupillary motility and accommodative response wereabsent.
The results from this experiment are shown in Figure 6, which plots percent correct for three successiveblocks of 100 trials prior to (open symbols) and following (filled symbols) paralysis of the pupil and accommodation. Clearly, this manipulation had no
60 BLAKE AND CORMACK
Figure 7. Utrocular discrimination as a function of rennal location of the grating pattern. The "right" condition refers to thecase where the grating appeared to the right of fixation (R.B.).
1263
0- I cid.- 6c/d
1.5
RC
RB
60
50 .....J.--f.Jt-~-,--~~o I
100
90
80
70
60.....U<Il
50......0u
100.....c:cv 90u...If 00
7
Temporal frequency (hz )
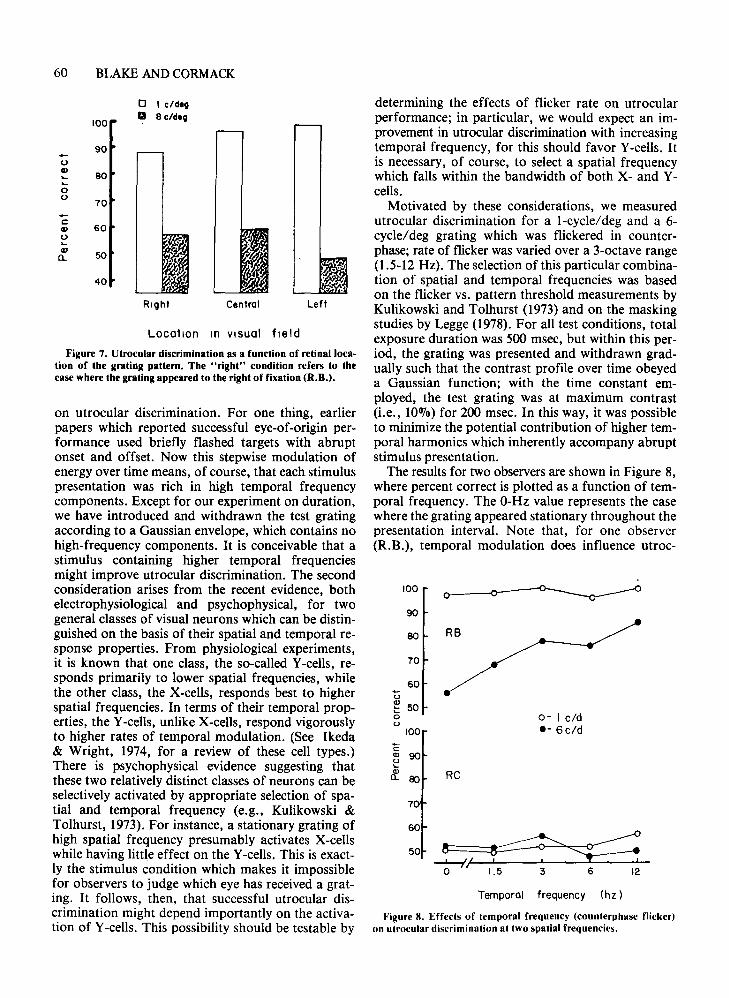
determining the effects of flicker rate on utrocularperformance; in particular, we would expect an improvement in utrocular discrimination with increasingtemporal frequency, for this should favor Y-cells. Itis necessary, of course, to select a spatial frequencywhich falls within the bandwidth of both X- and Ycells.
Motivated by these considerations, we measuredutrocular discrimination for a l-cycle/deg and a 6cycle/deg grating which was flickered in counterphase; rate of flicker was varied over a 3-octave range(1.5-12 Hz). The selection ofthis particular combination of spatial and temporal frequencies was basedon the flicker vs. pattern threshold measurements byKulikowski and Tolhurst (1973) and on the maskingstudies by Legge (1978). For all test conditions, totalexposure duration was 500 msec, but within this period, the grating was presented and withdrawn gradually such that the contrast profile over time obeyeda Gaussian function; with the time constant employed, the test grating was at maximum contrast(i.e., 10010) for 200 msec. In this way, it was possibleto minimize the potential contribution of higher temporal harmonics which inherently accompany abruptstimulus presentation.
The results for two observers are shown in Figure 8,where percent correct is plotted as a function of temporal frequency. The O-Hz value represents the casewhere the grating appeared stationary throughout thepresentation interval. Note that, for one observer(R.B.), temporal modulation does influence utroc-
Figure 8. Effects of temporal frequency (counterphase flicker)on utrocular discrimination at two spatial frequencies.
LeftCentral
Location In visual field
o I c/d.VCl 8c/d.V
50
90
80
70
60
40
100
oQ)~
~
oo
....cQ)
o...a:J0..
on utrocular discrimination. For one thing, earlierpapers which reported successful eye-of-origin performance used briefly flashed targets with abruptonset and offset. Now this stepwise modulation ofenergy over time means, of course, that each stimuluspresentation was rich in high temporal frequencycomponents. Except for our experiment on duration,we have introduced and withdrawn the test gratingaccording to a Gaussian envelope, which contains nohigh-frequency components. It is conceivable that astimulus containing higher temporal frequenciesmight improve utrocular discrimination. The secondconsideration arises from the recent evidence, bothelectrophysiological and psychophysical, for twogeneral classes of visual neurons which can be distinguished on the basis of their spatial and temporal response properties. From physiological experiments,it is known that one class, the so-called Y-cells, responds primarily to lower spatial frequencies, whilethe other class, the X-cells, responds best to higherspatial frequencies. In terms of their temporal properties, the Y-cells, unlike X-cells, respond vigorouslyto higher rates of temporal modulation. (See Ikeda& Wright, 1974, for a review of these cell types.)There is psychophysical evidence suggesting thatthese two relatively distinct classes of neurons can beselectively activated by appropriate selection of spatial and temporal frequency (e.g., Kulikowski &Tolhurst, 1973). For instance, a stationary grating ofhigh spatial frequency presumably activates X-cellswhile having little effect on the Y-cells. This is exactly the stimulus condition which makes it impossiblefor observers to judge which eye has received a grating. It follows, then, that successful utrocular discrimination might depend importantly on the activation of Y-cells. This possibility should be testable by

UTROCULAR DISCRIMINATION 61
Figure 9. Percent correct for the discrimination of monocularfrom binocular stimulation at two spatial frequencies.
8(c/deg)
8 Ifrequency
ISpatial
50«
100RB WM
..... 90oQ)~
~ 800()
..... 70cQ)0~ 60Q)n,
performance is no better than chance on utroculardiscrimination.
The results from this experiment are shown in Figure 9 in the form of histograms. As predicted, atI cycleldeg, binocular stimulation could be discriminated from monocular, whereas at 8 cyclesI deg,monocular and binocular conditions were often confused.
Next, consider another implication of the assumption we described above, which attributes successfulutrocular discrimination to differences in neural activity associated with stimulation of the left eye vs.the right eye. Imagine that stimulation always isbinocular but that the two eyes receive patterns whichdiffer along some stimulus dimension. So long as thisdifference is sufficient to maintain an imbalance inthe pattern of neural activity between the two eyes,there would exist some neural basis for judging whicheye received a particular visual stimulus, a task thatcould be characterized as a modified version ofutrocular discrimination.
To illustrate this idea, consider the case of contrastdisparity between the two eyes. Suppose that on eachtest trial one eye receives a high-contrast grating ofI cycle/deg while the other eye receives a very lowcontrast grating of the same spatial frequency; theobserver is instructed to report which eye receivedthe higher contrast. If the low-contrast grating wereactually below threshold, then the task would be nodifferent from the case of simple utrocular discrimination which, at I cycle/deg, would be easy formany observers. Suppose, however, that we systematically increase the contrast of the weaker grating,measuring at each value the observer's ability tojudge which eye received the stronger contrast. Asthis contrast disparity shrinks, the task presumablywould become more difficult, owing to the diminish-
ular discrimination at 6 cyclesldeg, serving to enhance performance by almost 300/0 relative to thenear-chance performance at 0 Hz. For the l-cycle/deg pattern, of course, performance already was nearmaximum, so we could expect no further improvement with increasing flicker rate. For the other observer (R.C.), however, temporal modulation had noreal influence on utrocular performance-the task remained virtually impossible at both spatial frequencies regardless of flicker rate. We have tested twoother observers in a similar fashion; one exhibitedonly a moderate improvement in utrocular performance at 6 cycles/deg with high flicker rates. The otherobserver showed no consistent effect of temporalfrequency. Hence, it appears that temporal frequency, like its counterpart spatial frequency, may play arole in utrocular discrimination for some observersbut not for others.
Binocular stimulation. So far, we have focused onstimulus conditions which always involve presentationof a pattern to just one eye or the other. It has beenassumed that successful utrocular discriminationmust be based on some pattern of neural activitywhich is uniquely associated with stimulation of oneeye as opposed to the other. And conversely, thefailure to discriminate eye of origin is assumed tostem from the absence of any such unique pattern ofactivity, or at least from an inability to utilize thatinformation. Now, it also stands to reason that anobserver capable of judging left- from right-eye stimulation should successfully discriminate monocularfrom binocular stimulation. This would be so becauseall combinations' of two unique patterns of neuralactivity (i.e., left-eye and right-eye stimulation) willthemselves be different from either component pattern alone. To test this prediction, we performed thefollowing experiment.
On each trial, a stationary vertical grating was presented for 300 msec. On half the trials, the patternwent to both eyes simultaneously, while on the remaining trials, the pattern was exposed to either theleft eye or the right eye, with equal probabilities.These three types of trials (binocular, monocular left,monocular right) were randomly intermixed, and following each trial the observer judged whether stimulation was binocular or monocular. To avoid potential cues based on contrast differences between monocular and binocular stimulation, grating contrastwas randomly varied within a .3-10g-unit range (5%10%) from trial to trial, completely independently ofthe exposure condition. The relative phase of the leftand right-eye patterns was carefully adjusted to insure that on binocular trials the fused grating appeared in the plane of depth of the CRT screen. Performance on this task was measured at I cycle/deg,a value at which both observers tested excel on utrocular discrimination, and at 8 cycles/deg, where their
62 BLAKE AND CORMACK
2 4 6 8 10 12 14 16 18 20
Contrast disparity (dB)
100
RB
75
UQ)"- 500u
"EQ)
~ WMQ)c,
75
50
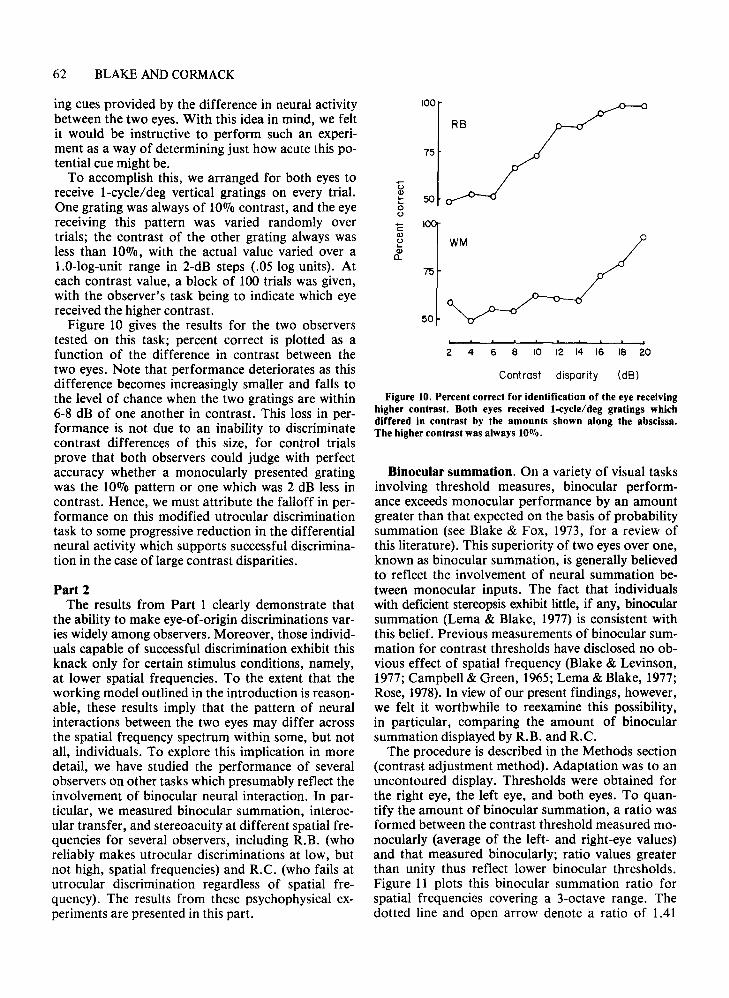
Figure 10. Percent correct for identification of the eye receivinghigher contrast. Both eyes received 1-cycle/deg gratings whichdiffered in contrast by the amounts shown along the abscissa.The higher contrast was always 10010.
Binocular summation. On a variety of visual tasksinvolving threshold measures, binocular performance exceeds monocular performance by an amountgreater than that expected on the basis of probabilitysummation (see Blake & Fox, 1973, for a review ofthis literature). This superiority of two eyes over one,known as binocular summation, is generally believedto reflect the involvement of neural summation between monocular inputs. The fact that individualswith deficient stereopsis exhibit little, if any, binocularsummation (Lema & Blake, 1977) is consistent withthis belief. Previous measurements of binocular summation for contrast thresholds have disclosed no obvious effect of spatial frequency (Blake & Levinson,1977; Campbell & Green, 1965; Lema & Blake, 1977;Rose, 1978). In viewof our present findings, however,we felt it worthwhile to reexamine this possibility,in particular, comparing the amount of binocularsummation displayed by R.B. and R.C.
The procedure is described in the Methods section(contrast adjustment method). Adaptation was to anuncontoured display. Thresholds were obtained forthe right eye, the left eye, and both eyes. To quantify the amount of binocular summation, a ratio wasformed between the contrast threshold measured monocularly (average of the left- and right-eye values)and that measured binocularly; ratio values greaterthan unity thus reflect lower binocular thresholds.Figure 11 plots this binocular summation ratio forspatial frequencies covering a 3-octave range. Thedotted line and open arrow denote a ratio of 1.41
ing cues provided by the difference in neural activitybetween the two eyes. With this idea in mind, we feltit would be instructive to perform such an experiment as a way of determining just how acute this potential cue might be.
To accomplish this, we arranged for both eyes toreceive l-cycle/deg vertical gratings on every trial.One grating was always of 100/0 contrast, and the eyereceiving this pattern was varied randomly overtrials; the contrast of the other grating always wasless than 10%, with the actual value varied over a1.0-log-unit range in 2-dB steps (.05 log units). Ateach contrast value, a block of 100 trials was given,with the observer's task being to indicate which eyereceived the higher contrast.
Figure 10 gives the results for the two observerstested on this task; percent correct is plotted as afunction of the difference in contrast between thetwo eyes. Note that performance deteriorates as thisdifference becomes increasingly smaller and falls tothe level of chance when the two gratings are within6-8 dB of one another in contrast. This loss in performance is not due to an inability to discriminatecontrast differences of this size, for control trialsprove that both observers could judge with perfectaccuracy whether a monocularly presented gratingwas the 10% pattern or one which was 2 dB less incontrast. Hence, we must attribute the falloff in performance on this modified utrocular discriminationtask to some progressive reduction in the differentialneural activity which supports successful discrimination in the case of large contrast disparities.
Part 2The results from Part 1 clearly demonstrate that
the ability to make eye-of-origin discriminations varies widely among observers. Moreover, those individuals capable of successful discrimination exhibit thisknack only for certain stimulus conditions, namely,at lower spatial frequencies. To the extent that theworking model outlined in the introduction is reasonable, these results imply that the pattern of neuralinteractions between the two eyes may differ acrossthe spatial frequency spectrum within some, but notall, individuals. To explore this implication in moredetail, we have studied the performance of severalobservers on other tasks which presumably reflect theinvolvement of binocular neural interaction. In particular, we measured binocular summation, interocular transfer, and stereoacuity at different spatial frequencies for several observers, including R.B. (whoreliably makes utrocular discriminations at low, butnot high, spatial frequencies) and R.C. (who fails atutrocular discrimination regardless of spatial frequency). The results from these psychophysical experiments are presented in this part.

UTROCULAR DISCRIMINATION 63
Figure 11. The amount of binocular summation on a contrastthreshold task as the function of spatial frequency. Each symbolplots the ratio of the average of the two monocular thresholds(each of which was based on six contrast settings) to the binocularthreshold (which was based on six settings). The dotted line andopen arrow denote the summation ratio characteristic of performance on this task.
(i.e., V2), a value which seems to characterize theamount of binocular summation typically found forthis sort of task (e.g., Campbell & Green, 1965).Note that for both observers the binocular summation ratio fluctuates unsystematically about thatvalue, with no tendency for the amount of summation to vary with spatial frequency. Nor is there anynotable difference in binocular summation betweenthe two observers, in contrast to their marked differences in performance on the eye-of-origin task (seeFigure 1). In summary, there appears to be no simplerelationship between performance on the eye-of-origintask and the amount of binocular summation on acontrast threshold task.
Interocu1ar transfer. Next, we turned to anotherconventional psychophysical gauge of binocularity,the perceptual phenomenon known as interoculartransfer. This phenomenon, whereby some aftereffectof visual adaptation of one eye can be observed in thenonadapted eye, implies that the aftereffect occursat a binocular site within the visual system, whereinputs from the two eyes have been combined. Thereis some evidence that the amount of interoculartransfer is related to stereoacuity (Mitchell & Ware,1974; Movshon, Chambers, & Blakemore, 1972),although this relationship has been questioned veryrecently (Hess, 1978). It does seem clear that stereoblind individuals routinely show a reduced degreeof interocular transfer relative to the range foundamong normal observers(Lema & Blake, 1977; Wade,1976;Ware & Mitchell, 1974). In view of our findingson utrocular discrimination, we wondered whether
"-Q)-I/Oc:;c 100"- RC RI..."- 80c300 60
rn"-s
CDc: 40
'ECD 200"-
et 0L-R R-L L-R R-L L-R R-L L-R R-L
10 4.0 1.0 4.0
Adaptation condition
the amount of interocular transfer exhibited by R.B.and R.C. might depend on the spatial frequency usedfor adaptation and test. To explore this possibility,we measured the elevation in contrast threshold inone eye produced by prior adaptation of the othereye.
Our procedure was much like that employed in thebinocular summation experiment; again, the observer set contrast thresholds using an adjustmentmethod. For this experiment, though, the initial2-min period involved the continuous presentation ofa high-contrast (1.5 log units above threshold) grating to one eye. Following this initial period of adaptation, threshold settings were made using the nonadapted eye. For purposes of comparison, unadaptedthreshold settings also were obtained by lowering theadaptation contrast to some arbitrary, subthresholdvalue, such that the observer saw only the uncontoured display during periods of adaptation. Interocular transfer was measured at 1 and at 4 cycles/degfollowing adaptation of the left eye or adaptation ofthe right eye. We also measured the elevation in contrast threshold produced by adapting and testing thesame eye. For all conditions, adaptation and testgratings were of the same spatial frequency.
The results from this experiment are given in Figure 12, which shows the elevation in contrast threshold measured interocularly as a percentage of theaftereffect produced by adaptation and testing of thesame eye. All adaptation conditions produced a significant elevation in contrast threshold, but the interocular conditions consistently yielded smaller aftereffects, as evidenced by the failure of the histogramsin Figure 12 to reach 100"70; this lack of completeinterocular transfer seems to be characteristic of allvisual aftereffects. Of particular importance for our
Figure 12. Percent interocular transfer at two different spatialfrequencies, 1 and 4 cyles/deg. For the L -+ R conditions, the lefteye was adapted to a high-contrast grating and the resulting elevation in contrast threshold (n = 6) was measured in the right eye.For the R -+ L condition, adaptation and testing were reversed.Interocular transfer is expressed relative to the threshold (n = 6)elevation aftereffect induced and measured in the same eye.
B42
Spotlol frequency (c/deg)
- ------ ----- ------- ~
R C
0-~
c:0-0EE 1.0::lIII.. I 5.2::J00c:
cD
1.0
64 BLAKE AND CORMACK
DISCUSSION
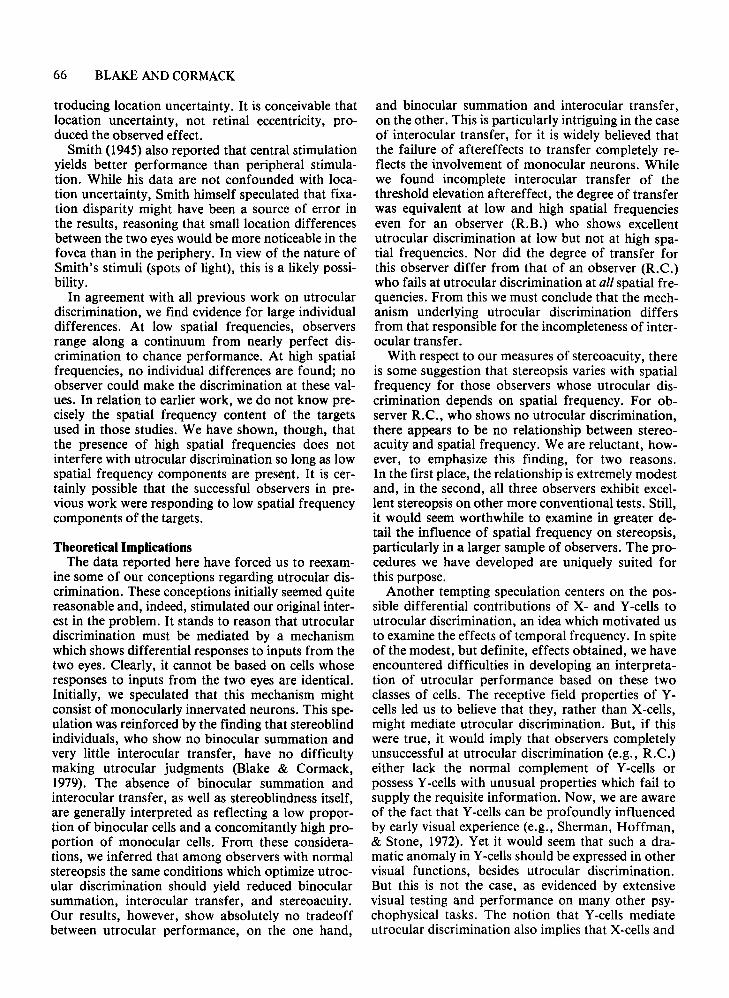
Table IStereoacuity (Standard Deviation of NulJingAdjustments, n =10)
for Four Spatial Frequencies and Three Observers
In this section, we discuss the methodological implications of our findings, relate those findings toprevious studies, and examine some physiologicalspeculations regarding utrocular discrimination.
Methodological ConsiderationsThe elimination of extraneous cues constitutes a
perennial problem in any discrimination task. Inutrocular discrimination, this problem is exacerbatedby factors associated with halploscopic displays andwith potential ocular asymmetries. In our experiments, we are convinced that such factors make nocontribution to the pattern of results obtained. For
8
.048
.102
.010
4
.004
.003
.007
2
.013
.009
.005
Spatial Frequency (Cycles per Degree)
.023
.013
.008
R.B.J.c.R.e.
Observer
Table 1 contains the standard deviations (stereoacuity) for each of three observers at the variousspatial frequencies. These values have been normalized for spatial frequency (0 7 cycles deg'), so thatthe values may be compared directly. First, weshould point out that the results at 8 cycles/deg maybe of limited use for our purposes; all observersfound the task very difficult at this spatial frequencybecause of the weakness of the stereoscopic sensationof rotation. It was quite frustrating to attempt tobring the fused grating into the frontoparallel planein the absence of a clear rotation out of this plane.We suspect that this must be responsible, at least inpart, for the consistently inferior performance at thishigh spatial frequency. At the other spatial frequencies, the sensation of depth was quite immediate andcompelling, which made the task much simpler.Note, for observers R.B. and l.C., that stereoacuityimproves with increasing spatial frequency. This isin contrast to their results on the utrocular discrimination task (see Figure 1), where performance deteriorated with increasing spatial frequency. For observer R.e., whose performance was uniformly pooron the utrocular task, stereoacuity is uniformly goodat I, 2, and 4 cycles/deg, This pattern of resultssuggests that stereoacuity and utrocular sensitivitymay be inversely related. Certainly, our earlier findings (Blake & Cormack, 1979) on utrocular discrimination in stereoblind individuals are consistent withsuch a relationship.
purposes is the failure to find any effect of spatialfrequency. For both observers, the amount of interocular transfer is just about equivalent at the twospatial frequencies, regardless of which eye is tested.Nor is there any striking difference between theamount of transfer for R.B. and R.e. Interoculartransfer bears no obvious relationship to discrimination performance on the eye-of-origin task.
Stereoacuity. The final measure of binocular performance studied was stereoacuity, the ability tomake judgments of depth based on retinal disparity.As already pointed out, there is a growing conviction in visual science that binocularly innervated cortical neurons play a crucial role in stereopsis. As acorollary to this proposition, it also is assumed thatdeficiencies in stereopsis reflect a reduction in thedensity, or proportion, of cortical neurons which canbe binocularly excited. Since our utrocular discrimination data suggest that the degree of binocularinteraction may depend on spatial frequency, we feltit worthwhile to measure stereoacuity at differentspatial frequencies, in order to look for possible correlations between stereoacuity and utrocular performance.
Conventional measures of stereoacuity, such as thethree-needle test, do not lend themselves to the studyof the effects of spatial frequency on stereopsis.There is, however, a recently described stereoscopicphenomenon which is appropriate for our purposes. This phenomenon, which has been studied byBlakemore (1970) and by Fiorentini and Maffei(1971), is the apparent rotation of a grating in depthabout the vertical axis produced by stereoscopicallyviewing two vertical grating patterns of slightly different spatial frequency. Within limits, the degree ofrotation away from the frontoparallel plane is directlyrelated to this spatial frequency difference betweenthe two eyes; the fused grating appears rotated awayfrom the eye receiving the lower spatial frequency.As a measure of stereoacuity, an observer may begiven control of the spatial frequency of the gratingpresented to one eye and instructed to adjust thefused grating until it appears exactly in the frontoparallel plane, with neither the right nor the leftside of the pattern in depth. With repeated trials,the average setting provides a measure of constanterror, while the variability (standard deviation) ofthe settings furnishes an index of stereoacuity, withlow variability indicating high stereoacuity. In thisrespect, the logic of the task resembles that of other,more conventional, stereoacuity measures based onequidistance settings (e.g., Ogle, 1950). With ourprocedure, however, it is straightforward to assessstereoacuity at different spatial frequencies. We obtained frontoparallel settings for gratings at 1, 2, 4,and 8 cycles/deg.
one thing, great care was taken in aligning andequating the displays to the two eyes. The proceduresfollowed to accomplish this are described in detailin the Methods section. In addition to those procedural safeguards, the results themselves serve toconfirm that potentially confounding variables werecontrolled adequately. We summarize here some results relevant to the question of extraneous cues.
Despite procedures to equate the right-eye and lefteye displays, it is conceivable that subtle differences(e.g., orientation) could go undetected in a phenomenal match. Then, under forced-choice testing, ariobserver with excellent visual acuity might be able touse these small differences to make utrocular discriminations. It is not at all obvious, however, whysuch information would be discernible only at lowspatial frequencies. While it is known that certainspatial frequencies are more detectable than others(e.g., Schade, 1956), the effect of spatial frequencyon utrocular discrimination bears absolutely no relationship to this contrast-sensitivity function. Evenmore to the point, performance is unaffected whenstimulation is confined to extrafoveal portions of theretina where spatial acuity is lower. These considerations rule out the involvement of slight stimulus differences between the two displays which, in orderto be detected, would require good visual acuity.These considerations apply equally to argumentsbased on acuity differences between the two eyeswhich, in the case of sine-wave gratings, manifestthemselves as contrast differences between the retinalimages. In any event, in our previous work (Blake &Cormack, 1979), we found that successful utroculardiscrimination survived deliberate trial-to-trial randomization of stimulus contrast.
Our results also tend to rule out as a cue slightdifferences in visual direction which can arise fromfixation disparity. For one thing, the rapid apparentmotion accompanying counterphase flicker wouldobliterate the position information conveyed by fixation disparity, yet for at least some observers, performance improves with flicker. For another thing,utrocular discrimination with horizontal gratings isequivalent to that with vertical, despite the fact thatvertical fixation disparities (which could provide cuesonly for horizontal contours) are extremely smallrelative to horizontal fixation disparities (Ogle,1950). Finally, there is no reason to expect fixationdisparity to be most effective at low spatial frequencies.
A skeptic might wonder whether observers wereemploying deliberate viewing strategies which wouldrender the task trivially simple. Such strategemsmight include closing one eye, viewing with crossedeyes, or altering an image by squinting one eye. Themore gracious critic, noting that the authors were thetwo principal observers, might point out that chronic
UTROCULAR DISCRIMINATION 65
suppression or lateral phorias could mimic these behaviors. These possibilities seem remote for severalreasons. In terms of our procedures, the cover/uncovertest was used specifically to compensate for anyphorias, and observers were instructed to fixate thecenter of the display, to keep both eyes open, and toinitiate a trial only when these conditions were met.The observers reported no difficulty in maintainingfusion of the two CRT displays and noted no phenomenal changes in the appearance of the patternfrom trial to trial. A pattern was seen on every trial,which would not be the case if one eye were chronically suppressed. Also, recall that observers coulddiscriminate monocular from binocular stimulationand could judge which eye received higher contrastwhen both eyes received a pattern. Neither of thesewould be possible if either eye were suppressed.
Finally, from the above discussion, it should beobvious that any extraneous cue or viewing strategymediating utrocular discrimination must be sensitiveto spatial frequency. We have been unable to find oreven conceive of a cue which would survive our experimental manipulations and which would be effective at low, but not at high, spatial frequencies.
Relation to Previous WorkThe present series of experiments explored several
variables also studied in earlier work. Our resultsshowing no effect of cycloplegia agree with those ofEnoch et al. (1969) and Smith (1945). Similarly, theabsence of an effect of duration is in agreement withthe findings of Enoch et al. and Pickersgill (1961).With respect to the effects of practice on utroculardiscrimination, Enoch et al. and Thelin and Altman(1929) reported moderate improvement from trainingwith feedback, especially among inexperienced observers. In the present study, no systematic effects ofpractice are revealed. This could be due to the factthat our observers were given many (>200) unrecorded practice trials before any data were collected.It might be noted that a few observers reported agrowing awareness of the unique sensation uponwhich they ultimately based their discrimination.
Our results reveal no difference between centraland peripheral stimulation, a finding which is at variance with the results of Enoch et al. (1969) andSmith (1945). Enoch et al. found that utrocular discrimination is superior in the central retina, but primarily in the case of short exposure durations. Theyconcluded that with longer durations, eye movementscould bring the target to the central retina. There is,however, a potential confound in their study. Theirdata for the central retina were obtained under conditions of location certainty, whereby, on each trial,observers knew exactly where the stimulus wouldappear. For their peripheral stimulus conditions,they employed multiple target locations, thereby in-
66 BLAKEANDCORMACK
troducing location uncertainty. It is conceivable thatlocation uncertainty, not retinal eccentricity, produced the observed effect.
Smith (1945) also reported that central stimulationyields better performance than peripheral stimulation. While his data are not confounded with location uncertainty, Smith himself speculated that fixation disparity might have been a source of error inthe results, reasoning that small location differencesbetween the two eyeswould be more noticeable in thefovea than in the periphery. In view of the nature ofSmith's stimuli (spots of light), this is a likely possibility.
In agreement with all previous work on utroculardiscrimination, we find evidence for large individualdifferences. At low spatial frequencies, observersrange along a continuum from nearly perfect discrimination to chance performance. At high spatialfrequencies, no individual differences are found; noobserver could make the discrimination at these values. In relation to earlier work, we do not know precisely the spatial frequency content of the targetsused in those studies. We have shown, though, thatthe presence of high spatial frequencies does notinterfere with utrocular discrimination so long as lowspatial frequency components are present. It is certainly possible that the successful observers in previous work were responding to low spatial frequencycomponents of the targets.
Theoretical ImplicationsThe data reported here have forced us to reexam
ine some of our conceptions regarding utrocular discrimination. These conceptions initially seemed quitereasonable and, indeed, stimulated our original interest in the problem. It stands to reason that utroculardiscrimination must be mediated by a mechanismwhich shows differential responses to inputs from thetwo eyes. Clearly, it cannot be based on cells whoseresponses to inputs from the two eyes are identical.Initially, we speculated that this mechanism mightconsist of monocularly innervated neurons. This speulation was reinforced by the finding that stereoblindindividuals, who show no binocular summation andvery little interocular transfer, have no difficultymaking utrocular judgments (Blake & Cormack,1979). The absence of binocular summation andinterocular transfer, as well as stereoblindness itself,are generally interpreted as reflecting a low proportion of binocular cells and a concomitantly high proportion of monocular cells. From these considerations, we inferred that among observers with normalstereopsis the same conditions which optimize utrocular discrimination should yield reduced binocularsummation, interocular transfer, and stereoacuity.Our results, however, show absolutely no tradeoffbetween utrocular performance, on the one hand,
and binocular summation and interocular transfer,on the other. This is particularly intriguing in the caseof interocular transfer, for it is widely believed thatthe failure of aftereffects to transfer completely reflects the involvement of monocular neurons. Whilewe found incomplete interocular transfer of thethreshold elevation aftereffect, the degree of transferwas equivalent at low and high spatial frequencieseven for an observer (R.B.) who shows excellentutrocular discrimination at low but not at high spatial frequencies. Nor did the degree of transfer forthis observer differ from that of an observer (R.C.)who fails at utrocular discrimination at all spatial frequencies. From this we must conclude that the mechanism underlying utrocular discrimination differsfrom that responsible for the incompleteness of interocular transfer.
With respect to our measures of stereoacuity, thereis some suggestion that stereopsis varies with spatialfrequency for those observers whose utrocular discrimination depends on spatial frequency. For observer R.C., who shows no utrocular discrimination,there appears to be no relationship between stereoacuity and spatial frequency. We are reluctant, however, to emphasize this finding, for two reasons.In the first place, the relationship is extremely modestand, in the second, all three observers exhibit excellent stereopsis on other more conventional tests. Still,it would seem worthwhile to examine in greater detail the influence of spatial frequency on stereopsis,particularly in a larger sample of observers. The procedures we have developed are uniquely suited forthis purpose.
Another tempting speculation centers on the possible differential contributions of X- and Y-cells toutrocular discrimination, an idea which motivated usto examine the effects of temporal frequency. In spiteof the modest, but definite, effects obtained, we haveencountered difficulties in developing an interpretation of utrocular performance based on these twoclasses of cells. The receptive field properties of Ycells led us to believe that they, rather than X-cells,might mediate utrocular discrimination. But, if thiswere true, it would imply that observers completelyunsuccessful at utrocular discrimination (e.g., R.C.)either lack the normal complement of Y-cells orpossess Y-cells with unusual properties which fail tosupply the requisite information. Now, we are awareof the fact that Y-cells can be profoundly influencedby early visual experience (e.g., Sherman, Hoffman,& Stone, 1972). Yet it would seem that such a dramatic anomaly in Y-cells should be expressed in othervisual functions, besides utrocular discrimination.But this is not the case, as evidenced by extensivevisual testing and performance on many other psychophysical tasks. The notion that Y-cells mediateutrocular discrimination also implies that X-cells and

Y-cells differ with respect to their ocular dominanceprofiles; specifically, Y-cells would have to exhibita greater degree of monocularity. A careful review ofthe relevant neurophysiological literature fails to reveal such a difference. For these reasons, it seemspremature to emphasize the possible differential involvement of X- and Y-cells in utrocular discrimination.
ConclusionOur experiments demonstrate that the ability to
judge which eye has received stimulation is uninfluenced by a variety of factors. In the case of ourstudies, these include duration, contrast, orientation,retinal locus, and practice, none of which altersperformance on the task. On the other hand, we havefor the first time identified a variable (i.e., spatialfrequency) which does exert strong control overutrocular discrimination. A high percentage of observers can perform this task at low spatial frequencies, while none can do so at high spatial frequencies. We have also discovered that temporal frequencymay exert at least weak control over utrocular discrimination for some observers. Identifying suchcontrolling variables represents an important step,for it now allows us to manipulate utrocular discrimination and thus observe its relationship to otherphenomena. This also makes it possible to assess theinvolvement of extraneous cues, as our earlier discussion has shown, and to test specific hypotheses regarding the basis of utrocular discrimination.
REFERENCES
BARLOW, H. B., BLAKEMORE, C., & PE'ITIGREW, J. D. The neuralmechanism of binocular depth discrimination. Journal ofPhysiology, 1967, 193,327-342.
BARRE'IT, G. V., & WILLIAMSON, T. R. Judging with which eyeone is viewing a three dimensional scene. Perceptual & MotorSkills, 1965,21,455-458.
BERKLEY, M. A., KI'ITERLE, F., & W ATKINS, D. W. Gratingvisibility as a function of orientation and retinal eccentricity.Vision Research, 1975,15,239-244.
BLAKE, R., & CORMACK, R. Psychophysical evidence for amonocular visual cortex in stereoblind humans. Science, 1979,203,274-275.
BLAKE, R., & Fox, R. The psychophysical inquiry into binocularsummation. Perception &Psychophysics, 1973, 14, 161-185.
BLAKE, R., & HIRSCH, H. V. B. Binocular depth discriminationin normal and specially-reared cats. Science, 1975, 190,1114-1116.
BLAKE, R., & LEVINSON, E. Spatial properties of binocularneurones in the human visual system. Experimental Brain Research, 1977,27,221-232.
BLAKEMORE, C. A new kind of stereoscopic vision. VisionResearch, 1970,10,1181-1199.
BRINDLEY, G. S. Physiology of the retina and visual pathway(2nd ed.). Baltimore: Williams & Wilkins, 1970.
CAMPBELL, F. W., & GREEN, D. G. Monocular versus binocularvisual acuity. Nature, 1965,208, 191-192.
CAMPBELL, F. W., HOWELL, E. R., & ROBSON, J. G. The appear-
UTROCULAR DISCRIMINATION 67
ance of gratings with and without the fundamental Fouriercomponent. Journal ofPhysiology (London), 1971, 217, 17-18P.
ENOCH, J., GOLDMANN, H., & SUNGA, R. The ability to distinguish which eye was stimulated by light. Investigative Ophthalmology, 1969,8,317-331.
FIORENTINI, A., & MAFFEI, L. Binocular depth perception without geometrical cues. Vision Research, 1971, 11, 1299-1305.
GREGORY, R. L. Eye and brain, the psychology ofseeing (3rd ed.).New York: McGraw-Hill, 1978.
HARMON, L. D., & JULESZ, B. Masking in visual recognition:Effects of two-dimensional filtered noise. Science, 1973, 180,1194-1197.
HEss, R. Interocular transfer in individuals with strabismic amblyopia; a cautionary note. Perception, 1978,7,201-205.
IKEDA, H., & WRIGHT, M. J. Processing of spatial and temporalinformation in the visual system. In F. O. Schmitt & F. G.Worden (Eds.), The neurosciences, third study program.Cambridge, Mass; MIT Press, 1974.
KELLY, D. H. Effects of sharp edges on the visibility of sinusoidal gratings. Journal of the Optical Society of America,1970,60,98-103.
KULlKOWSKI, J. J., & TOLHURST, D. J. Psychophysical evidencefor sustained and transient detectors in human vision. JournalofPhysiology, 1973,232,149-162.
LEGGE, G. E. Sustained and transient mechanisms in humanvision: Temporal and spatial properties. Vision Research, 1978,18,69-81.
LEMA, S. A., & BLAKE, R. Binocular summation in normal andstereoblind humans. Vision Research, 1977, 17,691-695.
MITCHELL, D. E., & WARE, C. Interocular transfer of a visualaftereffect in normal and stereoblind humans. Journal of Physiology, 1974,236,707-721.
MOVSHON, J. A., CHAMBERS, B. E. I., & BLAKEMORE, C.Interocular transfer in normal humans and those who lackstereopsis. Perception, 1972, 1,483-490.
NIKARA, T., BISHOP, P. 0., & PETTIGREW, J. D. Analysis ofretinal units in cat striate cortex. Experimental Brain Research,1968, 6, 353-372.
OGLE, K. N. Researches in binocular vision. New York: Hafner,1950.
PACKWOOD, J., & GORDON, B. Stereopsis in normal domesticcat, Siamese cat, and cat raised with alternate monocular occlusion. Journal ofNeurophysiology, 1975,38,1485-1499.
PICKERSGILL, M. J. On knowing with which eye one is seeing.Quarterly Journal of Experimental Psychology, 1%1, 13,168-172.
ROSE, D. Monocular versus binocular contrast thresholds formovement and pattern. Perception, 1978,7, 195-200.
SCHADE, O. H. Optical and photoelectric analog of the eye.Journal ofthe Optical Society ofAmerica, 1956,46,721-739.
SHERMAN, S. M., HOFFMAN, K. P., & STONE, J. Loss of a specific cell type from dorsal lateral geniculate nucleus in visuallydeprived cats. Journal ofPhysiology, 1972,35,532-541.
SMITH, S. Utrocular or 'which eye' discrimination. Journal ofExperimental Psychology, 1945,35, 1-14.
STROMEYER, C. F., & JULESZ, B. Spatial-frequency masking invision: Critical bands and spread of masking. Journal of theOptical Society ofAmerica, 1972,62, 1221-1232.
TEMPLETON, W. B., & GREEN, F. A. Chance results in utroculardiscrimination. Quarterly Journal ofExperimental Psychology,1968,20,200-203.
THELIN, E., & ALTMAN, E. R. Identification of monocular functions. Journal ofExperimental Psychology, 1929, 1,79-87.
WADE,N. J. On interocular transfer of the movement after-effectin individuals with and without normal binocular vision.Perception, 1976,4,85-95.
WARE, C., & MITCHELL, D. E. On interocular transfer of variousvisual aftereffects in normal and stereoblind observers. VisionResearch, 1974, 14,731-734.
68 BLAKE ANDCORMACK
NOTES
I. The term "utrocular" stems from the Latin root uter, meaning which one of two. It appears that Smith (1945) was the firstto employ this term in reference to the problem of distinguishingwhich eye was stimulated. In this paper, we shall use the terms"utrocular" and "eye of origin" interchangeably.
2. An interesting twist on the utrocular discrimination paradigmwas employed by Ternpleton and Green (1968). In that experiment, subjects viewed two circular light targets stereoscopically,such that each eye saw just one of the targets. Care was takento properly situate the two half-images such that fixation disparitywas minimal; the resulting percept was a single spot of light.From trial to trial, one of the two half-images was briefly extinguished and the subjects were asked to guess which eye's viewwas removed. Even with training and feedback, the subjects wereunable to perform above the chance level.
3. One of the reviewers points out that the input to the pupillomotor centers probably originates largely from the retinalW-cells, Because cells in this category tend to have poorerspatial resolving properties and hence to respond selectively tolower spatial frequencies, the reviewer suggests that the W-cellpathway may provide a plausible neural channel for utrocular discrimination. This is an intriguing hypothesis.
4. The only exception to this rule would be some situation wherestimulation of one, but only one, of the eyes evoked no neuralactivity, in which case utrocular discrimination would boil downto a judgment based simply on the presence or absence of activityon each trial. In this instance (which could arise if the two eyeswere to differ greatly in terms of sensitivity), monocular andbinocular stimulation would be indiscriminable.
(Received for publication December 18,1978;revision accepted March 15, 1979.)