ON THE VISIBILITY OF FLICKER DISTORTIONS IN...
6
ON THE VISIBILITY OF FLICKER DISTORTIONS IN NATURALISTIC VIDEOS Lark Kwon Choi 1 , Lawrence K. Cormack 2 , Alan C. Bovik 1 1 Department of Electrical & Computer Engineering, The University of Texas at Austin, Austin, TX, USA 2 Department of Psychology, The University of Texas at Austin, Austin, TX, USA ABSTRACT Motion can reduce the visibility of flicker distortions. We performed human subjective tests to investigate how motion influences the visibility of flicker distortions in naturalistic videos. Forty three naïve subjects participated in two tasks (“follow the moving object” and “view freely”) and reported their percepts on 36 test videos. Flicker distortions were simulated by periodic changes of video frames at different quality levels and flicker frequencies. An eye tracker was used to monitor each subject’s gaze. The results indicate that the visibility of flicker distortions is strongly reduced when the speed of coherent motion is large, and the effect is more pronounced when the video quality is poor. We conjecture that sufficiently fast and coherent motions near the gaze point mask or ‘silence’ the perception of flicker distortions in naturalistic videos in agreement with a recently observed ‘motion silencing’ effect on synthetic stimuli. Index Terms— Motion, flicker distortion, visibility of distortion, gaze, and video quality 1. INTRODUCTION As high-quality video applications become increasingly available and are exponentially growing, the reliable assessment of video quality plays an important role in satisfying the quality of service (QoS) delivered to consumers [1], [2]. Since humans are the final consumers of videos, the development of models of distortion perception is a key aspect in the design of systems that can accurately predict human opinions of visual quality. Relevant perceptual properties that have been used in video quality assessment (VQA) design include contrast sensitivity [3], visual attention [4], cortical motion representations [5], and temporal natural video statistics models [6]. The mere presence of distortion does not imply the quality degradation [7] for humans due to masking. The interactions between video content, distortion, and visible response are key to understanding distortion visibility. To understand the various characteristics of temporal visibility, psychologists and vision scientists have probed a variety of related topics, including visual masking [8], change blindness [9], crowding [10], and motion silencing [11]. Very recently, Suchow and Alvarez [11] demonstrated a “motion silencing” illusion, in which the salient temporal changes of an object in luminance, color, size, and shape appear to stop in the presence of sufficiently large, cohesive object motion. Their results imply that changes in object appearance are tightly coupled with motion, and that motion can dramatically alter the appearance and visibility of visual changes. While we believe that this can be explained using a space-time model of cortical simple cell responses [12], [13] the effect has only been studied on highly synthetic stimuli. From an engineering perspective, the visibility of distortion has been studied in the context of video compression. Netravali et al. [14] investigated the effects of luminance transitions on the perception of quantization noise and applied it to design a predictive coder. Girod [15] discussed the significance of spatial and temporal masking effects on source coding. Johnston et al. [16] used simple models of spatial and temporal masking to create a non- linear quantizer. Similarly, Puri et al. [17] designed an adaptive video coder using the visibility of noise on flat areas, textures, and edges. Horne et al. [18] suggested that further improvement could be obtained by measuring temporal activity in the video, driven by the notion that quantization noise on fast moving objects that the eye cannot track will be less visible than on slow moving objects. Haskell et al. [19] suggested that observers are more tolerant of distortions in moving images than in stationary images due to a presumed difficulty of focusing on details on moving objects. While a variety of ideas and algorithms have been proposed to account for “temporal masking” in video compression, implementations have been largely heuristic and/or been based on an anecdotal evidence. There has not yet been any systematic studies of the quantitative perceptual nature of texture masking phenomena on real-world, naturalistic videos. We aim to make progress in this direction by deepening our understanding of the silencing/masking phenomena. The idea of just-noticeable distortion (JND) has played an important role in video quality research. Hontsch et al. [20] presented an adaptive image coding method using JND and perceptual distortion control, while Jia et al. [21] estimated the JND of videos using the spatio-temporal contrast sensitivity function. Zhao et al. [22] measured the visibility of noise in space-time to accomplish VQA. An 2013 Fifth International Workshop on Quality of Multimedia Experience (QoMEX) 978-1-4799-0738-0/13/$31.00 ©2013 IEEE 164 QoMEX 2013
Transcript of ON THE VISIBILITY OF FLICKER DISTORTIONS IN...

ON THE VISIBILITY OF FLICKER DISTORTIONS IN NATURALISTIC VIDEOS
Lark Kwon Choi1, Lawrence K. Cormack2, Alan C. Bovik1
1Department of Electrical & Computer Engineering, The University of Texas at Austin, Austin, TX, USA
2Department of Psychology, The University of Texas at Austin, Austin, TX, USA
ABSTRACT Motion can reduce the visibility of flicker distortions. We performed human subjective tests to investigate how motion influences the visibility of flicker distortions in naturalistic videos. Forty three naïve subjects participated in two tasks (“follow the moving object” and “view freely”) and reported their percepts on 36 test videos. Flicker distortions were simulated by periodic changes of video frames at different quality levels and flicker frequencies. An eye tracker was used to monitor each subject’s gaze. The results indicate that the visibility of flicker distortions is strongly reduced when the speed of coherent motion is large, and the effect is more pronounced when the video quality is poor. We conjecture that sufficiently fast and coherent motions near the gaze point mask or ‘silence’ the perception of flicker distortions in naturalistic videos in agreement with a recently observed ‘motion silencing’ effect on synthetic stimuli.
Index Terms— Motion, flicker distortion, visibility of distortion, gaze, and video quality
1. INTRODUCTION As high-quality video applications become increasingly available and are exponentially growing, the reliable assessment of video quality plays an important role in satisfying the quality of service (QoS) delivered to consumers [1], [2]. Since humans are the final consumers of videos, the development of models of distortion perception is a key aspect in the design of systems that can accurately predict human opinions of visual quality. Relevant perceptual properties that have been used in video quality assessment (VQA) design include contrast sensitivity [3], visual attention [4], cortical motion representations [5], and temporal natural video statistics models [6].
The mere presence of distortion does not imply the quality degradation [7] for humans due to masking. The interactions between video content, distortion, and visible response are key to understanding distortion visibility.
To understand the various characteristics of temporal visibility, psychologists and vision scientists have probed a variety of related topics, including visual masking [8], change blindness [9], crowding [10], and motion silencing
[11]. Very recently, Suchow and Alvarez [11] demonstrated a “motion silencing” illusion, in which the salient temporal changes of an object in luminance, color, size, and shape appear to stop in the presence of sufficiently large, cohesive object motion. Their results imply that changes in object appearance are tightly coupled with motion, and that motion can dramatically alter the appearance and visibility of visual changes. While we believe that this can be explained using a space-time model of cortical simple cell responses [12], [13] the effect has only been studied on highly synthetic stimuli.
From an engineering perspective, the visibility of distortion has been studied in the context of video compression. Netravali et al. [14] investigated the effects of luminance transitions on the perception of quantization noise and applied it to design a predictive coder. Girod [15] discussed the significance of spatial and temporal masking effects on source coding. Johnston et al. [16] used simple models of spatial and temporal masking to create a non-linear quantizer. Similarly, Puri et al. [17] designed an adaptive video coder using the visibility of noise on flat areas, textures, and edges. Horne et al. [18] suggested that further improvement could be obtained by measuring temporal activity in the video, driven by the notion that quantization noise on fast moving objects that the eye cannot track will be less visible than on slow moving objects. Haskell et al. [19] suggested that observers are more tolerant of distortions in moving images than in stationary images due to a presumed difficulty of focusing on details on moving objects. While a variety of ideas and algorithms have been proposed to account for “temporal masking” in video compression, implementations have been largely heuristic and/or been based on an anecdotal evidence. There has not yet been any systematic studies of the quantitative perceptual nature of texture masking phenomena on real-world, naturalistic videos. We aim to make progress in this direction by deepening our understanding of the silencing/masking phenomena.
The idea of just-noticeable distortion (JND) has played an important role in video quality research. Hontsch et al. [20] presented an adaptive image coding method using JND and perceptual distortion control, while Jia et al. [21] estimated the JND of videos using the spatio-temporal contrast sensitivity function. Zhao et al. [22] measured the visibility of noise in space-time to accomplish VQA. An
2013 Fifth International Workshop on Quality of Multimedia Experience (QoMEX)
978-1-4799-0738-0/13/$31.00 ©2013 IEEE 164 QoMEX 2013

early successful approach to VQA was based on the JND principle [23]. Recently Ni et al. [24] executed a study of subjects viewing videos afflicted by noise, blur, and motion flicker. They studied the visibility of flicker as a function of flicker amplitude and frequency, but not how it is affected by motion. Likewise, other work has focused on factors such as color, details, and motion induced blur on flicker visibility [25], [26], but not on the impact of object motion.
Here we study a new observed motion silencing phenomenon wherein flicker visibility is affected by the speed of coherent object motion in naturalistic videos. We conducted a human subjective study to investigate the impact of object motion on flicker visibility. This was accomplished by presenting compressed videos undergoing regular, periodic changes in quality levels to 43 naïve subjects engaged in two tasks: an object tracking task (“follow the moving object”) and a “free viewing” task. We found the empirical distributions of flicker visibility on these tested videos and investigated the impact of motion on the visibility of these changes using a correlation analysis. Subjects’ gaze was measured by an eye tracker (faceLAB5, Seeing Machines) while motion in the videos were estimated by an optical flow algorithm.
The remainder of the paper is organized as follows. In Section 2, we describe the source videos, flicker distortion simulations, and subjective test methodology. The results of the human study are presented in Section 3. We conclude the paper in Section 4 with a discussion.
2. HUMAN STUDY DESIGN AND EXPERIMENT
2.1. Source videos and distortion simulation
Source videos were obtained using a RED ONE digitalcinematographic camera. The 12-bit REDCODE (.r3d)RAW data was captured at a resolution of 3K (3072 × 1728) at the frame rate of 30 fps using the 42MB/s option to ensure that the best possible acquisition quality was obtained. The source videos were truncated to 10 secondlengths and then downsampled to resolution 720p (1280 ×720) or cropped to 1920 × 720 at 30 fps. The .r3d videoswere converted into uncompressed .yuv files by a combination of the “imresize” (option: bicubic) function inMATLAB and Adobe Premiere CS5. One video, “Tr,” was added from a database available from the TechnicalUniversity of Munich [27] and followed the sameprocessing. A total of eight reference videos were selected.Two were used for a training session, while six were used for the test. Fig. 1 shows sample frames from the six testvideos. The marked areas show moving objects, while theblue arrows indicate the paths followed by moving objects.The reference videos include various speeds of objectmotions. For the first five videos (“Bb,” “BMX,” “La,” “Mr,” and “Rc”), the camera was fixed on a stable tripod, while for the “Tr” video sequence, the camera panned andzoomed as the video was acquired.
Bb BMX La
Mr Rc Tr
Fig. 1. Example frames of the videos used in the study. The marked areas indicate moving objects while arrows indicate the paths of object movement. The camera was fixed for the first five scenes but moved when acquiring the ‘‘Tr’’ scene.
(a) (b) Fig. 2. Schematic illustration of the flicker distortion simulation: (a) Video quality level changes. (b) Video frame duration changes. Every 2, 3, and 5 frames were alternated, corresponding to flicker frequencies of 7.5, 5, and 3Hz, respectively.
Flicker distortions were simulated by alternating subsequences of videos at different rates (amplitude) at three flicker frequencies (duration) as illustrated in Fig. 2. Flicker frequency means the number of rate alternations per second. More specifically, the flicker is caused by changing frames from high to low quantization parameter (QP) and then back from low to high QP in an H.264 codec. Each reference video was encoded using the JM reference implementation of H.264 Advanced Video Codec (AVC) [28] at one of four fixed QP values: QP26, QP32, QP38, and QP44. The perceptual video quality was found to be well separated using these QP values, corresponding to roughly excellent, good, poor, and bad, respectively, from QP26 to QP44. Over each flicker period, the QP was alternated either from QP44 to QP26, from QP38 to QP26, or from QP32 to QP26 by inserting appropriate segments from the four already compressed videos. Further, to investigate the effect of flicker frequency on the visibility of flicker as a function of motion, videos with variable-length QP durations (periods) were also constructed, corresponding to time-varying flicker frequencies of 7.5, 5, and 3Hz, respectively, all using a fixed alternating QP pair (QP38, QP26). Each case is illustrated in Fig. 2(a) and (b).
A transition from low to high quality decides flicker magnitude. When quality difference is large (e.g., QP44, QP26), the flicker magnitude is large, so flicker can be easily perceived. However, when quality difference is small (e.g., QP32, QP26), the flicker magnitude is small, so flicker can be perceived less. We investigate how flicker visibility at each quality difference is influenced by object speeds.
2013 Fifth International Workshop on Quality of Multimedia Experience (QoMEX)
165

Fig. 3. The subjective study interface displaying the instruction and the video to the subject. When each video begins, the instruction and the rating bar disappear except for a white score gauge along the bar. Subjects rate flicker visibility by moving a mouse up or down continuously. 2.2. Methods
A single-stimulus continuous quality evaluation (SSCQE) study [29] with hidden reference was conducted. Forty three University of Texas at Austin students served as naïve subjects. All subjects were between the ages of 20 and 35. Each was found to have normal or corrected-to-normal visual acuity (Snellen Test) and color perception (Ishihara Test). Subjects viewed videos on a 24" screen Dell U2410 monitor with a resolution of 1920 × 1080, using special-purpose processing and display software programmed in MATLAB and XGL toolbox [30]. Each entire video was loaded into memory before its presentation to avoid latency due to slow hard disk access of a large video file, and played on the center.
Before presenting a test video, visualization was displayed indicating the pre-defined moving object contained in each test video. The subjective study interface is shown in Fig. 3. A continuously calibrated rating bar was shown at the right side of the screen. The rating scale ranged from 0 to 100, where the increments 0, 25, 50, 75, and 100 were marked as “Hardly,” ”Little,” “Medium,” “Highly,” and “Extremely.” The initial score displayed on the rating bar was “Medium” at the beginning of each video. During play back, the rating bar disappeared.
An eye and head tracker (faceLAB 5, Seeing Machines) was used to monitor each subject’s gaze direction. The subjects’ heads were unrestrained. Gaze was calibrated by using a 9 point calibration sequence before each experiment, and it was recorded at every 1/60 second into calibrated display coordinates. Viewing distance was 87cm (three times of display height).
Each subject participated in two separate tasks; Task 1, “follow the moving object” and task 2, “free viewing.” Subjects performed Task 1 first and executed Task 2 after an enough rest (e.g., one day). In Task 1, subjects were requested to fixate their eyes on the pre-defined moving object throughout the duration of the video and to rate the visibility of flicker on the object by moving the mouse up or
down the scale continuously. In Task 2, subjects were requested to view videos naturally. Each task lasted less than 20 minutes, each of which consisted of 36 test videos (6 hidden reference videos and 30 flicker distorted videos) in randomized order. A short training session preceded the actual study to familiarize the subjects with the procedure.
In addition, a lag response (the time difference between the perception of flicker and the movement of a mouse to rate the visibility) was measured for each session and for each subject. Subjects were asked to move a mouse up when a black dot on a white background flickered and to move a mouse down when the dot did not flicker. The black dot distinctively flickered for 2 or 3 seconds. Time duration from the start of the dot flicker (or no-flicker) on the screen to the mouse movement by the subject was measured five times, and then those values were averaged.
3. EXPERIMENT RESULTS AND ANALYSIS
3.1. Processing of subjective flicker visibility scores
To ensure appropriate time synchronization between the frame at which the subject visually perceived the flicker and the mechanical scoring of flicker visibility (rated by hand), the evaluated score was matched after shifting score signals by the average lag response time for each subject. Let sijf denote the score assigned by subject i to video j at frame number f, msijf be the visibility score of subject i to video j at frame number f, and lag_i be the average lag response of subject i. Then the visibility score is given by,
msijf = sij(f + lag_i). (1)
The range of lag response time was 0.47 ~ 1.17 seconds (14 ~ 35 frames).
In order to unbias measured flicker visibility in each flicker distorted video from its content, we calculated the difference flicker visibility scores between the score that the subject assigned to each reference video and the scores assigned to the corresponding flicker distorted videos. Specifically, let msij_reff denote the flicker visibility score assigned by subject i to the reference no-flicker video associated with the distorted video j after lag response matching and, Mj be the total number of ratings received for video j. The difference scores dsijf are computed as
dsijf = msijf - msij_reff . (2)
The final flicker visibility score is
1jf ijf
ij
fvs dsM
= ∑ . (3)
The flicker visibility scores range continuously from 0 to 100, where 0 means that the subject failed to, or hardly perceived flicker on the moving object, while 100 means that the subject perceived flicker extremely and clearly.
2013 Fifth International Workshop on Quality of Multimedia Experience (QoMEX)
166
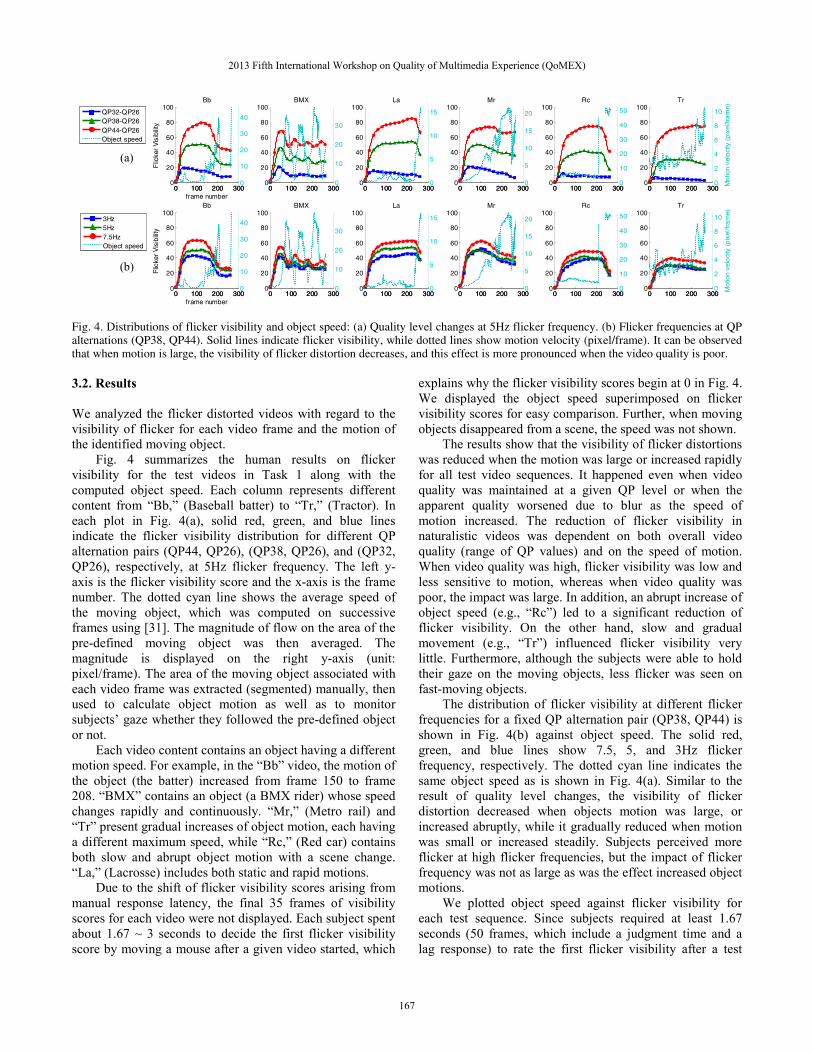
Fig. 4. Distributions of flicker visibility and object speed: (a) Quality level changes at 5Hz flicker frequency. (b) Flicker frequencies at QP alternations (QP38, QP44). Solid lines indicate flicker visibility, while dotted lines show motion velocity (pixel/frame). It can be observed that when motion is large, the visibility of flicker distortion decreases, and this effect is more pronounced when the video quality is poor.
3.2. Results We analyzed the flicker distorted videos with regard to the visibility of flicker for each video frame and the motion of the identified moving object.
Fig. 4 summarizes the human results on flicker visibility for the test videos in Task 1 along with the computed object speed. Each column represents different content from “Bb,” (Baseball batter) to “Tr,” (Tractor). In each plot in Fig. 4(a), solid red, green, and blue lines indicate the flicker visibility distribution for different QP alternation pairs (QP44, QP26), (QP38, QP26), and (QP32, QP26), respectively, at 5Hz flicker frequency. The left y-axis is the flicker visibility score and the x-axis is the frame number. The dotted cyan line shows the average speed of the moving object, which was computed on successive frames using [31]. The magnitude of flow on the area of the pre-defined moving object was then averaged. The magnitude is displayed on the right y-axis (unit: pixel/frame). The area of the moving object associated with each video frame was extracted (segmented) manually, then used to calculate object motion as well as to monitor subjects’ gaze whether they followed the pre-defined object or not.
Each video content contains an object having a different motion speed. For example, in the “Bb” video, the motion of the object (the batter) increased from frame 150 to frame 208. “BMX” contains an object (a BMX rider) whose speed changes rapidly and continuously. “Mr,” (Metro rail) and “Tr” present gradual increases of object motion, each having a different maximum speed, while “Rc,” (Red car) contains both slow and abrupt object motion with a scene change. “La,” (Lacrosse) includes both static and rapid motions.
Due to the shift of flicker visibility scores arising from manual response latency, the final 35 frames of visibility scores for each video were not displayed. Each subject spent about 1.67 ~ 3 seconds to decide the first flicker visibility score by moving a mouse after a given video started, which
explains why the flicker visibility scores begin at 0 in Fig. 4. We displayed the object speed superimposed on flicker visibility scores for easy comparison. Further, when moving objects disappeared from a scene, the speed was not shown.
The results show that the visibility of flicker distortions was reduced when the motion was large or increased rapidly for all test video sequences. It happened even when video quality was maintained at a given QP level or when the apparent quality worsened due to blur as the speed of motion increased. The reduction of flicker visibility in naturalistic videos was dependent on both overall video quality (range of QP values) and on the speed of motion. When video quality was high, flicker visibility was low and less sensitive to motion, whereas when video quality was poor, the impact was large. In addition, an abrupt increase of object speed (e.g., “Rc”) led to a significant reduction of flicker visibility. On the other hand, slow and gradual movement (e.g., “Tr”) influenced flicker visibility very little. Furthermore, although the subjects were able to hold their gaze on the moving objects, less flicker was seen on fast-moving objects.
The distribution of flicker visibility at different flicker frequencies for a fixed QP alternation pair (QP38, QP44) is shown in Fig. 4(b) against object speed. The solid red, green, and blue lines show 7.5, 5, and 3Hz flicker frequency, respectively. The dotted cyan line indicates the same object speed as is shown in Fig. 4(a). Similar to the result of quality level changes, the visibility of flicker distortion decreased when objects motion was large, or increased abruptly, while it gradually reduced when motion was small or increased steadily. Subjects perceived more flicker at high flicker frequencies, but the impact of flicker frequency was not as large as was the effect increased object motions.
We plotted object speed against flicker visibility for each test sequence. Since subjects required at least 1.67 seconds (50 frames, which include a judgment time and a lag response) to rate the first flicker visibility after a test
0 100 200 3000
20
40
60
80
100
Flic
ker
Vis
ibilit
y
frame number
Bb
0 100 200 3000
10
20
30
40
0 100 200 3000
20
40
60
80
100
Flic
ker
Vis
ibili
ty
frame number
Bb
0 100 200 3000
10
20
30
40
0 100 200 3000
20
40
60
80
100BMX
0 100 200 3000
10
20
30
0 100 200 3000
20
40
60
80
100BMX
0 100 200 3000
10
20
30
0 100 200 3000
20
40
60
80
100La
0 100 200 3000
5
10
15
0 100 200 3000
20
40
60
80
100La
0 100 200 3000
5
10
15
0 100 200 3000
20
40
60
80
100Mr
0 100 200 3000
5
10
15
20
0 100 200 3000
20
40
60
80
100Mr
0 100 200 3000
5
10
15
20
0 100 200 3000
20
40
60
80
100Rc
0 100 200 3000
10
20
30
40
50
0 100 200 3000
20
40
60
80
100Rc
0 100 200 3000
10
20
30
40
50
0 100 200 3000
20
40
60
80
100Tr
0 100 200 3000
2
4
6
8
10
Mo
tion
velo
city
(pi
xel/f
ram
e)
0 100 200 3000
20
40
60
80
100Tr
0 100 200 3000
2
4
6
8
10
Mot
ion
vel
oci
ty (p
ixel
/fra
me)
(a)
(b)
QP32-QP26QP38-QP26QP44-QP26Object speed
3Hz5Hz7.5HzObject speed
2013 Fifth International Workshop on Quality of Multimedia Experience (QoMEX)
167
Bb BMX La Mr Rc Tr Bb BMX La Mr Rc Tr
QP32-QP26
3Hz
QP38-QP26
5Hz
QP44-QP26 7.5Hz
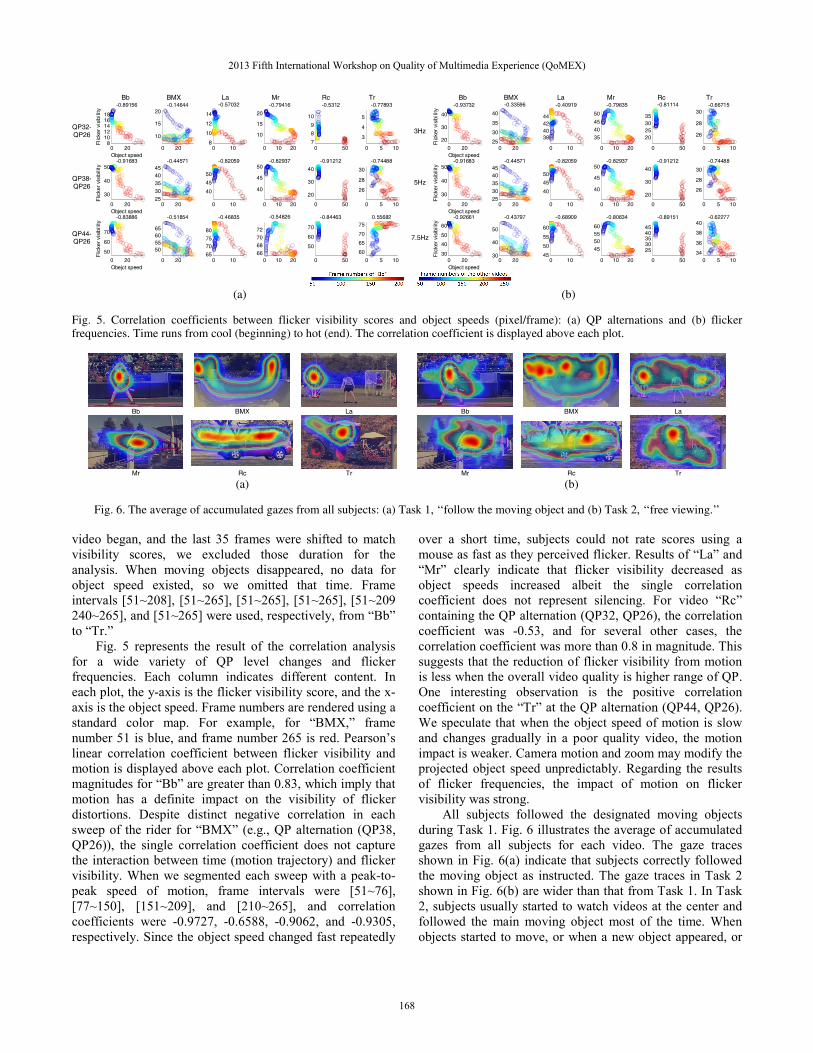
(a) (b) Fig. 5. Correlation coefficients between flicker visibility scores and object speeds (pixel/frame): (a) QP alternations and (b) flicker frequencies. Time runs from cool (beginning) to hot (end). The correlation coefficient is displayed above each plot.
Bb BMX La Bb BMX La
Mr Rc Tr Mr Rc Tr
(a) (b)
Fig. 6. The average of accumulated gazes from all subjects: (a) Task 1, ‘‘follow the moving object and (b) Task 2, ‘‘free viewing.’’
video began, and the last 35 frames were shifted to match visibility scores, we excluded those duration for the analysis. When moving objects disappeared, no data for object speed existed, so we omitted that time. Frame intervals [51~208], [51~265], [51~265], [51~265], [51~209 240~265], and [51~265] were used, respectively, from “Bb” to “Tr.”
Fig. 5 represents the result of the correlation analysis for a wide variety of QP level changes and flicker frequencies. Each column indicates different content. In each plot, the y-axis is the flicker visibility score, and the x-axis is the object speed. Frame numbers are rendered using a standard color map. For example, for “BMX,” frame number 51 is blue, and frame number 265 is red. Pearson’s linear correlation coefficient between flicker visibility and motion is displayed above each plot. Correlation coefficient magnitudes for “Bb” are greater than 0.83, which imply that motion has a definite impact on the visibility of flicker distortions. Despite distinct negative correlation in each sweep of the rider for “BMX” (e.g., QP alternation (QP38, QP26)), the single correlation coefficient does not capture the interaction between time (motion trajectory) and flicker visibility. When we segmented each sweep with a peak-to-peak speed of motion, frame intervals were [51~76], [77~150], [151~209], and [210~265], and correlation coefficients were -0.9727, -0.6588, -0.9062, and -0.9305, respectively. Since the object speed changed fast repeatedly
over a short time, subjects could not rate scores using a mouse as fast as they perceived flicker. Results of “La” and “Mr” clearly indicate that flicker visibility decreased as object speeds increased albeit the single correlation coefficient does not represent silencing. For video “Rc” containing the QP alternation (QP32, QP26), the correlation coefficient was -0.53, and for several other cases, the correlation coefficient was more than 0.8 in magnitude. This suggests that the reduction of flicker visibility from motion is less when the overall video quality is higher range of QP. One interesting observation is the positive correlation coefficient on the “Tr” at the QP alternation (QP44, QP26). We speculate that when the object speed of motion is slow and changes gradually in a poor quality video, the motion impact is weaker. Camera motion and zoom may modify the projected object speed unpredictably. Regarding the results of flicker frequencies, the impact of motion on flicker visibility was strong.
All subjects followed the designated moving objects during Task 1. Fig. 6 illustrates the average of accumulated gazes from all subjects for each video. The gaze traces shown in Fig. 6(a) indicate that subjects correctly followed the moving object as instructed. The gaze traces in Task 2 shown in Fig. 6(b) are wider than that from Task 1. In Task 2, subjects usually started to watch videos at the center and followed the main moving object most of the time. When objects started to move, or when a new object appeared, or
0 208
1012141618
-0.89156
Object speed
Flic
ker
visi
bilit
y
0 20
30
40
50-0.91683
Object speed
Flic
ker
visi
bilit
y
0 20
50
60
70
-0.83886
Obejct speed
Flic
ker
visi
bilit
y
0 20
10
15
20-0.14644
0 202530354045
-0.44571
0 20
50556065
-0.51854
0 108
10
12
14
-0.57032
0 10
40
45
50
-0.82059
0 1065
7075
80
-0.46835
0 10 20
10
15
20
-0.79416
0 10 20
40
45
50-0.82937
0 10 2066687072
-0.54826
0 507
8
9
10
-0.5312
0 50
20
30
40
-0.91212
0 50
50
60
70
-0.84463
0 5 10
3
4
5
-0.77893
0 5 10
26
28
30
-0.74488
0 5 10
60
65
70
750.55682
0 2030
40
50
60
-0.92661
Object speed
Flic
ker
visi
bilit
y
0 20
30
40
50-0.91683
Object speed
Flic
ker
visi
bilit
y
0 20
20
30
40
-0.93732
Object speed
Flic
ker
visi
bilit
y
0 2030
40
50
-0.43797
0 202530354045
-0.44571
0 2025
30
35
40
-0.33596
0 1045
50
55
60
-0.68909
0 10
40
45
50
-0.82059
0 10
38404244
-0.40919
0 10 20
45505560
-0.80634
0 10 20
40
45
50-0.82937
0 10 20
354045
50
-0.79635
0 50
2530354045
-0.89151
0 50
20
30
40
-0.91212
0 50
20253035
-0.81114
0 5 1034
36
38
40-0.62277
0 5 10
26
28
30
-0.74488
0 5 10
26
28
30-0.66715
2013 Fifth International Workshop on Quality of Multimedia Experience (QoMEX)
168
when a large distortion occurred, the gazes were drawn to these events. On high quality video sequences, subjects tended to look primarily at the moving objects, and the motion impact was similar to the result of Task 1.
In Task 2, “free viewing,” we first found the gaze positions on each frame, then computed the magnitude of the optical flow corresponding to the gaze, and then associated the speed of motion with the flicker visibility. Because gaze movements occurred much more quickly than the rating of flicker visibility using a mouse, it was difficult to analyze the impact of motion using the same method as in Task 1. However, we still noticed that the overall flicker visibility was more greatly reduced when subjects followed fast moving objects than slow motion.
4. CONCLUSION
We analyzed the impact of object motion on the visibility of flicker distortions in naturalistic videos. The results revealed that the visibility of flicker in natural videos strongly relies on the speed of motion. We found that less flicker was seen on fast-moving objects even if subjects held their gaze on the moving objects. Based on these observations and other recent evidence, we suggest that large coherent motions silence the awareness of flicker on naturalistic videos.
5. REFERENCES
[1] Cisco Systems, Inc., “Cisco visual networking index: global mobile data traffic forecast update, 2012-2017,” Feb. 2013. [2] S. Chikkerur, V. Sundaram, M. Reisslein, and L. J. Karam, “Objective video quality assessment methods: A classification, review, and performance comparison,” IEEE Trans. Broadcast., vol. 57, no. 2, pp. 165-182, Jun. 2011. [3] C. J. van den Branden Lambrecht, D. M. Costantini, G. L. Sicuranza, and M. Kunt, “Quality assessment of motion rendition in video coding,” IEEE Trans. Circuits Syst. Video Technol., vol. 9, no. 5, pp. 766-782, Aug. 1999. [4] J. You, J. Korhonen, A. Perkis, and T. Ebrahimi, “Balancing attended and global stimuli in perceived video quality assessment,” IEEE Trans. Multimedia, vol. 13, no. 6, pp. 1269-1285, 2011. [5] K. Seshadrinathan and A. C. Bovik, “Motion tuned spatio-temporal quality assessment of natural videos,” IEEE Trans. Image Process., vol. 19, no. 2, pp. 335-350, Feb. 2010. [6] R. Soundararajan, and A. C. Bovik, “Video quality assessment by reduced reference spatio-temporal entropic differencing,” IEEE Trans. Circuits Syst. Video Technol., vol. 23, no. 4, pp. 684-694, Apr. 2013. [7] S. Hemami and A. Reibman, “No-reference image and video quality estimation: Applications and human-motivated design,” Signal Process.:Image Commun.,vol. 25, no. 7, pp. 469-481, 2010. [8] J. T. Enns, and V. Di Lollo, “What’s new in visual masking?” Trends Cogn. Sci., vol. 4, no. 9, pp. 345-352, Sep. 2000. [9] D. J. Simons, and R. A. Rensink, “Change blindness: past, present, and future,” Trends Cogn. Sci., vol. 9, no. 1, pp. 16-20, Jan. 2005. [10] D. G. Pelli, and K. A. Tillman, “The uncrowded window of object recognition,” Nature Neurosci., vol. 11, no. 10, pp. 1129-1135, Oct. 2008.
[11] J. W. Suchow and G. A. Alvarez, “Motion silences awareness of visual change,” Curr. Biol., vol. 21, no. 2, pp.140-143, 2011. [12] L. K. Choi, A. C. Bovik, and L. K. Cormack, “Spatiotemporal flicker detector model of motion silencing,” Journal of Vision, 2013 (submitted). [13] E. H. Adelson, and J. R. Bergen, “Spatiotemporal energy models for the perception of motion,” J. Opt. Soc. Am. A, vol. 2, no. 2, pp. 284-299, Feb. 1985. [14] A. N. Netravali and B. Prasada, “Adaptive quantization of picture signals using spatial masking,” Proc. IEEE, vol. 65, no. 4, pp. 536-548, Apr. 1977. [15] B. Girod, “The information theoretical significance of spatial and temporal masking in video signals,” Proc. SPIE Human Vision, Visual Processing, and Digital Display, vol. 1077, pp. 178-187, 1989. [16] J. D. Johnston et al. “Adaptive non-linear quantizer,” U.S. Patent 5 136 377, Aug. 4, 1992. [17] A. Puri and R. Aravind, “Motion-compensated video with adaptive perceptual quantization,” IEEE Trans. Circuits Syst. Video Technol., vol. 1, pp. 351-378, Dec. 1991. [18] C. Horne and A. Puri, “Video coding with adaptive quantization and rate control,” Proc. SPIE Visual Commun. Image Processing, vol. 1818, pp. 798-806, 1992. [19] B. G. Haskell, F. W. Mounts, and J. C. Candy, “Interframe coding of videotelephone pictures,” Proc. IEEE, vol. 60, pp. 792-800, Jul. 1972. [20] I. Hontsch and L. J. Karam, “Adaptive image coding with perceptual distortion control,” IEEE Trans. Image Process., vol. 11, no. 3, pp. 213-222, Mar. 2002. [21] Y. Jia, W. Lin, and A. A. Kassim, “Estimating just-noticeable distortion for video,” IEEE Trans. Circuits Syst. Video Technol., vol. 16, no. 7, pp. 820-829, Jul. 2006. [22] Y. Zhao, L. Yu, Z. Chen, and C. Zhu, “Video quality assessment based on measuring perceptual noise from spatial and temporal perspectives,” IEEE Trans. Circuits Syst. Video Technol., vol. 21, no. 12, pp. 1890-1902, Dec. 2011. [23] Sarnoff Corp., “Sarnoff JND vision model algorithm description and testing,” VQEG, Aug. 1997. [24] P. Ni, R. Eg, A. Eichhorn, C. Griwodz, and P. Halvorsen, “Flicker effects in adaptive video streaming to handheld devices,” Proc. ACM Multimedia, pp. 463-472, 2011. [25] Y. Zhang, W. Song, and K. Teunissen, “A tradeoff between motion blur and flicker visibility of electronic display devices,” Proc. SPIE 6625, 2008. [26] L. Wang, Y. Tu, L. Chen, L. Xia, and X. Zhong, “Influence of color and details in image content on flicker visibility in a scanning-backlight LCD,” Proc. SPIE 7529, 2010. [27] Technical University of Munich. [Online]. Available: ftp://ftp.ldv.e-technik.tu-muenchen.de/pub/test_sequences/ [28] SVC Reference Software (JSVM Software), Joint Video Team (JVT), [Online]. Available: http://www.hhi.fraunhofer.de/ [29] ITU-R Rec. BT. 500-11, “Methodology for the subjective assessment of the quality of television pictures,” 2002. [30] The XGL Toolbox, 2008 [Online]. Available: http://svi.cps.utexas.edu/xgltoolbox-1.0.5.zip [31] D. Sun, S. Roth, and M. J. Black, “Secrets of optical flow estimation and their principles,” Proc. IEEE Conf. Comput. Vis. Pattern Recognit., pp. 2432-2439, 2010.
2013 Fifth International Workshop on Quality of Multimedia Experience (QoMEX)
169