On The Tandem (+) Project Integration with INSPIRE (ESDI) Lars H. Backer Statistics Sweden and the...
38
On The Tandem (+) Project Integration with INSPIRE (ESDI) Lars H. Backer Statistics Sweden and the Tandem consortium
-
Upload
jana-roles -
Category
Documents
-
view
216 -
download
1
Transcript of On The Tandem (+) Project Integration with INSPIRE (ESDI) Lars H. Backer Statistics Sweden and the...
On The Tandem (+) ProjectIntegration with INSPIRE (ESDI)
Lars H. BackerStatistics Sweden and the Tandem consortium
3 fundamental Questions
• Why a ESDI – A question of defining user needs?
• What do we mean by a ESDI– A question of formulating a set of specifications?
• How to implement the ESDI– A question of design and implementation?

Why: To satisfy User needs
A deductive and an inductive method
Theory:
• Deductive– Top down (ad hoc) approach to design and implementation.– Suitable to describe large markets with a large number of different
actors whose needs are difficult to describe.
• Inductive– Bottom up approach to design and implementation.– Suitable to describe large markets with a limited number of similar
actors whose needs are difficult but possible to describe.
• Both and or Either or? – Apply both at the same time? Is that feasible?
Practice:
• A deductive method– That the INSPIRE initiative appears to be primarily based on an
deductive method. – For a mass market of small users (citizens and a certain group from
representatives from business and industry).– Cannot be based on dependable descriptions of a large and
heterogenous group of ”user needs”. – Difficult to make good impact asessments when using this approach..
• An inductive method– We suggest supportive studies based on an inductive method. – For a mass market of small users (government and a certain group
from representatives from business and industry). – Can be based on dependable descriptions of a small but important
group of ”users needs”. – Dependable mehods for impact asessment when using this approach.
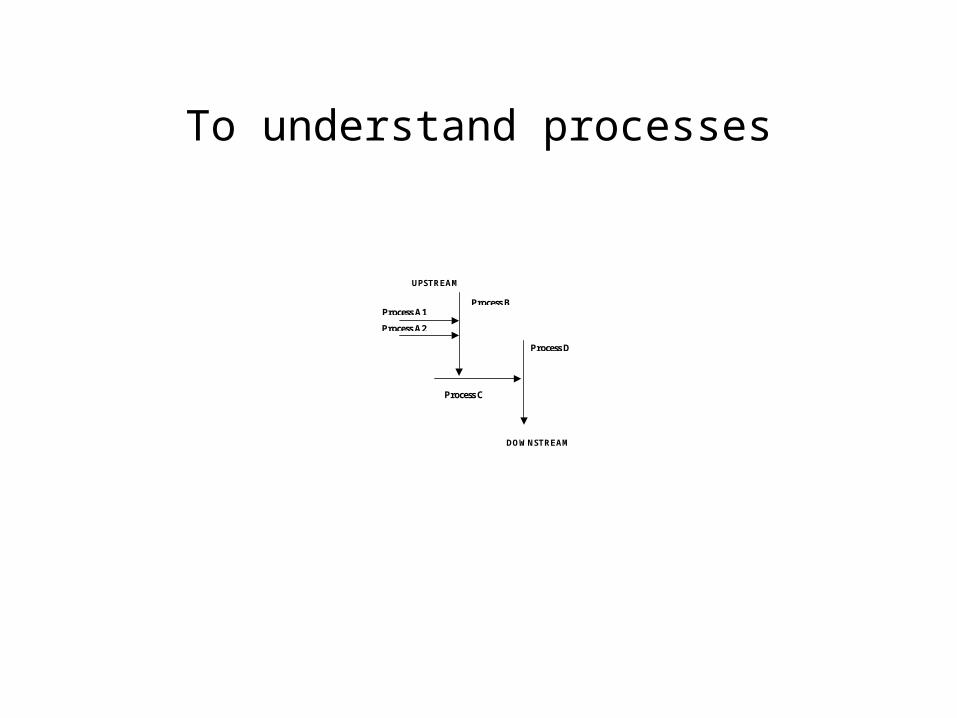
To understand processes
Process A1
Process A2
Process C
Process B
Process D
DOWNSTREAM
UPSTREAM
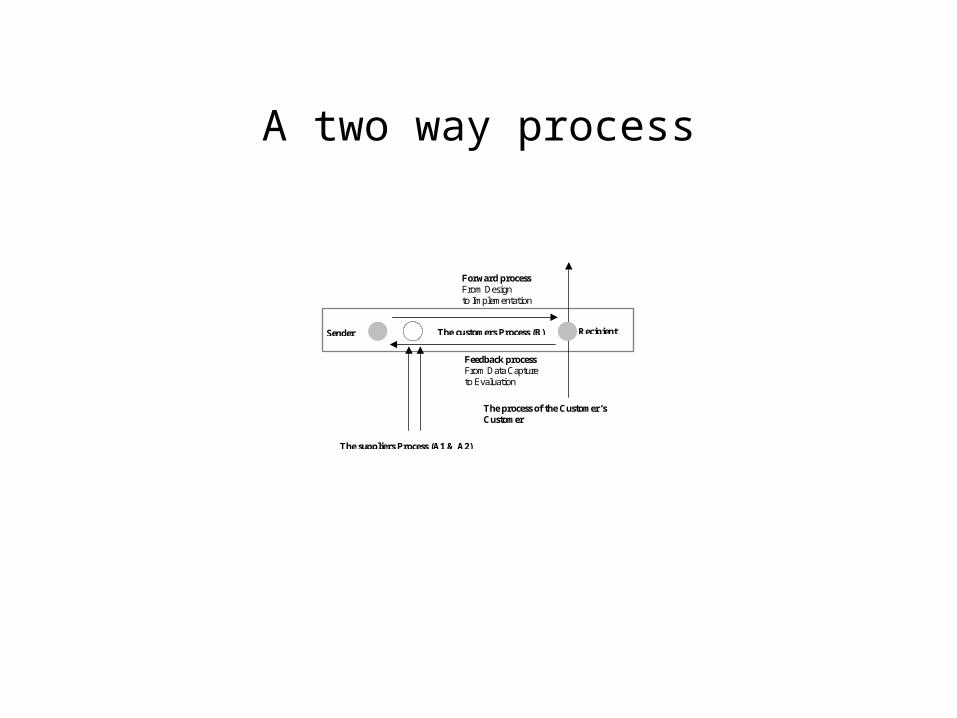
A two way process
Sender
Feedback process From Data Capture to Evaluation
The customers Process (B)
The process of the Customer’s Customer
Forward process From Design to Implementation
Recipient
The suppliers Process (A1 & A2)
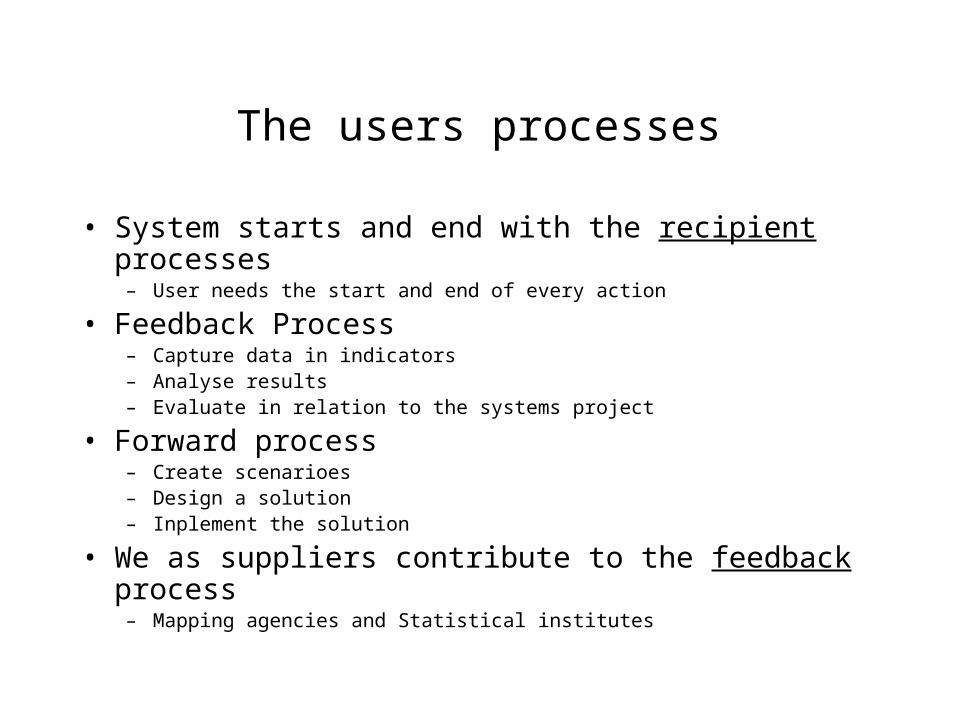
The users processes
• System starts and end with the recipient processes– User needs the start and end of every action
• Feedback Process– Capture data in indicators – Analyse results– Evaluate in relation to the systems project
• Forward process– Create scenarioes– Design a solution– Inplement the solution
• We as suppliers contribute to the feedback process– Mapping agencies and Statistical institutes
What: A spatial data infrastructure
The description and analysis ofsystems of interacting objects
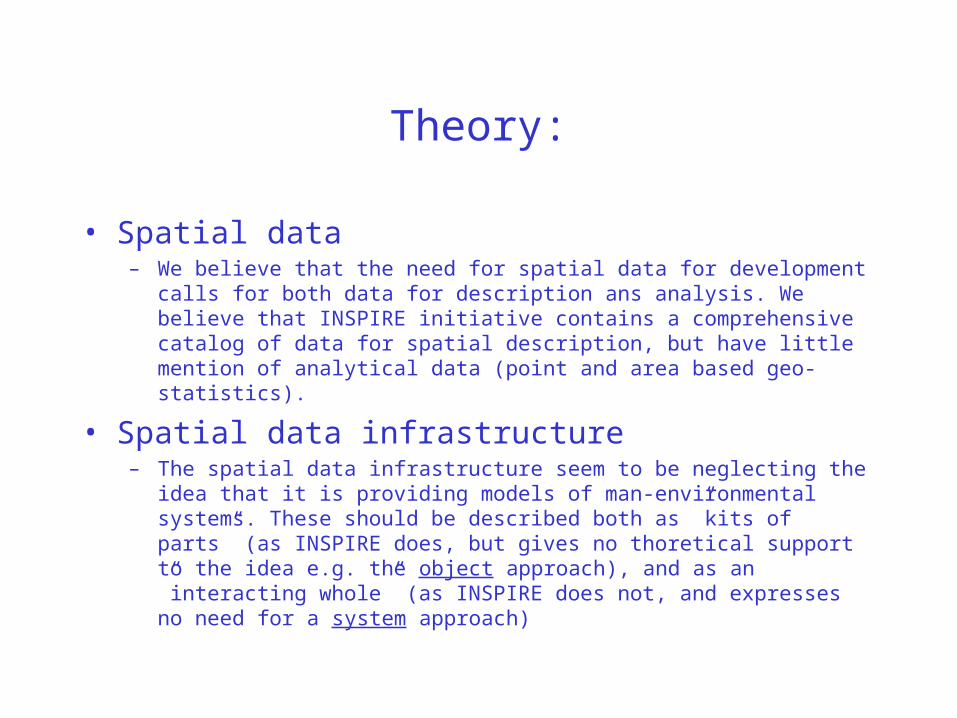
Theory:
• Spatial data– We believe that the need for spatial data for development calls for
both data for description ans analysis. We believe that INSPIRE initiative contains a comprehensive catalog of data for spatial description, but have little mention of analytical data (point and area based geo-statistics).
• Spatial data infrastructure– The spatial data infrastructure seem to be neglecting the idea that
it is providing models of man-environmental systems. These should be described both as ”kits of parts” (as INSPIRE does, but gives no thoretical support to the idea e.g. the object approach), and as an ”interacting whole” (as INSPIRE does not, and expresses no need for a system approach)
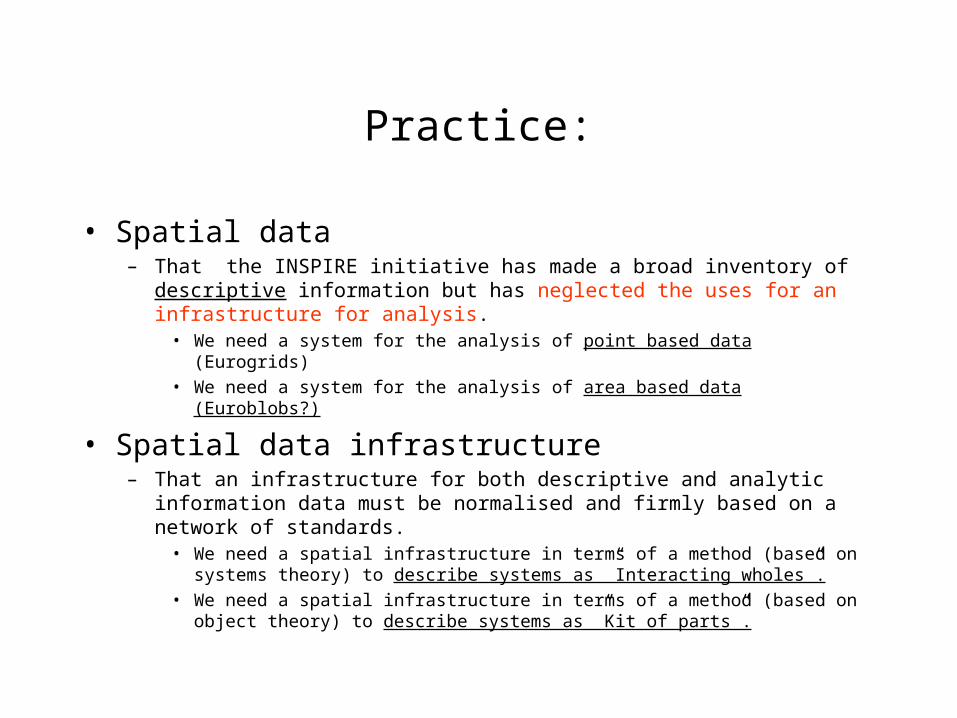
Practice:
• Spatial data– That the INSPIRE initiative has made a broad inventory of
descriptive information but has neglected the uses for an infrastructure for analysis.
• We need a system for the analysis of point based data (Eurogrids)• We need a system for the analysis of area based data (Euroblobs?)
• Spatial data infrastructure– That an infrastructure for both descriptive and analytic information
data must be normalised and firmly based on a network of standards.
• We need a spatial infrastructure in terms of a method (based on systems theory) to describe systems as ”Interacting wholes”.
• We need a spatial infrastructure in terms of a method (based on object theory) to describe systems as ”Kit of parts”.
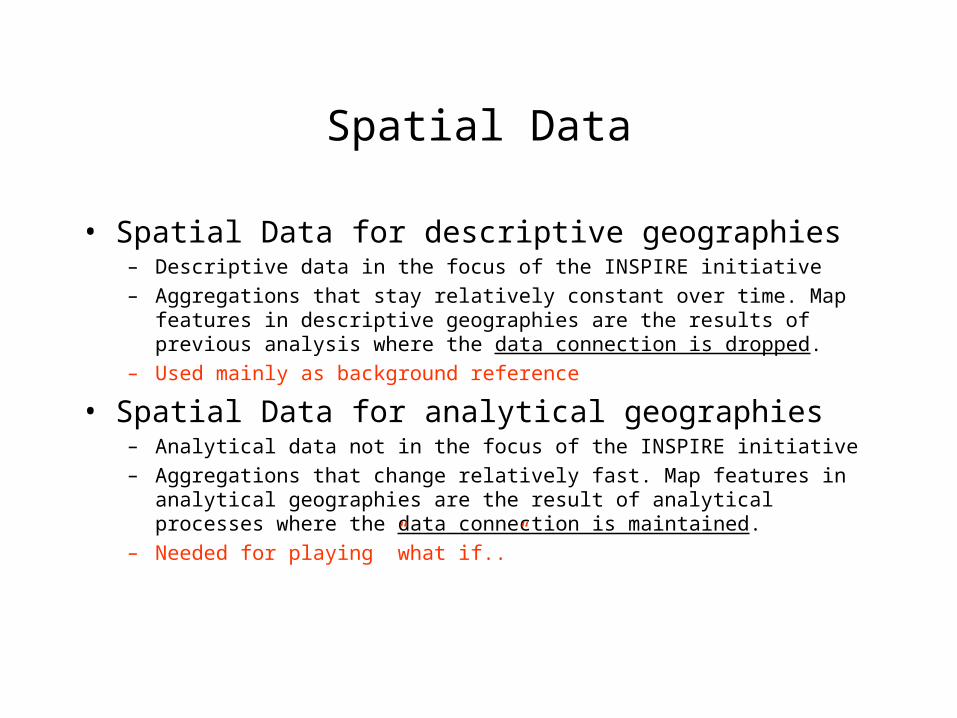
Spatial Data
• Spatial Data for descriptive geographies– Descriptive data in the focus of the INSPIRE initiative– Aggregations that stay relatively constant over time. Map features
in descriptive geographies are the results of previous analysis where the data connection is dropped.
– Used mainly as background reference
• Spatial Data for analytical geographies– Analytical data not in the focus of the INSPIRE initiative– Aggregations that change relatively fast. Map features in analytical
geographies are the result of analytical processes where the data connection is maintained.
– Needed for playing ”what if..”
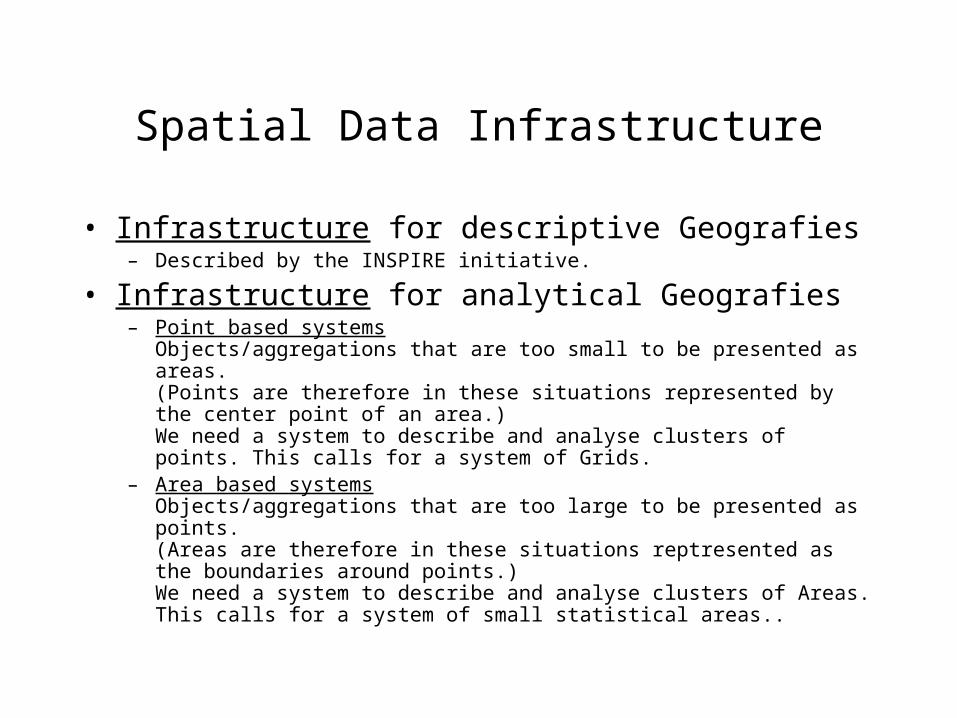
Spatial Data Infrastructure
• Infrastructure for descriptive Geografies– Described by the INSPIRE initiative.
• Infrastructure for analytical Geografies– Point based systems
Objects/aggregations that are too small to be presented as areas. (Points are therefore in these situations represented by the center point of an area.)We need a system to describe and analyse clusters of points. This calls for a system of Grids.
– Area based systemsObjects/aggregations that are too large to be presented as points. (Areas are therefore in these situations reptresented as the boundaries around points.)We need a system to describe and analyse clusters of Areas. This calls for a system of small statistical areas..
Infrastructure: Data
The description and analysis ofsystems of interacting objects
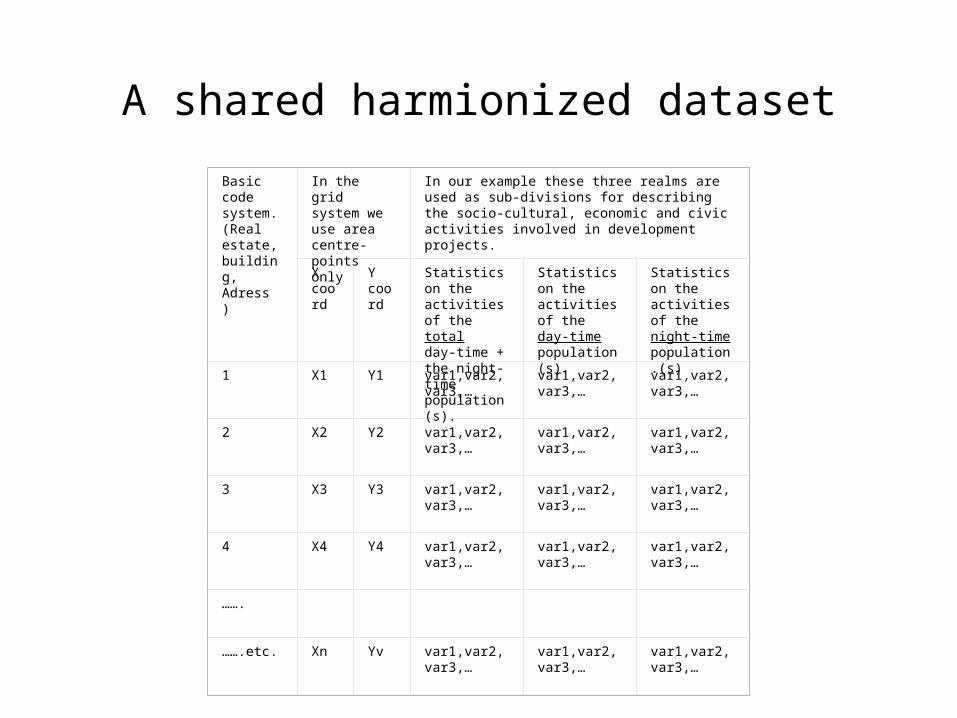
Basic code system. (Real estate, building, Adress )
In the grid system we use area centre-points only
In our example these three realms are used as sub-divisions for describing the socio-cultural, economic and civic activities involved in development projects.
X coord
Y coord
Statistics on the activities of the total day-time + the night-time population(s).
Statistics on the activities of the day-time population(s).
Statistics on the activities of the night-time population.(s)
1 X1 Y1 var1,var2,var3,…
var1,var2,var3,…
var1,var2,var3,…
2 X2 Y2 var1,var2,var3,…
var1,var2,var3,…
var1,var2,var3,…
3 X3 Y3 var1,var2,var3,…
var1,var2,var3,…
var1,var2,var3,…
4 X4 Y4 var1,var2,var3,…
var1,var2,var3,…
var1,var2,var3,…
…….
…….etc. Xn Yv var1,var2,var3,…
var1,var2,var3,…
var1,var2,var3,…
A shared harmionized dataset
Infrastructure: Features (1)
We need to agree on the most important aspects of a system of
irregular tessellations.
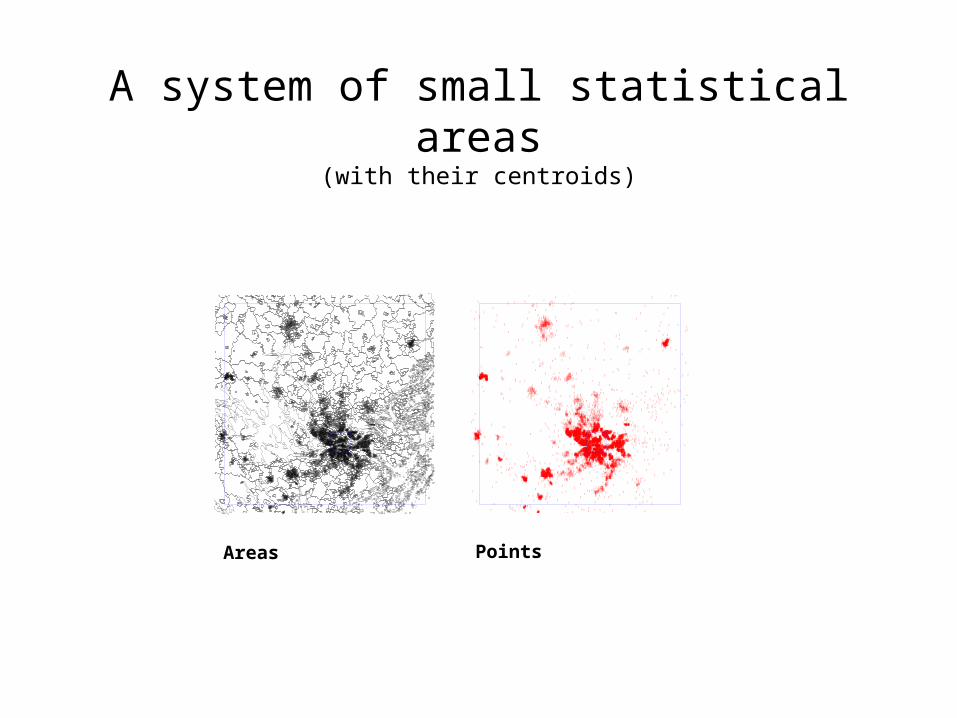
A system of small statistical areas(with their centroids)
Areas Points
Infrastructure: Features (2)
We need to agree on the most important aspects of a system of
regular tessellations.
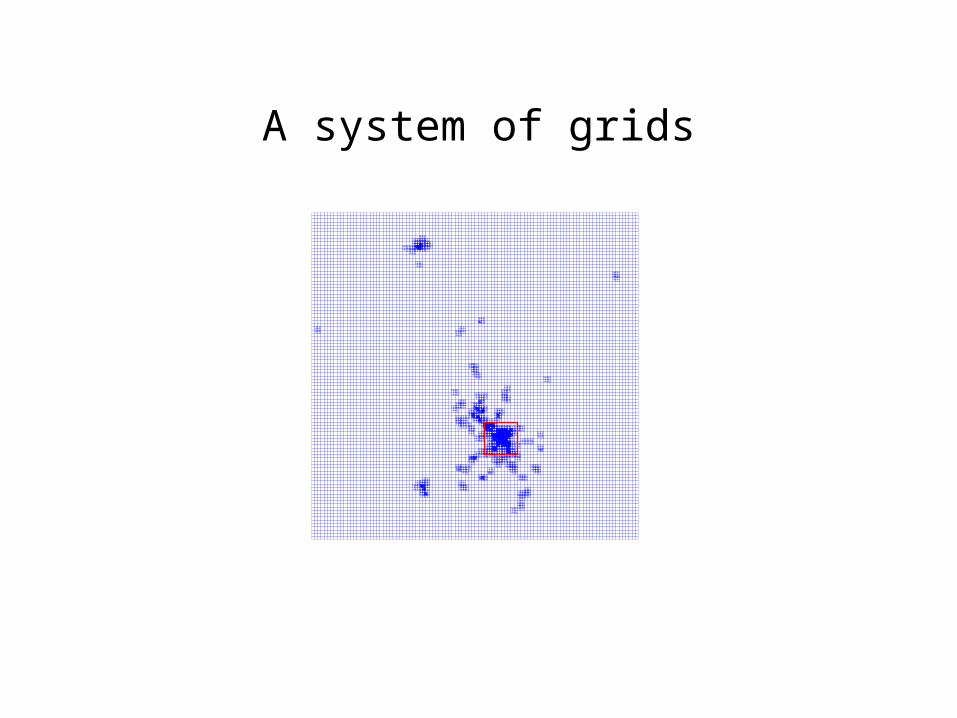
A system of grids
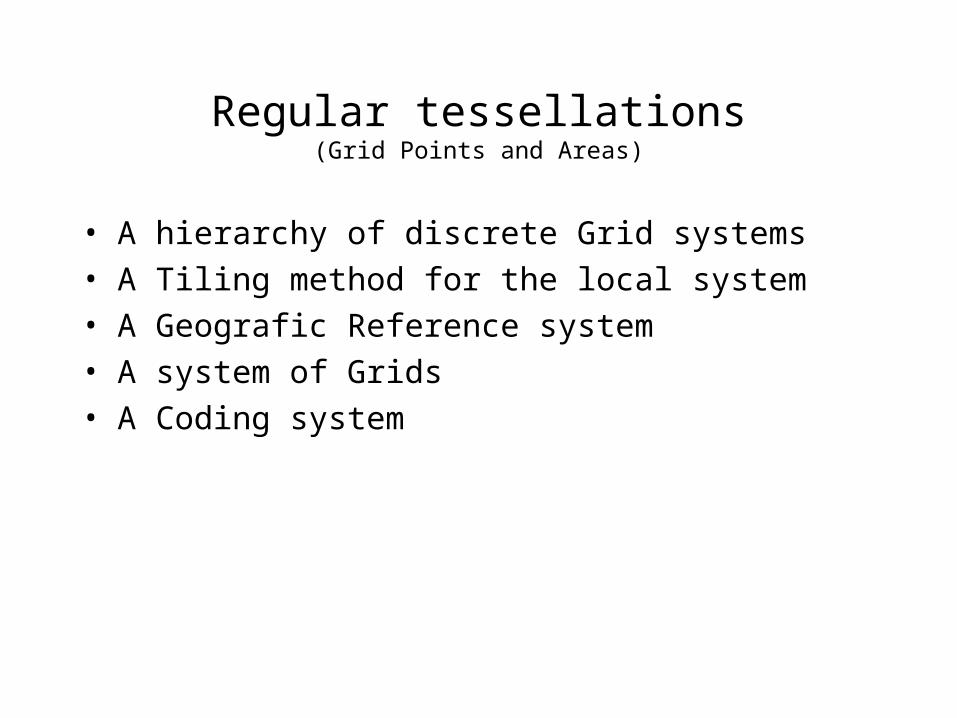
Regular tessellations(Grid Points and Areas)
• A hierarchy of discrete Grid systems• A Tiling method for the local system• A Geografic Reference system• A system of Grids• A Coding system
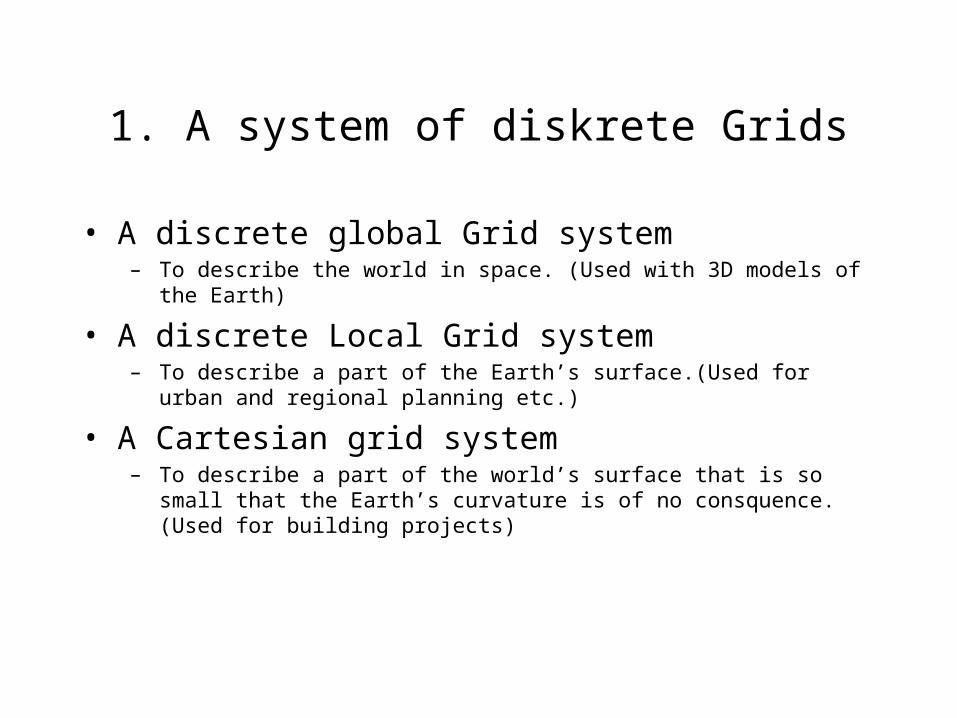
1. A system of diskrete Grids
• A discrete global Grid system– To describe the world in space. (Used with 3D models of the Earth)
• A discrete Local Grid system– To describe a part of the Earth’s surface.(Used for urban and
regional planning etc.)
• A Cartesian grid system– To describe a part of the world’s surface that is so small that the
Earth’s curvature is of no consquence. (Used for building projects)
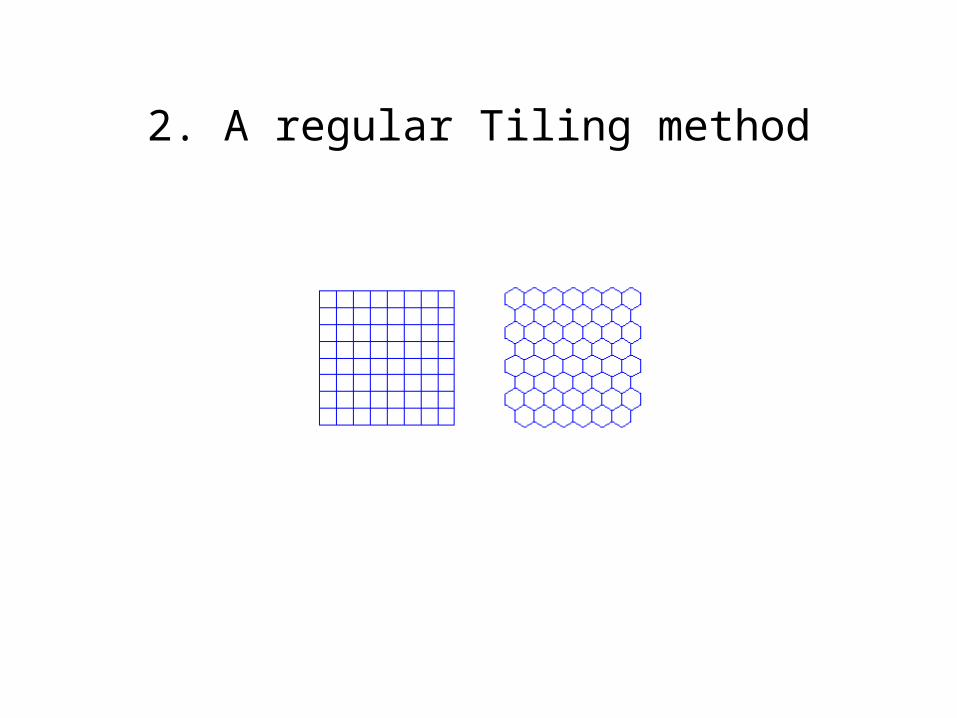
2. A regular Tiling method
3. A System of Grids
• A system / hierarchy of windows• A system of primary Grids• A system of secondary Grids
4. A Spatial reference system
• A standard reference System– A Standard Datum (ETRF 89)– A Standard equal-area projection system for storing spatial data
(Lambert Azimutal Equal Area Projection)– A Standard Coordinate system (Angular or chartesian)
• A series of ezual area Map projections– ETRS Lambert Azimutal Equal Area Coordinate reference system)– UTM
5. The coordinate based coding system
• There are two general approaches to the construction of coordinatebased coding systems:
• The Minimum_x+Minimum_Y method. – A 1000x1000 km grid is in a 6-digit system coded as x1y1– A 1000x1000 km grid is in a 6-digit system coded as x1x2y1y2– A 1000x1000 km grid is in a 6-digit system coded as x1x2yx31y2y3– Etc.
• The x1y1+x2y2+….xnyn method– A 1000x1000 km grid is in a 6-digit system coded as x1y1– A 100x100 km grid is in a 6-digit system coded as x1y1x2y2– A 100x100 km grid is in a 6-digit system coded as x1y1x2y2x3y3– Etc
Infrastructure: Methods
The most important is a shared method for delineation with both total registers
and samplig databases.

Delineation methods important (krieging methods)
How: Implementation
”Interacting wholes” and ”Kits of parts”
Theory:
• A ”Kit of parts”– In theory a system must be built as a ”kit of parts”. – Under reductonism we believed that complex systems may be
described in terms of its parts. But in order to build one you have to describe it in this manner.
• An ”Interacting whole” – Every complex system is used, and have to be described in terms
of ”interacting wholes”.– It is crurrently argued that a system described as an interacting
whole is much more than the sum of its parts and must be descrbed as such.
Practice:
• ”Kit of parts” (structures in focus)– That the solution is structured as a ”kit of parts” consisting of
three basic components that may be implemented one at the time. • E-ESDI • I-ESDI • H-ESDI
– This process may very well start with the E-ESDI, but not without a view to the whole.
• ”Interacting whole” (processes in focus)– That we build a solution for a spatial data infrastructure as an
”integrated whole”. This calls for an integrated design approach.– The INSPIRE initiative presents no design for an ESDI that
describes the system in all its parts (e.g. interaction between an E-ESDI an H-ESDI and a I-ESDI). But it will have to in order to make it work in cross border situations.
A series of itterations
• A Design Phase– We believe that we have passed the design phase.– Iterations
• A Prototype Phase– We have the framework for a prototype to a system in the Nordic
Grids system– Iterations
• An Implementation phase– We should take the initiative towards an implementation phase– Iterations
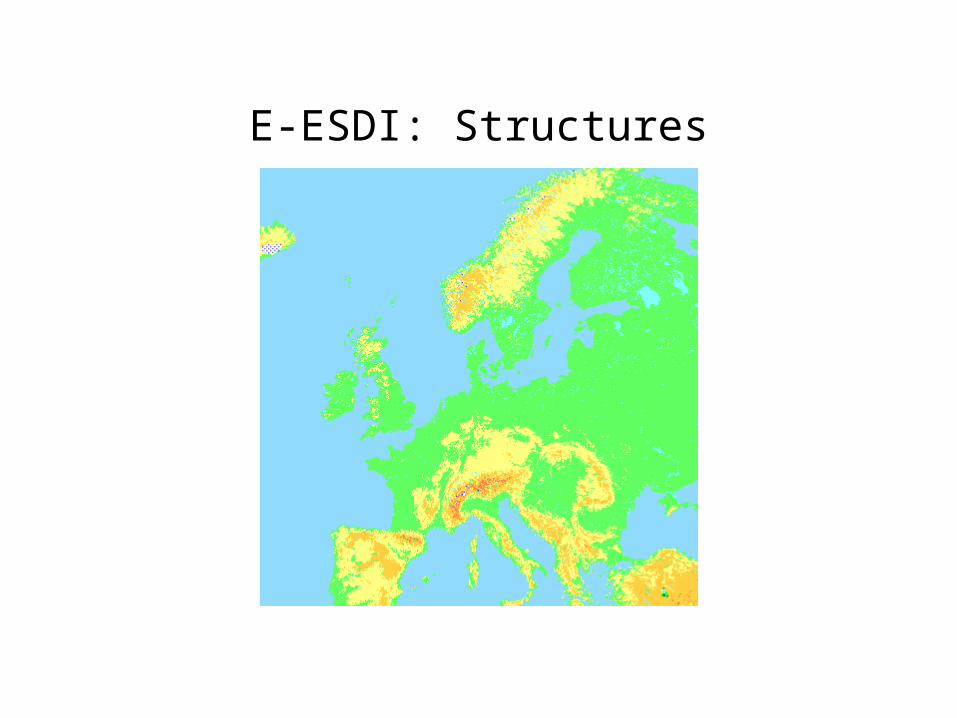
E-ESDI: Structures
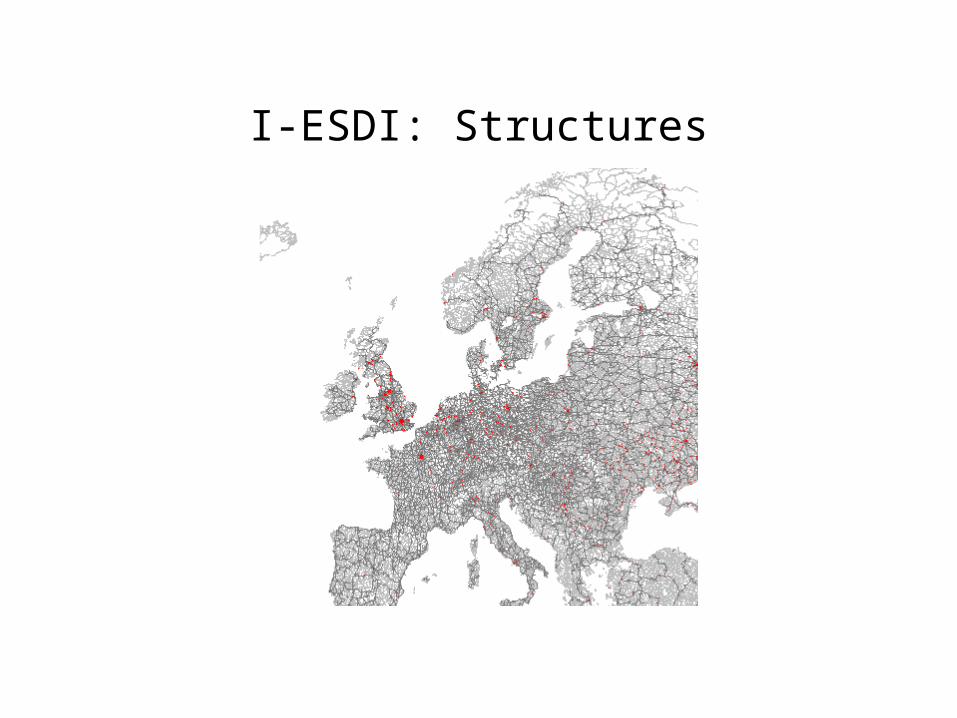
I-ESDI: Structures
H-ESDI Processes
• Human processes– Night-time population:
• Population in the role of Residents
– Day-time population:• Population on the role of Civic Citizens• Population in the role of Employees and Entrepereneurs
– Day-time + Night-time populations• The grater part of the total building mass (stuctures described by
descriptive geographies)
Summary
Recapitulation
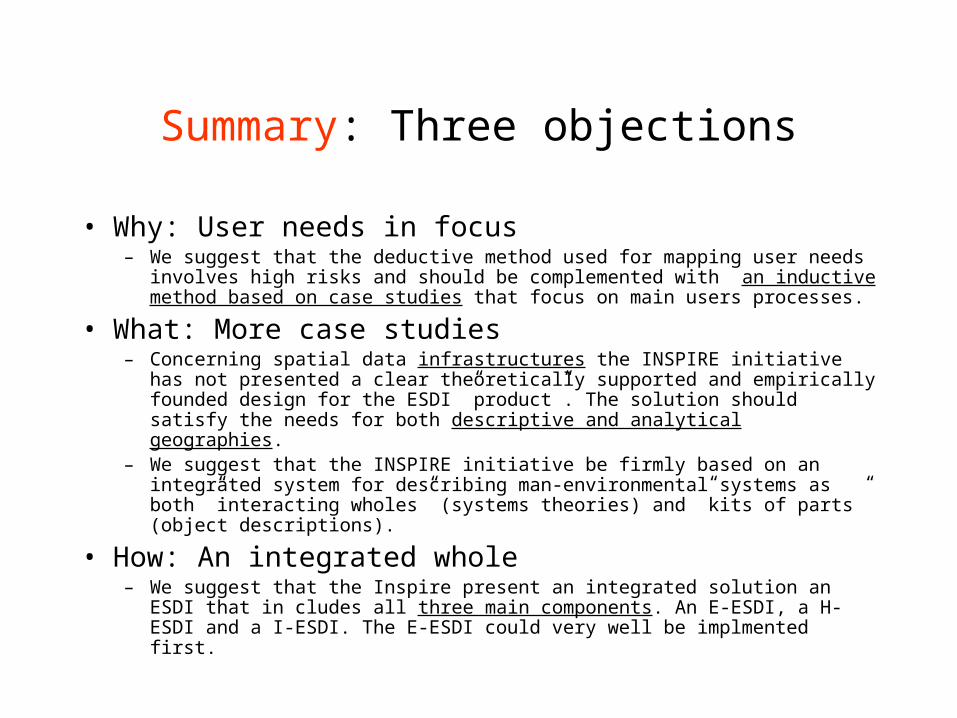
Summary: Three objections
• Why: User needs in focus– We suggest that the deductive method used for mapping user
needs involves high risks and should be complemented with an inductive method based on case studies that focus on main users processes.
• What: More case studies– Concerning spatial data infrastructures the INSPIRE initiative has
not presented a clear theoretically supported and empirically founded design for the ESDI ”product”. The solution should satisfy the needs for both descriptive and analytical geographies.
– We suggest that the INSPIRE initiative be firmly based on an integrated system for describing man-environmental systems as both ”interacting wholes” (systems theories) and ”kits of parts” (object descriptions).
• How: An integrated whole– We suggest that the Inspire present an integrated solution an ESDI
that in cludes all three main components. An E-ESDI, a H-ESDI and a I-ESDI. The E-ESDI could very well be implmented first.
The Tandem should be integrated with ESDI (Inspire+)
• The Inspire should have narrower but more comprehensive focus
• Tandem should be recognised as the voice of the statistical institutes.
• The Nordic grids could, as the first comprehensive System of small area statistics, function as a prototype for a European system.
Summary
• Better, clearer, shorter descriptions of the Why– Deductive method– Inductive method
• Better, clearer, shorter descriptions of What– A system of small Statistical areas (Irregular)
• Perifery• Centre point
– A system of small statistyical areas (Regular)• Perifery• Centre Point
• Better, clearer, shorter descriptions of How– A Design Phase– A Prototype phase– An Implementation Phase