On the quality evaluation of scientific entities in Poland ... · On the quality evaluation of...
16
On the quality evaluation of scientific entities in Poland supported by consistency-driven pairwise comparisons method Waldemar W. Koczkodaj • Konrad Kulakowski • Antoni Lige ˛za Received: 15 August 2013 / Published online: 19 March 2014 Ó The Author(s) 2014. This article is published with open access at Springerlink.com Abstract Comparison, rating, and ranking of alternative solutions, in case of multicri- teria evaluations, have been an eternal focus of operations research and optimization theory. There exist numerous approaches at practical solving the multicriteria ranking problem. The recent focus of interest in this domain was the event of parametric evaluation of research entities in Poland. The principal methodology was based on pairwise com- parisons. For each single comparison, four criteria have been used. One of the controversial points of the assumed approach was that the weights of these criteria were arbitrary. The main focus of this study is to put forward a theoretically justified way of extracting weights from the opinions of domain experts. Theoretical bases for the whole procedure are based on a survey and its experimental results. Discussion and comparison of the two resulting sets of weights and the computed inconsistency indicator are discussed. Keywords Pairwise comparisons Inconsistency analysis Expert opinion Academic entity quality Performance evaluation Introduction and problem statement The question of how to measure the performance of scientific entities is one of the most basic in the scientific community. The answer to this question is primarily related to: ’how The research is supported by Euro Grant ‘‘Human Capital’’ and AGH University of Science and Technology, contract no.: 11.11.120.859 W. W. Koczkodaj (&) Laurentian University, Sudbury, ON, Canada e-mail: [email protected] K. Kulakowski A. Lige ˛za AGH University of Science and Technology, Krako ´w, Poland e-mail: [email protected] A. Lige ˛za e-mail: [email protected] 123 Scientometrics (2014) 99:911–926 DOI 10.1007/s11192-014-1258-y
Transcript of On the quality evaluation of scientific entities in Poland ... · On the quality evaluation of...
On the quality evaluation of scientific entities inPoland supported by consistency-drivenpairwise comparisons method
Waldemar W. Koczkodaj • Konrad Kułakowski • Antoni Ligeza
Received: 15 August 2013 / Published online: 19 March 2014� The Author(s) 2014. This article is published with open access at Springerlink.com
Abstract Comparison, rating, and ranking of alternative solutions, in case of multicri-
teria evaluations, have been an eternal focus of operations research and optimization
theory. There exist numerous approaches at practical solving the multicriteria ranking
problem. The recent focus of interest in this domain was the event of parametric evaluation
of research entities in Poland. The principal methodology was based on pairwise com-
parisons. For each single comparison, four criteria have been used. One of the controversial
points of the assumed approach was that the weights of these criteria were arbitrary. The
main focus of this study is to put forward a theoretically justified way of extracting weights
from the opinions of domain experts. Theoretical bases for the whole procedure are based
on a survey and its experimental results. Discussion and comparison of the two resulting
sets of weights and the computed inconsistency indicator are discussed.
Keywords Pairwise comparisons � Inconsistency analysis � Expert opinion �Academic entity quality � Performance evaluation
Introduction and problem statement
The question of how to measure the performance of scientific entities is one of the most
basic in the scientific community. The answer to this question is primarily related to: ’how
The research is supported by Euro Grant ‘‘Human Capital’’ and AGH University of Science and Technology,contract no.: 11.11.120.859
W. W. Koczkodaj (&)Laurentian University, Sudbury, ON, Canadae-mail: [email protected]
K. Kułakowski � A. LigezaAGH University of Science and Technology, Krakow, Polande-mail: [email protected]
A. Ligezae-mail: [email protected]
123
Scientometrics (2014) 99:911–926DOI 10.1007/s11192-014-1258-y

should research funds be distributed among different research units?’ (addressed in Wang
et al. 2011; Geuna and Martin 2003), or ’what should be the policy of the state in the
promotion of science?’ (see Geuna et al. 1999) to name a few. Due to the many factors that
can affect the final assessment, the problem of finding clear and widely acceptable per-
formance indicators is not easy. Numerous legal environments and various scientific
practices in different countries add to the problem complexity.
In academia, we are better in evaluating our students than ourselves. However, the
Ministry of Science and Higher Education stipulates that evaluation of the academic
performance of a scientific unit1 is conducted in Poland on the basis of the algorithm
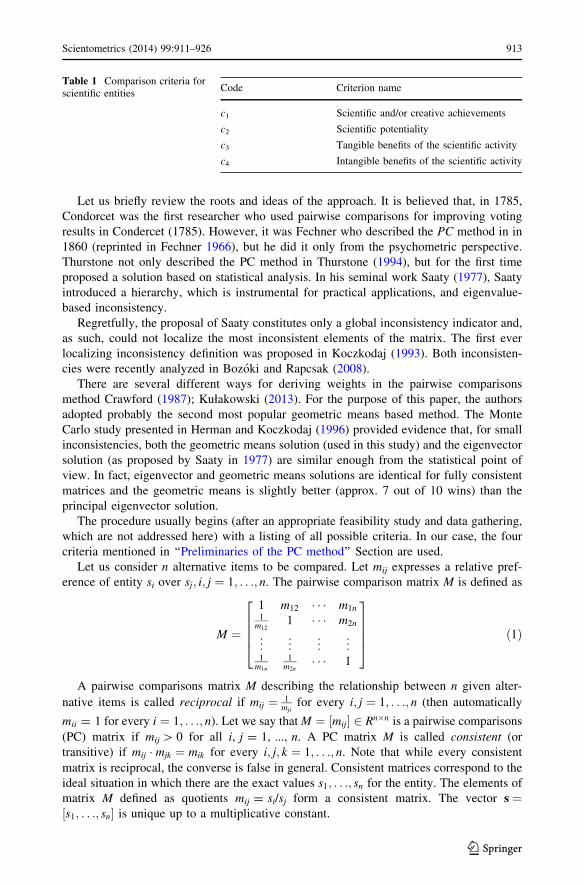
presented in the government regulation2 with four major criteria for all scientific entities
(Table 1).
Each criterion is subdivided into many sub-criteria that depend on the type of scientific
entity. The ranking process seems to be easy, yet it is not. One of the important problems is
to determine the significance of criteria c1; . . .; c4. Relating ci to cj is both subjective and
difficult due to the intangible and abstract nature of the criterion itself. In the adopted
algorithm (‘‘Research entities evaluation: The official procedure’’ Section), the criteria
importance must be expressed as the real numbers. One of the ways allowing the subjective
judgments to be transformed into the numerical values is the pairwise comparisons (PC)
method. Therefore, to improve the algorithm proposed by the Ministry of Science and
Higher Education (‘‘Research entities evaluation: The official procedure’’ Section), the
authors propose to add one additional step. The step in which the weights for criteria
c1; . . .; c4 are explicitly estimated by experts. The experiment conducted by the authors
(‘‘An experimental survey procedure’’ Section), the survey among the scientists, provides a
sample of how the weights of the criteria c1; . . .; c4 might look like, when they were
determined by the PC method.
Preliminaries of the PC method
As indicated in ‘‘Introduction and problem statement’’ Section, the evaluation of research
units and induction of the final linear ordering is based on four different criteria. These
predefined criteria are shown in Table 1. Precise interpretation of these criteria is provided
by the Ministry of Science and Higher Education (2012); here the intuitive understanding
of them is sufficient.
Note that in view of Table 1 quality evaluation of research units is not only a Multi-
criteria Decision Problem (or, more precisely, Multicriteria Ranking Problem), but all the
criteria are in fact of qualitative nature. Hence, the first step in the procedure consists of
defining the transformation of non-measurable characteristics into a single numbers. This is
done for each criterion of each research unit. For example, calculation of the value of
criterion c1 consists in summing up points assigned to a list of publications of the last four
years published by the research workers of the unit. The procedure is presented in detail in
Ministry of Science and Higher Education (2012). Now, the problem can be approached by
pairwise comparisons.
1 Following the official regulation, the authors understand that the scientific entity (sometimes also referredto as the scientific unit) means: a research unit within the university such as faculty or department, anindependent research institute (national and international), and research units within The Polish Academy ofScience.2 http://www.bip.nauka.gov.pl/_gAllery/19/31/19319/poz._877
912 Scientometrics (2014) 99:911–926
123
Let us briefly review the roots and ideas of the approach. It is believed that, in 1785,
Condorcet was the first researcher who used pairwise comparisons for improving voting
results in Condercet (1785). However, it was Fechner who described the PC method in in
1860 (reprinted in Fechner 1966), but he did it only from the psychometric perspective.
Thurstone not only described the PC method in Thurstone (1994), but for the first time
proposed a solution based on statistical analysis. In his seminal work Saaty (1977), Saaty
introduced a hierarchy, which is instrumental for practical applications, and eigenvalue-
based inconsistency.
Regretfully, the proposal of Saaty constitutes only a global inconsistency indicator and,
as such, could not localize the most inconsistent elements of the matrix. The first ever
localizing inconsistency definition was proposed in Koczkodaj (1993). Both inconsisten-
cies were recently analyzed in Bozoki and Rapcsak (2008).
There are several different ways for deriving weights in the pairwise comparisons
method Crawford (1987); Kułakowski (2013). For the purpose of this paper, the authors
adopted probably the second most popular geometric means based method. The Monte
Carlo study presented in Herman and Koczkodaj (1996) provided evidence that, for small
inconsistencies, both the geometric means solution (used in this study) and the eigenvector
solution (as proposed by Saaty in 1977) are similar enough from the statistical point of
view. In fact, eigenvector and geometric means solutions are identical for fully consistent
matrices and the geometric means is slightly better (approx. 7 out of 10 wins) than the
principal eigenvector solution.
The procedure usually begins (after an appropriate feasibility study and data gathering,
which are not addressed here) with a listing of all possible criteria. In our case, the four
criteria mentioned in ‘‘Preliminaries of the PC method’’ Section are used.
Let us consider n alternative items to be compared. Let mij expresses a relative pref-
erence of entity si over sj; i; j ¼ 1; . . .; n. The pairwise comparison matrix M is defined as
M ¼
1 m12 � � � m1n1
m121 � � � m2n
..
. ... ..
. ...
1m1n
1m2n
� � � 1
26664
37775 ð1Þ
A pairwise comparisons matrix M describing the relationship between n given alter-
native items is called reciprocal if mij ¼ 1mji
for every i; j ¼ 1; . . .; n (then automatically
mii = 1 for every i ¼ 1; . . .; n). Let we say that M ¼ ½mij� 2 Rn�n is a pairwise comparisons
(PC) matrix if mij [ 0 for all i, j = 1, ..., n. A PC matrix M is called consistent (or
transitive) if mij � mjk ¼ mik for every i; j; k ¼ 1; . . .; n. Note that while every consistent
matrix is reciprocal, the converse is false in general. Consistent matrices correspond to the
ideal situation in which there are the exact values s1; . . .; sn for the entity. The elements of
matrix M defined as quotients mij = si/sj form a consistent matrix. The vector s ¼½s1; . . .; sn� is unique up to a multiplicative constant.
Table 1 Comparison criteria forscientific entities
Code Criterion name
c1 Scientific and/or creative achievements
c2 Scientific potentiality
c3 Tangible benefits of the scientific activity
c4 Intangible benefits of the scientific activity
Scientometrics (2014) 99:911–926 913
123
Every pairwise comparisons question has been answered by all respondents and many
different pairwise comparisons matrices could be produced (one matrix for each expert
involved in the survey). In our study, we produced the survey summary for all the partial
results M1; . . .;Mq (every Mr = [mij(r)] corresponding to responses given by the i’th expert)
by synthesizing them into one summary PC matrix bM ¼ ½bmij� following the geometric
mean synthesizing function proposed in Aczel and Saaty (1983); Saaty (2008) where all
the experts are equally important.3 Hence, the resulting ratios have the following form:
bmij ¼Yq
r¼1
mðrÞij
!1=q
ð2Þ
According to the geometric mean method used in this study the final ranking vector s is
calculated as:
s ¼ ½r�1S1; . . .; r�1Sn� ð3Þwhere
Si ¼Yn
j¼1
bmij
!1=n
and r ¼Xr¼1
n
Sr ð4Þ
In the formulas above Si represents the rank of the i-th alternative before normalization,
and r-1 is the normalization coefficient so that all si = r-1Si for i ¼ 1; . . .; n, sum up to one.
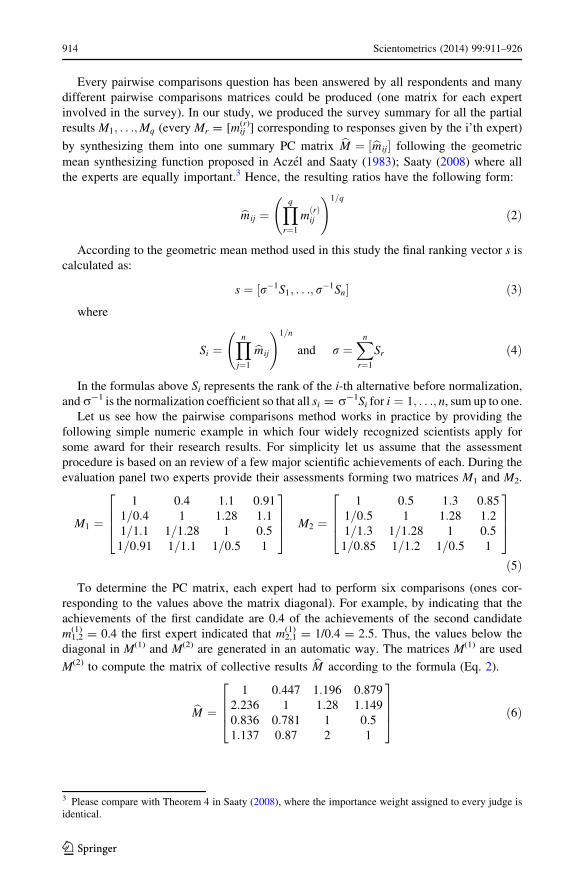
Let us see how the pairwise comparisons method works in practice by providing the
following simple numeric example in which four widely recognized scientists apply for
some award for their research results. For simplicity let us assume that the assessment
procedure is based on an review of a few major scientific achievements of each. During the
evaluation panel two experts provide their assessments forming two matrices M1 and M2.
M1 ¼
1 0:4 1:1 0:91
1=0:4 1 1:28 1:11=1:1 1=1:28 1 0:5
1=0:91 1=1:1 1=0:5 1
2664
3775 M2 ¼
1 0:5 1:3 0:85
1=0:5 1 1:28 1:21=1:3 1=1:28 1 0:5
1=0:85 1=1:2 1=0:5 1
2664
3775
ð5ÞTo determine the PC matrix, each expert had to perform six comparisons (ones cor-
responding to the values above the matrix diagonal). For example, by indicating that the
achievements of the first candidate are 0.4 of the achievements of the second candidate
m1,2(1) = 0.4 the first expert indicated that m2,1
(1) = 1/0.4 = 2.5. Thus, the values below the
diagonal in M(1) and M(2) are generated in an automatic way. The matrices M(1) are used
M(2) to compute the matrix of collective results bM according to the formula (Eq. 2).
bM ¼1 0:447 1:196 0:879
2:236 1 1:28 1:149
0:836 0:781 1 0:51:137 0:87 2 1
2664
3775 ð6Þ
3 Please compare with Theorem 4 in Saaty (2008), where the importance weight assigned to every judge isidentical.
914 Scientometrics (2014) 99:911–926
123
The final assessment s is formed as the normalized geometric means of rows of bM and is
s = [0.201, 0.327, 0.184, 0.288]T. Hence, the winner is the second scientist with the rank
0.327, then respectively the scientist number four, one and three.
Data inconsistency and how to deal with it
Observe that matrix MH given by (5) is not consistent. For example mH
1;2 � mH
2;3 6¼ mH
1;3 as
0:4 � 1:1 6¼ 0:5. The question arises what can one do about that?
When an n 9 n matrix M is not consistent the consistency index needs to be computed
to determine the degree of inconsistency. One of the popular inconsistency index Saaty
(1977) is defined as follows:
IcðMÞ ¼ kmax � n
n� 1ð7Þ
where kmax is the principal eigenvalue of M. It is commonly assumed that the matrix
M is sufficiently consistent if Ic(M) B 0.1 Saaty (1977). In such a case the results calcu-
lated using e.g. the geometric means method are considered to be reliable.
Another approach, perceived as more restrictive inconsistency index comes from Ko-
czkodaj (1993). It is defined as:
KðMÞ ¼ maxi;j;k2f1;...;ng
min 1� mij
mikmkj
��������; 1� mikmkj
mij
��������
� �� �ð8Þ
where i; j; k ¼ 1; . . .; n and i = j^ j = k^ i = k. For sufficiently consistent matrices, it
should not be too high.
When a matrix M is inconsistent (especially when the inconsistency is high), we must
compute a consistent n 9 n PC matrix C which differs from the matrix M ’as little as
possible’. This is a relatively simple and natural way of dealing with the problem. Note that
the approximation is really reduced to a problem of norm selection and the distance
minimization. For the Euclidean norm, the vector of geometric means (equal to the
principal eigenvector for the transitive matrix) is the one which generates it.
Many approximation solutions have been proposed in the past starting with Jensen
(1984). More recently, Bozoki et al. (2010), and others Anholcer et al. (2010); Grzy-
bowski (2012) proposed a practical optimization. No study has ever provided an analytic
proof of the substantial superiority of any method for approximation over another. Strong
statistical evidence (based on 1,000,000 randomly generated matrices) suggests that both
solutions (geometric means and the principal eigenvector) are reasonable and do not
differ much for ’not-so-inconsistent’ (NSI) matrices, as demonstrated in Herman and
Koczkodaj (1996).
A further investigation of the selection of the norm (or distance) is beyond the scope of
this study. In fact, it may require many years of research before any conclusions could be
made and probably the pairwise comparisons may be helpful in it. Unfortunately, not much
can be analytically proven for non-transitive matrices. In data processing, it is well
expressed by the popular computer concept GIGO (Garbage In—Garbage Out). GIGO
summarizes what is known for a long time: getting good results from ’dirty data’ is
unrealistic and certainly cannot be guaranteed.
Scientometrics (2014) 99:911–926 915
123

Research entities evaluation: the official procedure
The evaluation procedure officially adopted in Poland for assessment of research units
consists of six steps. Some of them are more or less informal and based largely on the work
of experts, whilst the other ones are precisely defined with extensive use of mathematical
formulas. In particular the final results of the algorithm highly depends on subjectively
defined weights W1; . . .;W4 describing importance of each of the criteria c1; . . .; c4, as
presented in ‘‘Preliminaries of the PC method’’ Section.
Note that due to diversification of the research activities in different areas of science, all
the units are divided into relatively small groups of similar entities (e.g. Faculties of
Electrical Engineering). Hence, all the 963 units were divided into similarity groups
(GWO) of a limited number of units (for example, around 50 in a typical GWO). The
procedure was performed independently for each group.
Assessment procedure
1. At the beginning experts proposed weights W1; . . .;W4 for each group of mutually
comparable entities.
2. Then, each scientific entity X is assigned numerical values with respect of the four
criteria as defined in (Table 1). As a result, a vector of four values O1ðXÞ; . . .;O4ðXÞdefining how good is unit X with respect to c1; . . .; c4 is X is prepared.
3. The experts proposed two artificial entities A1 and A2 which will be used as reference
units in order to assign every real research unit an appropriate funding level. A1 and A2
become part of a ranked group.
4. All the entities are mutually compared within its GWO of comparable entities with
respect to all four criteria (Table 1). The result of a single comparison of X; Y 2 U,
where U is the GWO for X and Y, with respect to the i-th criterion is given as:
PiðX; YÞ ¼ sgnðOiðXÞ � OiðYÞÞ �0 if DO\DDO�DG�D
if D�DO\G
1 if G�DO
8<: ð9Þ
where
DO ¼ OiðXÞ � OiðYÞj j ð10Þ
D ¼ maxmin OiðXÞ;OiðYÞf g
10;
PZ2U OiðZÞ
10 � cardðUÞ
� �ð11Þ
G ¼ max3 �min OiðXÞ;OiðYÞf g
10; 3 � D
� �ð12Þ
5. During the currently adopted ranking procedure by the Ministry of Science and Higher
Education (2012), the value V(X, Y) is computed according to the formula:
VðX; YÞ ¼X
i¼1;...;4
WiPiðX; YÞ ð13Þ
where V(X, Y) is the total comparison score of the scientific unit X versus Y, Wi is the rank
(importance) of the i-th criterion, and Pi(X, Y) is the result of the pairwise comparisons
between X and Y with respect to the i-th criterion.
6. The final rank of the scientific entity X 2 U is computed as:
916 Scientometrics (2014) 99:911–926
123
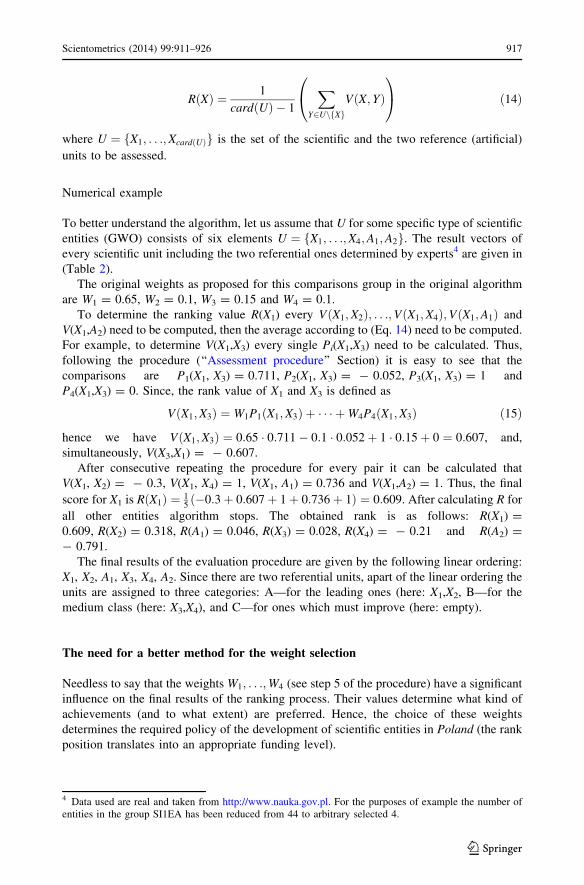
RðXÞ ¼ 1
cardðUÞ � 1
XY2UnfXg
VðX; YÞ
0@
1A ð14Þ
where U ¼ fX1; . . .;XcardðUÞg is the set of the scientific and the two reference (artificial)
units to be assessed.
Numerical example
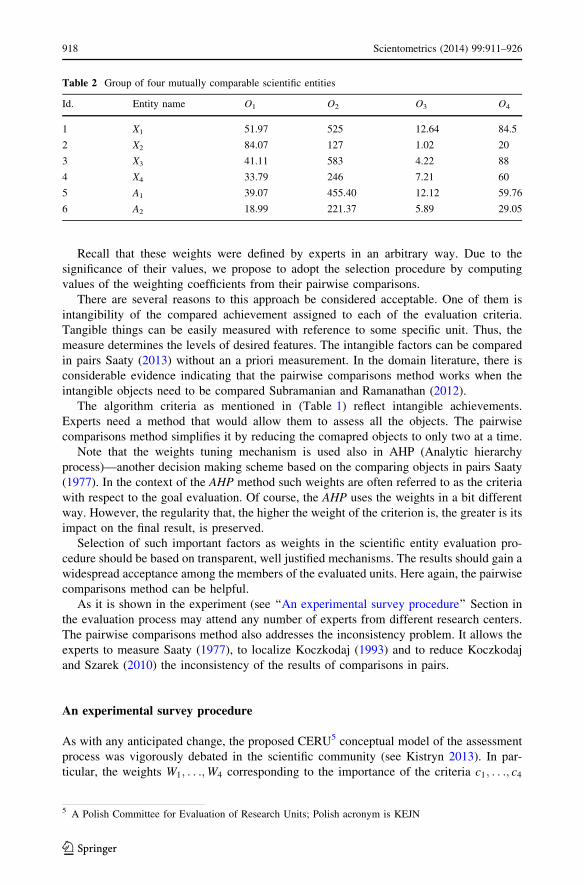
To better understand the algorithm, let us assume that U for some specific type of scientific
entities (GWO) consists of six elements U ¼ fX1; . . .;X4;A1;A2g. The result vectors of
every scientific unit including the two referential ones determined by experts4 are given in
(Table 2).
The original weights as proposed for this comparisons group in the original algorithm
are W1 = 0.65, W2 = 0.1, W3 = 0.15 and W4 = 0.1.
To determine the ranking value R(X1) every VðX1;X2Þ; . . .;VðX1;X4Þ;VðX1;A1Þ and
V(X1,A2) need to be computed, then the average according to (Eq. 14) need to be computed.
For example, to determine V(X1,X3) every single Pi(X1,X3) need to be calculated. Thus,
following the procedure (‘‘Assessment procedure’’ Section) it is easy to see that the
comparisons are P1(X1, X3) = 0.711, P2(X1, X3) = - 0.052, P3(X1, X3) = 1 and
P4(X1,X3) = 0. Since, the rank value of X1 and X3 is defined as
VðX1;X3Þ ¼ W1P1ðX1;X3Þ þ � � � þW4P4ðX1;X3Þ ð15Þ
hence we have VðX1;X3Þ ¼ 0:65 � 0:711� 0:1 � 0:052þ 1 � 0:15þ 0 ¼ 0:607, and,
simultaneously, V(X3,X1) = - 0.607.
After consecutive repeating the procedure for every pair it can be calculated that
V(X1, X2) = - 0.3, V(X1, X4) = 1, V(X1, A1) = 0.736 and V(X1,A2) = 1. Thus, the final
score for X1 is RðX1Þ ¼ 15ð�0:3þ 0:607þ 1þ 0:736þ 1Þ ¼ 0:609. After calculating R for
all other entities algorithm stops. The obtained rank is as follows: R(X1) =
0.609, R(X2) = 0.318, R(A1) = 0.046, R(X3) = 0.028, R(X4) = - 0.21 and R(A2) =
- 0.791.
The final results of the evaluation procedure are given by the following linear ordering:
X1, X2, A1, X3, X4, A2. Since there are two referential units, apart of the linear ordering the
units are assigned to three categories: A—for the leading ones (here: X1,X2, B—for the
medium class (here: X3,X4), and C—for ones which must improve (here: empty).
The need for a better method for the weight selection
Needless to say that the weights W1; . . .;W4 (see step 5 of the procedure) have a significant
influence on the final results of the ranking process. Their values determine what kind of
achievements (and to what extent) are preferred. Hence, the choice of these weights
determines the required policy of the development of scientific entities in Poland (the rank
position translates into an appropriate funding level).
4 Data used are real and taken from http://www.nauka.gov.pl. For the purposes of example the number ofentities in the group SI1EA has been reduced from 44 to arbitrary selected 4.
Scientometrics (2014) 99:911–926 917
123
Recall that these weights were defined by experts in an arbitrary way. Due to the
significance of their values, we propose to adopt the selection procedure by computing
values of the weighting coefficients from their pairwise comparisons.
There are several reasons to this approach be considered acceptable. One of them is
intangibility of the compared achievement assigned to each of the evaluation criteria.
Tangible things can be easily measured with reference to some specific unit. Thus, the
measure determines the levels of desired features. The intangible factors can be compared
in pairs Saaty (2013) without an a priori measurement. In the domain literature, there is
considerable evidence indicating that the pairwise comparisons method works when the
intangible objects need to be compared Subramanian and Ramanathan (2012).
The algorithm criteria as mentioned in (Table 1) reflect intangible achievements.
Experts need a method that would allow them to assess all the objects. The pairwise
comparisons method simplifies it by reducing the comapred objects to only two at a time.
Note that the weights tuning mechanism is used also in AHP (Analytic hierarchy
process)—another decision making scheme based on the comparing objects in pairs Saaty
(1977). In the context of the AHP method such weights are often referred to as the criteria
with respect to the goal evaluation. Of course, the AHP uses the weights in a bit different
way. However, the regularity that, the higher the weight of the criterion is, the greater is its
impact on the final result, is preserved.
Selection of such important factors as weights in the scientific entity evaluation pro-
cedure should be based on transparent, well justified mechanisms. The results should gain a
widespread acceptance among the members of the evaluated units. Here again, the pairwise
comparisons method can be helpful.
As it is shown in the experiment (see ‘‘An experimental survey procedure’’ Section in
the evaluation process may attend any number of experts from different research centers.
The pairwise comparisons method also addresses the inconsistency problem. It allows the
experts to measure Saaty (1977), to localize Koczkodaj (1993) and to reduce Koczkodaj
and Szarek (2010) the inconsistency of the results of comparisons in pairs.
An experimental survey procedure
As with any anticipated change, the proposed CERU5 conceptual model of the assessment
process was vigorously debated in the scientific community (see Kistryn 2013). In par-
ticular, the weights W1; . . .;W4 corresponding to the importance of the criteria c1; . . .; c4
Table 2 Group of four mutually comparable scientific entities
Id. Entity name O1 O2 O3 O4
1 X1 51.97 525 12.64 84.5
2 X2 84.07 127 1.02 20
3 X3 41.11 583 4.22 88
4 X4 33.79 246 7.21 60
5 A1 39.07 455.40 12.12 59.76
6 A2 18.99 221.37 5.89 29.05
5 A Polish Committee for Evaluation of Research Units; Polish acronym is KEJN
918 Scientometrics (2014) 99:911–926
123
(Table 1) were the subject of debate and criticism since they were established in an
arbitrary way.
The goal of the experimental survey was to provide the weighting coefficients assuming
that:
– the PC method is the core of the experiment; so the values are better justified,
– any arbitrarily large number of experts can express their preferences,
– the expert judgment consistency should be evaluated and kept at a possible low level.
The relative preference criteria are established on the basis of partial values (pairwise
comparisons) provided by experts in form of the matrix M (see Eq. 1). All the matrices for
which inconsistency index (Eq. 7) is higher than 0.1 are excluded from the ranking as not
reliable enough.
The final weights are computed according to the PC methodology given as (Eq. 3). The
authors invited members of the academic community who know the specificities of Polish
research units to provide expert assessments by an Internet survey. The surveyed scientists
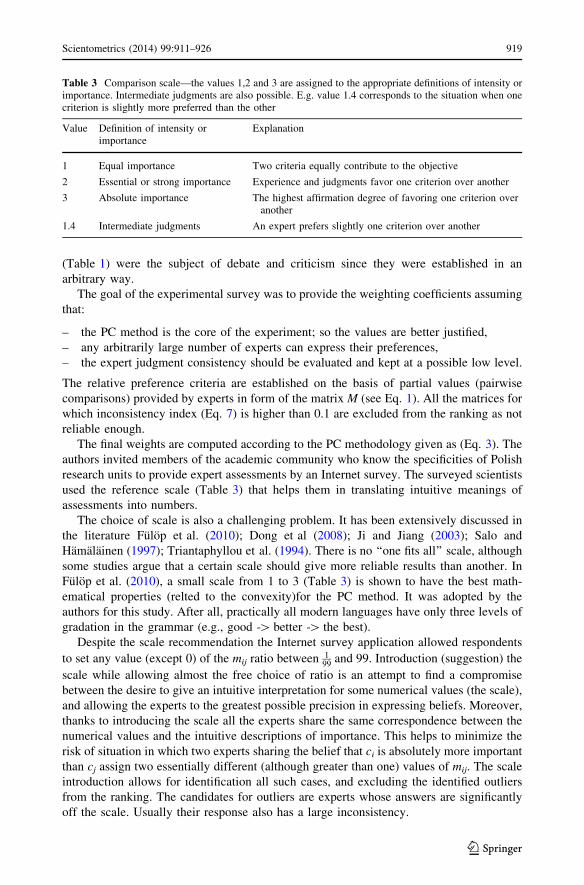
used the reference scale (Table 3) that helps them in translating intuitive meanings of
assessments into numbers.
The choice of scale is also a challenging problem. It has been extensively discussed in
the literature Fulop et al. (2010); Dong et al (2008); Ji and Jiang (2003); Salo and
Hamalainen (1997); Triantaphyllou et al. (1994). There is no ‘‘one fits all’’ scale, although
some studies argue that a certain scale should give more reliable results than another. In
Fulop et al. (2010), a small scale from 1 to 3 (Table 3) is shown to have the best math-
ematical properties (relted to the convexity)for the PC method. It was adopted by the
authors for this study. After all, practically all modern languages have only three levels of
gradation in the grammar (e.g., good -[ better -[ the best).
Despite the scale recommendation the Internet survey application allowed respondents
to set any value (except 0) of the mij ratio between 199
and 99. Introduction (suggestion) the
scale while allowing almost the free choice of ratio is an attempt to find a compromise
between the desire to give an intuitive interpretation for some numerical values (the scale),
and allowing the experts to the greatest possible precision in expressing beliefs. Moreover,
thanks to introducing the scale all the experts share the same correspondence between the
numerical values and the intuitive descriptions of importance. This helps to minimize the
risk of situation in which two experts sharing the belief that ci is absolutely more important
than cj assign two essentially different (although greater than one) values of mij. The scale
introduction allows for identification all such cases, and excluding the identified outliers
from the ranking. The candidates for outliers are experts whose answers are significantly
off the scale. Usually their response also has a large inconsistency.
Table 3 Comparison scale—the values 1,2 and 3 are assigned to the appropriate definitions of intensity orimportance. Intermediate judgments are also possible. E.g. value 1.4 corresponds to the situation when onecriterion is slightly more preferred than the other
Value Definition of intensity orimportance
Explanation
1 Equal importance Two criteria equally contribute to the objective
2 Essential or strong importance Experience and judgments favor one criterion over another
3 Absolute importance The highest affirmation degree of favoring one criterion overanother
1.4 Intermediate judgments An expert prefers slightly one criterion over another
Scientometrics (2014) 99:911–926 919
123
The meaning of the adopted scale is quite intuitive. For example, if an expert assigns
Wi/Wj to 1, this means that the criteria i and j are of equal importance. On the other hand if,
for instance, 2 \ Wi/Wj \ 3 then, according to the adopted textual interpretation (Table 3),
the i-th criterion was recognized as essentially more important than the j-th one.
In the ideal case, there should be always Wi=Wj �Wj=Wk ¼ Wi=Wk. However, because
each of the three ratios are determined independently, in practice this is often not the case.
Hence, very often there are some triads of ratios which do not meet this equality. This
situation is related to the problem of data inconsistency in the PC matrix, which is dis-
cussed more thoroughly in ‘‘Data inconsistency and how to deal with it’’ Section.
Survey results
Survey data
The survey involved 37 researchers from 17 Polish and foreign scientific institutions
engaged in research in the field of technical and engineering sciences. Most of them are
tenured faculty members at Universities in Poland, USA, Canada, and Australia although
some of them declared employment in research institutes. The vast majority of respondents
declared the position of a full professor or equivalent.6 A few persons held the prestigious
title of distinguished professor.
Every participant of the survey had to answer six questions and, thus, determine six
ratios: w1
w2; w1
w3; w1
w4; w2
w3; w2
w4; w3
w4. The answers allowed for formation of the partial PC matrix Mr
in the form:
Mr ¼
1 w1
w2
w1
w3
w1
w4w2
w11 w2
w3
w2
w4w3
w1
w3
w21 w3
w4w4
w1
w4
w2
w4
w31
2664
3775 ð16Þ
To synthesize the final results the authors used almost all the gathered matrices Mr. The
only exceptions were five result sets with the very high inconsistency index KðMrÞ (over
0.836), and the inconsistency index Ic(Mr) higher than 0.1. Although all the rejected cases
differ in detail, most of the rejected authors indicated very significant importance of the
first criterion (scientific and/or creative achievements) over other arbitrarily chosen criteria.
Unfortunately, due to the large inconsistency (in the literature Ic(Mr) higher than 0.1 is
considered as unacceptable Saaty 2005) their opinions have not been taken into account7 in
the synthesized matrix bM .
All the 32 admissible partial results M form the following final output matrix bM , which
looks as follows:
bM ¼1 1:813 1:503 1:784
0:552 1 0:952 1:296
0:666 1:05 1 1:302
0:561 0:772 0:768 1
2664
3775 ð17Þ
6 In Poland there are professor extraordinarius and professor ordinarius.7 On the other hand, even if two rejected cases were taken into account their impact on the final result wouldbe negligible.
920 Scientometrics (2014) 99:911–926
123
The normalized weight vector x derived from bM using the geometric mean method is as
follows:
x ¼ 0:36 0:22 0:236 0:184½ �T ð18Þ
which means that the invited experts found that rank(c1)—the relative importance of
scientific and/or creative achievements criterion is 0.36, rank(c2)—scientific potentiality
criterion is 0.22, rank(c3)—tangible benefits of the scientific activity criterion is 0.236, and
finally rank(c4)—intangible benefits of the scientific activity criterion is 0.184.
The inconsistency indices for bM are low. The more sensitive for local perturbations
Koczkodaj’s index Kð bMÞ ¼ 0:241 whilst Icð bMÞ ¼ 0:002. The standard geometric devi-
ation for the appropriate bmij defined as:
rgðbmijÞ ¼ exp
ffiffiffiffiffiffiffiffiffiffiffiffiffiffiffiffiffiffiffiffiffiffiffiffiffiffiffiffiffiffiffiffiffiffiffiffiffiffiffiffiffiffiffiffiffiffiffiffiP32k¼1 ln m
ðkÞij � ln bmij
� �2
32
vuut0BB@
1CCA ð19Þ
forms the matrix bMr ¼ ½rgðbmijÞ� as follows:
bMr ¼
1 2:093 2:03 1:787
2:093 1 1:913 1:831
2:03 1:913 1 1:61
1:787 1:831 1:61 1
2664
3775 ð20Þ
It is easy to see (Eq. 20) that the most controversial (with the highest standard geometric
deviation) comparison is between the scientific and/or creative achievements c1, and the
scientific potentiality c2. On the other hand experts were most unanimous comparing c3 and
c4 (the standard geometric deviation of rgðbm34Þ ¼ rgðbm43Þ ¼ 1:61 is the closest to 1).
Results: different perspectives
Experts were chosen at random among those who know the specificity of Polish technical scientific
units. Most of the experts are affiliated at the Polish universities or research institutes. Three experts
are affiliated at foreign universities, although they worked at Polish universities in the past. Since
the aim of the survey was to propose the weights w1; . . .;w4 for technical scientific units
(including such units as the departments of mathematics, physics or computer science), hence
most experts is working or has worked in such institutions. On the other hand, it was important
for the authors of the survey that the experts came from different research centers. The best
represented university is AGH UST—the place of work of the second and the third author. The
representations of other 16 scientific units count from one to three experts. Out of the all
respondents the authors chose the VIP group of six the most influential people consisting of
distinguished professors and former or current members of official governmental and sci-
entific bodies, including CERU. The overall results taking into account two special groups:
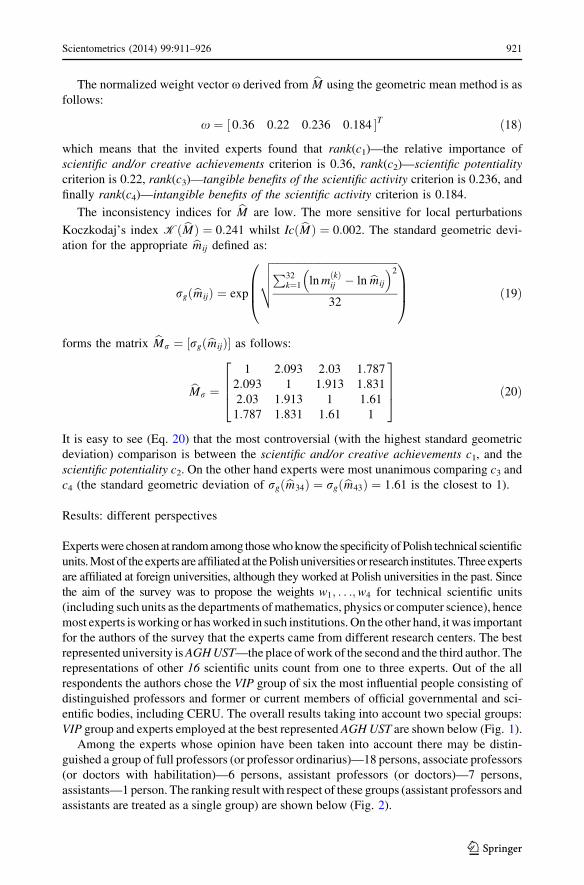
VIP group and experts employed at the best represented AGH UST are shown below (Fig. 1).
Among the experts whose opinion have been taken into account there may be distin-
guished a group of full professors (or professor ordinarius)—18 persons, associate professors
(or doctors with habilitation)—6 persons, assistant professors (or doctors)—7 persons,
assistants—1 person. The ranking result with respect of these groups (assistant professors and
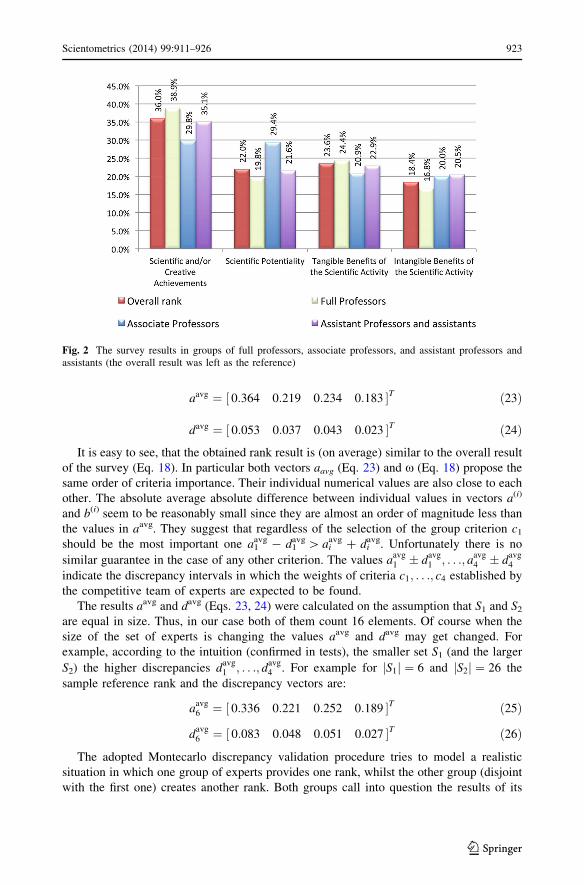
assistants are treated as a single group) are shown below (Fig. 2).
Scientometrics (2014) 99:911–926 921
123
Montecarlo discrepancy validation
As a validation method for the survey data the authors adopt ten times repeated twofold
cross-validation procedure Kohavi (1995). In every repetition the survey sample is ran-
domly split into two disjoint sets S1 ¼ fM1; . . .;M16g and S2 ¼ fM17; . . .;M32g: Both
groups are used to synthesize matrices bM1 and bM2, next two ranking vectors a ¼a1; . . .; a4½ �T and b ¼ b1; . . .; b4½ �T are computed. The vector a is called the reference rank
vector, whilst b is called the validation rank vector. For each pair of vectors a and b the
discrepancy vector d ¼ a1 � b1j j; . . .; a4 � b4j j½ �T is computed.
The values d1; . . .; d4 are adopted as a measures of fit. They provide information on how
much the synthesized ranking values for the criteria c1; . . .; c4 provided by the first group of
experts differ from the ranking values provided by the second group. Intuitively speaking
the adopted procedure simulates the situation where two disjoint group of experts provide
two competitive rankings. Then the first ranking is validated by the second one. The
validation procedure has been repeated ten times, so there are ten vectors að1Þ; . . .; að10Þ and
ten vectors bð1Þ; . . .; bð10Þ. The final reference rank aavg and the discrepancy (fit indicator)
vector davg are computed as arithmetic means:
aavg ¼ 1
10
X10
i¼1
aðiÞ1 ; . . .;
1
10
X10
i¼1
aðiÞ4
" #ð21Þ
and
davg ¼ 1
10
X10
i¼1
dðiÞ1 ; . . .;
1
10
X10
i¼1
dðiÞ4
" #ð22Þ
As a result of the conducted experiment, the following numerical values are obtained:
Fig. 1 The overall survey results with the VIP and AGH UST employee groups
922 Scientometrics (2014) 99:911–926
123
aavg ¼ 0:364 0:219 0:234 0:183½ �T ð23Þ
davg ¼ 0:053 0:037 0:043 0:023½ �T ð24ÞIt is easy to see, that the obtained rank result is (on average) similar to the overall result
of the survey (Eq. 18). In particular both vectors aavg (Eq. 23) and x (Eq. 18) propose the
same order of criteria importance. Their individual numerical values are also close to each
other. The absolute average absolute difference between individual values in vectors a(i)
and b(i) seem to be reasonably small since they are almost an order of magnitude less than
the values in aavg. They suggest that regardless of the selection of the group criterion c1
should be the most important one a1avg - d1
avg [ aiavg ? di
avg. Unfortunately there is no
similar guarantee in the case of any other criterion. The values aavg1 � d
avg1 ; . . .; aavg
4 � davg4
indicate the discrepancy intervals in which the weights of criteria c1; . . .; c4 established by
the competitive team of experts are expected to be found.
The results aavg and davg (Eqs. 23, 24) were calculated on the assumption that S1 and S2
are equal in size. Thus, in our case both of them count 16 elements. Of course when the
size of the set of experts is changing the values aavg and davg may get changed. For
example, according to the intuition (confirmed in tests), the smaller set S1 (and the larger
S2) the higher discrepancies davg1 ; . . .; davg
4 . For example for S1j j ¼ 6 and S2j j ¼ 26 the
sample reference rank and the discrepancy vectors are:
aavg6 ¼ 0:336 0:221 0:252 0:189½ �T ð25Þ
davg6 ¼ 0:083 0:048 0:051 0:027½ �T ð26Þ
The adopted Montecarlo discrepancy validation procedure tries to model a realistic
situation in which one group of experts provides one rank, whilst the other group (disjoint
with the first one) creates another rank. Both groups call into question the results of its
Fig. 2 The survey results in groups of full professors, associate professors, and assistant professors andassistants (the overall result was left as the reference)
Scientometrics (2014) 99:911–926 923
123
opponent. As demonstrated by the tests carried out when both groups are composed of
experts with a similar scientific background the discrepancies might not be to high.
Also the further research on the inconsistency of synthesized PC matrix bM seem to be
interesting. In particular the relationship between the values of inconsistency indices Icð bMÞand Kð bMÞ and the deviations of the individual expert judgements in matrices M1; . . .;Mr
need better explanation.
Discussion
The survey concerned the basic scientific units at universities in the field of technical and
engineering sciences. Thus, the gathered results do not apply to social sciences or the arts.
The surveyed researchers have made six comparisons between the four criteria c1; . . .c4
(Table 1). They could almost freely choose between ratios from 199
to 99, thus indicating
which criterion is more (and how much) important. However, a small scale was recom-
mended following the theory proved in Fulop et al (2010).
Comparing the survey results (Fig. 1) with the weights adopted in the official gov-
ernment regulation Ministry of Science and Higher Education (2012) (they are: c1—
0.65, c2—0.1, c3—0.15, and c4—0.1) it should be noted that they differ in the intensity of
preferences, although they tend to be similar with regard to the order of preferences. In
both rankings, the criterion designated as most important is c1 and the second most
important criterion is c3. However, the weight of c1 resulting from the survey is almost two
times less than the one assumed in the regulation. On the other hand, c2 obtained from the
survey is a bit higher than the one adopted in the official document. According to the
survey, the criterion c2 is slightly less important than c3 but more important than c4, whilst
the regulation assumes that the weights of c2 and c4 are the same. In both these cases the
weights obtained from the survey are higher than the ones adopted in the regulation.
The regulation retains the dominant criterion c1, whilst the other criteria are less
important. In fact, it is enough for the scientific entity to be strong in c1 to avoid having
to worry about the other criteria. The survey participants were in favor of a more bal-
anced model in which c1 is still the most important criterion, but is not predominant.
They also appreciate the importance of other criteria with particular emphasis to c3
(tangible benefits of the scientific activity). Hence, in the model proposed by the surveyed
researchers the predominant position of only one criterion c1 has been replaced by the
predominant position of the pair (c1,ci), where ci is any other criterion out of c2, c3, c4
(please note that the rank of c1 and the rank of any other criterion is more than 0.5).
Therefore, based on the survey results, such a model would be recommended in which the
evaluated scientific entity is good in terms of c1 but is also good in terms of at least one
other criterion, c2, c3 or c4. Of course, the appropriate selection of weights will not solve
all the problems related to the scientific entity evaluation algorithm. In particular, it does
not prevent the ‘‘displacement’’ of good results in the most important category c1 by
outstanding (in the number but not in the quality nor originality of achievements) results
in the less important categories.
The present work tackles many problems and can be a starting point for further research
in various areas. In particular, although the new algorithm weights deriving in the official
scientific units evaluation procedure is proposed, there are also other highly subjective
parts of the algorithm where the PC methods might help. One of them is choosing by
experts the so-called reference scientific units.
924 Scientometrics (2014) 99:911–926
123
Conclusions
The identification of major criteria is a key issue for building a conceptual evaluation
model. Once it is done, the final weights are computed from the relative pairwise com-
parisons by synthesizing them. The model demonstrated in this paper has been used in
Poland for evaluating scientific entities consistent with the one proposed by the Ministry of
Science and Higher Education (2012). However, the presented method is flexible and can
accommodate all criteria at hand, including both quantitative and qualitative factors. No
model is ideal and usually undergoes evolution as time passes. It is anticipated that CERU
will be improving the model to evaluate academic entities at the national level. Using our
approach to compute the weights is a time consuming but necessary exercise since it will
benefit the entire country when the weights are computed (as opposed to arbitrary
assignment). In particular, the success-index could improve the performance evaluation
methods Franceschini et al (2012) in the evolved model.
Acknowledgements The following faculty members have kindly provided their input and agreed to belisted (according to the Polish tradition with the scientific titles; the country is listed if outside Poland): Prof.dr hab in _z. Ryszard Tadeusiewicz (AGH UST), Prof. dr hab. Stanisław Kistryn (The Jagiellonian Univer-sity), Prof. dr Bogdan Denny Czejdo, Belk Distinguished Professor (Fayetteville State University, USA),Prof. dr hab. Stan Matwin (IPI PAN, Poland, Dalhousie University, Canada), Prof. Eugene Eberbach(Rensselaer Polytechnic Institute, USA), dr hab. Krzysztof Oprzedkiewicz, Prof. AGH (AGH UST), Prof. drhab. Maria Mach-Krol (University of Economics in Katowice), Prof. dr hab. Halina Kwasnicka (WroclawUniversity of Technology) and Prof. Witold Kwasnicki (Administration and Economics University ofWroclaw), dr in _z. Jarosław Was (AGH UST), dr in _z. Radosław Klimek (AGH UST), dr in _z. PawełSkrzynski (AGH UST), mgr in _z. Krzysztof Kluza (AGH UST), Weronika Adrian (AGH UST). The authorswould like to thank all respondents of the Internet survey. The authors would like to thank T. Kakiashvli,MD, Amanda Dion—Groleau (Laurentian University), Grant O. Duncan (student at Laurentian University;Team Lead at Health Sciences North, Sudbury, Ontario, Canada), and Mr Ian Corkill for the editorialimprovements. Mr Karol Wojcik (student at AGH UST) has developed and maintained the Internet sur-veying tool.
Open Access This article is distributed under the terms of the Creative Commons Attribution Licensewhich permits any use, distribution, and reproduction in any medium, provided the original author(s) and thesource are credited.
References
Aczel, J., & Saaty, T. L. (1983). Procedures for synthesizing ratio judgements. Journal of MathematicalPsychology 27(1):93–102. doi:10.1016/0022-2496(83)90028-7.
Anholcer, M., Babiy, V., Bozoki, S., & Koczkodaj, W. W. (2010). A simplified implementation of the leastsquares solution for pairwise comparisons matrices. Central European Journal of Operations Research19(4):439–444.
Bozoki, S., & Rapcsak, T. (2008). On Saaty’s and Koczkodaj’s inconsistencies of pairwise comparisonmatrices. Journal of Global Optimization 42(2):157–175.
Bozoki, S., Fulop, J., & Ronyai, L. (2010). On optimal completion of incomplete pairwise comparisonmatrices. Mathematical and Computer Modelling 52(1–2):318 – 333, doi:10.1016/j.mcm.2010.02.047,URL http://www.sciencedirect.com/science/article/pii/S0895717710001159.
Condercet, M. (1785). Essay on the Application of Analysis to the Probability of Majority Decisions.Paris:Imprimerie Royale.
Crawford, G. B. (1987). The geometric mean procedure for estimating the scale of a judgement matrix.Mathematical Modelling 9(3–5):327 – 334 doi:10.1016/0270-0255(87)90489-1, URL http://www.sciencedirect.com/science/article/pii/0270025587904891.
Dong, Y., Xu, Y., Li, H., & Dai, M. (2008). A comparative study of the numerical scales and the priori-tization methods in AHP. European Journal of Operational Research 186(1):229–242.
Scientometrics (2014) 99:911–926 925
123
Fechner, G. T. (1966). Elements of psychophysics, vol 1. Holt, Rinehart and Winston, New York.Franceschini, F., Maisano, D., & Mastrogiacomo, L. (2012). Evaluating research institutions: The potential
of the success-index. Scientometrics 96(1):85–101.Fulop, J., Koczkodaj, W. W., & Szarek, S. J. (2010). A different perspective on a scale for pairwise
comparisons. Transactions on Computational Collective Intelligence 1:71–84.Geuna, A., & Martin, B. R. (2003). University research evaluation and funding: An international com-
parison. Minerva 41(4):277–304.Geuna, A., of Sussex SPRU : Science U, Research TP (1999). The Changing Rationale for European
University Research Funding: Are There Negative Unintended Consequences? Electronic workingpaper series, University of Sussex, SPRU, URL http://books.google.pl/books?id=lBpuMwEACAAJ.
Grzybowski, A. Z. (2012). Note on a new optimization based approach for estimating priority weights andrelated consistency index. Expert Systems with Applications 39(14):11,699–11,708.
Herman, M. W., & Koczkodaj, W. W. (1996). A monte carlo study of pairwise comparison. Inf Process Lett57(1):25–29 doi:10.1016/0020-0190(95)00185-9.
Jensen, R. E. (1984). An alternative scaling method for priorities in hierarchical structures. Journal ofMathematical Psychology 28(3):317 – 332. doi:10.1016/0022-2496(84)90003-8, URL http://www.sciencedirect.com/science/article/pii/0022249684900038.
Ji, P., & Jiang, R. (2003). Scale transitivity in the AHP. Journal of the Operational Research Society54(8):896–905 doi:10.1057/palgrave.jors.2601557.
Kistryn, S. (2013). Mission of CEAE – how easy is to evaluate the quality? (Misja KEJN – czy łatwo ocenicjakosc?). URL http://forumakademickie.pl/fa/2012/05/misja-kejn-czy-latwo-ocenic-jakosc/.
Koczkodaj, W. W. (1993). A new definition of consistency of pairwise comparisons. Math Comput Model18(7):79–84. doi:10.1016/0895-7177(93)90059-8.
Koczkodaj, W. W., & Szarek, S. J. (2010). On distance-based inconsistency reduction algorithms forpairwise comparisons. Logic Journal of the IGPL 18(6):859–869.
Kohavi, R. (1995). A study of cross-validation and bootstrap for accuracy estimation and model selection.San Mateo: Morgan Kaufmann. pp 1137–1143.
Kułakowski, K. (2013). A heuristic rating estimation algorithm for the pairwise comparisons method.Central European Journal of Operations Research pp 1–17, doi:10.1007/s10100-013-0311-x.
Ministry of Science and Higher Education. (2012). Regulation on principles of science financing (Polish:Rozporzadzenie Ministra Nauki i Szkolnictwa Wy _zszego w sprawie kryteriow i trybu przyznawaniakategorii naukowej jednostkom naukowym). Dziennik Ustaw Rzeczypospolitej Polskiej 877, URLhttp://www.bip.nauka.gov.pl/_gAllery/19/31/19319/poz._877.pdf.
Saaty, T. L. (1977). A scaling method for priorities in hierarchical structures. Journal of MathematicalPsychology 15(3):234 – 281, doi:10.1016/0022-2496(77)90033-5, URL http://www.sciencedirect.com/science/article/pii/0022249677900335.
Saaty, T. L. (2005). The analytic hierarchy and analytic network processes for the measurement of intan-gible criteria and for decision-making. In: Multiple Criteria Decision Analysis: State of the Art Sur-veys, International Series in Operations Research and Management Science, vol 78, Springer NewYork, pp 345–405. doi:10.1007/0-387-23081-5_9.
Saaty, T. L. (2008) Relative Measurement and Its Generalization in Decision Making. Why PairwiseComparisons are Central in Mathematics for the Measurement of Intangible Factors. The AnalyticHierarchy/Network Process. Estadıstica e Investigacion Operativa / Statistics and OperationsResearch (RACSAM) 102:251–318.
Saaty, T. L. (2013). On the measurement of intangibles. A principal eigenvector approach to relativemeasurement derived from paired comparisons. Notices of the American Mathematical Society60(02):192.
Salo, A. A., & Hamalainen, R. P. (1997). On the measurement of preferences in the analytic hierarchyprocess. Journal of Multi-Criteria Decision Analysis 6(6):309–319. doi:10.1002/(SICI)1099-1360(199711)6:6\309::AID-MCDA163[3.0.CO;2-2.
Subramanian, N., & Ramanathan, R. (2012). A review of applications of analytic hierarchy process inoperations management. International Journal of Production Economics 138(2):215–241.
Thurstone, L. L. (1994). A law of comparative judgment, reprint of an original work published in 1927.Psychological Review 101:266–270.
Triantaphyllou, E., Lootsma, F. A., Pardalos, P. M., & Mann, S. H. (1994). On the evaluation and appli-cation of different scales for quantifying pairwise comparisons in fuzzy sets. Journal of Multi-CriteriaDecision Analysis 3(3):133–155.
Wang, X., Liu, D., Ding, K., & Wang, X. (2011). Science funding and research output: A study on 10countries. Scientometrics 91(2):591–599.
926 Scientometrics (2014) 99:911–926
123