On the Path to SunShot: Emerging Opportunities and ... · On the Path to SunShot: Emerging...
109
ON THE PATH TO SUNSHOT May 2016 NREL/TP-6A20-65638 LBNL-1004372 Emerging Opportunities and Challenges in Financing Solar
-
Upload
truongdiep -
Category
Documents
-
view
220 -
download
1
Transcript of On the Path to SunShot: Emerging Opportunities and ... · On the Path to SunShot: Emerging...
ON THE PATH TO SUNSHOT
May 2016 NREL/TP-6A20-65638 LBNL-1004372
Emerging Opportunities and Challenges in Financing Solar
Cover photos (clockwise from top left): Solar Design Associates, Inc., NREL 08563; SolarReserve; Dennis Schroeder, NREL 30551; and iStock 000075760625
On the Path to SunShot: Emerging Opportunities and Challenges in Financing Solar
David Feldman1 and Mark Bolinger2
1 National Renewable Energy Laboratory2 Lawrence Berkeley National Laboratory
NREL is a national laboratory of the U.S. Department of Energy, Office of Energy Efficiency and Renewable Energy, operated by the Alliance for Sustainable Energy, LLC.
Lawrence Berkeley National Laboratory is a Department of Energy Office of Science lab managed by University of California.
SUGGESTED CITATION Feldman, David, and Mark Bolinger. 2016. On the Path to SunShot: Emerging Opportunities and Challenges in Financing Solar. Golden, CO: National Renewable Energy Laboratory. NREL/TP-6A20-65638. http://www.nrel.gov/docs/fy16osti/65638.pdf.

NOTICE
This report was prepared as an account of work sponsored by an agency of the United States government. Neither the United States government nor any agency thereof, nor any of their employees, makes any warranty, express or implied, or assumes any legal liability or responsibility for the accuracy, completeness, or usefulness of any information, apparatus, product, or process disclosed, or represents that its use would not infringe privately owned rights. Reference herein to any specific commercial product, process, or service by trade name, trademark, manufacturer, or otherwise does not necessarily constitute or imply its endorsement, recommendation, or favoring by the United States government or any agency thereof. The views and opinions of authors expressed herein do not necessarily state or reflect those of the United States government or any agency thereof.
This report is available at no cost from the National Renewable EnergyLaboratory (NREL) at www.nrel.gov/publications.
Available electronically at SciTech Connect http:/www.osti.gov/scitechAvailable for a processing fee to U.S. Department of Energyand its contractors, in paper, from:
U.S. Department of EnergyOffice of Scientific and Technical InformationP.O. Box 62Oak Ridge, TN 37831-0062OSTI http://www.osti.govPhone: 865.576.8401Fax: 865.576.5728Email: [email protected]
Available for sale to the public, in paper, from:
U.S. Department of CommerceNational Technical Information Service5301 Shawnee RoadAlexandria, VA 22312NTIS http://www.ntis.govPhone: 800.553.6847 or 703.605.6000Fax: 703.605.6900Email: [email protected]

iii This report is available at no cost from the National Renewable Energy Laboratory (NREL) at www.nrel.gov/publications.
Preface The U.S. Department of Energy launched the SunShot Initiative in 2011 with the goal of making solar electricity cost-competitive with conventionally generated electricity by 2020. At the time this meant reducing photovoltaic and concentrating solar power prices by approximately 75%—relative to 2010 costs—across the residential, commercial, and utility-scale sectors. To examine the implications of this ambitious goal, the Department of Energy’s Solar Energy Technologies Office (SETO) published the SunShot Vision Study in 2012. The study projected that achieving the SunShot price-reduction targets could result in solar meeting roughly 14% of U.S. electricity demand by 2030 and 27% by 2050—while reducing fossil fuel use, cutting emissions of greenhouse gases and other pollutants, creating solar-related jobs, and lowering consumer electricity bills.
The SunShot Vision Study also acknowledged, however, that realizing the solar price and deployment targets would face a number of challenges. Both evolutionary and revolutionary technological changes would be required to hit the cost targets, as well as the capacity to manufacture these improved technologies at scale in the U.S. Additionally, operating the U.S. transmission and distribution grids with increasing quantities of solar energy would require advances in grid-integration technologies and techniques. Serious consideration would also have to be given to solar siting, regulation, and water use. Finally, substantial new financial resources and strategies would need to be directed toward solar deployment of this magnitude in a relatively short period of time. Still the study suggested that the resources required to overcome these challenges were well within the capabilities of the public and private sectors. SunShot-level price reductions, the study concluded, could accelerate the evolution toward a cleaner, more cost-effective and more secure U.S. energy system.
That was the assessment in 2012. Today, at the halfway mark to the SunShot Initiative’s 2020 target date, it is a good time to take stock: How much progress has been made? What have we learned? What barriers and opportunities must still be addressed to ensure that solar technologies achieve cost parity in 2020 and realize their full potential in the decades beyond?
To answer these questions, SETO launched the On the Path to SunShot series in early 2015 in collaboration with the National Renewable Energy Laboratory (NREL) and with contributions from Lawrence Berkeley National Laboratory (LBNL), Sandia National Laboratories (SNL), and Argonne National Laboratory (ANL). The series of technical reports focuses on the areas of grid integration, technology improvements, finance and policy evolution, and environment impacts and benefits. The resulting reports examine key topics that must be addressed to achieve the SunShot Initiative’s price-reduction and deployment goals. The On the Path to SunShot series includes the following reports:
• Emerging Issues and Challenges with Integrating High Levels of Solar into the Electrical Generation and Transmission Systems (Denholm et al. 2016)
• Emerging Issues and Challenges with Integrating High Levels of Solar into the Distribution System (Palmintier et al. 2016)
• Emerging Opportunities and Challenges in Financing Solar (Feldman and Bolinger 2016)
iv This report is available at no cost from the National Renewable Energy Laboratory (NREL) at www.nrel.gov/publications.
• Utility Regulatory and Business Model Reforms for Addressing the Financial Impacts of Distributed Solar on Utilities (Barbose et al. 2016)
• The Role of Advancements in Photovoltaic Efficiency, Reliability, and Costs (Woodhouse et al. 2016)
• Advancing Concentrating Solar Power Technology, Performance, and Dispatchability (Mehos et al. 2016)
• Emerging Opportunities and Challenges in U.S. Solar Manufacturing (Chung et al. 2016)
• The Environmental and Public Health Benefits of Achieving High Penetrations of Solar Energy in the United States (Wiser et al. 2016).
Solar technology, solar markets, and the solar industry have changed dramatically over the past five years. Cumulative U.S. solar deployment has increased more than tenfold, while solar’s levelized cost of energy (LCOE) has dropped by as much as 65%. New challenges and opportunities have emerged as solar has become much more affordable, and we have learned much as solar technologies have been deployed at increasing scale both in the U.S. and abroad. The reports included in this series, explore the remaining challenges to realizing widely available, cost-competitive solar in the United States. In conjunction with key stakeholders, SETO will use the results from the On the Path to SunShot series to aid the development of its solar price reduction and deployment strategies for the second half of the SunShot period and beyond.

v This report is available at no cost from the National Renewable Energy Laboratory (NREL) at www.nrel.gov/publications.
Acknowledgments The authors thank the Solar Energy Technologies Office team for its support of this report and Robert Margolis of NREL for his management and oversight of the On the Path to SunShot report series. We also appreciate the knowledgeable input and critical reviews provided by the following individuals, which greatly improved and informed the analysis: Nick Abrams (NRG), Douglas Arent (NREL), David Arfin (First Energy Finance), Nate Blair (NREL), Daren Blomquist (Realtytrac), Sandy Burns (Pacific Gas & Electric [PG&E]), Dan Conant (DOE), Trevor D’Olier-Lees (Standard & Poor’s), Carolyn Davidson (NREL), Barbara Goodman (NREL), Kristian Hanelt (formerly with Clean Power Finance), Ray Henger (formerly with OwnEnergy, EDF Renewable Energy), Mari Hernandez (SolarCity), Ted James (PG&E), Brooks Kaufman (Industry Funds Management), Kevin Kerley (Realtytrac), Chuck Kutscher (NREL), Travis Lowder (NREL), Albert Luu (SolarCity), James Mann (Cadwalader (Wickersham & Taft LLP), Francis Martin O’Sullivan (MIT Energy Initiative), Chet McGensy (SolarCity), Eric Miller (Nudura), David Mooney (NREL), Robin Newmark (NREL), Dick Patterson (PG&E), Gian Porro (NREL), Ammar Qusaibaty (DOE), Mary Rottman (Rottman-Associates), George Schaefer (consultant), Lidija Sekaric (DOE), Ben Sigrin (NREL), Emmanuelle Stewart (SolarCity), Jacob Susman (OwnEnergy, EDF Renewable Energy), Elaine Ulrich (DOE), Mary Werner (NREL), and Ryan Wiser (Lawrence Berkeley National Laboratory). The authors also thank Jarett Zuboy (consultant) and Mike Meshek (NREL) for editorial assistance.
This work was funded by the Solar Energy Technologies Office of the U.S. Department of Energy (DOE) Office of Energy Efficiency and Renewable Energy (EERE). The contributions of the National Renewable Energy Laboratory (NREL) to this report were funded by the Solar Energy Technologies Office under Contract No. DE-AC36-08GO28308. The contributions of the Lawrence Berkeley National Laboratory (LBNL) to the report were funded by the Solar Energy Technologies Office under Contract No. DE-AC02-05CH11231.
John Frenzl of NREL designed the covers for the On the Path to SunShot report series.

vi This report is available at no cost from the National Renewable Energy Laboratory (NREL) at www.nrel.gov/publications.
List of Acronyms ABL asset-based lending ABS asset-backed securities AC alternating current ACP alternative compliance payment ADSAB aggregate discounted solar asset balance Alt alternative option APR annual percentage rate BAU business as usual CapEx capital expenditure CCGT combined-cycle gas turbine CF cash flow CSP concentrating solar power DC direct current DG distributed generation DOE U.S. Department of Energy EBITDA earnings before interest, taxes, depreciation, and amortization EIA U.S. Energy Information Administration EPA U.S. Environmental Protection Agency EPAct Energy Policy Act ERCOT Electric Reliability Council of Texas FASB Financial Accounting Standards Board FHA Federal Housing Administration FHFA Federal Housing Finance Agency GAAP generally accepted accounting principles HELOC home-equity line of credit HUD U.S. Department of Housing and Urban Development IPP independent power producer IRR internal rate of return IRS U.S. Internal Revenue Service ITC investment tax credit LCOE levelized cost of energy LIBOR London Interbank Offered Rate LPO U.S. Department of Energy Loan Programs Office MACRS Modified Accelerated Cost Recovery System Mezz mezzanine debt MLP master limited partnership MLS multiple listing services MWh megawatt-hour NREL National Renewable Energy Laboratory O&M operation and maintenance OPBA operations phase business assessment O-SPaRC Open Solar Performance and Reliability Clearinghouse PACE property-assessed clean energy PBI performance-based incentive PEG private equity group

vii This report is available at no cost from the National Renewable Energy Laboratory (NREL) at www.nrel.gov/publications.
PG&E Pacific Gas & Electric PPA power-purchase agreement PURPA Public Utility Regulatory Policies Act PV photovoltaic(s) REC renewable energy certificate REIT real estate investment trust RPS Renewable portfolio standard S&P Standard & Poor’s SAM System Advisor Model SAPC Solar Access to Public Capital SPV special purpose vehicle SREC solar renewable energy certificate TPO third-party ownership VC venture capital VoS value of solar WACC weighted-average cost of capital

viii This report is available at no cost from the National Renewable Energy Laboratory (NREL) at www.nrel.gov/publications.
Executive Summary Because solar energy technologies historically have had high upfront costs and low operating costs, and they are able to provide long-term benefits, financing is critically important to the solar market. A wide variety of federal, state, and local incentives have helped make solar more affordable and competitive, but some of these incentives have also had a significant impact on how solar projects are financed. For example, the importance of federal tax incentives for solar—including a 30% investment tax credit (ITC) and five-year accelerated tax depreciation—has driven the creation of complicated tax-equity structures that monetize these tax benefits on behalf of project sponsors who cannot efficiently use them on their own. After being used in the utility-scale solar sector, these tax-equity structures have also spurred the development of third-party ownership of photovoltaic (PV) systems in the non-residential (commercial, industrial, government, and non-profit) and residential sectors. Though these complicated structures have driven significant solar deployment,1 they are increasingly recognized as inefficient and costly, relying almost exclusively on the two most expensive sources of capital: sponsor equity and tax equity. As a result, solar industry stakeholders have expended significant effort developing lower-cost financing solutions designed to help solar reach long-term competitiveness with traditional sources of energy. Much has already been accomplished. For example:
• Third-party solar owners have structured and sold to investors asset-based securities that rely on the incoming cash flows from project portfolios with a relatively low cost of capital. This process has been facilitated by greater standardization of key documents as well as an increasing amount of project performance data.
• Similarly, large project sponsors have spun off their operating projects into publicly traded YieldCos financed by low-cost public equity and corporate debt.
• Ongoing consolidation and vertical integration within the industry are expanding the financing options available, typically at lower costs.
• Easily accessible solar-secured loan products tailored to the stable cash flow profile of residential PV projects are flourishing.
• An increasing number of online finance platforms are helping borrowers and lenders and/or developers and tax-equity investors find each other; in the residential sector, these can also offer financing at the point of sale. While the industry clarifies how distributed solar will be compensated going forward (e.g., by raising net-metering caps or switching to “value of solar” rate designs), the spread of “virtual net metering” allows individuals and businesses to invest in larger, centralized “community solar” projects, often at a lower cost than rooftop systems.
• Realtors, appraisers, and mortgage lenders are gaining a better understanding of the value that a host-owned PV system brings to a home, enabling sellers to realize that extra value and buyers to borrow against it using low-cost tax-advantaged mortgages or home-equity loans.
1 For example, TPO systems constituted approximately 72% of U.S. residential PV installed in 2014 (GTM Research 2015a).
ix This report is available at no cost from the National Renewable Energy Laboratory (NREL) at www.nrel.gov/publications.
Looking ahead to the scheduled reduction in the federal ITC beginning in 2020, upfront costs will likely need to continue to decline, and remaining costs will likely need to be financed more affordably if solar is to remain competitive. Moreover, the solar industry’s growth—in terms of funding, deployment, and number of stakeholders—is increasing the transparency of financial transactions associated with solar technologies and thus the confidence investors have in solar. This trend has created significant opportunities for continued financial progress. As the industry continues to grow in size and scope, investors are likely to become more confident in the industry.
Ongoing evolution of the solar market is likely to produce financing structures that are simpler than the complicated tax-incentive-based financing used to date and which tap into a broader base of lower-cost capital sources. In many cases, these new structures could give the public a greater financial stake in solar’s long-term success. Once solar is much less costly and less subsidized, it might receive the type of lower-cost financing received by mature assets today. From a financing perspective, utility-scale solar could look much more like conventional generation assets, non-residential solar could look much like other capital improvements such as a new roof or an efficiency upgrade, and residential solar could look much like an expensive appliance.
Expanding on these parallels, we model financing structures—some based on how mature assets are financed—that might be used in a long-term steady-state environment of low solar costs and reduced tax incentives. For example, in such an environment, utility-scale solar projects could be financed much as combined-cycle gas turbines currently are financed (i.e., using short-term, partially amortizing loans supported by short-term power-purchase agreements or price hedges). In the residential sector, PV systems might become eligible for attractive consumer financing options like those commonly offered to prospective buyers of expensive appliances (e.g., no money down, 0% financing for 48 months).
Figure ES-1 presents consolidated levelized cost of energy (LCOE) estimates across sectors resulting from our modeling of various financing structures.2 In all three sectors, financial evolution and innovation have reduced—and are estimated to continue reducing—solar’s LCOE over time, independent of installed cost reductions. In this way, financing could continue to contribute significantly to reaching SunShot’s LCOE targets. The figure also demonstrates that, because of the financial innovations described in this report (and assuming achievement of the 2020 SunShot cost targets), solar could remain competitive with retail rates (in the case of residential and non-residential) and wholesale rates (in the case of utility-scale) going forward—even without the benefit of today’s federal tax incentives.
2 Figure ES-1 reflects post-2021 ITC assumptions under current law (i.e., no residential ITC and a 10% commercial ITC). That said, the “residential” bin in the left-most third of Figure ES-1 does, in some cases, reflect the capture of the 10% commercial ITC through TPO.

x This report is available at no cost from the National Renewable Energy Laboratory (NREL) at www.nrel.gov/publications.
Figure ES-1. Impact of financing cost and structure on solar’s LCOE (assuming SunShot
cost targets)
The figure represents estimated modeled results. Assumptions and sources for the figure are listed in Section 5.
Since the SunShot Initiative launched in 2011, much progress has been made in solar cost reduction and financial innovation. As solar costs continue to decline, raising capital more efficiently and under improved terms will become increasingly important to achieving SunShot’s 2020 cost-competitiveness goals. The analysis presented in this report suggests that financing can adapt to changing conditions and might even ease the transition away from a reliance on tax incentives while driving solar’s LCOE toward the SunShot goals.
$0.00
$0.05
$0.10
$0.15
$0.20
Historic Recent Long term Historic Recent Long term Historic Recent Long term
Residential ($1.60/W) Non-Residential ($1.30/W) Utility-Scale ($1.20/W)
LCO
E (2
015
$/kW
h) LCOE Range
Range of retail rates
Range of retail rates
Range of wholesale rates

xi This report is available at no cost from the National Renewable Energy Laboratory (NREL) at www.nrel.gov/publications.
Table of Contents 1 Introduction ........................................................................................................................................... 1 2 Incentives for Solar Deployment ......................................................................................................... 3
2.1 Federal Incentives ......................................................................................................................... 3 2.1.1 Personal Investment Tax Credit (ITC) for Residential Energy Property (Section 25D) .. 3 2.1.2 Corporate Investment Tax Credit (ITC) (Section 48) ...................................................... 3 2.1.3 Section 1603 Cash Grant in Lieu of Tax Credit ............................................................... 4 2.1.4 Five-Year Modified Accelerated Cost Recovery System (MACRS) ............................... 4 2.1.5 DOE Loan Program and other Federal Financing Programs............................................ 5
2.2 State and Local Incentives ............................................................................................................. 6 2.2.1 Renewable Portfolio Standards (RPS) ............................................................................. 6 2.2.2 State Tax Credits .............................................................................................................. 7 2.2.3 Grants, Rebates, or Performance-Based Incentives (PBIs) .............................................. 7 2.2.4 Subsidized Loans.............................................................................................................. 7 2.2.5 Property-Assessed Clean Energy (PACE) Programs ....................................................... 7 2.2.6 On-Bill Financing ............................................................................................................. 8 2.2.7 Net Metering and other Bill Credit Mechanisms ............................................................. 8 2.2.8 Virtual Net Metering ........................................................................................................ 9
3 Historical Financing Methods and Associated Challenges ........................................................... 10 3.1 Common Tax-Equity Financing Structures ................................................................................. 10
3.1.1 Sale-Leaseback ............................................................................................................... 10 3.1.2 Inverted Lease (Lease Pass-Through) ............................................................................ 11 3.1.3 Partnership Flip .............................................................................................................. 12
3.2 Historical Financing Methods in the Central or Utility-Scale PV Market .................................. 15 3.2.1 Independent Power Producer Ownership ....................................................................... 16 3.2.2 Utility Ownership ........................................................................................................... 17
3.3 Historical Financing Methods in the Residential Market ............................................................ 18 3.3.1 Host Ownership .............................................................................................................. 19 3.3.2 Third-Party Ownership (TPO) ....................................................................................... 22
3.4 Historical Financing Methods in the Non-Residential Distributed PV Market ........................... 27 3.4.1 Host Ownership .............................................................................................................. 30 3.4.2 Third-Party Ownership (TPO) ....................................................................................... 33
4 Recent Innovative Approaches to Addressing Historical Financing Challenges ........................ 37 4.1 Improving Access to Lower-Cost Financing ............................................................................... 37
4.1.1 Securitization and YieldCos ........................................................................................... 37 4.1.2 Solar-Specific Loans ...................................................................................................... 40 4.1.3 Online Finance Platforms ............................................................................................... 41
4.2 Standardization and Data Collection ........................................................................................... 42 4.3 Consolidation and Vertical Integration ....................................................................................... 45 4.4 Addressing Real Estate Issues ..................................................................................................... 46 4.5 Addressing Net-Metering Barriers .............................................................................................. 47 4.6 Community Shared Solar, Virtual Net Metering, and Corporate Offtake Agreements .............. 49
5 Shifting to Long-Term, Steady-State Financing .............................................................................. 52 5.1 Inherent Differences Between Solar and Conventional Generation Assets ................................ 52
5.1.1 Development and Construction Risk .............................................................................. 53 5.1.2 Operational Risk ............................................................................................................. 53 5.1.3 Continued Need to Monetize Tax Benefits .................................................................... 55
5.2 Long-term Central or Utility-Scale PV Finance .......................................................................... 56 5.2.1 Review of Traditional Energy Asset Finance ................................................................. 56 5.2.2 Modeling the Impact of Financing on Utility-Scale PV’s LCOE .................................. 58

xii This report is available at no cost from the National Renewable Energy Laboratory (NREL) at www.nrel.gov/publications.
5.3 Long-Term Residential PV Finance ............................................................................................ 62 5.3.1 Host Owned .................................................................................................................... 63 5.3.2 Third-Party Ownership (TPO) ....................................................................................... 66 5.3.3 Modeling the Impact of Financing on Residential PV’s Levelized Cost of Energy
(LCOE) ........................................................................................................................... 69 5.4 Long-term Non-Residential PV Finance ..................................................................................... 74
5.4.1 Modeling the Impact of Financing on Non-Residential PV’s Levelized Cost of Energy (LCOE) ........................................................................................................................... 78
5.5 Impact of Financing Costs across Market Sectors and Inherent Risks........................................ 82 6 Conclusions ........................................................................................................................................ 86 References ................................................................................................................................................. 87

xiii This report is available at no cost from the National Renewable Energy Laboratory (NREL) at www.nrel.gov/publications.
List of Figures Figure ES-1. Impact of financing cost and structure on solar’s LCOE (assuming SunShot cost targets)x Figure 1. Schematic of the Partnership Flip structure (with back leverage) ........................................ 13 Figure 2. Non-residential PV capacity by system size in Arizona, California, Massachusetts, New
Jersey, and New York, 2010–2014 ............................................................................................. 28 Figure 3. Non-residential PV installations by customer segment in 2014 in Arizona, California,
Massachusetts, New Jersey, and New York ................................................................................ 29 Figure 4. Building electricity consumption by principal building activity ........................................... 29 Figure 5. Private capital market required rates of return ...................................................................... 31 Figure 6. States with virtual or community solar legislation ................................................................ 50 Figure 7. Median transaction account balance by income level ........................................................... 64 Figure 8. LCOE for residential systems, by ownership and financing structure .................................. 72 Figure 9. Average monthly payments over lifetime of residential PV system and average monthly
loan and O&M payments during the tenor of a loan ................................................................... 73 Figure 10. LCOE for residential systems, by ownership, financing structure, and tax credit .............. 74 Figure 11. Relation between SREC pricing and non-residential PV installations in New Jersey
and Pennsylvania ......................................................................................................................... 75 Figure 12. LCOE with 10% ITC for non-residential PV systems, by ownership and
financing structure ....................................................................................................................... 81 Figure 13. Impact of financing cost and structure on solar’s LCOE (assuming SunShot cost targets) 82
xiv This report is available at no cost from the National Renewable Energy Laboratory (NREL) at www.nrel.gov/publications.
List of Tables Table 1. Select PACE Programs and Associated Interest Rates ........................................................... 21 Table 2. Total Revenue, Net Income, and Residential Deployment of Sunrun, Vivint Solar,
and SolarCity ............................................................................................................................... 24 Table 3. Typical After-Tax Return for Third-Party Financial Structure, Distributed PV .................... 25 Table 3. Vital Statistics of Five Distributed PV ABS Issued to Datea ................................................. 38 Table 4. Initial Bond Raise versus Latest Bond Raise, SolarCity and MidAmerican Energy .............. 44 Table 5. Utility-Scale Modeling Results Under a 10% ITC and High/Low Capacity Factors ............. 61 Table 6. Utility-Scale Modeling Results Under No ITC and High/Low Capacity Factors .................. 62 Table 7. Examples of Favorable Consumer Financing Options by Industry ........................................ 65 Table 8. Percent Energy Cost Advantage due to TPO, Varied by Customer and TPO WACCa .......... 66 Table 9. System-Level Assumptions Common across Residential Models ......................................... 70 Table 10. Financial Assumptions for Residential Models .................................................................... 71 Table 11. Equipment Financing Expenditures in 2014, by Industry .................................................... 76 Table 12. Advantages and Disadvantages of Leasing and Owning Capital Equipment....................... 77 Table 13. System-Level Assumptions Common across Non-Residential Models ............................... 79 Table 14. Financial Assumptions for Non-Residential Models ........................................................... 80

1 This report is available at no cost from the National Renewable Energy Laboratory (NREL) at www.nrel.gov/publications.
1 Introduction Solar energy technologies have high upfront costs (at least historically), low operating costs, and the ability to provide long-term benefits. These factors impact the amount of capital available to fund solar deployment as well as the cost of those funds. Thus, financing is critically important to the solar market because these factors have a disproportionately larger impact on solar’s levelized cost of energy (LCOE) than traditional sources of energy generation. In 2015, a 7% weighted-average cost of capital (WACC) contributed about 41% to the total LCOE from a utility-scale photovoltaic (PV) project (relative to free, no-cost capital).3
Achieving the U.S. Department of Energy’s SunShot Initiative goal of reaching cost parity with baseload energy rates (and sub-retail rates for distributed PV) will require improved operational and technological performance as well as dramatic cost reductions, some of which can be achieved through lower-cost sources of capital. For example, reducing the WACC by 100 basis points translates into an approximately 10% reduction in solar’s LCOE (depending on system cost, configuration, and location).4
If solar achieves cost parity with traditional sources of energy generation, a considerable amount of economically viable solar projects would need the ability to access capital sources. Based on the SunShot Vision Study (DOE 2012), achieving the SunShot cost targets5 could result in solar deployment of 12 gigawatts (GW)/year in 2020 and 30 GW/year in 2030, while requiring up to $45 billion/year of solar project capital investment.6 This represents a twofold increase from the approximately $20 billion of investment in 2014 (SEIA and GTM Research 2015a; Barbose and Darghouth 2015; Bolinger and Seel 2015), one quarter of which came from tax-equity investors ($4.5 billion) participating in large part to use the 30% federal investment tax credit (ITC), which phases down (to 10% for businesses or 0% for host-owned residential systems) between 2020 and 2024 (Martin 2015a).
While there have been various financing methods and sources of capital for solar energy projects, most funding has come from limited and expensive sources. For example, as of May 2015, only around 25 tax-equity participants were investing in the U.S. market, requiring after-tax returns of 8%–10% for unlevered projects and 11%–14% with project debt.7 To reach the SunShot vision, solar finance will need to move beyond these historical capital sources and
3 Real LCOEs were calculated using version 2015.1.30 of the System Advisor Model (SAM). Key assumptions include a single-axis tracking PV system located in Kansas City, MO, with an installed cost of $1.9/W. For more information about SAM, see www.nrel.gov/analysis/sam/. 4 This figure was obtained using SAM, version 2015.1.30. 5 The original SunShot targets, quoted in 2010 dollars, were $1/W for utility-scale PV, $1.25/W for non-residential distributed PV, $1.5/W for residential PV, and $3.6/W for CSP (with a 67% capacity factor, implying some amount of storage). In Section 5, we model PV LCOE’s using the updated SunShot targets of $1.2/W for utility-scale (with one-axis tracking), $1.3/W for non-residential distributed PV, and $1.6/W for residential PV stated in Woodhouse et al. (2016). Prices are quoted in 2015 dollars (as opposed to the original targets, benchmarked in 2010 dollars) and were derived from an updated set of technological and market assumptions. 6 There will also be a need for additional capital to finance the solar supply chain and other infrastructure buildout, but this report focuses solely on project finance. 7 While these returns were arranged in a historically low-interest-rate environment, industry participants do not necessarily think an increase in interest rates will cause an increase in required tax-equity returns. This is due to the fact that tax-equity returns for the solar industry are largely predicated on a limited supply of investors.

2 This report is available at no cost from the National Renewable Energy Laboratory (NREL) at www.nrel.gov/publications.
financing structures. This may require a variety of different funders, with a range of costs, depending on the specific needs and circumstances of the investor, energy purchaser, and project.
This report discusses the necessary transition to these new sources and what solar finance might look like over the long term as the market matures toward a steady-state environment. Section 2 briefly describes federal, state, and local incentives currently supporting solar deployment, as some of these incentives can have a significant impact on solar project financing. Section 3 summarizes historical financing methods, including their challenges and shortcomings. Section 4 summarizes recent innovative solutions to the challenges described in Section 3. Section 5 discusses where solar finance may be headed over the long term and what this could mean for achieving widespread adoption of solar energy. We offer conclusions in Section 6.

3 This report is available at no cost from the National Renewable Energy Laboratory (NREL) at www.nrel.gov/publications.
2 Incentives for Solar Deployment This section reviews the most common federal, state, and local incentives that have promoted solar energy. Because solar’s LCOE is heavily weighted toward upfront construction, many of these incentives attempt to lower upfront costs. There are, however, various government incentive types, each with unique impacts on project financing. Additionally, while an increasing number of solar projects are being installed in the United States using only federal incentives (due to lower project costs), historically a combination of federal, state, and local incentives has been needed to make a solar project economically viable.
2.1 Federal Incentives Federal solar energy incentives have been provided primarily through the U.S. tax code in the form of an ITC provided in the first year of operation, either under Section 25D or 48 of the tax code.
2.1.1 Personal Investment Tax Credit (ITC) for Residential Energy Property (Section 25D)
Established in the Energy Policy Act (EPAct) of 2005, the residential tax credit initially was set to expire at the end of 2008 and had a $2,000 credit limit. In 2008, the credit was modified to remove the $2,000 limit and allow taxpayers to take the credit against the alternative minimum tax (both starting in 2009), and it was extended through December 31, 2016. A taxpayer may claim a credit of 30% of qualified expenditures for a system that serves a dwelling unit located in the United States that is owned and used as a residence by the taxpayer. Any portion of electricity generated for business use is designated as ineligible. If the taxpayer cannot use the credit in the year it is generated, it can be carried forward to the next tax year, but at the expense of some of the credit’s time value. In the Consolidated Appropriations Act, 2016 (H.R. 2029), the credit was further extended so that taxpayers could claim a 30% tax credit for equipment placed in service through 2019. The credit then drops to 26% and 22% for projects placed in service in 2020 and 2021, respectively.
2.1.2 Corporate Investment Tax Credit (ITC) (Section 48) The corporate ITC of 10% of eligible expenditures was first enacted in 1978. In 2005, new legislation raised the ITC to 30%, starting in 2006, and in 2008 it was extended again to projects placed in service by December 31, 2016. The Consolidated Appropriations Act, 2016 (H.R. 2029) extended the credit so that projects under construction before 2020 received the full 30% credit. The credit then falls to 26% for projects starting construction in 2020 and 22% for projects starting construction in 2021. For any solar project that starts construction after 2021, or which fails to be placed in service by January 1, 2024, the ITC reverts to 10%. Although the credit is usually claimed in full in the year the solar project is put in service, commercial tax credits “vest” over five years at the rate of 20% a year. This means that, if something happens to solar equipment in the four years after the equipment is put into service that would have prevented the taxpayer from claiming the credit had it happened at the start (such as the sale of the equipment), then the “unvested” part of the credit is recaptured (paid back to the U.S. Internal Revenue Service [IRS]).
4 This report is available at no cost from the National Renewable Energy Laboratory (NREL) at www.nrel.gov/publications.
This vesting essentially prevents owners from selling the project within its first five years to avoid a significant reduction in tax benefits, and therefore this stipulation limits financing activities. The tax credit can be carried back 1 year or forward 20 years, but the taxpayer will lose some time value of the credit if carried forward. For this reason, it is ideal for the owner of the solar equipment to be able to use the tax credit in the first year—a limiting factor, particularly for larger systems or pools of systems. System owners can “pass through” the tax credit to another entity if that entity leases the system from the owner; however, both the system owner and lessee must be eligible to receive the credit. Therefore, tax-exempt entities, including non-profits and government entities, are ineligible to receive the ITC8; further, a for-profit company may not claim the credit if the solar equipment is leased to a non-profit entity, thus non-profits typically enter a service contract, such as a power-purchase agreement (PPA), instead of a lease.
The economics of utility solar ownership are challenged by a regulation that limits utilities’ ability to pass on the full advantage of a solar project’s tax benefits to ratepayers. In particular, the IRS currently requires that the benefit of the ITC to ratepayers be amortized over the life of the facility—a process called “normalization.” Normalization defers the upfront tax benefit and thereby dilutes the incentive intended under the federal tax code. Utilities cannot take the ITC without normalizing the tax benefit.
2.1.3 Section 1603 Cash Grant in Lieu of Tax Credit The Section 1603 Treasury Program, enacted in 2009 under the American Recovery and Reinvestment Act of 2009, enables commercial solar projects that qualify for the Section 48 ITC to choose between the credit and a cash grant of equal value to the Section 48 ITC. By giving developers the option to receive a 30% cash grant (administered by the U.S. Department of the Treasury) in lieu of the ITC, Congress hoped to “temporarily fill the gap created by the diminished investor demand for tax credits,” and thereby achieve “the near term goal of creating and retaining jobs … as well as the long-term benefit of expanding the use of clean and renewable energy and decreasing our dependency on non-renewable energy sources” (U.S. Department of the Treasury 2009). To receive a grant, facilities must have begun construction on or before December 31, 2011 (however, grants can be given to these projects placed in service before January 1, 2017). The IRS interpretation of beginning construction requires a facility to either have started “physical work of a significant nature” or have incurred at least 5% of the total cost of the project (and made continuous efforts to complete the facility thereafter). The 1603 grant also has a slightly less stringent set of recapture rules than the Section 48 ITC.
2.1.4 Five-Year Modified Accelerated Cost Recovery System (MACRS) Businesses can deduct all ITC-eligible property costs over an accelerated 5-year depreciation schedule, thereby reducing their taxable income (as per Sections 167 and 168 of the U.S. Internal Revenue Code). If the ITC is claimed on this property (by either the owner or a lessee), the eligible basis must be reduced by 50% of the value of the credit.9 For example, a 30% ITC would reduce the basis from 100% of eligible property to 85% of eligible property, and a 10% ITC
8 Including pass-through entities (such as partnerships) in which a non-profit holds a direct or indirect interest, other than a “C-corporation.” 9 If the lessee claims the ITC in this transaction, but not the depreciation, the lessee must also effectively take that adjustment by incurring an income inclusion equal to 50% of the ITC, spread over five years (the length of the ITC vesting period).
5 This report is available at no cost from the National Renewable Energy Laboratory (NREL) at www.nrel.gov/publications.
would reduce the basis to 95%. The 5-year MACRS depreciation schedule provides a tax benefit equal to about 26% of system costs on a present-value basis. In comparison, a 20-year straight-line depreciation schedule provides a tax benefit of 14% of system costs. An investor’s present value of the combined ITC and MACRS for a commercial system, therefore, amounts to about 56% of the installed cost of a solar project (Bolinger 2009). There is no expiration of MACRS written into the federal tax code.
Depreciation of the asset has, at times, been further accelerated through “bonus depreciation” that allows eligible plants to depreciate 30%, 40%, 50%, or, at times, 100% of their basis in the 1st year. The “bonus depreciation” allowance has been extended many times, most recently in the Consolidated Appropriations Act, 2016 (H.R. 2029)which provides 50% bonus depreciation for projects placed in service from 2015 to 2017 and 40% and 30% bonus depreciation for projects placed in service in 2018 and 2019, respectively.
2.1.5 DOE Loan Program and other Federal Financing Programs The U.S. Department of Energy’s Loan Programs Office (LPO) aims to accelerate the domestic commercial deployment of innovative clean energy technologies to help achieve national clean energy objectives including job creation, reduced dependence on foreign oil, an improved U.S. environmental legacy, and enhanced American competitiveness in the global economy. LPO executes this mission by guaranteeing loans to eligible innovative clean energy projects through the Title XVII loan guarantee program and by providing direct loans to eligible manufacturers of advanced technology vehicles and components through the Advanced Technology Vehicles Manufacturing direct loan program.
The Title XVII program, established under Title XVII of the EPAct of 2005, provides guarantees for loans made to support certain types of clean energy projects under Section 1703. The Title XVII program was modified in 2009 by the Recovery Act, which added Section 1705 of the EPAct of 2005. The Section 1705 program included an appropriation of funds that allowed the U.S. Department of Energy (DOE) to pay the credit subsidy cost of certain loan guarantees. Prior to the Recovery Act, under the Section 1703 program, the recipients of Title XVII loan guarantees were required to pay the credit subsidy cost, unless Congress appropriated funds for such costs, which it did not do until 2009. There were several solicitations in the 1705 program, each with its own specific requirements. The second major solicitation used the Financial Institution Partnership Program, under which the private market provided the debt, conducted most of the project due diligence, and handled many aspects of the loan application. The 1705 program guaranteed $13.6 billion in loans for 27 projects, of which $10.2 billion went to 14 large-scale concentrating solar power (CSP) and PV projects, and $746 million went to three solar manufacturing projects (U.S. GAO 2015).10 The 1705 program ended in 2011, but, as of the summer of 2015, LPO still had over $40 billion in remaining loan and loan guarantee authority to finance innovative clean energy projects and advanced technology vehicle manufacturing.
The Title XVII 1703 solicitations apply to a wide range of energy technologies, including solar energy and supportive technologies. Eligible projects must use a new or significantly improved technology; avoid, reduce, or sequester greenhouse gases; be located in the United States; and 10 The dollar figures from the DOE Loan Program Office refer to nominal dollars.
6 This report is available at no cost from the National Renewable Energy Laboratory (NREL) at www.nrel.gov/publications.
have a reasonable prospect of repayment. As of December 2015, LPO was accepting applications in response to the open Title XVII solicitations for $21.5 billion in guarantees, $4.5 billion of which was for the “Renewable Energy & Efficient Energy Projects Solicitation.” In August 2015, LPO issued guidance designed to facilitate the application of distributed energy projects, such as innovative distributed PV.
In addition to the DOE LPO, energy-efficiency and clean energy projects also qualify for other federal financing programs from the U.S. Department of Agriculture, Treasury Department, Department of Housing and Urban Development (HUD), Small Business Administration, Environmental Protection Agency (EPA), and Department of Transportation. These programs are meant to ease capital flows for energy-efficiency and clean energy projects.
2.2 State and Local Incentives 2.2.1 Renewable Portfolio Standards (RPS) State-level Renewable Portfolio Standard (RPS) policies are a significant driver of solar development, especially in areas with good solar resources. An RPS requires electric utilities or load-serving entities to source a percentage of their electric load from renewable generation. These targets are typically expressed as a percentage of total electricity consumption and range from approximately 2% in Iowa to 50% in California (and 100% in Hawaii). As of October 2015, 29 states, Washington DC, and Puerto Rico have mandatory RPS policies (DSIRE 2015).
An increasing number of states have adopted distributed generation (DG), solar set-aside, or credit multiplier provisions in their RPS policies to provide differential support to promising technologies that currently have higher costs. A solar set-aside stipulates that a portion of the annual renewable energy compliance requirements be fulfilled with solar electricity; DG provisions are similar except the requirement is for DG, not solar (though the majority of DG installations are solar assets). Credit multipliers give favored technologies more credit toward meeting RPS requirements than other technologies. As of March 2015, solar provisions like these have been implemented in 21 states and Washington DC (DSIRE 2015).
Although design details vary considerably, RPS policies typically rely on renewable energy certificates (RECs), upfront cash grants, performance-based incentives (PBIs), state and local tax credits, and/or feed-in tariffs to promote deployment and facilitate compliance. The strongest RPS policies incorporate noncompliance penalties, either as fines or an alternative compliance payment (ACP). An ACP requires suppliers to pay a predetermined amount per megawatt-hour (MWh) if they fall short in meeting the RPS. Local jurisdictions without strong state solar mandates (e.g., Austin, Texas) have developed solar initiatives as well.
2.2.1.1 Renewable Energy Certificates RECs are tradable, non-tangible certificates that represent proof that 1 MWh of electricity was generated from an eligible renewable energy resource. RECs are classified in many different ways, depending on the year the REC was generated, the facility location, and the type of renewable generator. Solar RECs (SRECs) are specifically generated by solar energy. These certificates can be sold, traded, or bartered, and the REC owner holds claim to the renewable attributes of the underlying energy. Utilities purchase RECs to satisfy state RPS requirements. The price of a REC will depend on the relative supply and demand of the specific vintage of

7 This report is available at no cost from the National Renewable Energy Laboratory (NREL) at www.nrel.gov/publications.
REC as well as any ACP law. Renewable facilities typically qualify for generating program-compliant RECs for a given period (e.g., 20 years). RECs can represent a significant revenue stream to a solar system, but there can be great uncertainty about the value of the credits over the system lifetime. Further, because of the bilateral nature of the transaction, certain buyers may only be interested in purchasing a large amount of RECs, making it more complicated for small sellers.
2.2.2 State Tax Credits Some states offer tax credits for installing a renewable energy system. Homeowners or businesses can deduct a portion of the system cost from their state tax bills. These amounts vary significantly by state. To claim the credit, a person or business must have a sufficient amount of tax liability to offset in that state.11
2.2.3 Grants, Rebates, or Performance-Based Incentives (PBIs) Certain renewable energy and energy-efficiency projects qualify to receive cash rebates that encourage deployment and reduce the upfront cost to the end consumer. Rebates may be available from states, municipalities, utility companies, and other non-governmental organizations that want to encourage the use of these technologies. Rebates are generally available for a limited time and/or from a limited budget.
PBIs differ from grants and rebates in that funds are distributed over time based on the performance of the system, instead of in one lump sum at the beginning of the project. PBI programs are typically administered by state clean energy funds and are funded by utilities and/or ratepayers through ACPs and system benefit charges on electric bills.
2.2.4 Subsidized Loans Subsidized loans may be made available by a state, non-governmental organization, utility company, or private entity and feature significantly reduced interest rates. Generally, subsidized loans are available only in a few areas and for a limited time. Often the low interest rates are made available by states offering credit subsidies to the lender, effectively “buying down” the interest rates.
2.2.5 Property-Assessed Clean Energy (PACE) Programs In PACE programs, municipal financing districts lend the proceeds of bonds or other funds to property owners to finance end-user renewable energy and energy-efficiency improvements. The property owners then repay these loans over 15–20 years via annual assessments on their property tax bills. One benefit of PACE programs is that the repayment obligation of the loan stays with the property and does not move with the homeowner or business.
Residential PACE programs hit a significant roadblock in mid-2010, however, when large mortgage-holding entities stated that they would not purchase mortgages with PACE loans, because PACE loans, like all other property tax assessments, are written as senior liens (i.e.,
11 Unless the credit is refundable, in which case the amount of any credit in excess of taxes owed is refunded to the taxpayer in cash. Certain states use the tax code to incentivize solar in other ways, such as prohibiting the value of renewable energy systems from being included in property taxes assessments or exempting renewable energy equipment from state sales taxes.
8 This report is available at no cost from the National Renewable Energy Laboratory (NREL) at www.nrel.gov/publications.
taxes are paid before mortgage payments, unless they are structured as subordinate loans) (DOE 2012). These issues are still being resolved, and, while it remains unknown whether or how some of the residential programs will move forward, PACE assessments remain a viable option in the commercial space. In 2015, HUD came out in support of PACE programs but stipulated that these programs should be subordinated to the mortgage (HUD 2015).
2.2.6 On-Bill Financing The goal of on-bill financing is to reduce or eliminate the upfront cost of the solar project to the customer by financing all costs (not covered through rebates, if any) with an on-bill adder. The loan payments are made over a period that is long enough—and with a low-enough interest rate—to create cost savings from day one. This mechanism has been used for energy-efficiency and renewable energy projects. As with PACE programs, the repayment obligation typically stays with the property and not the homeowner (or company).
Despite the advantages of on-bill loans, this type of financing mechanism faces implementation challenges: the need for substantial initial capital to fund the revolving loan, concern about the potential for defaults (particularly if this would result in electric service shutoff), uncertainty about how utilities will be regulated with respect to providing a loan, the potential need for state legislation to support adoption, and the need to update utility billing systems to allow for automated and electronic management of on-bill loans.
2.2.7 Net Metering and other Bill Credit Mechanisms Net-metering arrangements credit excess solar electricity sent back into the grid against the energy a consumer draws from the grid.12 Net metering is arguably not an incentive, but rather a mechanism by which customers are credited for solar energy provided to the grid.13 Debate typically centers on how much the customer should be credited for the energy and whether they should be charged standby or other fees for continuing to rely on the grid. Regardless, net-metering policies provide an economic benefit to solar generation.
Value-of-solar (VoS) tariffs are an alternative to net-metering programs. In certain jurisdictions, VoS tariffs credit customers at a calculated rate based on the “value” of the energy the solar energy system provides. The value of the energy and the method used to calculate value vary between regions and with time, so VoS tariffs are sometimes above or below associated retail rates. Feed-in-tariffs are also occasionally used in the United States, but their level is usually calculated to encourage deployment rather than to establish an accurate energy value.
12 The amount of energy credited is typically limited, to some degree, by the amount of energy consumed by the customer over a predetermined period (typically up to 120% over the course of a year, though this varies by state). 13 Net-metering credits are volumetric by nature and therefore are typically more valuable to customers with utility rate structures designed to recover revenue primarily through energy volume (e.g., residential customers), rather than rate structures that depend on revenue recovery in large part through fixed fees and demand charges (e.g., commercial and industrial customers). In other words, net-metering credits for non-residential customers are typically far below average commercial and industrial retail rates, because a large percentage of those retail rates come from demand charges and fixed fees.

9 This report is available at no cost from the National Renewable Energy Laboratory (NREL) at www.nrel.gov/publications.
2.2.8 Virtual Net Metering Under virtual net metering, utility ratepayers can receive bill credits for some or all of the generation from a qualifying renewable energy project that is not directly interconnected to their electricity meter. This policy allows ratepayers to capture the economies of scale that can accrue to larger, offsite systems compared with onsite rooftop systems sized to match onsite consumption. A virtual-net-metered system may have many potential consumers and/or buyers of the energy; likewise, consumers may have many virtual-net-metered systems from which to choose. Solar owners can sell the energy from a PV system, via a PPA, to customers located anywhere in their electricity service territory, or businesses, schools, or governments can purchase a PV system off site and still enjoy the benefits on site.

10 This report is available at no cost from the National Renewable Energy Laboratory (NREL) at www.nrel.gov/publications.
3 Historical Financing Methods and Associated Challenges
The patchwork of federal, state, and local incentives described in the previous section can provide various benefits to solar project owners. On the other hand, these incentives can be cumbersome to piece together (e.g., non-taxable state rebates reduce the basis to which the federal ITC applies) or overly complex to administer (e.g., registering and trading RECs), and they may not benefit all types of owners equally (e.g., federal and state tax credits require that project owners have sufficient tax liability to capture the full value of the credits).
This section reviews how different owners of solar projects have financed their projects as well as the challenges they have faced, illustrating the financing barriers the industry is attempting to overcome. Also provided are financial cost baselines against which to measure the level of improvement already achieved or potentially achievable in the future.
3.1 Common Tax-Equity Financing Structures This subsection introduces the three most common tax-equity financing structures used by distributed and central solar projects to capture incentives, particularly the sizable federal tax incentives, in the most efficient manner possible. These structures have a long history in non-solar sectors—such as wind energy (since the 1980s), traditional energy generation (in the 1980s), low-income housing (since the 1980s), and rail cars (in the 1950s)—and they are widely used in all three sectors of the solar market: residential, non-residential, and utility-scale. The specifics and complexity of the structures vary, with the potential for enabling various special purpose vehicles (SPVs)14 and cash-flow arrangements. In addition, the rate of return and proportion of cash and tax benefits each party receives from the structures can vary substantially.
3.1.1 Sale-Leaseback The Sale-Leaseback model involves a lessee (also known as the sponsor, which is often the project developer) and a lessor (third-party tax-equity investor). If debt is raised by the lessor to help finance the project, it is called a “leveraged lease”; otherwise it is known as a “single-investor lease.” In this model, the sponsor develops and constructs the project (or arranges for this to be done), sells the equipment or hard assets to a tax-equity investor, and then leases the project equipment back. As the sole owner (and lessor) of the project equipment, the tax-equity investor retains 100% of the project’s tax benefits and receives ongoing lease payments from the sponsor (lessee) sized to produce the tax-equity investor’s target rate of return. Meanwhile, the sponsor (lessee) operates the project, covers normal operating expenses, makes lease payments to the lessor, and receives revenue, typically from the sale of electricity at a level enabling the sponsor to meet its obligations and reach its target rate of return. Electricity is usually sold through one or more PPAs (or, in the case of distributed solar, leases) between the sponsor and electricity customers (sometimes a utility).
Although Sale-Leaseback structures can theoretically provide 100% financing to the sponsor (through the sale of the project’s hard assets), in practice the tax-equity lessor often requires 14 An SPV is usually a subsidiary company containing certain assets and liabilities, created to fulfill narrow, specific, or temporary objectives. For example, an SPV could have assets only associated with a single PV system and be structured as a partnership between two companies.
11 This report is available at no cost from the National Renewable Energy Laboratory (NREL) at www.nrel.gov/publications.
some upfront prepayment of rent, which is analogous to a sponsor capital contribution. The sponsor typically contributes 15% of the project’s installed cost as prepaid rent (White 2011, Chadbourne and Parke LLP 2011). Though exchanged up front at the start of commercial operations, this prepayment is accounted for in a proportional, deferred manner over the term of the lease. For example, over a 20-year lease, the tax-equity lessor books 1/20th or 5% of the prepayment amount as income each year, while the sponsor expenses that same amount each year. From a sponsor’s perspective, the advantage of a Sale-Leaseback is that most of the project is paid for by the tax-equity investor; the disadvantage is that the sponsor does not have long-term control of the asset, and it can be costly to buy back the system (after the tax benefits and tax recapture period).
A lease must meet certain requirements, established primarily through case law, to be considered a true or operating lease and not a capital lease or financed sale of the asset. In 2001, the IRS reiterated its views on the factors supporting treatment of a lease as a true lease.15 Among these factors are issues relating to permanence: 1) the lease term cannot be more than 80% of the life of an asset; 2) the owner must have a claim for the residual value of the asset; and 3) the lessor must have the ability to offer the services of the asset to someone else other than the lessee at the end of the lease. If it does not pass these tests, the leasing of the asset could be treated as a sale of the asset to the lessee, and thus the tax-equity investor could not claim the tax credits.
While the Sale-Leaseback transaction is arguably the simplest of the three structures discussed here, it still requires education about procedures, significant legal and accounting work, and the ability of a tax-equity investor to use the tax credit and accelerated depreciation. Therefore, it only makes financial sense for certain companies or individuals to participate in these transactions, which limits the number of investors and allows tax-equity investors to charge high rates.
3.1.2 Inverted Lease (Lease Pass-Through) In an Inverted Lease, the roles of the sponsor and tax-equity investor are “inverted” in relation to a Sale-Leaseback transaction: the sponsor acts as the lessor, while the tax-equity investor acts as the lessee. This structure is also known as a “lease pass-through,” because the sponsor/lessor elects to pass through the ITC to the tax-equity investor/lessee, who also receives revenue from electricity sales.16 The ITC is calculated based on the appraised value of the system rather than its cost, because there is no project sale to establish a cost basis. Thus, the ITC in an Inverted Lease structure could be larger than in other tax-equity structures if, for example, the developer’s costs are below industry norms (i.e. the appraised value is higher than the developer’s costs).
The sponsor receives lease payments from the tax-equity investor (sometimes in the form of a prepaid lump sum to help capitalize the project) and can deduct the cost basis of the system (with no basis reduction from the ITC) using 5-year MACRS. At the end of the lease, the sponsor owns the project in full, without having to purchase the project back from the tax-equity investor. 15 Revenue Procedure 2001-28: Leveraged Leases 2001, “Rev. Proc. 2001-28, 2001-1 CB 1156, 5/07/2001, IRC Sec(s). 167,” http://www.novoco.com/energy/resource_files/irs_guidance/rulings/proc_01-28.pdf. 16 As mentioned above, when the owner claims the ITC, its depreciation basis is reduced by 50% of the credit. Because the lessee claims the ITC in this transaction, but not the depreciation, it must also effectively make that same adjustment by incurring income (and any associated tax expense from that income) equal to 50% of the ITC over the 5-year length of the ITC vesting period.

12 This report is available at no cost from the National Renewable Energy Laboratory (NREL) at www.nrel.gov/publications.
Like the Sale-Leaseback transaction, the Inverted Lease is a complicated structure that requires significant education about procedures as well as extensive legal and accounting work. While the tax-equity investment represents a smaller portion of the total capital stack (because the tax-equity investor is only using the tax credit, not the accelerated depreciation), the tax-equity investor still requires significant tax liability to use the full credit. Additionally, the transaction still must be large enough so the fixed transaction costs do not overwhelm the return. In contrast with the Sale-Leaseback structure, the sponsor is responsible for using the accelerated depreciation.17 In some instances, sponsors are willing to use this structure without the ability to use accelerated depreciation fully (or at least not immediately—depreciation deductions can be carried forward, though at a lower present value), because they may be unable to finance the project otherwise. For these reasons, only certain companies or individuals choose to participate in these transactions, which limits the number of investors and allows tax-equity investors to charge high rates.
3.1.3 Partnership Flip Like the Sale-Leaseback model, a Partnership Flip involves a sponsor and a tax-equity investor, but it does not involve a clean sale of the project from the sponsor to the tax-equity investor, with each having clearly defined roles and responsibilities as lessee and lessor, respectively. Instead, under a Partnership Flip, the sponsor and tax-equity investor partner to finance and own the project and share in its risks and rewards.
The rewards include distributable cash as well as tax losses and credits (i.e., tax benefits). Distributable cash is the revenue earned from selling energy (and capacity and RECs) through a PPA, less operating expenses. Tax losses stem from accelerated tax depreciation, while tax credits are from the ITC (or, for a certain period, the Section 1603 cash grant, even though it is not technically a tax credit).
Figure 1 is a schematic of a Partnership Flip involving the ITC and so-called “back leverage”—i.e., debt at the sponsor rather than project level. Distributable cash, income (or losses resulting from depreciation), and tax credits are allocated in two stages (though transactions can be structured to have more stages). Initially, the tax-equity investor receives a majority of cash and income during a predefined period (e.g., the first five years of a project) or receives a targeted rate of return. After this point, the project allocations “flip” so that the sponsor receives most distributions and income.
Per the safe harbor guidance provided by the IRS in Revenue Procedure 2007-65, the sponsor must maintain at least a 1% interest in all losses and credits over the life of the partnership. Thus, in Figure 1, prior to the flip, the sponsor is allocated 1% of the project’s tax benefits, with the other 99% allocated to the tax-equity investor. After the return-based flip, as much as 95% of taxable income (because both losses and credits will likely have been exhausted by this time) is allocated to the sponsor (90% is assumed in Figure 1). After the flip, the sponsor also often has the right to buy out the tax-equity investor’s interest in the project, typically at a favorable price given the tax-equity investor’s greatly reduced interest in the project post-flip.
17 It is possible for tax-equity investors to claim a portion of the MACRS depreciation if they are minority investors in an SPV with the sponsor equity.

13 This report is available at no cost from the National Renewable Energy Laboratory (NREL) at www.nrel.gov/publications.
Figure 1. Schematic of the Partnership Flip structure (with back leverage)
The single slash in the shaded boxes indicating the allocation of distributable cash signifies the end of the sponsor’s initial investment-recovery period, while the double slash in those same boxes, as well as in shaded boxes indicating the allocation of taxable losses and gains, represents the return-based flip in allocations.
Figure adapted from Bolinger, Harper, and Karcher 2009.
Tax-Equity Investor (~60% of equity)
Project Sponsor (~40% of equity)
Project Company (100% equity)
Power (and REC) Sales
Cash Revenue Investment Tax Credit (ITC)
less Operating Expenses
less Tax-Deductible Expenses (including depreciation)
equals Taxable Losses/Gains
equals Distributable Cash
99%
99% // 10% 1% // 90%
100% / 0% // 90% 0% / 100% // 10%
1%
Lender (Back Leverage)

14 This report is available at no cost from the National Renewable Energy Laboratory (NREL) at www.nrel.gov/publications.
Investments in partnerships are much more complicated to track than investments in corporations. A partner’s investment in a partnership is tracked through two accounts. The first is the capital account, which represents the partner’s share of the equity contributed to the partnership. The second account calculates a partner’s outside basis, or the amount of a partner’s investment in his or her interest in the partnership.18 This amount determines how much gain (or loss) the partner would incur upon a sale of that interest. These rules are particularly relevant to solar projects because of their use of the 5-year accelerated depreciation schedule and the potential use of debt, which can cause significant losses and low capital account and outside basis amounts in the first several years of a project.
If a partnership incurs an operating loss, partners who are individuals or closely-held corporations are subject to certain loss limitation rules in the federal tax code that can prevent these investors from fully using this loss:
• Capital basis Limitation: A partner cannot claim a loss to the extent it exceeds the amount in the partner’s capital account. When the capital account is reduced to zero, it means that, for tax purposes, the partner has no capital invested in the partnership. The federal tax code’s partnership rules do not allow a partner to claim losses beyond the partner’s equity investment in the partnership.19
• At-risk Limitation: Assuming the basis is greater than zero, the partner’s capital must be at risk or the loss cannot be claimed. Capital may not be at risk if there are, for example, non-recourse loans or loan guarantees that protect the investor’s capital. Like the capital basis limitation, this rule is designed so a partner cannot receive benefits without risk in its investment. If the only capital at risk, for tax purposes, is nonrecourse debt (in which the debt is secured only by the project, not by the partners), then the partners are not entitled to benefit from the losses.
• Passive Loss Limitation: Passive activity losses can only be offset by passive activity income. Passive activity is characterized as a partner who does not materially participate in the business. Other examples of passive income include rental income or investment income. Passive losses cannot be deducted from a partner’s earned income, such as a salary. To the extent passive activity income exceeds passive activities losses in a particular year, the excess loss is carried forward to future years.
18 A partner’s capital account begins as the sum of the cash and the market value of any property contributed by the partner to the partnership. A partner’s outside basis begins as the sum of the cash and the partner’s tax basis in property contributed by the partner to the partnership. If a partner purchases his or her interest in the partnership from another person, outside basis starts as the amount paid by the partner for that interest. Both amounts then increase by the amount of partnership income allocated to the partner and decrease by the amount of cash distributed and losses allocated to the partner. If the partnership has nonrecourse debt, then the partner’s share of this debt is added to his or her outside basis, and the partner’s share of any repayment of that debt is subtracted from his or her outside basis. Partnership-level nonrecourse debt does not affect the partners’ capital accounts. 19 However, there is an exception to this rule to the extent the losses are funded with nonrecourse debt allocated to the partner. This rule allows a partner to take deductions for losses funded with the partner’s share of nonrecourse debt (e.g., nonrecourse debt is used to purchase property that generates depreciation deductions) even if those losses exceed at some point the amount in the partner’s capital account (this amount is referred to as minimum gain). In return, as that debt is repaid, the partner is required to recognize gain equal to his or her share of the repaid debt (this amount is referred to as minimum gains chargeback income). The minimum gains chargeback income partially offsets the advantage of taking the depreciation expense.
15 This report is available at no cost from the National Renewable Energy Laboratory (NREL) at www.nrel.gov/publications.
The loss limitations are designed to prevent investors from using losses from investments, in which they are passive or in which they have no risk, to offset income from other activities. These rules apply to tax credits as well. Owing to these loss limitation rules, it would be difficult for an individual or closely held corporate partner in a partnership to benefit from the accelerated depreciation and ITC without significant loss of the time value of these benefits.20 For these reasons, only certain companies or individuals can participate in these transactions, which limits the number of investors and allows tax-equity investors to charge high rates.
3.2 Historical Financing Methods in the Central or Utility-Scale PV Market
Although definitions vary, central or utility-scale solar projects are often defined as large (e.g., > 5 MW) ground-mounted projects that sell electricity directly to offtakers such as utilities or corporate purchasers, rather than being used to reduce onsite load. Utility-scale solar includes PV and CSP projects, though this section focuses primarily on utility-scale PV projects, given their current dominance in the market (most of the financing issues discussed will, however, be similar for CSP).
As of the end of 2014, the utility-scale PV market represented 53% of the cumulative installed PV capacity in the United States, with investments of approximately $29 billion in the last eight years ($12 billion in 2014 alone) (SEIA and GTM Research 2015a; Bolinger and Seel 2015).21 Its market-leading position (a distinction first achieved in 2012) belies its relative youth: the first utility-scale PV project larger than 5 MW was built in 2007, and roughly 70% of the cumulative installed utility-scale PV capacity online at the end of 2014 achieved commercial operation in either 2013 or 2014 (Bolinger and Seel 2015). Individual utility-scale PV projects range in size from 5 MW (or less, depending on how utility-scale is defined) to more than 500 MW to date. Roughly half of the cumulative capacity installed through 2014 employs single-axis solar tracking, rather than being mounted at a fixed tilt.
At the end of 2014, the United States had installed 1.7 GW of CSP (SEIA and GTM Research 2015a), with investments of approximately $7 billion in the last eight years ($5 billion in 2014 alone) (Bolinger and Seel 2015). A significant amount of CSP capacity was installed in California in the 1980s, and then the industry remained relatively inactive until 2007. To date, individual projects range in size from 5 MW to 377 MW. Historically most CSP projects have employed oil-trough technology without thermal storage, but several U.S. projects have recently been built using power-tower and/or thermal storage technologies.
20 Another complication with a partner in a partnership using the ITC is that, if it sells its interest in the partnership during the first five years after a project is put in service, it will have a partial recapture of the ITC claimed on the project. 21 Throughout this report, dollar values refer to 2015 U.S. dollars unless otherwise stated, using the Bureau of Labor Statistics’ “Consumer Price Index: All Urban Consumers.”
16 This report is available at no cost from the National Renewable Energy Laboratory (NREL) at www.nrel.gov/publications.
3.2.1 Independent Power Producer Ownership Before 1978, most electricity generating plants (primarily fossil, hydro, or nuclear at the time) were utility scale and owned and operated by utilities, who sold the electricity to their customers at established retail rates. The Public Utility Regulatory Policies Act (PURPA) in 1978, however, gave rise to a new type of company that develops, finances, constructs, owns, and operates wholesale power projects, most often selling the electricity generated on a wholesale basis to utilities (which, under PURPA, were required to buy the power). These “independent power producers” (IPPs) were less risk averse than the typical utility, which is protected as a monopoly, and over the years became significant players in the development of new utility-scale renewable energy technologies like wind and solar power.
In the 1980s, many of the initial IPP generation projects were financed using Sale-Leaseback transactions, with relatively small companies developing various generation technologies including wood-fired, coal-fired, and combined-cycle gas turbine (CCGT) plants as well as wind, solar, and other renewables. Various tax incentives were available for traditional and renewable generation assets, and some states—including California, New York, Massachusetts, Maine, and New Jersey—attempted to encourage renewable and alternative energy generation by requiring utilities to sign long-term contracts with IPPs.22
Starting in 1992, with the EPAct of 1992 amending PURPA, states began creating wholesale energy trading mechanisms; additionally, many of the tax incentives previously available expired. The building blocks behind the Sale-Leaseback transactions in the 1980s—the fixed contracts and tax incentives—were no longer available. Without these building blocks, many of the power generation technologies became uneconomical, and small development companies that had partnered with bigger players to finance projects were replaced by larger companies (e.g., AES, Calpine, Enron, and Tenaska) that could finance projects themselves. These companies signed merchant contracts for traditional generation assets, such as natural gas plants, building the lowest-cost systems in markets and relying on marginal pricing from the new wholesale markets to recoup their investments. Because of its high price (until recently), development in renewable energy only returned with the extension of the tax credits and the willingness of utilities to sign long-term contracts (at first driven by RPS requirements).
Today, the vast majority of utility-scale PV (and wind) projects in the United States are owned by IPPs that sell the renewable electricity to utilities through long-term PPAs. Some of these IPPs—like sPower and SunEdison—are independent and/or often lack sufficient tax capacity to make efficient use of solar’s tax benefits; thus these IPPs must seek third-party tax-equity investors to monetize the tax benefits, typically through one of the three financing structures described in Section 3.1. Other IPPs—like NextEra Energy Resources and BHE Renewables—are unregulated subsidiaries of utilities and can potentially draw upon the tax capacity of their parent companies to exploit solar’s tax benefits without bringing in third-party tax equity; these IPPs typically seek debt financing from banks or other institutions, rather than tax equity.
22 These tax incentives included a 10% federal business energy tax credit (changed to 15% for some technologies for a period), which was additive to the federal ITC of 10% established in 1962. Accelerated depreciation was also introduced in the 1980s, and California had tax credits for wind and solar projects.

17 This report is available at no cost from the National Renewable Energy Laboratory (NREL) at www.nrel.gov/publications.
In either case, IPPs typically finance projects through “project finance,” where the investment is secured solely by the specific project’s underlying assets and PPA, with no recourse to any of the IPPs’ other assets. This contrasts with “corporate finance,” where a company raises debt and/or equity against its full balance sheet, rather than just a specific project.23
3.2.1.1 Historical Challenges to IPP Ownership of Utility-Scale PV Projects Although project finance has advantages (e.g., the degree of leverage is limited only by what the project can support and so can be high), a number of aspects of solar project finance render it suboptimal. For example, the amount of leverage a solar project can support is restricted by the significant tax benefits the project receives. Tax credits and depreciation deductions both boost investor returns (on an after-tax basis, which is how investments in renewable energy projects are most commonly viewed) but—as non-cash benefits—are not useful for servicing debt. As a result, a typical utility-scale PV project can support only about 40% leverage under the 30% ITC (compared to around 60% debt under a 10% ITC) (Bolinger 2014).
Moreover, if third-party tax-equity investors are involved, they will most likely prohibit the project from seeking debt financing in the first place owing to the risk of foreclosure (and hence potential recapture of the tax benefits) should the project default on its debt. The tax-equity investor will often allow the IPP to borrow against its equity stake in the project (through so-called back leverage), but project-level debt is not typically allowed.24
This leaves many solar projects financed by some combination of tax equity and IPP sponsor equity (perhaps back-levered). Because the availability of tax equity is limited, its cost is high: since 2008 tax equity has been more than twice as expensive as the debt that it often supplants from the capital stack.25 This combination of expensive tax equity and restrictions on the use of debt artificially inflates the WACC facing a typical utility-scale PV project.
3.2.2 Utility Ownership A much less common alternative to IPP ownership is for the utility offtaker to own the project itself. The utility finances the project through retained cash on hand (depending on the project size) or by issuing some combination of equity and/or debt against its balance sheet.26 Regulated utilities will be permitted to earn a regulated return on investment in the project, and most utilities also have sufficient tax liability to absorb the federal tax benefits provided to solar projects. Compared to project finance, this form of utility corporate finance generally results in a relatively low WACC, calling into question why utility ownership of solar projects is so rare.
23 Some IPPs do not have strong enough balance sheets to engage in corporate finance. 24 Fortunately for IPPs, the cost of back-levered debt has dropped significantly in the past year as the market is flush with liquidity, and it is now priced at similar levels to project-level debt (even though back-levered debt is effectively unsecured), as low as 165 basis points over LIBOR (Chaudhry 2015). 25 That said, tax equity provides a service that debt does not: the monetization of tax credits and losses. 26 Utility debt often takes the form of low-cost corporate bonds. Utility regulators and utilities typically target an overall debt/equity ratio around 50%/50%.

18 This report is available at no cost from the National Renewable Energy Laboratory (NREL) at www.nrel.gov/publications.
3.2.2.1 Historical Challenges to Utility Ownership of Utility-Scale PV Projects Among the challenges to utility ownership, some utilities are simply prohibited from owning generating plants. As part of the restructuring of electricity markets that took place around the turn of this century, utilities in some states were required to sell their generating assets and become “wires only” companies focusing on delivering energy (and other services). Although some states have since allowed utilities to get back into the generation business in limited instances, the regulatory framework is not de facto conducive to utility ownership (which is why many utilities own generation projects only through unregulated subsidiaries).
Second, although most utilities have sufficient tax liability to absorb depreciation deductions and tax credits fully in the years they are earned, “normalization” accounting requirements diminish the upfront stimulus of these tax benefits by requiring the utility to account for them over the life of the project. Without being able to realize the full value of these tax benefits up front, many utilities find that solar’s LCOE under utility ownership is higher than the PPA prices they are being offered by IPPs (who are not bound by normalization rules). As such, utility ownership is hard to justify to regulators and ratepayer advocates, who prefer to see generation supply subjected to rigorous competition rather than ceded to a monopoly utility.
For example, Pacific Gas & Electric (PG&E), which is one of the largest utility owners of solar capacity in the United States, initially went down the ownership path in 2008, in response to the “seller’s market” for PPAs that existed in California at that time as well as the shortage (and high price) of third-party tax equity in the wake of the financial crisis. Utility ownership addressed both issues, enabling PG&E to add solar in a competitive manner, particularly given its internal tax capacity. Once the tax-equity market bounced back and the seller’s market shifted to more of a buyer’s market, however, PG&E found it harder to compete with PPAs—primarily owing to the normalization requirement—and made a conscious decision to focus on PPAs for the time being (Patterson and Burns, pers. comm.).
3.3 Historical Financing Methods in the Residential Market As of the end of 2014, the residential PV market represented 19% of cumulatively installed PV capacity in the United States, with investments of approximately $18 billion in the last 10 years ($5.4 billion in 2014 alone) (SEIA and GTM Research 2015a; Barbose and Darghouth 2015). The median reported U.S. residential system had a capacity of 6.1 kW in 2014 and cost approximately $26,000—which is 40% less than the $44,000 a similarly sized system would have cost in 2010 (Barbose and Darghouth 2015).27 Because residential systems are typically smaller than non-residential or utility-scale PV systems, they do not benefit from the same economies of scale and thus are more expensive per unit of capacity (though not in terms of total expenditures). For this reason, residential PV systems must either receive additional benefits or receive a higher value for the energy they produce to achieve the same returns.
Most residential systems rely on the electricity grid (rather than a battery) to manage the mismatch between their building’s load profile and their PV system’s generation profile, using net metering to compensate them for electricity fed back into the grid. Net metering limits the size of a residential PV system by the amount of electricity a customer uses in a year; however, 27 The median system size in 2010 was smaller than in 2014; therefore, the median-priced system in 2010 was $37,000.

19 This report is available at no cost from the National Renewable Energy Laboratory (NREL) at www.nrel.gov/publications.
all of the electricity produced by the PV system is typically credited at retail rates (which are typically higher in the residential sector than in the commercial or industrial sectors). Residential retail rates vary across the country, however, and residential PV systems have received different types and levels of incentive support across different U.S. jurisdictions. For these reasons, PV penetration has occurred at different rates across the country. At the end of 2014, six states (California, Arizona, Hawaii, New Jersey, New York, and Colorado) accounted for 80% of the cumulative residential PV capacity (SEIA and GTM Research 2015a).
3.3.1 Host Ownership In 2014, approximately 28% of new residential PV systems were customer owned. Ironically, this is down from approximately 58% in 2011 and nearly 100% in 2006 when system prices were much higher, and thus there was more of a need for a third party to fund the upfront costs (GTM Research 2015a). Customer-owned systems can be purchased using available household savings or financed through a loan. Owing to the limitations of solar loan products, historically most customer-owned systems have been cash purchased. While it is difficult to determine how a customer evaluates the financial cost of using household savings to purchase a PV system—and this perceived cost likely varies considerably—a 2013 study found that “a majority of PV adopters report using payback period as the key financial metric they employ in judging the financial attractiveness of investing in PV… across a range of scenarios, the discount rate for buyers varies between 3 - 17%” (Sigrin 2013). If a customer does not have the ability or desire to purchase a system in cash, there historically have been a few loan options, such as home-equity loans or lines of credit, PACE programs, federal PowerSaver loans, and state- or utility-sponsored loan funds.
3.3.1.1 Home-Equity Loan or Line of Credit Homeowners can receive funds from a bank to finance a PV purchase by using home equity as collateral, either as a home-equity loan or a home-equity line of credit (HELOC)—in second or third position to the original mortgage. A HELOC has a “draw period” in which a certain amount of funds may be drawn down, and the customer is charged interest only during that period (typically at a floating rate, based on the prime rate28 plus a set premium). Banks usually prefer a certain amount of funds be drawn down immediately. After the draw period (approximately 10 years), no further funds may be drawn down, and the loan converts to a fully amortized loan with associated principal and interest payments. In contrast, a home-equity loan is structured much like a mortgage, with a fixed amount of money borrowed and fixed loan payments (interest and principal) associated with the loan. Fixed rates are usually higher than floating rates, but there is more certainty as to the future level of payments. In October 2015, the average home-equity loan rate was 6.3%, while the average HELOC interest rate was 5.2%.29
28 The lowest rate of interest at which money may be borrowed commercially. This rate changes over time. 29 “HSH National Interest Rate Benchmarks for Week Ending 10/16/2015,” HSH.com, http://www.hsh.com/ statrel.html, accessed October 22, 2015.

20 This report is available at no cost from the National Renewable Energy Laboratory (NREL) at www.nrel.gov/publications.
There are fees and costs incurred to set up a loan or line of credit. Because there is a secondary market for mortgages, a customer’s local bank is not necessarily the mortgage holder, and thus a new process must be performed to determine the level of risk. There are reporting fees to the county, document preparation, notary fees, a property appraisal to determine home equity, and use of a title company to identify outstanding liens. Typical closing costs are 1%–2% of the loan amount. The process can be relatively painless if the customer has good credit and a job. Banks look at debt relative to income, though some have also started incorporating energy costs to account for the fact that money loaned for a PV system (or energy-efficiency upgrade) may increase debt but lower monthly expenses.
3.3.1.2 PowerSaver Loans HUD launched the PowerSaver program in 2011 to facilitate loan products for home energy retrofits, including PV installations. The Federal Housing Administration (FHA), a part of HUD, operates the 203(k) loan program, which enables potential or current homeowners wishing to purchase or refinance an existing home to include up to $35,000 into their mortgage to repair, improve, or upgrade their home, including the cost to install solar energy equipment. The interest rates are typically lower than a homeowner would get in the marketplace for a “rehabilitation loan,” FHA provides insurance to the borrower against homeowner default, and this type of financing avoids conflicts of interest between solar financiers and mortgage holders, because the mortgage holder effectively has the security interest in the asset.
A second type of PowerSaver loans are the Title I Home and Property Improvement Loans, which can be either unsecured or as a second mortgage (and can be used in conjunction with the 203(k) loans). The unsecured Title I loans allow borrowers to take out up to $7,500 in unsecured loans with no lien on the property and no home appraisal. Borrowers must qualify to participate, with good credit and manageable debt. Borrowers may also structure the Title I loans as a second mortgage (or first mortgage if there is no existing mortgage on the home), borrowing up to $25,000. Loans under the PowerSaver program typically have more paperwork and take longer than an average loan, but they provide homeowners the ability to access low-interest loans for solar projects.
3.3.1.3 PACE Programs Under PACE programs (see Section 2.2.5), 100% of a PV system’s value can be financed, and the loan is tied to the property rather than to the homeowner.30 Currently, residential PACE programs are offered in five states, supporting energy-efficiency (67%), renewable energy (19%), and mixed (14%) projects.31 Financing costs for PACE loans vary by the ability of the municipality to raise low-cost bonds and by the amount of community support. Table 1 shows select PACE rates.
30 Some within the solar industry have argued that the interest portion of PACE loans—like with mortgage payments—and the principal portion of PACE loans—like with certain types of home repairs (U.S. Department of the Treasury 2015)—are tax deductible. There is no consensus, however, within the industry as to whether one or both are tax deductible, and much of the debate is focused on how solar equipment is classified (e.g., real or personal property; home improvement or repair). PACE participants should consult with a tax advisor for their particular circumstances on whether the interest and principal portions of their loan are tax deductible. 31 “PACE Data,” PACE Nation, http://www.pacenation.us/pace-data/, accessed October 30, 2015.

21 This report is available at no cost from the National Renewable Energy Laboratory (NREL) at www.nrel.gov/publications.
Table 1. Select PACE Programs and Associated Interest Rates
Program Interest Rate
mPOWER, CA 6%
Ann Arbor’s PACE Program, MI 5%
Southwest Regional Development Commission, MN
4% minimum (1.5% origination fee)
Missouri Clean Energy District Program, MO 6.5% - 6.75%
Toledo-Lucas County Port Authority/Better Buildings Challenge, OH 5% - 6%
Source: “PACE Data,” PACE Nation, pacenation.us/pace-data/, accessed October 30, 2015
States, municipalities, and utilities have also developed other loan programs to help fund residential PV installations—34 states had at least one loan program as of September 2015 (DSIRE 2015). However, in general these loan products have not been widely available and have received limited funding. Other solar-specific loan products have since been developed in the private sector (see Section 4).
3.3.1.4 Historical Challenges to Host Ownership of a Residential PV System Funding residential PV deployment through direct cash purchase or the loans described above has helped deploy more than 1 GW of PV systems, but challenges to these methods inhibit the growth rate and potentially increase the cost. Residential PV historically has a high upfront cost, which significantly limits the pool of customers with that amount of cash on hand. Loans also have presented difficulties. Home-equity loans or lines of credit depend on home equity, which dropped significantly during the mortgage crisis beginning in 2007. Government- or utility-sponsored loans have also been limited across the United States. PACE loans are written as senior liens, and mortgage holders have not wanted to subordinate their loans to support this approach. In mid-2010, Fannie Mae and Freddie Mac, which underwrite a significant portion of home mortgages, determined they would not purchase mortgages with PACE loans because of the additional risks32; these issues are still being resolved.
Even if a customer can access financing for an economically attractive PV system, it can prove challenging to fully realize the benefits. First, because of the various state and federal incentives, local laws, and the lack of information regarding PV systems, it can be complicated to buy a system, operate it, and receive value for the state and federal benefits (e.g., trading RECs).
Another consideration affecting individuals is the need for tax liability to take advantage of the Section 25D ITC. Though the benefits can be carried forward to later years, their worth in later years diminishes due to the time value of money. The median-priced system for residential PV in 32 In 2010, the Federal Housing Finance Agency (FHFA), which regulates Fannie Mae, Freddie Mac, and the 12 Federal Home Loan Banks, issued a statement determining that PACE loans “present significant safety and soundness concerns” and called for a halt in PACE programs for these concerns to be addressed (“FHFA Statement on Certain Energy Retrofit Loan Programs, ” Federal Housing Finance Agency, http://www.fhfa.gov/Media/ PublicAffairs/Pages/FHFA-Statement-on-Certain-Energy-Retrofit-Loan-Programs.aspx, July 6, 2010). Certain PACE programs are attempting to solve the problem by setting up programs as second-tier liens, preserving the payment priority of the first mortgage holder.

22 This report is available at no cost from the National Renewable Energy Laboratory (NREL) at www.nrel.gov/publications.
2014 provided a tax credit of $7,900 to a homeowner, which is down from a similarly sized system in 2010 ($13,200). According to data from the Congressional Budget Office (CBO 2013), 40%–60% of U.S. households pay less than $7,900 in taxes per year, meaning they could not fully use the tax credit in year one.33
The value a host-owned PV system adds to a house represents an additional complication. Because the average homeowner expects to stay in a home for less than half the useful life of a PV system, the assessed value of a PV system can be a central portion of the return on investment (Emrath 2013).34 Historically, home appraisers have not had the information or training to value PV benefits properly, potentially limiting the premium in resale value.
Finally, because most homeowners do not consume all their PV energy when it is generated, they depend on net-metering regulations to realize the full energy benefits. As of September 2014, a little more than half of states with net-metering policies limit the amount of capacity that can net meter energy, and several states without these limits have triggers that, when reached, enable net metering to be reviewed (Heeter, Gelman, and Bird 2014). If these net-metering caps are not raised, and systems continue to rely on net metering to monetize a portion of the energy produced, growth in the residential PV market may be limited.
3.3.2 Third-Party Ownership (TPO) The third-party ownership (TPO) business model attempts to solve many of the challenges associated with host ownership, namely:
• A large upfront investment of capital
• Sufficient expected tax liability to use a solar system’s tax benefits
• Knowledge of local and state permitting and incentive programs (owing to the fractured nature of U.S. electric industry and PV incentive programs), including potentially selling the associated environmental attributes
• Operating and maintaining a PV system, including the potential cost of repairing or replacing equipment such as an inverter
• An understanding of the potential risks and uncertainties associated with long-term ownership of a relatively new asset class.
Under this arrangement, a third-party entity purchases, owns, and operates the PV system on a homeowner or business’s roof or property. In exchange, the homeowner or business signs a long-term contract (e. g., 15–25 years) to lease the system or purchase the electricity generated by the system under a PPA, typically at a rate less than the price of retail electricity rates.
33 There is a positive correlation between household income and the percent likelihood of home ownership. Therefore, while the lower quintiles may not pay enough in federal taxes to use a 30% ITC in year one, they are also less likely to own their own home and therefore be in a position to install a PV system on the roof (Segal and Sullivan 1998). 34A TPO PV system would not be assessed any value to a home, because the homeowner does not own the system.
23 This report is available at no cost from the National Renewable Energy Laboratory (NREL) at www.nrel.gov/publications.
While solar leases and PPAs are used interchangeably, there can be differences between the two that affect financing. With a solar lease, a customer agrees to pay a fixed lease payment in exchange for the right to use all of the power produced by the PV system. With a PPA, the customer agrees to buy the power generated by the system at a set price per kilowatt-hour. Monthly payments for both options are likely to be very similar, but a lease payment provides more cash flow certainty to the system owner than a generation-dependent fee under a PPA, while a PPA provides more upside opportunity if the system produces more than expected. Most project finance investors are conservative and so prefer cash flow certainty to upside potential; thus the lease is usually preferable for the financier. That said, many lease contracts have provisions that guarantee customers a minimum amount of electricity production, so in practice the two contracts are often essentially the same.
The homeowner or business benefits from onsite PV generation at or below electric utility costs but without the upfront outlay of capital or any complications associated with operating a system. This model has gained significant market share in many U.S. states, with TPO systems constituting approximately 72% of the residential PV market installed in 2014 (GTM Research 2015a).
A limited number of project sponsors have been able to use tax benefits associated with PV system ownership efficiently by shielding taxable income from other projects or business ventures. However, most residential PV project developers historically have been non- or modest-income generating companies owing to growth strategies or chosen business models. For example, Sunrun, Vivint Solar, and SolarCity—which accounted for 58% of the residential PV market in 2014—had combined net losses of around $1 billion in 2013–2014 (Table 2).35
35 The figures in Table 2 represent net losses as calculated by generally accepted accounting principles (GAAP) accounting, not tax accounting.

24 This report is available at no cost from the National Renewable Energy Laboratory (NREL) at www.nrel.gov/publications.
Table 2. Total Revenue, Net Income, and Residential Deployment of Sunrun, Vivint Solar, and SolarCity
2010 2011 2012 2013 2014 Sunrun Total revenue (millions) $55 $199 Net income (loss) (millions) ($69) ($163) Deployment (MW) 80 130 Vivint Solar Total revenue (millions) $0 $6 $25 Net income (loss) (millions) ($17) ($56) ($166) Deployment (MW) 14 58 155 SolarCity Total revenue (millions) $32 $60 $127 $164 $255 Net income (loss) (millions) ($47) ($74) ($114) ($152) ($375) Deployment (MW) 31 72 157 280 502
All dollars in this table are quoted in nominal terms.
Source: SolarCity 2015a, Sunrun 2015, Vivint Solar 2015, Form 10-K
While companies have, in limited circumstances, chosen to carry forward excess tax benefits to future years until they can eventually be absorbed, this strategy sacrifices some of the incentives’ value, owing to the time value of money. Most residential project developers, therefore, have used one or more of the tax-equity financing structures described in Section 3.1 to partner with a third-party tax-equity investor that can efficiently use the project’s tax benefits and invests in the project in exchange for being allocated most or all its associated tax benefits.
The financial cost to a project of receiving funding through a tax-equity structure varies considerably depending on the cost of capital of the sponsor and tax-equity investor as well as the effort necessary to structure a deal.36 Sometimes the sponsor can obtain a loan to fund a portion of its equity investment, using its interest in the project as collateral; this is sometimes referred to as “back leverage” because the loan is at the corporate level of the sponsor, not at the project SPV level. Tax-equity investors will often not participate in a transaction with project-level debt, or they will charge a much higher rate of return (“a few hundred basis points” [Martin 2015b]), because the debt would be in a more senior position to receive the cash flows of the project. Based on market data collected in Table 3, typical financing arrangements have an after-tax financial cost of 7%–14%.
36 The structuring fees and the time to finalize an agreement between a solar developer and a tax-equity investor decline dramatically with each subsequent deal between parties, because the documentation will take less time to negotiate, and practices will be better known and standardized.

25 This report is available at no cost from the National Renewable Energy Laboratory (NREL) at www.nrel.gov/publications.
Table 3. Typical After-Tax Return for Third-Party Financial Structure, Distributed PV
Low Cost Medium Cost High Cost Structure After-Tax Return % of Project After-Tax Return % of Project After-Tax Return % of Project
Tax equity 9.0%A 40%B 9.5% 50% 10.0% 60% Project sponsor 5.5%C 60% 6.9% 50% 20.0% 40% Inputs for sponsor WACC
Sponsor equity 10.0%D 29% 15.0% 29% 20.0%E 100%
Sponsor debt -back leverage (mezzanine debt) 5.72%F 71% 5.72% 71%
Swap rate for debt 2.22%G 2.22%
Spread for debt 3.50%H 3.50%
Tax ratei 35% 35%
Total project 6.9%C 100% 8.2% 100% 14.0% 100% a “After-tax yields, we are seeing 8%, 9% or 10% for a[n] unlevered structure” (Martin 2015a). “When you get to distributed solar…the spread [is] 100 basis points higher” (Martin 2015b).
b “The tax equity raised in a solar deal is usually about 40% to 50% of total capital” (Martin 2015a).
c W𝑒𝑒𝑒𝑒𝑒𝑒ℎ𝑡𝑡𝑒𝑒𝑡𝑡 𝐴𝐴𝐴𝐴𝑒𝑒𝐴𝐴𝐴𝐴𝑒𝑒𝑒𝑒 𝐶𝐶𝐶𝐶𝐶𝐶𝑡𝑡 𝐶𝐶𝑜𝑜 𝐶𝐶𝐴𝐴𝐶𝐶𝑒𝑒𝑡𝑡𝐴𝐴𝐶𝐶 (𝑊𝑊𝐴𝐴𝐶𝐶𝐶𝐶) = 𝐸𝐸𝐸𝐸𝐸𝐸𝐸𝐸𝐸𝐸𝐸𝐸𝐷𝐷𝐷𝐷𝐷𝐷𝐸𝐸+𝐸𝐸𝐸𝐸𝐸𝐸𝐸𝐸𝐸𝐸𝐸𝐸
× 𝐶𝐶𝐶𝐶𝐶𝐶𝑡𝑡 𝐶𝐶𝑜𝑜 𝐸𝐸𝐸𝐸𝐸𝐸𝑒𝑒𝑡𝑡𝐸𝐸 + 𝐷𝐷𝐷𝐷𝐷𝐷𝐸𝐸𝐷𝐷𝐷𝐷𝐷𝐷𝐸𝐸+𝐸𝐸𝐸𝐸𝐸𝐸𝐸𝐸𝐸𝐸𝐸𝐸
× 𝐶𝐶𝐶𝐶𝐶𝐶𝑡𝑡 𝐶𝐶𝑜𝑜 𝐷𝐷𝑒𝑒𝐷𝐷𝑡𝑡 × (1 − 𝑡𝑡𝐴𝐴𝑡𝑡 𝐴𝐴𝐴𝐴𝑡𝑡𝑒𝑒)
d WACC for YieldCo’s: “9% to 10% levered would get you right in the middle of the bell curve” (Martin 2015b).
e Average return expected for a private equity, infrastructure fund, or pension fund (Justice 2009). “Venture capital and private equity investors also serve as attractive sources for capital raising, as an increasing number of funds are investing in renewable energy and clean technologies” (Groobey et al. 2010).
f Swap rate plus equity spread above the London Interbank Offered Rate (LIBOR; assuming LIBOR rate of ~0%).
g 2014 7-year swap rate (“Selected Interest Rates [Daily] - H.15: Historical Data,” Federal Reserve [Board of Governors of the Federal Reserve System], http://www.federalreserve.gov/releases/h15/data.htm, accessed May 21, 2015).
h “Double B [term loan] is probably around 350 over” (Martin 2015b).
i The actual tax rate of sponsor equity may be much lower than 35% (as noted before, many sponsors do not generate taxable income), which would reduce the tax shield of the debt and increase the WACC. Additionally, the calculated WACC represents a single point in time; the effective WACC of a project is likely to change over the course of the project, as tax-equity investors reduce their interest in a project (e.g., in a Partnership Flip structure).
26 This report is available at no cost from the National Renewable Energy Laboratory (NREL) at www.nrel.gov/publications.
3.3.2.1 Historical Challenges to TPO of Residential PV Systems Despite the many benefits of the TPO business model, several challenges inhibit the growth rate and potentially increase the cost of residential PV systems. First, because of the various financing structures necessary to raise capital, third-party owners must receive funding from high-cost capital sources, such as tax-equity and private-equity investors. Structuring projects to attract tax-equity investors has proven to be a time-consuming and expensive process, requiring extensive legal, engineering, and environmental due diligence analysis. Though a rating agency will conduct similar due diligence on the assets that constitute solar asset-backed securities (ABS), the uniformity of the securitized assets and the large volume of assets pooled in the securities will likely lower the per-unit due diligence costs (Schwabe et al. 2012). Further, tax-equity investment is highly specialized, because it requires investors who, among other things:
• Have a substantial current and future tax liability that meets the various requirements described earlier
• Have the financial acumen to engage in a complex project structure
• Are willing to hold their ownership interests in the project for several years
• Are able to invest in illiquid assets that tie up cash and cannot easily be resold
• Are sufficiently sophisticated to account for a shifting tax policy environment in their investment decisions (Mendelsohn and Harper 2012).
This list of requirements constrains the supply of tax equity, increases the required yield, and, in effect, negates some of the value of the tax benefits.37 One study found that “roughly 64% of tax benefits [for solar projects] … are forfeited to tax equity investors” (Bolinger 2014).38 The complexity of tax-equity-based finance has limited the number of tax-equity investors in the solar industry to approximately 25 and the amount of tax equity to $4.5 billion in 2014 (Martin 2015a).39 The inadequate supply of tax equity essentially caps the number of TPO solar projects that can be deployed each year.40
TPO faces other challenges as well. It has been hampered in some states and municipalities owing to various regulations, including prohibiting non-regulated utilities selling electricity (e.g., in Florida, North Carolina, Kentucky, and Oklahoma), only offering incentives to the utility customer or homeowner (e.g., in New York and New Hampshire), and potentially charging property taxes only for third-party-installed systems (e.g., in Arizona). Many of the states with favorable solar laws also have laws favorable to TPO, but unfavorable TPO regulations limit financial options in other areas of the country.
TPO systems can also pose a challenge to selling a home owing to the lack of broad understanding of solar’s benefits, beyond the appraisal, which potentially restricts potential
37 Structuring public capital vehicles is also expensive and time consuming but can be applied to a much larger pool of projects, thereby distributing the set-up fees and lowering the costs to individual projects (Mendelsohn and Feldman 2013). 38 The study also cited other sources that estimate a 50% forfeiture in value for solar projects. 39 Tax-equity investment refers to nominal dollars. 40 Individual developers may not be capped by the availability of tax equity, owing to favorable relationships with investors, but there are currently more viable projects than investors in total.

27 This report is available at no cost from the National Renewable Energy Laboratory (NREL) at www.nrel.gov/publications.
buyers. Additionally, the existing TPO agreement may be challenging to transfer to a new homeowner, because the TPO provider may not be satisfied with the credit of the new homeowner, or the new homeowner may not be satisfied with the price (or other factors) of the existing TPO agreement. However, though there have been reports of solar complicating (or detracting from) home sales,41,42 thousands of systems have been successfully reassigned to a new homeowner. A recent survey of buyers, sellers, and realtors that were parties to transaction of San Diego homes with TPO solar systems, between 2010 and 2013, found that while 24% reported extended transaction times for the sale of the home, and 20% reported having buyers scared off by the lease or PPA, almost none of the respondents had any experience with buyers either withdrawing or being disqualified once the transaction was moving forward. In 77% of the cases the agreement was transferred, while 18% of the buyers and 5% of the sellers bought out the contract (Arreola, Treadwell, and Hoen 2015).
Residential TPO PV systems are also potentially more susceptible to the net-metering challenges summarized in Section 3.3.1.4. A common practice for TPO providers is to use “value-based pricing” when offering PPAs or leases. This essentially means their products are priced at a discount to residential retail rates (e.g., 10% below prevailing retail rates)—a different practice than using “cost-plus pricing,” which charges a margin on top of the cost to the provider.43 TPO contracts also often have price escalators built into them, to keep up with the assumed rise in energy costs. Having an escalator allows a contract to offer a lower price at the start of a contract and a higher price at the end of a contract, in theory to offer a consistent discount over retail electricity rates.44 However, a different rate structure, different net-metering arrangement, or slower-than-expected inflation rate could make these contracts less economical.
3.4 Historical Financing Methods in the Non-Residential Distributed PV Market
As of the end of 2014, the U.S. non-residential distributed PV market represented 28% of cumulative installed PV capacity, with investments of approximately $24 billion in the last 10 years ($3.3 billion in 2014 alone) (SEIA and GTM Research 2015a; Barbose and Darghouth 2015). The non-residential distributed PV market represents a heterogeneous mix of systems, customers, and owners. While the median reported U.S. non-residential system size was 130 kW in 2014, system sizes varied from 5 kW or less to multiple megawatts; therefore, system prices also vary from a few thousand dollars to $10 million or more. As shown in Figure 2, from 2010 to 2014 the non-residential market has shifted toward installing larger systems. Systems smaller than 500 kW fell from 48% of the market in 2010 to 32% in 2014, and systems larger than 1 MW grew from 30% of the market to 47% over the same period. That said, there still is a wide range in system size. 41 “Leased Solar Panels Can Complicate — Or Kill — a Home Sale,” Kenneth R. Harney, Los Angeles Times, http://www.latimes.com/business/realestate/la-fi-harney-20150322-story.html, March 22, 2015. 42 “Rooftop Solar Leases Scaring Buyers When Homeowners Sell,” Will Wade, Bloomberg Business. http://www.bloomberg.com/news/articles/2014-06-23/rooftop-solar-leases-scaring-buyers-when-homeowners-sell, June 24, 2014. 43 While cost-plus pricing is more common for host-owned systems, value-based pricing exists in both business models. Therefore, the fundamental distinction between the two, as it relates to net-metering changes, is the economic value over the life of the system. 44 Without an escalator, TPO providers may not be able to offer electricity-price savings at the beginning of a contract.
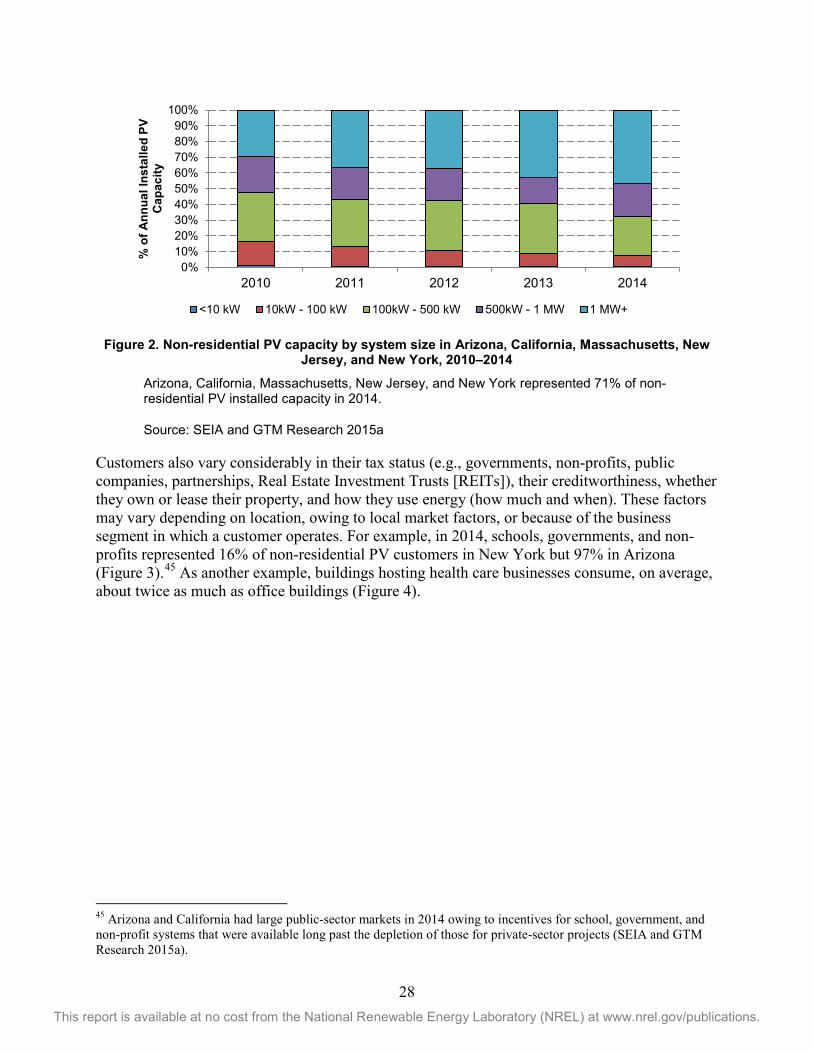
28 This report is available at no cost from the National Renewable Energy Laboratory (NREL) at www.nrel.gov/publications.
Figure 2. Non-residential PV capacity by system size in Arizona, California, Massachusetts, New
Jersey, and New York, 2010–2014
Arizona, California, Massachusetts, New Jersey, and New York represented 71% of non-residential PV installed capacity in 2014.
Source: SEIA and GTM Research 2015a
Customers also vary considerably in their tax status (e.g., governments, non-profits, public companies, partnerships, Real Estate Investment Trusts [REITs]), their creditworthiness, whether they own or lease their property, and how they use energy (how much and when). These factors may vary depending on location, owing to local market factors, or because of the business segment in which a customer operates. For example, in 2014, schools, governments, and non-profits represented 16% of non-residential PV customers in New York but 97% in Arizona (Figure 3).45 As another example, buildings hosting health care businesses consume, on average, about twice as much as office buildings (Figure 4).
45 Arizona and California had large public-sector markets in 2014 owing to incentives for school, government, and non-profit systems that were available long past the depletion of those for private-sector projects (SEIA and GTM Research 2015a).
0%10%20%30%40%50%60%70%80%90%
100%
2010 2011 2012 2013 2014
% o
f Ann
ual I
nsta
lled
PV
Cap
acity
<10 kW 10kW - 100 kW 100kW - 500 kW 500kW - 1 MW 1 MW+

29 This report is available at no cost from the National Renewable Energy Laboratory (NREL) at www.nrel.gov/publications.
Figure 3. Non-residential PV installations by customer segment in 2014 in Arizona, California,
Massachusetts, New Jersey, and New York
Source: SEIA and GTM Research 2015a
Figure 4. Building electricity consumption by principal building activity
Source: EIA 2006
0%
20%
40%
60%
80%
100%
AZ CA NJ MA NY% o
f Ann
ual I
nsta
lled
PV
Cap
acity
School, Government, and Nonprofit Commercial and Industrial
0
100
200
300
400
500
600
MW
h pe
r bui
ldin
g pe
r yea
r

30 This report is available at no cost from the National Renewable Energy Laboratory (NREL) at www.nrel.gov/publications.
In some instances, non-residential PV systems sell electricity to a utility, but most have net-metering agreements with the local utility, which typically has a maximum size at which a system can be interconnected to the grid. Whether the PV systems actually feed energy back to the grid largely depends on the size of the PV array and the amount of energy consumed. Additionally, non-residential customers often have low retail rates or rate structures that rely less on volumetric charges (e.g., they have structures with demand charges that bill customers for their peak load over a given period), relative to residential customers. Therefore, relative to residential PV projects, non-residential projects must depend more on other revenue streams (e.g., by selling RECs), have proportionately lower costs, or both.
3.4.1 Host Ownership Organizations have various ways of raising capital, which are highly dependent on the type of institution, the risks associated with that organization, and how much capital is raised. Therefore, a particular financing option for buying a non-residential PV system may be more or less attractive depending on the company and the size of the project.
Many companies use funds available through normal business activities, or “balance sheet” financing, to purchase a PV system; this is particularly the case for small PV systems or large companies. These funds can come from either cash available on hand or from existing bank relationships. The financial cost of these transactions depends on a business’s cost of capital. A recent study found that publicly traded U.S. companies have a weighted average cost of capital of 5.9%, with a range of 2.2% to 10.3% depending on industry.46 While U.S. public companies’ average cost of debt was approximately 3.7% (ranging from 2.7% to 5.2% depending on industry), these companies must maintain a certain debt-to-equity ratio to satisfy existing debt covenants and maintain their risk profile. Therefore, while they may use debt (including a revolving loan fund), this financing should not necessarily be treated apart from the larger corporate cost of capital.
Private companies (i.e., those that are not publically traded) typically have higher costs of capital owing to limited sources of funding, less-fungible ownership interests, less transparency, and higher transaction costs. As shown in Figure 5, cost of private capital can average 3.5%–5.5% for bank loans and 25%–33% for funds from venture capital companies.
46 “Costs of Capital by Industry Sector: U.S.,” Aswath Damodaran, New York University Stern School of Business, http://people.stern.nyu.edu/adamodar/New_Home_Page/data.html, January 5, 2015, accessed September 15, 2015.
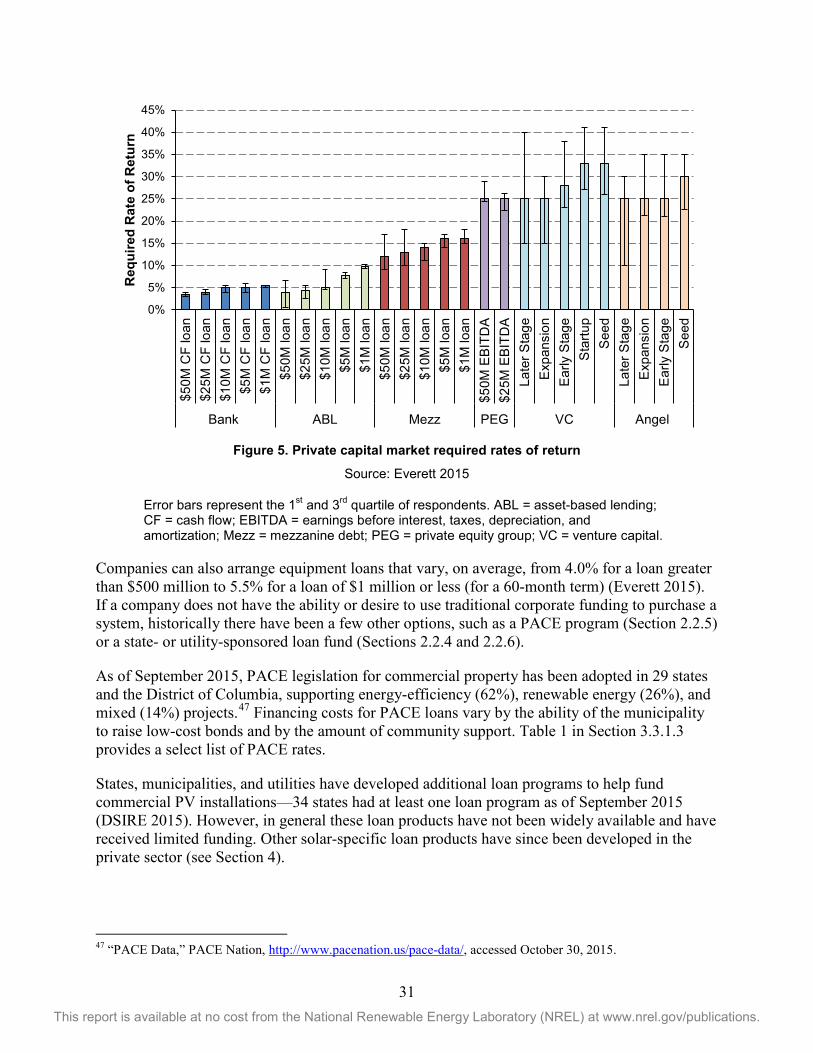
31 This report is available at no cost from the National Renewable Energy Laboratory (NREL) at www.nrel.gov/publications.
Figure 5. Private capital market required rates of return
Source: Everett 2015
Error bars represent the 1st and 3rd quartile of respondents. ABL = asset-based lending; CF = cash flow; EBITDA = earnings before interest, taxes, depreciation, and amortization; Mezz = mezzanine debt; PEG = private equity group; VC = venture capital.
Companies can also arrange equipment loans that vary, on average, from 4.0% for a loan greater than $500 million to 5.5% for a loan of $1 million or less (for a 60-month term) (Everett 2015). If a company does not have the ability or desire to use traditional corporate funding to purchase a system, historically there have been a few other options, such as a PACE program (Section 2.2.5) or a state- or utility-sponsored loan fund (Sections 2.2.4 and 2.2.6).
As of September 2015, PACE legislation for commercial property has been adopted in 29 states and the District of Columbia, supporting energy-efficiency (62%), renewable energy (26%), and mixed (14%) projects.47 Financing costs for PACE loans vary by the ability of the municipality to raise low-cost bonds and by the amount of community support. Table 1 in Section 3.3.1.3 provides a select list of PACE rates.
States, municipalities, and utilities have developed additional loan programs to help fund commercial PV installations—34 states had at least one loan program as of September 2015 (DSIRE 2015). However, in general these loan products have not been widely available and have received limited funding. Other solar-specific loan products have since been developed in the private sector (see Section 4).
47 “PACE Data,” PACE Nation, http://www.pacenation.us/pace-data/, accessed October 30, 2015.
0%
5%
10%
15%
20%
25%
30%
35%
40%
45%
$50M
CF
loan
$25M
CF
loan
$10M
CF
loan
$5M
CF
loan
$1M
CF
loan
$50M
loan
$25M
loan
$10M
loan
$5M
loan
$1M
loan
$50M
loan
$25M
loan
$10M
loan
$5M
loan
$1M
loan
$50M
EB
ITD
A$2
5M E
BIT
DA
Late
r Sta
geE
xpan
sion
Ear
ly S
tage
Sta
rtup
See
dLa
ter S
tage
Exp
ansi
onE
arly
Sta
geS
eed
Bank ABL Mezz PEG VC Angel
Req
uire
d R
ate
of R
etur
n
32 This report is available at no cost from the National Renewable Energy Laboratory (NREL) at www.nrel.gov/publications.
3.4.1.1 Historical Challenges to Host Ownership of a Non-Residential PV System Funding non-residential PV deployment through a direct cash purchase or the loans described above has helped deploy more than 2 GW of non-residential PV systems. However, challenges to these methods inhibit the growth rate and potentially increase the cost.
First, for a PV system to be large enough to supply a significant portion of a business’s energy demand, the upfront cost will typically be in the hundreds of thousands, if not millions, of dollars. Most corporate entities do not have that amount of excess cash, especially for a non-core-business activity. While companies can get loans, the borrowing amount is often limited. Additionally, the cost of capital for companies, particularly private ones, can be substantial (Figure 5). Companies, non-profits, or governments without a public credit rating—or with existing assets or revenues that cannot provide sufficient collateral against the cost of a PV system—may have a difficult time raising money (or raising money at a reasonable cost).
Further, even if an entity can self-finance a PV system, it must have sufficient tax liability to take advantage of the 30% federal ITC and 5-year MACRS depreciation, which could be worth up to an additional 25%–30%, depending on the company’s tax rate. Although the benefits can be carried forward for use in later years, their future worth is lower owing to the time value of money. Businesses also pay varying amounts of federal taxes, and the degree to which an individual business can use a credit largely depends on business size, PV system size, and the business’s ability to adjust incurred income; governments and non-profits cannot use these benefits at all.
Additionally, because both businesses and non-residential PV systems vary so much, there is a lack of standardization in contracts and processes relative to the residential sector. Solar is typically not a core function of a business or operation, and therefore many companies, schools, and governments have had to spend considerable time and money (including significant legal fees) in developing these projects and the core competencies necessary to own these assets.
This is particularly true for the significant portion of businesses and non-profits that lease land and buildings. In these instances, a solar transaction could get even more complicated, because another party must be educated, agree to terms, and potentially be compensated. If a tenant owns and operates a PV system and uses the energy, then a property owner exposes itself to risks and costs with no benefit, other than better tenant relations—thus, a split-incentive.
Because an onsite project’s return is predicated in large part upon reduced energy costs, the effect a PV system has on a customer’s utility bill—via reduced utility electricity demand or a utility credit for energy exported to the grid—will have a large impact on the financial strength of a project. Most non-residential customers have more complicated utility rates than do residential customers, with a much larger portion of the total bill coming from demand charges and fixed fees rather than volumetric rates.48 Thus non-residential PV systems often receive a much lower value for the electricity they produce, though this varies by region and customer. However, this depends in part on how a customer’s load profile (i.e., electrical consumption over 48 Demand charges bill customers for the maximum amount of electricity demand in a given period (e.g., per month, per year). These are designed to cover the cost of the utility having the capacity to offer that much power to a customer at any given time. Fixed fees charge customers for the fixed overhead of being a customer, regardless of energy use.

33 This report is available at no cost from the National Renewable Energy Laboratory (NREL) at www.nrel.gov/publications.
time) corresponds to a PV system’s production profile. Historically, many customers have not had the ability or information to integrate a PV system with their energy load so it could have a maximum impact on utility charges, either through load shifting or electricity storage. This is further exacerbated with regard to changes in net-metering laws, which potentially lower the rate at which a customer is credited, or net-metering caps, which limit the number of customers that can participate in a program. Without net-metering programs, customers may be forced to limit the size of a PV system so energy is never (or rarely) fed back onto the grid.49 Several products have been developed in an attempt to mitigate these issues (see Section 4).
3.4.2 Third-Party Ownership (TPO) Third-party ownership (TPO) is more popular in certain segments of the non-residential market than in others owing to its relative advantages and challenges for the customer and provider. For example, from 2010 to 2014 in New Jersey, 42% of PV capacity hosted by commercial and industrial clients used TPO compared to 91% of capacity for systems hosted by student, government, or non-profit organizations.50 This makes intuitive sense, because the latter groups do not pay taxes and therefore must rely on TPO to use PV tax incentives.
Businesses use TPO because they do not have sufficient tax liability to use the tax benefits, do not have enough funds available to purchase a system, and do not have adequate technical or financial knowledge of the industry or PV systems. These issues have an even larger impact than they do in the residential sector, because non-residential systems are usually larger and more complicated. Projects can cost millions of dollars, which increases the associated tax benefits. Non-residential PV systems also qualify for accelerated 5-year MACRS depreciation, effectively doubling the tax liability necessary to use the benefits of the solar array properly, as compared to a residential system.51
System installation, maintenance, and operation can also be more complicated for a larger system. There are often more regulations associated with interconnecting a PV system to the grid if it is above a certain capacity. Maintaining the equipment can also be difficult, because the number of pieces of equipment grows in proportion to the system size. To a business using TPO, the only risk of unexpectedly lower PV generation is the additional cost of electricity that must be sourced from the utility. In contrast, a PV owner must pay for the system, including operations and maintenance (O&M), regardless of system performance (unless there is a production guarantee). A system owner might also incur large, unforeseen O&M costs, such as an inverter replacement. Additionally, incentive programs are typically more sophisticated with larger systems, requiring more attention and knowledge of market dynamics. TPO sources these issues to a business with knowledge of the industry.
49 Some non-residential customers currently do not net meter any energy, because their energy demand is so large, relative to the size of the PV system, that they consume all the energy produced by the array. 50 New Jersey Clean Energy Program project list as of May 31, 2015, http://www.njcleanenergy.com/renewable-energy/home/home, accessed July 9, 2015. 51 On the other hand, a business-owned PV system likely reduces electricity expenses that would otherwise be deducted from income, which effectively increases the company’s income and thus tax liability. In contrast, the electricity savings a homeowner realizes from PV are all after-tax.

34 This report is available at no cost from the National Renewable Energy Laboratory (NREL) at www.nrel.gov/publications.
Non-residential customers also have unique reasons for considering TPO financing. Commercial entities must consider how various financing options impact their financial statements. While PPAs, leases, and system purchases are all long-term commitments, TPO contracts are considered off-balance-sheet transactions; similar to an operating lease, TPO payments are treated as operating expenses, and the long-term liability of the contract does not appear on a company’s balance sheet. Financial statements are used to measure the financial health of a company, and corporate debt often has covenants that limit the amount of additional debt a company can incur. Therefore, a company might be unable to add the liability of a PV loan onto its balance sheet and might instead opt for a PPA or lease. Much of this depends on the size of the company relative to the amount of PV it aims to deploy.52
Another important consideration is the financial time horizon of the company or agents within the company. If a system is purchased using company funds, it may take 5–10 years before the investment is cash-flow positive. A company could also use a loan, but if its term is relatively short compared to the lifetime of the PV system, then the principal and interest payments may be higher than the electric bill savings until the loan is paid off. TPO financing, on the other hand, may offer immediate savings. For example, a company’s facilities manager, who is unlikely to remain in the same job for the economic life of the PV system, might choose immediate energy savings over potential long-term economic value. A company might also require immediate savings to approve a capital project.
As in the residential TPO sector, project sponsors and developers have had to rely on tax-equity investment vehicles (Section 3.1) to finance non-residential PV systems efficiently. Many sponsors are active in the residential and non-residential markets (e.g., SunPower, SolarCity, and SunEdison); however, owing to the heterogeneity of the non-residential U.S. market, there is less industry concentration. While the financial arrangement may vary a bit more in the non-residential space, the after-tax financial cost of TPO arrangements has a similar spread throughout the distributed PV market, with a range of 7%–14% (see Table 3, Section 3.3.2).
3.4.2.1 Historical Challenges to TPO of Non-Residential PV Systems Despite the many benefits of the TPO business model, several challenges inhibit the growth rate and potentially increase the cost of non-residential PV systems. This sector encounters many of the same issues as the residential TPO market (Section 3.3.2.1): high cost of capital, restrictive state and municipal regulations, underlying real estate sales complications and loss of value, and net-metering challenges exacerbated by value-based pricing. Companies, non-profits, and governments also have similar challenges financing PV systems through TPO as when owning it themselves: landlord and tenant split-incentives (though not when the third-party owner is the landlord), low retail rates, and net-metering caps.
However, challenges unique to non-residential TPO financing have severely limited the number of businesses, non-profits, and government agencies that can host a PV system. Owing to the heterogeneity of the market, there has been a lack of standardization of contracts and procedures 52 In November 2015, the Financial Accounting Standards Board (FASB), which establishes the standards for public and private companies’ financial statements, such as balance sheets, voted to proceed with a new accounting standard that would require companies to report operating leases on their balance sheets. The final Accounting Standards Update has not received final approval, but it is expected to be published in early 2016, with the standards taking effect in 2019 for public companies and 2020 for private companies (FASB 2015).
35 This report is available at no cost from the National Renewable Energy Laboratory (NREL) at www.nrel.gov/publications.
within the industry. Residential PV system sizes and building characteristics as well as the credit ratings of homeowners are similar enough that a financial entity can aggregate systems into one portfolio and still have a good idea of its risk profile. Investors in transactions used to finance PV systems will typically only participate if the transaction is at least a certain size; minimums can range from $25–$100 million. A single utility-scale solar project can meet these minimums, as can a portfolio of residential PV systems. Non-residential PV systems are often not large enough to finance separately but are difficult to package into a portfolio because of their diversity.
Non-residential PV systems often have dramatically different sizes, orientations, and system designs. The real estate characteristics can also vary dramatically, from the physical attributes (such as roof age and weight limit) to whether the property is owned or leased. If it is leased, which is common with commercial real estate, lease agreements are also highly negotiated and non-standardized—from which party takes responsibility for property damage to the length of the lease and the ability of the lessor to make changes to the property.
The credit quality of non-residential customers also varies substantially. Unless they are publicly rated, assessing the risk of a customer can be challenging and time consuming (unlike in the residential sector, which typically uses a FICO score). This is exacerbated because the size of the investment being made can be significantly higher in the non-residential space, so there is a concentration of risk.
Finally, the sales time for a non-residential project is typically longer than for a residential system. Thus developers do not necessarily have a steady stream of projects available to be packaged into a single financial transaction.
All of these factors make the due diligence process for a portfolio of projects challenging and expensive. It also makes it very difficult to bundle a sufficient amount of projects in a timely manner to meet the minimum transaction size necessary to finance the projects.
TPO has been used to finance bundles of non-residential PV projects; however, this has typically been accomplished by restricting the types of projects deemed acceptable for inclusion in the portfolio. For example, a portfolio of non-residential projects might focus on:
• Very large projects (which is, in part, why the average system size has increased each year, as demonstrated in Figure 2)
• Customers with multiple sites who can sign agreements on a large portfolio of projects (such as Walmart or Staples)
• Customers with good public credit ratings
• Customers that own their building and/or property. Customers that meet one or more of these requirements represent only a small portion of the potential PV market. If an organization does not meet one of these requirements, it may be unable to host a PV system, or the financing costs of arranging such a deal may make the price of energy significantly higher.

36 This report is available at no cost from the National Renewable Energy Laboratory (NREL) at www.nrel.gov/publications.
Most U.S. federal government buildings face an additional hurdle to the TPO market, because the General Services Administration typically limits civilian agencies from signing contracts longer than 10 years. To be able to offer competitively priced energy, TPO financing structures have historically required power contracts of at least 15 years so investors had a long enough period of contracted cash flows to meet their returns (without price risk). The Department of Defense has authority to sign 30-year contracts, and other federal agencies may be able to circumvent these issues, for example, by using the Western Area Power Administration as an intermediary (if the project is in its territory) (Stoltenberg 2012), but many federal agencies are stymied by this contract length restriction.

37 This report is available at no cost from the National Renewable Energy Laboratory (NREL) at www.nrel.gov/publications.
4 Recent Innovative Approaches to Addressing Historical Financing Challenges
The historical financing methods described in Section 3 have funded the deployment of more than 19 GW of solar capacity through the end of 2014, increasing annual installations 66% per year from 2008 to 2014 (SEIA and GTM Research 2015a). Despite this success, the many challenges of these financing structures described in Section 3 have inhibited growth and added costs to solar energy. However, industry stakeholders have been working to solve some of these issues, and they have developed and deployed new products, policies, and procedures that reduce the cost of financing and expand the market opportunity for solar in the United States. This section reviews some of these recent innovations.
4.1 Improving Access to Lower-Cost Financing To varying degrees, the residential, non-residential, and utility-scale sectors have historically been hampered by a lack of ready access to low-cost capital. In the last few years, however, the industry has begun to address and, in some cases, overcome these barriers by tapping into different sources of low-cost public capital, developing new solar-specific loan products, and creating online platforms to match projects and investors.
4.1.1 Securitization and YieldCos For several years, the solar industry has sought to reduce its financing costs by tapping into low-cost capital to supply debt and equity. On the debt side, this primarily involves securitizing future cash flows from portfolios of distributed PV projects and selling them to investors as ABS. To date, three owners of distributed PV project portfolios—SolarCity, Sunrun, and AES—have raised roughly $660 million through six different securitizations (four of them from SolarCity, which was also the first such issuer in November 2013).
Comparing terms across these six ABS issuances is complicated by the fact that each securitization is a little different in terms of the characteristics of the underlying portfolio, the degree of overcollateralization (or the “advance rate,” which is simply 100% minus the overcollateralization), the bond rating (and even the rating agency used), the terms of Class A vs. Class B notes, and so forth. The summary statistics provided in Table 3, however, reveal that ABS coupons have ranged from 4.03% to 4.80% for the premium Class A shares (dollar-weighted average of 4.30%) and from 5.38% to 5.58% for the subordinate Class B shares (dollar-weighted average of 5.48%).53 The average term (based on anticipated repayment dates) is about 8.9 years (8.7 years if dollar-weighted) but ranges from 6.6 years to 13 years and has generally declined with time as solar issuers seek to make their issuances more attractive to typical ABS buyers, who are accustomed to shorter terms. Improvements in the advance rate and bond rating are generally evident.
53 These coupons do not represent the total cost of capital from ABS. For example, the coupons do not reflect the significant transaction costs involved with securitization, including various fees, due diligence, and insurance (regular bank debt also incurs these types of transaction costs, but to a lesser extent). Nor do the coupons include the ongoing operational cost to track the portfolio of secured assets and service the securities. Moreover, the securities themselves could sell at a discount to par value, which would increase their cost.

38 This report is available at no cost from the National Renewable Energy Laboratory (NREL) at www.nrel.gov/publications.
Table 3. Vital Statistics of Five Distributed PV ABS Issued to Datea
Issuer SolarCity SolarCity SolarCity Sunrun SolarCity
Share class N/A N/A A B A B A B
Issue date Nov-13 Apr-14 Jul-14 Jul-14 Jul-15 Jul-15 Aug-15 Aug-15
Bond size (millions) $54.4 $70.2 $160.0 $41.5 $100.0 $11.0 $103.5 $20.0
Bond couponb 4.80% 4.59% 4.03% 5.45% 4.40% 5.38% 4.18% 5.58%
Anticipated term (years) 13.1 8.0 8.1 8.1 9.1 9.1 6.6 6.6
Credit rating BBB+ BBB+ BBB+ BB A BBB A BBB
Overcollateralization / advance rate
38% / 62%
34% / 66%
42% / 58%
27% / 73%
37% / 63%
24% / 76% 32% / 68%
All dollars in this table are quoted in nominal terms.
a In Table 4, overcollateralization measures the size of the bond issuance relative to the total discounted cash flow generated by the portfolio of projects (i.e., the “aggregate discounted solar asset balance” or ADSAB) and subtracts that percentage from 100%. This measure does not take into account the additional collateralization provided to Class A shares by the subordination of Class B shares. Overcollateralization is done to make an ABS less risky by securing more cash flows than necessary to repay the security; if something goes wrong with some of the securitized projects, investors can still be paid. The greater the overcollateralization, the less risky an ABS is viewed by investors. The “advance rate” is simply the opposite of overcollateralization—it indicates what percentage of the ADSAB is raised (or “advanced”) by the issuance.
b Apart from the coupon not representing the total cost of capital, when comparing the cost of capital over time and across different sources, a more relevant metric than the coupon is the basis point spread above the base rate (e.g., LIBOR or Treasuries) at the time. Though we do not have comprehensive data on the spread for all issuances shown in Table 4, one source (“SolarCity Deal Lights Way for Securitization,” Joy Wiltermuth, Reuters, http://www.reuters.com/article/structured-finance-solarcity-bonds-idUSL6N0Q049O20140729, July 29, 2014) estimates that the basis point spread over LIBOR (swapped to a fixed rate) for SolarCity’s first three issuances was 265, 230, and 180 basis points, respectively. This narrowing spread largely mirrors the reduction in the coupon across these three issuances, as LIBOR has held fairly steady for more than five years.
Despite the progress to date, solar securitization is struggling to come up to scale. Typical mortgage securitizations range from $500 million to $1 billion each—far larger than the $100–$200 million solar securitizations seen recently. Large issuances help to justify the high fixed costs of securitization (which are not reflected in the coupons), and as of yet, the solar industry really has not achieved that scale. These first few issuances, therefore, might be better viewed as “loss leaders” aimed at creating a viable long-term solar ABS market that will potentially deliver lower-cost capital in the future.
On the equity side, much of the initial focus was on gaining the legal or regulatory authority to use existing finance vehicles such as REITs and master limited partnerships (MLPs) to access low-cost public capital. Both REITs and MLPs are widely used within the broader energy industry, but to date the legislative and regulatory changes needed to allow solar to use these vehicles effectively have not materialized (Feldman and Settle 2013). In the meantime, enterprising solar project sponsors and financiers have introduced an alternative to REITs and MLPs that is commonly referred to as a “YieldCo.”

39 This report is available at no cost from the National Renewable Energy Laboratory (NREL) at www.nrel.gov/publications.
Broadly defined, a YieldCo is a publicly traded company that owns a portfolio of operating solar projects and distributes a large proportion of net revenue to shareholders in the form of regular cash dividends (which provide the shareholder’s “yield”). Though not statutorily tax advantaged like REITs and MLPs,54 YieldCos have been carefully structured to minimize or eliminate shareholder taxation for the foreseeable future by carrying forward depreciation deductions over the first decade or so of each project’s life.
To date, most YieldCos have been floated by project developers or sponsors, who benefit from having a ready and willing buyer for their completed projects as well as from being able to disentangle the financing needs of the development and operational sides of the business, thereby allowing each to be priced more transparently and efficiently in the market. For example, the first YieldCo was launched by NRG (NRG Yield) in July 2013, and since then a handful of additional solar and wind project sponsors have followed suit, including SunEdison (TerraForm Power), NextEra (NextEra Energy Partners), Abengoa (Abengoa Yield), and SunPower/First Solar (8point3). YieldCos now collectively own 4.5 GW of operating solar capacity and have a right of first refusal to many more gigawatts of projects in development.
A YieldCo’s cost of equity is not transparent, because it depends on not just the current dividend yield (which is observable), but also future growth expectations (which are not). It also fluctuates over time with the YieldCo’s share price (which is the denominator of the dividend yield calculation). Investor enthusiasm for many of the initial YieldCo offerings resulted in early dividend yields as low as 2%–3% in some cases, with a total cost of equity estimated in the 7%–11% range, averaging around 9% (Grant and Cornfeld 2015). As more YieldCos entered the market to capitalize on this relatively low cost of equity, a buying spree ensued, which pushed renewable asset prices higher and increased leverage to levels investors began to question. This aggressive acquisition phase came to a head in the summer of 2015, when Terraform Power announced that it would purchase Vivint Solar at a price that many considered unattractive. This announcement (along with the buying frenzy that preceded it) sparked investor concerns about the long-term viability of YieldCos’ growth targets as well as the true nature of the relationship between parent sponsors and their YieldCos (which is supposed to be at arm’s length, but often lacks transparency). As share prices fell in late summer, dividend yields—and hence the cost of equity—increased, making it harder and more expensive for YieldCos to achieve their growth targets. The resulting vicious cycle culminated in share prices dropping to levels that could, in some cases, be justified merely by existing portfolios, without any implied future growth. The implied cost of raising equity in this environment was estimated to be about 12%, up from about 9% on average earlier in the year (Grant and Cornfeld 2015). Largely shut out of the capital markets, most YieldCos have since entered a period of retrenchment (as of December 2015), postponing future acquisitions until share prices recover. Despite the sharp selloff and resulting negative publicity, dispassionate financiers continue to believe that, under current law, public YieldCos remain “the optimal long-term ownership vehicle for passive, contracted, cash-flowing 54 Corporate profits are subject to corporate federal income taxes, and shareholders of the corporation are (usually) subject to personal federal income taxes when they receive dividends or distributions of those profits. Thus, there is a double layer of taxation. MLPs are tax advantaged because they are pass-through entities: their income is not taxed at the corporate level, only at the partner level. A REIT is allowed to adjust its net taxable income by deducting the portion of its taxable income that it distributes to unit holders (i.e., REIT shareholders). Because REITs are required to distribute at least 90% of their taxable income to unit holders, they typically avoid paying most, if not all, taxes at the corporate level.

40 This report is available at no cost from the National Renewable Energy Laboratory (NREL) at www.nrel.gov/publications.
renewable energy assets” (Grant and Cornfeld 2015) and that they will make a strong comeback in 2016 and/or 2017 (Puttré 2015a).
Financial innovations such as ABS and YieldCos have had a significant impact on how distributed and utility-scale solar projects are financed. Most notably, deals are being structured such that tax-equity returns are even less cash based than they were previously, given the increasing need for cash payouts to ABS and YieldCo investors. In order to maintain target returns while taking less cash out of each project, tax equity is investing less in each project, which means that an expensive portion of the capital stack (tax equity) is being replaced with a generally cheaper source of capital (ABS or YieldCo), thereby reducing the project’s WACC. These financing structures could evolve even further if the Section 48 ITC reverts to 10% in 2022 (as currently scheduled), for example, by jettisoning expensive tax equity altogether in favor of cheaper forms of capital such as debt (perhaps raised through the issuance of ABS) or YieldCo equity. To date, securitized debt (from ABS) and equity (from YieldCos) have not been used in tandem, but the marriage of these two low-cost sources of capital may not be far off.
4.1.2 Solar-Specific Loans While ABS and YieldCos are applicable primarily to TPO distributed PV projects and utility-scale projects, respectively, host-owned residential PV systems have benefited in recent years from a dramatic expansion in the number of “solar-specific” loans being offered. These loans are a direct response to both the success of TPO—which is, at its core, a form of financing—and the gradual erosion of TPO’s competitive advantage in the marketplace.
For example, as the cost of PV has declined substantially in recent years, lenders can now offer competitive solar loan products that provide financial benefits similar to TPO (e.g., little or no money down and at least cash-flow neutral) while preserving other benefits of ownership (e.g., free electricity once the loan is paid off).55 Declining installed prices also make it easier for host owners to absorb the ITC fully, thereby reducing the need for third-party monetization. Some have also argued that performance risk—the mitigation of which is another major selling point of TPO—has declined along with falling prices (e.g., for inverters, the component most likely to fail over time), stronger manufacturers’ warranties, and the ongoing accumulation of operating experience.
With TPO no longer holding as much of a unique competitive advantage in the marketplace, the past two years have witnessed a proliferation of tailored solar loan products designed to compete with and/or complement TPO, as both conventional and unconventional lenders try to capture a portion of TPO’s market share. Most of these solar-specific loans combine a 12- to 18-month zero-interest (or “same as cash”) ITC bridge loan for 30% of the project cost with a longer-term (e.g., 10- to 15-year) fully amortizing loan for the balance of 70%. The borrower repays the “same as cash” ITC loan in a single balloon payment once it benefits from the 30% ITC and pays the 70% balance off over time at interest rates ranging from 2.99% to about 8%, depending on a variety of factors, including who is offering the loan, whether the installer has bought down the interest rate (as a marketing tool to close the deal), the credit of the borrower, and the length of
55 For a financial analysis that demonstrates how solar loans can provide more beneficial customer economics than TPO, see Feldman and Lowder (2014).

41 This report is available at no cost from the National Renewable Energy Laboratory (NREL) at www.nrel.gov/publications.
the loan. These loans are generally (though not always) unsecured or secured by just the PV system rather than the entire home.
While at least one module manufacturer (SunPower, in conjunction with specialty lender Enerbank USA) offered these two-part loans to its customers as far back as 2009, it was not until 2013 that the first independent loan originator—Sungage Financial—developed a similar product in Connecticut that was secured by the system itself. Since then, numerous other lenders—such as GreenSky Credit, Admirals Bank, Digital Federal Credit Union, Mosaic, Kilowatt Financial, and Dividend Solar—have come out with similar loan products that are marketed both independently and through partner installer channels.56
In what is perhaps the best indication of the growing demand for (and competitiveness of) solar loans, even the major third-party owners like SolarCity and Sunrun have jumped on the bandwagon. For example, SolarCity launched its MyPower loan product in late 2014 by noting that it expected MyPower to offer a compelling value proposition with “a lower cost than PPAs in many locations”57 and that it projected half of its new customers would choose MyPower over traditional leases or PPAs by as early as mid-2015.58,59 Another justification for the loan product is to expand the size of the addressable market to include states that do not allow solar TPO. For example, in early March 2015, SolarCity entered the New Mexico market with MyPower as its sole offering.
Although these loan products have gained significant traction over the past year, their future is uncertain. If the 30% residential ITC expires in 2022 as currently scheduled, there will no longer be an underlying basis for the 30% “same as cash” bridge loans that have made these two-part solar-specific loan products popular with consumers. Whether lenders will still be willing to provide 100% financing without the ITC (which effectively reduces the loan-to-value ratio to 70%), and whether consumers will still find loan interest rates attractive (without 30% of the loan being interest free), remains to be seen.
4.1.3 Online Finance Platforms In parallel with the evolution of solar-specific loan offerings and vehicles to tap into low-cost public capital described above, the industry has been harnessing information technology and the Internet to reduce search and customer acquisition costs, bypass middlemen, and reduce financing transaction costs. For example, companies like Clean Power Finance and Sol Systems specialize in matching up tax-equity investors and/or lenders with smaller developers or installers who might otherwise find arranging financing for their projects to be too onerous. Other direct or peer-to-peer lending platforms like those offered by Mosaic and Dividend Solar connect borrowers directly with lenders and in some cases allow individuals to participate as lenders. SolarCity has even been using its website to raise general corporate debt by offering
56 For a review of some of these loan products, see Bolinger and Holt (2015). 57 “SolarCity Introduces MyPower, a First-of-its-Kind Solar Loan Paid Back by the Sun,” SolarCity, http://www.solarcity.com/newsroom/press/solarcity-introduces-mypower-first-its-kind-solar-loan-paid-back-sun, October 7, 2014. 58 “SolarCity Offers its First Home Solar Loan,” Ucilia Wang, Forbes, http://www.forbes.com/sites/uciliawang/ 2014/10/08/solarcity-offers-its-first-home-solar-loan/, October 8, 2014, accessed December 15, 2015. 59 This optimistic projection has not played out, as SolarCity reported in its third quarter of 2015 results webcast that MyPower loans accounted for roughly 10%–15% of its overall business during the preceding few quarters.
42 This report is available at no cost from the National Renewable Energy Laboratory (NREL) at www.nrel.gov/publications.
“Solar Bonds” at rates that are comparable to or higher than other less-risky consumer investment alternatives like savings accounts and certificates of deposit.
At a somewhat less-visible level, loan originators like Sungage Financial and others are allowing installers to access their online loan portal directly at the time of sale to provide instant qualification. Experience with residential solar TPO—perhaps the most expensive option for consumers over time (Feldman and Lowder 2014), yet one that has proven very popular—demonstrates how important it can be to package a system sale with instant financing. Still other platforms, like EnergySage, enable consumers to seek and compare multiple competitive quotes online, for both system installation and financing. Taken together, these online finance platforms are enabling greater access to lower-cost financing in the residential and non-residential sectors.
4.2 Standardization and Data Collection Currently there is a diverse set of asset contracts, installation and O&M practices, and other business features within the solar industry. This can make it difficult to provide transparency to potential buyers, including those interested in pooling PV assets to create a security. Further, the lack of standards and best practices adds to the costs and time it takes to close a financial deal. Lowder and Mendelsohn (2013) note, however, that “many securitization markets, including mortgages, required innovation and time to achieve viability, and these hurdles may be more symptomatic of growing pains than of permanent barriers” (Lowder and Mendelsohn 2013). Another report states that “standardization may offer the opportunity to minimize due diligence requirements of institutional and other investors, which is necessary for wide-scale and rapid investment. Other securitized assets such as auto loans and credit cards are highly liquid due to the standardization of procurement documents and comprehension of underlying asset values” (Schwabe et al. 2012).
Two broad initiatives have been organized to remove many of these barriers. First, in 2012, the SunShot Initiative awarded a grant to the National Renewable Energy Laboratory (NREL) to form the Solar Access to Public Capital (SAPC) working group, designed to bring together the development, legal, financial, rating agency, and advisory communities to facilitate capital market investment in U.S. solar projects. As of September 2014, the group had more than 440 participants, including top residential and commercial solar developers, law firms, investment banks, capital managers, rating agencies, independent engineers, and other key stakeholders in the solar finance space. The working group has released standardized residential and commercial lease and PPA contracts to unify asset origination across developers and mitigate due diligence requirements. Solar developers that have adopted these contracts include SolarCity, Clean Power Finance, Sunrun, Sungevity, OneRoof Energy, and others (NREL 2015). These documents were also used as a basis for New York Power Authority’s K-Solar program, resulting in that utility receiving the Public Power Utility of the Year award.60
60 “Utility and Solar Industry Collaboration Accelerates Solar Growth,” Bob Gibson, Solar Electric Power Association, https://www.solarelectricpower.org/utility-solar-blog/2015/september/utility-and-solar-industry-collaboration-accelerates-solar-growth.aspx, September 3, 2015.

43 This report is available at no cost from the National Renewable Energy Laboratory (NREL) at www.nrel.gov/publications.
SAPC has also released best practice guidelines for residential system installation and O&M, and it is drafting guidelines for the commercial sector. These are intended to promote the sound, standardized development and operation of solar assets so investors can have a high degree of confidence in the long-term performance of systems and the securities backed by them. This effort is proceeding in coordination with similar best practice activities conducted by other stakeholders, such as Sandia National Laboratories.
Standardized practices and documents provide better transparency and more efficiency when structuring a transaction, because they allow financiers to better and more quickly understand the risks of a project or portfolio of projects. However, standardization efforts do not necessarily demonstrate the historical performance of solar systems or customers. To assess the risks inherent to PV assets effectively, and to ensure optimal credit ratings for solar securities, the market requires extensive amounts of data on system and customer performance. To address this need, DOE also funded NREL to partner with SunSpec—an industry-leading association of monitoring, component, and development entities—to build the Open Solar Performance and Reliability Clearinghouse (O-SPaRC) database, which provides performance information from thousands of systems across the United States. The database is designed to improve access to low-cost financial capital by providing credit rating agencies and investors a storehouse of information to conduct their analyses and get comfortable with the solar asset class.
The truSolar Working Group was also formed in 2012 by a number of companies in the solar industry to create risk-scoring criteria and methods, with the objective of helping investors and developers share a transparent risk screen. There is wide variation in the technical characteristics of commercial systems, the buildings on which they are sited, and the credit information of potential hosts. The truSolar scoring criteria aim to be the Kelley Blue Book for solar by providing potential financiers the data they require to properly evaluate the risks and return of an investment in commercial PV.
Ratings agencies, such as Standard and Poor’s, Moody’s, Fitch, and KBRA, which have participated in both working groups, have also released guidelines, reports, and ratings on the solar industry as well as portfolios of PV projects (Fitch Ratings 2012, 2015a, 2015b). These documents have created more of a common framework that investors can draw upon to assess risk. The solar securities products have also allowed the industry to develop procedures to make offerings and better articulate the criteria necessary for a solar system to be considered in such an offering. This was facilitated through additional work from SAPC members, which developed mock filings for pools of residential leases and commercial PPAs to foster dialogue with the ratings agencies and the solar community. The ratings agencies also have collected and published historical performance from several recent ABS offerings (Kroll Bond Rating Agency 2015). These documents provide historical consumer data for tens of thousands of systems, including the rate of default, reassignment, and renegotiation of TPO contracts; average PPA rate; contract rate escalator; length of contract; and FICO score.

44 This report is available at no cost from the National Renewable Energy Laboratory (NREL) at www.nrel.gov/publications.
Through access to production and financial performance, these companies have been able to report relatively low risks and good performance for the aggregated systems. For example, in discussing Sunrun’s recent ABS, Kroll reported that “the Company’s portfolio performance has been exceptional with cumulative losses totaling less than 1% and aggregate uncollected billings less than 1.5%. Despite limited operating performance, KBRA believes the portfolio’s strong performance is a reflection of the Company’s underwriting, loss mitigation and collection practices” (Kroll Bond Rating Agency 2015). Because the products are still relatively new, certain risks remain. For example, Standard & Poor’s (S&P), reporting on the first SolarCity ABS, stated that, “because this asset class has a limited operating history, we expect the rating to be constrained to the low investment-grade range for the near future” (Standard & Poor’s 2014). However, it appears investors (and rating agencies) are getting more comfortable with the risks, because with each raise credit scores are increasing, companies are able to raise more funds with a higher advance rate, and interest rates have fallen. This can be seen in Table 4 in the difference between SolarCity’s ABS raise in November 2013 versus its ABS raise in August 2015. It can also be seen in MidAmerican Energy’s initial bond offering of its Solar Star project in June 2013 versus its second bond offering for the same project in March 2015.
Table 4. Initial Bond Raise versus Latest Bond Raise, SolarCity and MidAmerican Energy
Issuer SolarCity (portfolio of projects) MidAmerican Energy (Solar Star)
Issue date Nov. 13 Aug. 15 Jun. 13 Mar. 15
Bond size (millions) $54.4 $123.5 (two tranches) $1,000.0 $325.0
Bond coupon 4.80% 4.41% (weighted average) 5.375% 3.950%
Credit rating BBB+ A/BBB Baa3/BBB-/BBB- Baa3/BBB/BBB-
Advance rate 62% 68% N/A N/A
Bold text denotes improvements in market. All dollars in this table are quoted in nominal terms.
Sources: Puttré 2015b, Reuters 2013, Kidney 2015, Business Wire 2013, Berkshire Hathaway Energy 2015
This valuable information is obtained from some of the leading installers in the industry, which demonstrates another important change that has occurred in the past five years: several large developers, sponsors, equipment manufacturers, and lending and other financial institutions now have access to data from tens or hundreds of thousands of PV systems each. These data include technical performance of equipment, system configuration, and installers as well as financial customer performance. While these data are not necessarily available to the public at large, those with access to these data can more easily demonstrate the risk profile of solar as an investment and more quickly raise a larger amount of lower-cost financing.
Private companies have also formed to collect data, evaluate technology risk, and provide standardization for the solar industry. For example, kWh Analytics, Mercatus, and DNV GL have all been engaged in data collection and reporting standardization as well as providing the solar sector with better risk assessment, similar to what has been created in other market sectors (e.g., CoreLogic, FICO). kWh Analytics, a SunShot Initiative grant recipient, provides PV asset performance data and risk analytics to institutional investors and solar industry participant firms. As of June 2015, it claimed to have the industry’s largest independent database of solar

45 This report is available at no cost from the National Renewable Energy Laboratory (NREL) at www.nrel.gov/publications.
production data.61 Mercatus has developed a software tool that creates a credit score for PV projects, or portfolios of PV projects, looking for financing. This standardized due diligence process allows developers and financiers to more quickly and transparently understand the risks of projects and move forward with agreements. DNV GL is an independent engineering firm that performed technical evaluation on SolarCity’s and Sunrun’s securitizations.
There still exists a need for more standardization and data within the industry to further streamline financial transactions and provide a better risk profile of all solar investments. While the residential market has had great success, the commercial PV market still faces significant barriers to further standardization and data collection.
4.3 Consolidation and Vertical Integration Larger companies can generally raise capital at cheaper rates, while vertically integrated companies generally have more operational levels at which to do so. It is perhaps not surprising, then, that the solar industry has been consolidating as it grows. Some of the biggest names in solar—such as SunPower, First Solar, and SunEdison—represent the amalgamation of smaller companies acquired over time as each company vertically integrated. These companies can optimize their financing at each level of the value chain, e.g., corporate finance for upstream manufacturing activities; balance sheet finance for engineering, procurement, and construction activities; project finance as needed for tax credit monetization; and even YieldCo finance for long-term project ownership. SunPower and First Solar have even realized the advantages of forming a joint YieldCo, 8point3 Energy Partners, to own some portion of their respective operating utility-scale PV projects. The risk-reduction benefits of diversification enable this joint YieldCo to raise capital more cheaply than either individual company could with separate YieldCos.
In the distributed PV market, ABS issued to date by the largest vertically integrated third-party owner—SolarCity—have reduced (but not eliminated) its need to raise and incorporate expensive third-party tax equity into its Inverted Lease and Partnership Flip structures. Similarly, its size, nationwide presence, general name recognition, and financial acumen all enable SolarCity to raise low-cost corporate debt directly from the public, by issuing Solar Bonds on its website. Finally, its recent foray into manufacturing PV modules (with its acquisition of Silevo) leaves SolarCity even more integrated, reducing module supply and price risk.
Consolidation is even occurring among financial service providers. For example, Clean Power Finance, which has focused primarily on arranging tax equity for smaller residential installers, recently merged with Kilowatt Financial, which has focused primarily on loan financing. The combined firm, Elevate Power, will offer a full suite of financial products to its clients.
Further consolidation is expected over the next few years as the market becomes more competitive in the face of declining incentives. As companies grow through vertical or horizontal integration and organic growth, and as bigger companies enter the solar space, the range of financing options available to these companies will broaden beyond just project finance.
61 “US Solar Electricity Production 50% Higher than Previously Thought,” Jason Kaminsky and Justin Baca, Greentech Media, http://www.greentechmedia.com/articles/read/us-solar-electricity-production-50-higher-than-previously-thought, June 30, 2015.

46 This report is available at no cost from the National Renewable Energy Laboratory (NREL) at www.nrel.gov/publications.
4.4 Addressing Real Estate Issues Real estate issues fall into three main categories: 1) the compatibility of residential PACE loans with first mortgages, 2) the incremental value a host-owned PV system can add to a home, and 3) the characterization of residential PV systems as either personal property or fixtures and how that determination impacts various real estate transactions.
In mid-2010, residential PACE financing ground to a halt when the FHFA, which oversees the two largest holders of first mortgages in the United States (Fannie Mae and Freddie Mac), voiced concern over the first-lien status of residential PACE loans. Since then, some state and local PACE programs have attempted to sidestep the issue by establishing loan loss reserve funds and/or requiring PACE loans to be subordinate to first mortgages (presumably to the detriment of the interest rate that PACE loans can offer). In general, however, the issue of priority lien status has remained a barrier to PACE implementation, at least at the residential level.
Potential resolution appeared to be forthcoming in August 2015, when the FHA (which is distinct from the FHFA) announced it was developing lender guidance that would clearly subordinate PACE loans and therefore make it possible for homeowners with FHA mortgages to refinance or sell their homes without having to first pay off the PACE loan. Though the FHFA had not yet taken similar steps at the time of writing, it has reportedly been in communication with the FHA over these issues, engendering a sense of optimism that full resolution may be on the horizon.
Progress has also been made in estimating the incremental value that host-owned PV adds to homes and incorporating that value into real estate appraisals. Since 2008, at least seven studies using various methods have estimated the impact of host-owned rooftop PV systems on home values (Hoen et al. 2015, 2013, 2011; Desmarais 2013; Dastrup et al. 2012; Watkins and Associates 2011; Farhar 2008).62 All seven found evidence that homes with host-owned PV systems sell at a premium to comparable homes without PV.
From a finance perspective, however, the trick is to capture this premium properly in home appraisals so sellers/host-owners can realize the additional value and buyers can borrow against it. To that end, researchers at Lawrence Berkeley National Laboratory and Sandia National Laboratories have been working with the Appraisal Institute (the global trade association of real estate appraisers) and others to educate appraisers on how to value host-owned PV systems. One result of this process has been the development of PV Value®, a free financial tool that appraisers and others can use to estimate the value of a host-owned home PV system.
This issue came to the fore in December 2014 when Fannie Mae released the latest edition of its “Selling Guide” for single-family homes (see Section 3.3.2.1). This formal acknowledgment of the value a host-owned PV system can provide enables prospective homebuyers to finance their purchase more easily through a low-cost, tax-deductible mortgage.
Finally, there has been some uncertainty over whether rooftop PV systems are considered personal property, real property, or fixtures (which fall somewhere in between personal and real property). At issue is whether the value of a PV system should be included in a home appraisal
62 Surprisingly, this same question has barely been explored for TPO systems.
47 This report is available at no cost from the National Renewable Energy Laboratory (NREL) at www.nrel.gov/publications.
as well as who has legal claim to the system in the event the homeowner defaults on the mortgage. Third-party owners assert that TPO systems are their own personal property (not the homeowners’) and therefore should not be considered in appraisals or used as collateral for mortgages. In some states, however, real estate law may treat a PV system as a fixture that is so closely related to the real property of the house that it, in effect, becomes a part of that real property.63 Muddying the issue somewhat is the fact that host-owned systems are generally considered to be a part of the real property, so they should be included in appraisals and can be used as collateral to increase debt limits. Appraisers, TPO providers, mortgage holders, and housing authorities are confronting and addressing these issues as increasing numbers of homes with PV systems naturally begin to change hands with time; that said, because federal and state laws are not necessarily consistent, different sections of law and statute do not necessarily have to be internally or externally consistent (and often are not) on the definition of real and personal property.
Looking ahead, the SunShot Initiative is currently funding work to explore ways residential PV system characteristics could be automatically populated into real estate listings covered by multiple listing services (MLS). At present, a PV home can only be identified in non-searchable comment fields that are voluntarily populated by realtors. This shortcoming makes it hard for realtors and appraisers to identify solar homes and extract accurate information for use in valuations, and it presents barriers for buyers seeking a PV home. Greater transparency through the MLS should facilitate a more accurate realization of a PV system’s value during the home sale and financing processes.
4.5 Addressing Net-Metering Barriers How owners of solar generation are compensated for energy production can have a large impact on how a project is financed. A change in business model or compensation structure can alter the certainty and length of project cash flows. Many of these changes are detailed in the On the Path to SunShot technical report Challenges and Opportunities Associated with Utility Regulatory and Business Model Reforms (Barbose et al. 2016). This section briefly highlights some of the recent rate-reform activity that could impact U.S. distributed PV systems.
Utilities in the United States have historically used net metering to credit customers for energy fed into the grid from onsite PV systems (unlike most of Europe, which has used feed-in tariffs). As discussed in Section 2.2.7, net metering typically values this energy at the retail energy rate, with solar energy usually credited at a higher value in rate structures with lower or no demand or customer charges (such as most residential rates). Many states limit the number of customers who can participate in a net-metering program, capping solar deployment through a variety of methods.
Many states have continued to raise net-metering caps over time. “Over the past decade, 15 states have increased net metering caps, and several states have made multiple adjustments to the cap level over time. Often this has been done to align with solar policy goals or when utilities
63 “Residential Solar and the Uniform Commercial Code: A Primer on Solar-Financiers’ Rights in a Home Foreclosure,” Travis Lowder, National Renewable Energy Laboratory, Renewable Energy Project Finance Market Insights, https://financere.nrel.gov/finance/content/residential-solar-and-uniform-commercial-code-primer-solar-financiers-rights-home-foreclosur, April 14, 2015.

48 This report is available at no cost from the National Renewable Energy Laboratory (NREL) at www.nrel.gov/publications.
have reached the cap levels. In 2014, Massachusetts, South Carolina, and Vermont have sought to increase net metering” (Heeter, Gelman, and Bird 2014). It is estimated that by 2018, several states could reach current cap levels (Heeter, Gelman, and Bird 2014); therefore, continued expansion of the distributed solar market may depend on support for further net-metering cap adjustments or a shift to new utility business models or compensation structures.
Not all stakeholders have supported the growth of net metering. As solar deployment has increased, many utilities and consumer advocates have argued that net-metering customers are not paying their proportional share of the cost to maintain and access the grid on which they are reliant, particularly in residential rate structures that do not have demand or fixed charges. Vote Solar found that, as of November 2014, a dozen states were considering changes to net metering or related rate designs, but none had been enacted yet (IREC and Vote Solar 2014).64
This uncertainty creates financial risk for current PV projects and those in development. Recently, some states and jurisdictions have proposed or enacted tariffs or other rate credit mechanisms, attempting to base the credit a customer receives for exported solar energy on the costs and benefits of that energy to the grid; these structures are often called VoS tariffs.
In shifting to this model, there is potential for more long-term stability in benefits, because it can be argued that the rate is more sustainable than traditional net metering (as the energy is valued properly). However, there is a significant range in the estimated value of this energy, depending on what is included in these estimates, how it is estimated, and what period is being examined (Hansen, Lacy, and Glick 2013). Because the calculated value might change over time, there is uncertainty in future benefits and thus a potentially more difficult financing environment.
In addition to rate structure innovation, companies and utilities have recently begun introducing technical innovation to create more certainty to the value of PV energy. Relying on the grid to use excess solar energy creates a level of risk that can be mitigated if that energy is, instead, used on site. To that end, there has been effort to introduce technologies that either shift electricity demand to align better with solar production or store energy for use at a later time (ideally to cut demand charges or for use when grid energy is particularly expensive). Alternatively, PV systems can be designed at smaller capacities so energy is never (or rarely) exported. This might prove difficult for many residential markets, given that solar produces the most in the middle of the day when many people are away from their houses; however, it is feasible in much of the commercial sector.
Solar can provide other benefits to the grid with the proper equipment and financial incentives. These include, but are not limited to, demand response, reactive supply and voltage control, and regulation and frequency response. Many U.S. utilities are considering how they can implement systems to coordinate with PV system operators and use their PV system equipment to operate the grid more effectively. This would benefit system owners as well by providing another revenue stream.
64 There has been movement on net-metering changes since November 2014. For example, in October 2015 Hawaii replaced its net-metering program for new participants with a program that would credit customers for excess generation at less than retail rates. In December 2015, the California Public Utilities Commission released a preliminary decision that would charge new customers a one-time interconnection fee and small monthly fees for non-bypassable charges (among other things).

49 This report is available at no cost from the National Renewable Energy Laboratory (NREL) at www.nrel.gov/publications.
4.6 Community Shared Solar, Virtual Net Metering, and Corporate Offtake Agreements
Despite tremendous growth in the U.S. solar market over the last decade, PV business models and regulatory environments historically have not been designed to provide access to a significant portion of potential PV customers. As a result, the economic, environmental, and social benefits of distributed PV are limited to a select number of customers. Traditional distributed solar models typically rely on the decision by individual home or building owners to adopt PV systems. Optimal customers for hosting rooftop-mounted systems have ample unshaded roof space relative to their energy consumption, unilateral decision-making authority regarding that roof space, and high credit scores to enable low-cost financing. Functionally, these restrictions limit solar market participation to a minority of residential and commercial energy consumers. A recent report estimated that 49% of households and 48% of businesses cannot host a PV system of adequate size on their property (Feldman et al. 2015).
While the half of households and businesses that can go solar is still significantly larger than the PV market’s current installed capacity, distributed deployment strategies only directed at onsite, single-customer systems limit the speed and flexibility at which PV can be deployed in the United States, and they potentially increase the cost. As customer demand for solar increases, so does the impetus to develop innovative business models and utility programs that can enable and retain direct participation from all types of energy consumers.
Three strategies have been growing in the United States to solve some of these issues: virtual net metering, community shared solar (or community solar), and corporate offtake agreements.65 As of June 2015, at least one of these policies had been adopted in 15 states (Figure 6).66
65 Another innovative solar program that takes advantage of community involvement has been developed recently, called “community solar” collective-purchasing (or community group purchasing). In these programs, sometimes also referred to as “solarize” campaigns, community members band together to buy separate PV systems collectively. Through bulk purchasing, community members can receive lower-priced systems because of their stronger buying power and the lower costs installers and developers achieve by developing a group of projects at once. 66 A third revision to net-metering policies is called “aggregated net metering” (also known as “NEM aggregation”), which allows a customer with multiple meters on one property, or adjacent properties, to net solar energy fed back into the grid on multiple meters. This allows customers the flexibility to interconnect a PV system to the grid at the optimal site and use the net-metering credits across multiple meters (such as with a group of university buildings).

50 This report is available at no cost from the National Renewable Energy Laboratory (NREL) at www.nrel.gov/publications.
Figure 6. States with virtual or community solar legislation
Source: GTM Research 2015b
Virtual net metering (see Section 2.2.8) solves many of the technical and financial obstacles traditionally faced by non-residential customers in particular. For example, Staples sees virtual net metering as a strategy to mitigate the risk of a long-term energy contract at a particular location: with virtual net metering, it can have a PPA with a system owner to provide solar electricity to a number of facilities within a region and, if it closed one store, it could simply use the power at a different location within that region. Virtual net metering also eliminates the need to negotiate with landlords for use of the roof in retail locations (Feldman and Margolis 2014).
Shared solar business models use virtual net metering, or similar bill credit mechanisms, to allow multiple energy consumers to share the electricity benefits of one PV array. In addition to removing the need for a spatial one-to-one mapping between distributed PV arrays and the energy consumers, as is the case with traditional net metering, shared solar arrays aggregate multiple sources of energy load, making no customer too small for PV. These two factors effectively expand the potential customer base for PV to 100% of homes and businesses. By aggregating customer demand, shared solar programs can reduce financial and technical barriers to entry and reduce costs via economies of scale. Separating energy assets from customers’ residences or businesses also leads to a number of benefits. In the event a shared solar customer moves, his or her solar share can be transferred separately from his or her residence to a new home within the same utility service territory or sold to another entity. Shared solar arrays allow for increased siting flexibility: strategic placement on sites such as commercial rooftops, brownfields, and municipal land can aid local economic development. With utility input, strategic deployment can also aid grid integration. For utilities, shared solar arrays can function as a more streamlined and visible electricity-generating source than many smaller systems. By engaging community stakeholders, shared solar can help build community assets.
51 This report is available at no cost from the National Renewable Energy Laboratory (NREL) at www.nrel.gov/publications.
By opening the market to these customers, shared solar could represent 32%–49% of the distributed PV market in 2020, growing cumulative PV deployment in 2015–2020 by 5.5–11.0 GW and representing $8.2–$16.3 billion of cumulative investment (Feldman et al. 2015). Although this estimate represents a very large increase in PV deployment, several factors not quantified in this analysis suggest the actual potential of shared solar in the United States could be even larger.67 Shared solar programs have already expanded greatly over a short period, from 2 MW in 2008 to 66 MW in 2014; in the next two years, GTM Research expects a sevenfold increase, bringing total capacity close to 0.5 GW by 2016 (GTM Research 2015b).
From a financing perspective, there are several benefits to virtual net metering and shared solar. By separating the system from the energy load, installers no longer need to build systems on suboptimal sites, decreasing the risk of property damage and increasing a system’s performance. Further, credit risk is reduced because a system owner is no longer limited to selling energy on site (or at a significantly reduced price to the utility) or relocating the system (which has a cost that would significantly affect the rate of return). If a customer, or group of customers, defaults on a contract, the system owner can sign a new contract with anyone in the electricity service territory.
Shared solar has additional financial benefits, because projects can diversify risk through multiple customer contracts. Further, individual shared solar projects can contract energy in smaller blocks, reducing the risk of any individual contract while maintaining the economies of scale—and thus the reduced costs and time requirements—of a large facility.
Another related and increasingly popular way for corporate entities in particular to capitalize on the economies of scale and efficiencies of larger offsite projects is through corporate offtake agreements, either directly with project sponsors or through a growing number of utility programs, such as NV Energy’s Green Energy Rider program or Duke Energy’s Green Source Rider program. Google, Apple, and Walmart are just three of a growing number of corporate offtakers that have contracted directly for the output of remote utility-scale solar projects. Under the NV Energy and Duke programs, meanwhile, the utility plays the role of offtaker and passes the solar electricity through to the corporate purchaser, who in turn pays the PPA price plus (or possibly minus) the amount by which the PPA price is above (or possibly below) the utility’s avoided cost projections. Apple and Switch are two examples of companies that have recently taken advantage of NV Energy’s program to create demand for new utility-scale solar projects in Nevada.
67 These factors include easier and less restrictive participation, a better value proposition through economies of scale, and the ability to service a much higher share of customer load. Additionally, the data used in the analysis may overestimate the number of buildings that can host a PV system, because these data do not take into account roof age, condition, and building material, which may prevent some buildings from installing PV, at least in the short term.
52 This report is available at no cost from the National Renewable Energy Laboratory (NREL) at www.nrel.gov/publications.
5 Shifting to Long-Term, Steady-State Financing This section diverges from the past and present focus of the previous sections by looking ahead several years to when the industry has moved beyond near-term challenges and achieved long-term, steady-state financing that is likely to be less specialized and much simpler than today’s highly structured finance environment. This vision of stability and normalcy requires several assumptions about long-term market conditions:
• Upfront installed prices will fall to SunShot target levels of $1.1/WDC for utility-scale PV (fixed-tilt), $1.2/WDC for utility-scale PV (one-axis tracking), $1.3/WDC for non-residential distributed PV, and $1.6/WDC for residential PV by 2020.68 At these prices, a 4-kW PV system will cost just $6,400, in the same price range as a used car, lawn tractor, or high-end stove and similar to annual contribution limits for individual retirement accounts.
• State and federal tax credits and rebates will be dramatically reduced or eliminated. Solar will no longer be heavily subsidized, and tax appetite will be less of a constraint.
• An ongoing and significant increase in capacity additions will lead to changes in how distributed PV is compensated. Net metering as we know it today (i.e., with compensation for net energy at the full retail rate) will likely be a thing of the past.
Under these new long-term conditions, solar may no longer be so “unique” from a finance perspective. Instead, utility-scale solar will look a lot more like conventional generation assets, non-residential solar will look much like other capital improvements such as a new roof or an efficiency upgrade, and residential solar will look much like buying an expensive appliance. It stands to reason that, upon reaching this point, solar will be financed in a similar way as these other more-mature assets as well.
In this light, this section examines how these other, more-mature asset classes are financed and what that might mean for solar in the long term. Despite the similarities between solar and these other assets under the assumed future conditions, solar will still be unique in ways that could impact financing; these differences are highlighted in Section 5.1. The remaining subsections focus specifically on what this new long-term financing might look like for central or utility-scale solar, non-residential distributed solar, and residential solar.
5.1 Inherent Differences Between Solar and Conventional Generation Assets
This section briefly reviews those characteristics of solar power that—at least from a finance perspective—will continue to differentiate it from other more-conventional generation assets, even under the long-term, steady-state conditions laid out above. These characteristics fall into three main categories: development and construction risk, operational risk, and the possible continued need to monetize tax benefits.
68 The SunShot targets refer to those stated in Woodhouse et al. (2016) and represent an update from those originally stated in the SunShot Vision Study (DOE 2012). Prices are quoted in 2015 dollars (as opposed to the original targets, benchmarked in 2010 dollars) and were derived from an updated set of technological and market assumptions.
53 This report is available at no cost from the National Renewable Energy Laboratory (NREL) at www.nrel.gov/publications.
5.1.1 Development and Construction Risk Compared to a conventional generating asset like a natural gas-fired CCGT plant,69 a utility-scale solar project typically faces significantly less development and construction risk. This is particularly true for PV projects in the 20–50 MW range, which can be developed and constructed relatively quickly, while projects that are 500 MW or larger—a few of which have been built in recent years (and which more closely approximate the size of a typical gas-fired power plant)—may face greater risk.70 Smaller projects can often interconnect to the grid in locations where larger projects cannot, and PV projects in general do not need to be located near gas supply. With no emissions, noise, or moving parts, PV projects can often be permitted relatively quickly (again, compared to gas-fired generators). PV’s modularity allows the developer to adjust the project size easily to the site conditions or in response to permitting issues that arise, thereby providing a degree of development flexibility that is not available to gas-fired generators working with discrete turbines.
This risk differential can impact the cost, or even availability, of construction finance, because credit rating agencies take both construction and operational risk into account when assigning credit ratings. For example, when assessing construction risk, S&P considers a smaller PV project to be a “simple building task,” a larger PV project (or an onshore wind project) to be a “moderately complex building or simple civil engineering task,” and a CCGT plant as a “civil or heavy engineering task” (D’Olier-Lees and Berberian 2015). These assessments contribute to better ratings for solar projects, which should have an easier time than CCGT plants obtaining competitive financing for development and construction finance—particularly under the long-term steady-state conditions where there is a steady market for solar energy because of its low cost.
5.1.2 Operational Risk Power plants are subject to a broad array of operational risks that can impact financing terms. Some of these risks are more applicable to solar than to conventional generators, while others are less applicable (or not applicable at all) to solar.
Variability and curtailment risk apply more to solar. The fact that solar output is variable and weather dependent, for example, limits the amount of debt that a solar project can raise71 and could reduce the amount of revenue available, for example, from capacity markets (to the extent that solar is not able to provide dependable capacity owing to weather variability). Similarly, as solar penetration increases, each new solar project will (absent storage) face greater curtailment risk due to potential over-generation situations during the middle of the day; developers are
69 Nuclear and coal-fired power plants are not considered here, since (with very few exceptions) they are currently considered too risky to finance. Even if deemed financeable, they would take considerably longer to develop and construct than a CCGT, which makes a CCGT plant a sufficient point of comparison. 70 However, unlike conventional or CSP power plants, these very large PV projects can be brought online in multiple stages, which reduces their risk somewhat. 71 Project-level term debt is sized such that under a P99 (worst-case) scenario, there is still enough cash generated by the project to service debt (i.e., the P99 debt service coverage ratio equals 1.0). Because solar generation is variable and uncertain, the P99 output projection is significantly below the P50 (median) projection. With less uncertainty, the P99 projection would be higher, which would allow for more leverage. Resource uncertainty affects wind generation even more than solar generation; all else equal, solar projects can typically raise more debt than wind projects.

54 This report is available at no cost from the National Renewable Energy Laboratory (NREL) at www.nrel.gov/publications.
starting to allocate economic curtailment risk contractually.72 In addition, over-generation from solar will eventually suppress wholesale power prices midday, thereby reducing the value of each new incremental solar project (absent storage). These are risks that, for the most part, do not impact conventional gas-fired generators that have a high degree of control over when (or when not) to generate power.
In other cases, solar is less risky than conventional generation. For example, though weather dependent, solar consumes no fuel and so does not face fuel-related risks like the risk of supply interruption or rising prices—both of which have affected wholesale power markets in recent years, despite the abundance of natural gas unlocked by hydraulic fracturing techniques.73 With no emissions or other potentially harmful byproducts to speak of, solar faces much less environmental risk than other forms of generation, such as nuclear (possible radiation leaks, uncertainty over how and where to store spent fuel), coal-fired generation (CO2 and other emissions, coal ash disposal), hydroelectricity (impoundments that adversely impact rivers and land), and natural gas-fired generation (CO2 and other emissions, risks to groundwater from hydraulic fracturing).
Regulatory risk cuts both ways. Fossil-fueled generation, for example, faces significant regulatory risk from the possibility of new or tightened environmental regulations (such as a carbon tax, or even the EPA’s Clean Power Plan). Solar generation, meanwhile, faces the risk that supportive policies or regulations (e.g., state RPS policies, net metering, and utilities’ PURPA obligations) could be revoked or altered in a detrimental manner.
In weighing these and other operational risks, S&P finds that a typical solar project will face less overall operational risk than will a typical CCGT plant. For example, S&P’s “operations phase business assessment” (OPBA) reflects the overall business risk profile of a project, comprising a combination of performance risk, market risk, and country risk (D’Olier-Lees and Berberian 2015):
• Performance risk combines operational stability with resource risk. S&P typically assigns solar projects an operational stability rating of 2 (because operations are relatively simple, with no moving parts), compared to 4 for onshore wind and 5 for a CCGT plant (a lower number is more favorable). Assuming a credible resource campaign, S&P typically considers solar’s resource risk to be “modest” (one step above “minimal”).
• Market risk is generally not applicable to solar at present, because most solar projects are contracted long term, which stands in contrast to most CCGT plants.74
• Country risk is irrelevant in this case since we are focusing solely on the United States. 72 For example, PPAs may limit the number of hours per year that a project can be curtailed (for economic reasons) without being compensated. This compromise provides the offtaker with needed flexibility, while also limiting the generator’s revenue risk. 73 For example, in early 2014 a severe cold snap left the New England grid strained and unable to source enough natural gas as heating demand spiked. This gas shortage sent wholesale power prices through the roof for several days in a row. 74 Under the future long-term, steady-state conditions laid out above, however, long-term contracts may not be the norm for solar, in which case solar might face a similar degree of market risk as CCGT plants. In fact, solar may even face greater market risk, given that CCGTs are, to some extent, naturally hedged against wholesale power price volatility, to the extent that it is driven by underlying fuel costs.

55 This report is available at no cost from the National Renewable Energy Laboratory (NREL) at www.nrel.gov/publications.
Barring special circumstances that might skew its assessments in one direction or another, S&P’s overall OPBA rating for solar is likely to be in the neighborhood of 3 (on a scale of 1 to 12, with lower numbers being more favorable), while a CCGT plant would likely be a 5 (D’Olier-Lees 2015, pers. comm.).75 In other words, solar projects face relatively low operational risk compared with conventional generation projects (or even other renewable generation projects) and are increasingly being recognized as such by ratings agencies and others. This recognition facilitates access to lower-cost capital.
5.1.3 Continued Need to Monetize Tax Benefits The long-term steady-state conditions assume that federal and state solar incentives have been reduced or even eliminated. That said, for the Section 48 commercial ITC, business-as-usual means a 10% ITC (rather than the temporary 30% level that has been in place since 2006). Likewise, accelerated tax depreciation (5-year MACRS) is a “permanent” (i.e., until repealed) part of the federal tax code. Hence, even under the long-term, steady-state financing environment envisioned here, monetizing tax benefits—the 10% ITC and 5-year MACRS depreciation—may still be an issue.76
By way of example, a 50-MWDC utility-scale solar project with a tax basis of $1.2/WDC and revenue of 5 cents/kWh would require additional taxable income (i.e., from outside of the project) of roughly $25.5 million in the first year to be able to absorb the first year’s depreciation deduction and the 10% ITC in full.77 This amount drops to about $15.2 million in the second year, $7.8 million in the third year, and $3.3 million in the fourth and fifth years to absorb depreciation deductions fully. While some seasoned sponsors will be able to bring this amount of tax liability to the table (either from existing solar and wind projects whose tax benefits have run their course or from other unrelated business ventures), others will need to decide whether to monetize the benefits through third-party tax equity or carry forward unused tax benefits to future years, until they can be absorbed.
The first option—turning to tax equity for monetization services—should not present a problem. The Section 1603 cash grant program demonstrated that tax-equity investors are willing to invest in solar projects that only need to monetize depreciation; including the 10% ITC should make these projects a little more attractive. In addition, after having invested considerable time and money to establish capabilities in this area, tax-equity investors are likely to continue to look for ways to provide their services, even in a low-cost, low-ITC environment.78 The lower amount of
75 That said, S&P (Ferguson 2015) recently pegged the OPBA of Panda Temple Power’s refinancing of an existing 758 MW CCGT project with some merchant exposure at 11 (out of 12). 76 This is likely not an issue for host-owned residential systems, given that the Section 25D residential 30% ITC is scheduled to expire altogether at the end of 2021, rather than declining to 10%. That said, if a 10% ITC were also made available to residential PV systems that cost $1.6/WDC, a 5-kW system would yield an $800 tax credit—readily absorbable by most taxpayers. 77 This $25.5 million breaks down to ~$8.4 million in additional taxable income necessary to shelter the full first-year depreciation deduction (after accounting for the project’s own taxable earnings and tax-deductible interest expense on project-level debt), plus another ~$17.1 million of taxable income to generate the $6.0 million in income tax liability (assuming a 35% corporate tax rate) needed to absorb the 10% ITC. 78 For example, in response to a question about whether tax equity would still invest in projects under a 10% ITC, one prominent tax-equity investor speaking at a conference recently half-joked that preserving one’s livelihood is a strong motivator that will compel them to find ways to make it work.
56 This report is available at no cost from the National Renewable Energy Laboratory (NREL) at www.nrel.gov/publications.
investment required to monetize a 10% (rather than 30%) ITC should also ease the pressure on the supply of tax equity.
That said, depending on the rates charged by tax-equity investors, even sponsors without tax appetite may be better off in the long term by carrying forward unused deductions and credits until they can be absorbed (Bolinger 2014). Indeed, this is essentially the approach pursued by YieldCos to keep their distributions to investors tax free for many years. While an argument could be made that tax-equity return requirements might decrease under a 10% ITC—e.g., because less investment is required, because competition from self-sheltering will be more intense, or out of self-preservation—others have hypothesized that hurdle rates may actually increase, given that a larger proportion of the tax-equity investor’s return will necessarily come from variable cash revenue, which is riskier than fixed tax benefits (Abrams pers. comm.).
Furthermore, under various tax reform proposals discussed in recent years, both accelerated depreciation and the 10% ITC are at risk. The former would possibly be replaced with some other form of less-advantageous depreciation, while the latter would either disappear or, under some proposals, be replaced with a technology-neutral tax credit. Either of these changes would presumably reduce solar’s overall tax benefits, making them easier to absorb, though some degree of outside tax appetite, or monetization, might still be required in some cases.
In any case, under current law as well as the various tax reform proposals offered to date, tax appetite will not be as much of a constraint as it is at present. However, the potential need for third-party monetization still sets solar apart from conventional generation assets.
5.2 Long-term Central or Utility-Scale PV Finance In the context of the features and risks of solar and conventional generation sources noted above, this section envisions what utility-scale PV finance might look like under the long-term, steady-state financing environment. It begins by reviewing how conventional generation assets are financed, with a focus on gas-fired generation under both IPP and utility ownership, before discussing whether these same approaches might be used for utility-scale PV.
5.2.1 Review of Traditional Energy Asset Finance In today’s electricity market, where existing coal and nuclear plants are starting to be retired and very few new coal, nuclear, or large-scale hydropower projects are contemplated or under development, conventional electricity asset finance means primarily natural gas-fired generation. This section focuses on CCGTs, because simple-cycle combustion turbines that are commonly used as peaking units may only operate for a small percentage of the time.
5.2.1.1 IPP Ownership Several important features of CCGTs influence how IPPs typically finance them, compared to how they currently finance utility-scale solar projects. First, largely because of the underlying volatility and long-term uncertainty of natural gas fuel costs, long-term PPAs with CCGTs are rare (unless structured as a “tolling agreement” whereby the power offtaker, rather than the generator, bears the fuel price, supply, and delivery risk). Instead, short-term PPAs or wholesale power price hedges are more common and can provide at least a few years of revenue certainty. Alternatively, purely merchant exposure to spot wholesale power prices is also possible in some

57 This report is available at no cost from the National Renewable Energy Laboratory (NREL) at www.nrel.gov/publications.
markets like the Electric Reliability Council of Texas (ERCOT) and PJM, where wholesale electricity prices are highly correlated with natural gas prices.79 In these markets, CCGTs are, to some extent, naturally hedged against gas price volatility in the sense that, as underlying fuel costs change, power prices will change similarly.
Second, without the ITC and accelerated depreciation limiting the amount of debt that can be serviced and/or without tax-equity investors prohibiting use of project-level debt altogether, gas-fired IPPs are free to use as much debt as they can to finance CCGT projects. For this purpose, they turn to the bank market or the Term Loan B market (or some combination of the two),80 depending on the risk profile of the project. Banks are generally more conservative and binary in terms of what they will and will not loan against, while the Term Loan B market is more willing to price risk and thus consider projects with merchant exposure (at a higher interest rate).
In combination, these two characteristics of IPP financing of CCGTs—revenue fixed by only short-term PPAs or hedges (or perhaps not all) and a desire to maximize leverage—lead to a typical financing scenario whereby IPP equity (perhaps back leveraged) makes up about 45% of the capital stack, with the remaining 55% coming from a 5- to 7-year loan with only limited amortization (e.g., as low as 1%/year amortization, though greater in practice owing to cash sweeps) and a large balloon payment due at maturity. Presuming the plant maintains its value and interest rates do not increase appreciably, the IPP refinances the loan in advance of maturity for another five to seven years and—after repeating this process a number of times—is rewarded over the long term as the principal is slowly paid off. Owing to the risks involved (e.g., at least some merchant risk, low amortization), the interest rate on the debt is relatively high—e.g., LIBOR plus 550 basis points for one recent refinancing of an operational CCGT with a limited hedge on 600 MW of its total 758 MW.81
5.2.1.2 Utility Ownership In contrast to IPPs using project finance, utilities will typically finance new CCGT (or utility-scale solar) projects on their balance sheets through a combination of corporate debt, equity, and/or cash on hand. Utilities may issue new corporate debt (generally in large blocks for general purposes rather than earmarked for specific projects) a few times per year, but they will issue new equity much less often, instead trying to use cash on hand whenever possible. In regulated markets—which are typically the only markets where utility ownership of generation is still common—a utility’s capital structure and authorized return on equity will be regulated by the state public utility commission, whereas the cost of debt will be determined by the market based on the strength of the utility’s credit rating.
79 PJM has a capacity market, whereas ERCOT does not. The promise of both energy and capacity revenues in PJM can make it easier to build merchant projects there than in ERCOT (although ERCOT is perhaps more in need of new capacity than is PJM, which could manifest in a greater number of periods with high energy prices—the principal means through which fixed costs are recovered in ERCOT). 80 Term Loan B debt is essentially bank debt with fewer covenants and is sold to institutional investors. It is used for projects that do not conform to the more conservative risk profile of the bank market (the Term Loan A market) and typically has higher interest rates and lower amortization than typical bank debt. 81 However, this project had an OPBA of 11 (out of 12) and received a B rating overall (Ferguson 2015). Less risky, higher-rated projects could presumably access cheaper financing.

58 This report is available at no cost from the National Renewable Energy Laboratory (NREL) at www.nrel.gov/publications.
For example, PG&E has a capital structure of 52% equity (at an authorized return of 10.4%) and 48% debt (recently at rates of about 3% for 10-year debt and about 4%–4.5% for 30-year debt), leading to a pre-tax WACC of about 7.3%. These numbers broadly represent investor-owned utilities as a whole. Publicly owned utilities (e.g., municipal utilities or cooperatives) have an even lower WACC, because their equity is financed by their member ratepayers and their debt is tax exempt, which reduces the interest rate required by lenders.82
5.2.2 Modeling the Impact of Financing on Utility-Scale PV’s LCOE IPPs (and their associated YieldCos) currently own the vast majority (> 90%) of utility-scale PV capacity in the United States. Despite the attraction of earning a return on rate-based assets and an ability to raise relatively cheap capital, investor-owned utilities have been slow to own solar projects. The requirement for utilities to normalize solar’s tax benefits generally makes utility ownership less competitive than a PPA with an IPP, and some utilities (in deregulated states) are prohibited from owning generation in the first place. Publicly owned utilities, meanwhile, are unable to use solar’s tax benefits directly themselves, and so—despite being able to borrow at low (tax-exempt) interest rates—generally look to IPPs to monetize those benefits through lower PPA prices.83 Although these barriers surrounding tax incentives could disappear in the long term, steady-state financing environment envisioned in this section, the current default expectation is that the 30% ITC will revert to 10% (rather than being completely eliminated), while accelerated depreciation will remain intact. Under these default expectations, utilities will continue to face these same barriers to ownership (though to a lesser extent), and we would therefore expect IPPs to continue owning the vast majority of utility-scale solar projects in the future.
At $1.2/W, and with (or even without) a 10% ITC and accelerated depreciation, utility-scale solar can be financed in much the same way as IPPs currently finance CCGTs. A CCGT plant also costs around $1.2/W at present, but the bulk of its LCOE comes from fuel costs—a cost that solar does not have to bear. As noted previously, solar is considered by ratings agencies to have less construction and operational risk than typical CCGT plants, suggesting a lower cost of debt. At a lower ITC level, the amount of leverage that a solar project can support is comparable to the approximately 60% seen for CCGTs today (Bolinger 2014). Larger IPPs should be able to absorb the reduced tax benefits under a 10% ITC (and accelerated depreciation) or perhaps pass them through to a YieldCo to shelter distributions from taxation—much as is done today.
The long-term PPAs that currently allow solar to amortize its relatively high upfront cost over time would be less necessary at $1.2/W. For example, wind projects in Texas have been largely competitive with wholesale power prices in ERCOT for a number of years and have long been financed using hedges that are shorter (e.g., 10 years) than most PPAs. As a higher-cost resource,
82 Tax exemption is a double-edged sword, because publicly owned utilities cannot directly benefit from solar’s tax benefits. 83 A hybrid approach, known as a prepaid service contract, has been used for several wind projects but has not yet caught on for solar. This approach involves a publicly owned utility borrowing cheap debt and using the proceeds to prepay a significant portion of its energy payment obligations under a service contract (i.e., PPA) with an IPP. The IPP uses the cheap capital to help build the project and benefits from the production tax credit (for wind) or ITC (for solar) as well as accelerated depreciation, which it passes through in the form of a lower contract price. Usually, once the tax benefits have run their course and vested, the publicly owned utility has an option to buy the project at fair market value (Bolinger 2009).
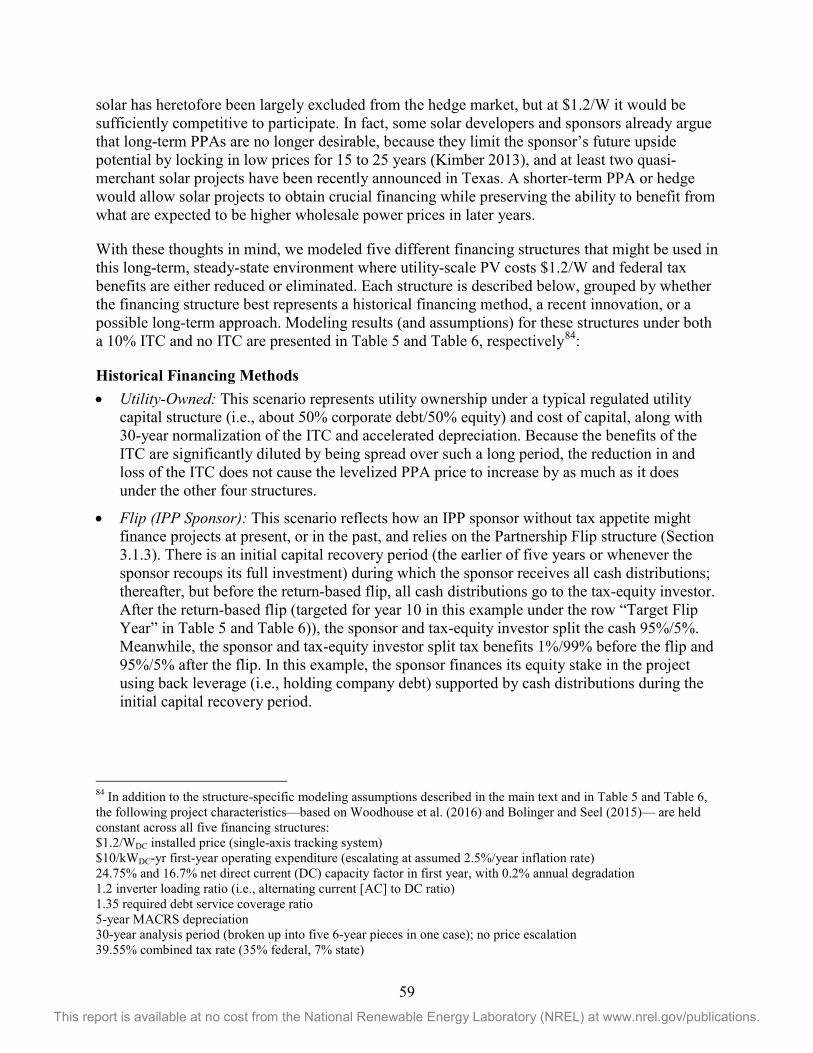
59 This report is available at no cost from the National Renewable Energy Laboratory (NREL) at www.nrel.gov/publications.
solar has heretofore been largely excluded from the hedge market, but at $1.2/W it would be sufficiently competitive to participate. In fact, some solar developers and sponsors already argue that long-term PPAs are no longer desirable, because they limit the sponsor’s future upside potential by locking in low prices for 15 to 25 years (Kimber 2013), and at least two quasi-merchant solar projects have been recently announced in Texas. A shorter-term PPA or hedge would allow solar projects to obtain crucial financing while preserving the ability to benefit from what are expected to be higher wholesale power prices in later years.
With these thoughts in mind, we modeled five different financing structures that might be used in this long-term, steady-state environment where utility-scale PV costs $1.2/W and federal tax benefits are either reduced or eliminated. Each structure is described below, grouped by whether the financing structure best represents a historical financing method, a recent innovation, or a possible long-term approach. Modeling results (and assumptions) for these structures under both a 10% ITC and no ITC are presented in Table 5 and Table 6, respectively84:
Historical Financing Methods • Utility-Owned: This scenario represents utility ownership under a typical regulated utility
capital structure (i.e., about 50% corporate debt/50% equity) and cost of capital, along with 30-year normalization of the ITC and accelerated depreciation. Because the benefits of the ITC are significantly diluted by being spread over such a long period, the reduction in and loss of the ITC does not cause the levelized PPA price to increase by as much as it does under the other four structures.
• Flip (IPP Sponsor): This scenario reflects how an IPP sponsor without tax appetite might finance projects at present, or in the past, and relies on the Partnership Flip structure (Section 3.1.3). There is an initial capital recovery period (the earlier of five years or whenever the sponsor recoups its full investment) during which the sponsor receives all cash distributions; thereafter, but before the return-based flip, all cash distributions go to the tax-equity investor. After the return-based flip (targeted for year 10 in this example under the row “Target Flip Year” in Table 5 and Table 6)), the sponsor and tax-equity investor split the cash 95%/5%. Meanwhile, the sponsor and tax-equity investor split tax benefits 1%/99% before the flip and 95%/5% after the flip. In this example, the sponsor finances its equity stake in the project using back leverage (i.e., holding company debt) supported by cash distributions during the initial capital recovery period.
84 In addition to the structure-specific modeling assumptions described in the main text and in Table 5 and Table 6, the following project characteristics—based on Woodhouse et al. (2016) and Bolinger and Seel (2015)— are held constant across all five financing structures: $1.2/WDC installed price (single-axis tracking system) $10/kWDC-yr first-year operating expenditure (escalating at assumed 2.5%/year inflation rate) 24.75% and 16.7% net direct current (DC) capacity factor in first year, with 0.2% annual degradation 1.2 inverter loading ratio (i.e., alternating current [AC] to DC ratio) 1.35 required debt service coverage ratio 5-year MACRS depreciation 30-year analysis period (broken up into five 6-year pieces in one case); no price escalation 39.55% combined tax rate (35% federal, 7% state)

60 This report is available at no cost from the National Renewable Energy Laboratory (NREL) at www.nrel.gov/publications.
Recent Innovations • Flip (YieldCo Sponsor): This scenario reflects YieldCo sponsorship of a project that includes
tax equity through a Partnership Flip structure. To maximize cash available for distribution to YieldCo investors, there is no sponsor back leverage in this structure. In addition, the allocations of cash among the partners differ from the traditional flip structure described above in the sense that there is no sponsor capital recovery period, and instead the YieldCo sponsor and tax-equity investor split the cash 55%/45% prior to the flip and 95%/5% after the flip.85 The 7% sponsor internal rate of return (IRR) target reflects the YieldCo’s cheaper cost of capital and the unlevered yields that YieldCos have bid for projects as of mid-2015 (Grant and Cornfeld 2015).
• IPP (Long Term): This scenario represents the current status quo for a sponsor with tax appetite—i.e., a long-term (30-year) PPA supporting a capital structure consisting of sponsor equity and 15-year fully amortizing project-level term debt. This scenario is a benchmark against which to compare the other structures. As shown in Table 5 and Table 6, the amount of leverage that can be supported increases from 45% under today’s 30% ITC (not shown) to 59% under a 10% ITC and 66% with no ITC. This shift in capital structure helps to mitigate the increase in LCOE caused by the reduction in and loss of the credit.
Long-Term Approach • IPP (Short Term): This scenario reflects how IPPs have been financing CCGTs (Section
5.2.1.1), assuming it might also work for solar under the long-term, steady-state environment (of $1.2/W installed price and reduced tax benefits). It involves an initial 6-year PPA (or hedge) that supports a 6-year “mini-perm” bank loan with 15-year amortization (requiring a balloon repayment of the outstanding balance). The initial 6-year PPA (or hedge) price is set high enough for the sponsor to achieve its after-tax IRR target in the 6th year, at which point the outstanding loan balance is refinanced for another six years in the Term Loan B market at a reduced amortization rate of 3%–4%/year. With the sponsor’s IRR already having been achieved in the first 6-year period (in part through tax benefits), the PPA price required to service the partially amortizing loan (and provide minimal sponsor distributions, thereby allowing the IRR to drift higher than the target rate over time) drops significantly during the second 6-year term, suggesting that refinancing should not be difficult. This process is repeated three more times, during which the PPA price remains relatively constant as the debt balance is gradually (but not fully) paid off—at the end of 30 years, about 20% leverage still remains (down from about 60%–70% initially).86 The levelized prices shown in the first row of Table 5 and Table 6 reflects the full 30-year period; the required price during the first six years is higher than shown (e.g., $53/MWh nominal in the 10% ITC, high capacity factor scenario), while the required price during the next 24 years is lower than shown (e.g., $24–$33/MWh nominal in the 10% ITC, high capacity factor scenario).
85 This difference in how cash is allocated between this and the traditional flip structure reflects the YieldCo’s desire for stable, long-term cash flows. 86 That said, if revenues were to exceed the minimum PPA/hedge price requirement in any 6-year period, excess cash could pay down the debt principal, perhaps eliminating any outstanding balance at the end of the full 30-year period.

61 This report is available at no cost from the National Renewable Energy Laboratory (NREL) at www.nrel.gov/publications.
The modeling results in Table 5 and Table 6 suggest that, as solar costs decline, IPP sponsors with tax appetite might do well to consider the “short-term” approach taken in the last column (i.e., “IPP [short term]”)—particularly if long-term PPAs and/or long-term, fully amortizing loans are in short supply. This structure also has the advantage of returning the sponsor’s capital and achieving the target IRR relatively early in the project’s life, compared to the long-term approach modeled in the “IPP (long term)” column, where the sponsor’s return is rather limited until the 15-year fully amortizing loan matures. For sponsors without tax appetite, a flip structure financed with relatively cheap YieldCo capital has a lower required levelized price than the more traditional flip structure. Finally, levelized prices increase the least as ITC levels decline under utility ownership, which is simply a reflection of 30-year normalization diluting the tax benefits to the point where they are not worth much to begin with. Under both the 10% ITC and no ITC, Table 5 and Table 6 suggest that utilities will continue to be hard pressed to compete with IPPs—because normalization still applies to accelerated depreciation (irrespective of ITC level) and because a utility’s WACC is limited on the downside by regulatory constraints on leverage, which limits debt to around 50% of the capital stack, compared to about 60%–70% for IPPs under a 10% and no ITC, respectively.
Finally, particularly under the high capacity factor scenario, the levelized prices shown in the first row of Table 5 and Table 6 suggest that, as utility-scale PV costs fall to the SunShot target level of $1.2/W, solar will be capable of maintaining today’s low PPA price levels—even under a 10% ITC or no ITC at all.
Table 5. Utility-Scale Modeling Results Under a 10% ITC and High/Low Capacity Factors
Historical Recent Future
Utility- Owned
Flip (IPP sponsor)
Flip (YieldCo sponsor)
IPP (long term)
IPP (short term)
PPA/ hedge
Levelized Price (Real 2015 $/MWh)
$50.9 – $75.6
$50.9 – $75.6
$41.3 – $61.3
$39.2 – $58.2
$32.0 – $47.6
Term 30 years 30 years 30 years 30 years 5 x 6 years
Sponsor equity
After-tax IRR 10.4% 12.0% 7.0% 12.0% 12.0%
Initial % 52% 60% 57% 41% 37%
Tax equity
After-tax IRR (Target Flip Year)
8% (10)
8% (10)
Initial % 40% 43%
Project debt
Term 30 years 15 years 6 year (x 5)
Interest rate 4% 5.5% 5.5%
Initial % 48% 59% 63%
Sponsor back leverage
Term 5 years
Interest rate 5.50%
Initial % (of sponsor equity)
57%
WACC (after-tax) 6.6% 7.7% 7.8% 6.9% 6.5%
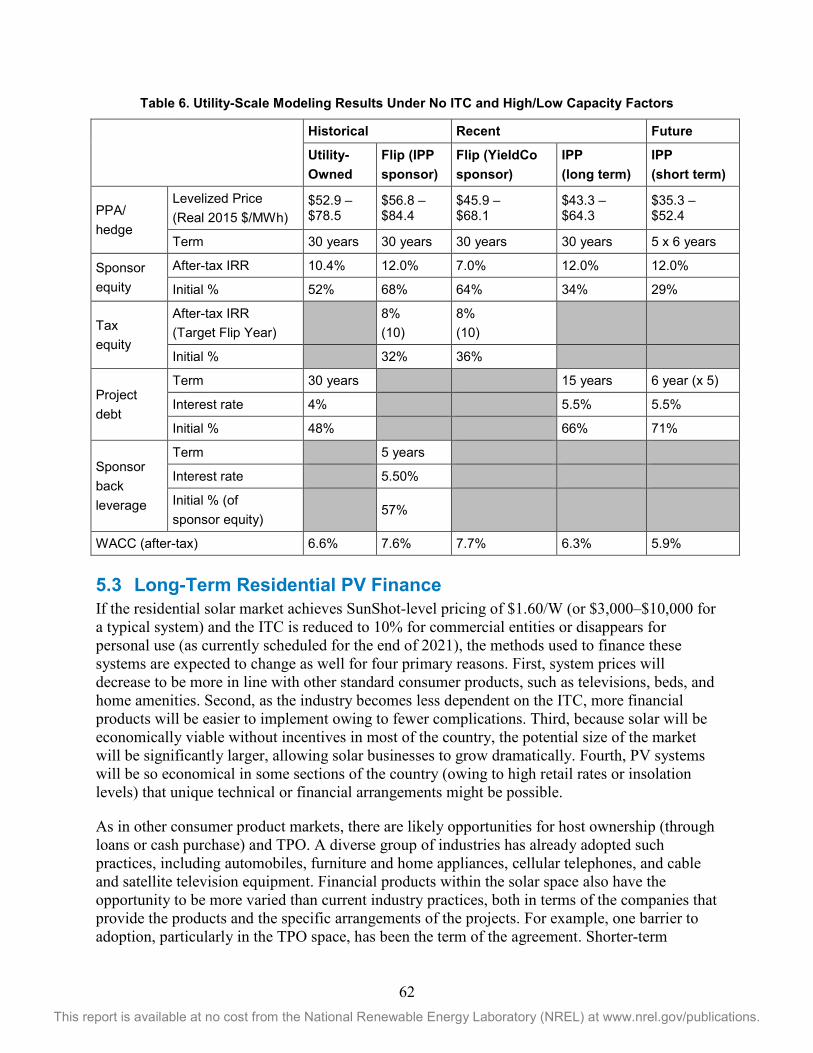
62 This report is available at no cost from the National Renewable Energy Laboratory (NREL) at www.nrel.gov/publications.
Table 6. Utility-Scale Modeling Results Under No ITC and High/Low Capacity Factors
Historical Recent Future
Utility- Owned
Flip (IPP sponsor)
Flip (YieldCo sponsor)
IPP (long term)
IPP (short term)
PPA/ hedge
Levelized Price (Real 2015 $/MWh)
$52.9 – $78.5
$56.8 – $84.4
$45.9 – $68.1
$43.3 – $64.3
$35.3 – $52.4
Term 30 years 30 years 30 years 30 years 5 x 6 years
Sponsor equity
After-tax IRR 10.4% 12.0% 7.0% 12.0% 12.0%
Initial % 52% 68% 64% 34% 29%
Tax equity
After-tax IRR (Target Flip Year)
8% (10)
8% (10)
Initial % 32% 36%
Project debt
Term 30 years 15 years 6 year (x 5)
Interest rate 4% 5.5% 5.5%
Initial % 48% 66% 71%
Sponsor back leverage
Term 5 years
Interest rate 5.50%
Initial % (of sponsor equity)
57%
WACC (after-tax) 6.6% 7.6% 7.7% 6.3% 5.9% 5.3 Long-Term Residential PV Finance If the residential solar market achieves SunShot-level pricing of $1.60/W (or $3,000–$10,000 for a typical system) and the ITC is reduced to 10% for commercial entities or disappears for personal use (as currently scheduled for the end of 2021), the methods used to finance these systems are expected to change as well for four primary reasons. First, system prices will decrease to be more in line with other standard consumer products, such as televisions, beds, and home amenities. Second, as the industry becomes less dependent on the ITC, more financial products will be easier to implement owing to fewer complications. Third, because solar will be economically viable without incentives in most of the country, the potential size of the market will be significantly larger, allowing solar businesses to grow dramatically. Fourth, PV systems will be so economical in some sections of the country (owing to high retail rates or insolation levels) that unique technical or financial arrangements might be possible.
As in other consumer product markets, there are likely opportunities for host ownership (through loans or cash purchase) and TPO. A diverse group of industries has already adopted such practices, including automobiles, furniture and home appliances, cellular telephones, and cable and satellite television equipment. Financial products within the solar space also have the opportunity to be more varied than current industry practices, both in terms of the companies that provide the products and the specific arrangements of the projects. For example, one barrier to adoption, particularly in the TPO space, has been the term of the agreement. Shorter-term

63 This report is available at no cost from the National Renewable Energy Laboratory (NREL) at www.nrel.gov/publications.
financing options, of perhaps 7–8 years, may be offered instead of the standard 15–20 year tenors. This is particularly true in certain markets with favorable conditions.
That said, financing will still depend on the value solar gives to consumers. Therefore, how net metering and rate compensation are decided in each U.S. jurisdiction will, in part, determine a solar project’s ability to receive financing. Wide variation in rate structuring may translate into a wide variety of financing options. The more rates move toward variable pricing, the more challenging it may be to finance PV projects, because volatility increases the necessary rate of return. Another potential future risk is a rise in interest rates from historically low levels. While increased interest rates will likely increase the cost of debt for most new energy generation projects, potentially causing utilities to rely on existing generation until reserve margins become too tight, most industry participants feel that the solar market is still relatively nascent and that a higher prime interest rate will be more than compensated by a compression in interest-rate spreads (i.e. as the solar industry matures the interest-rate spreads on debt for solar projects will fall, counteracting the general increase in the cost of debt) . The following discussion details how host-owned and TPO residential financing options may develop in this new market dynamic.
5.3.1 Host Owned SunShot-level pricing of residential systems would give significantly more homeowners the ability to purchase a solar system. Approximately two thirds of residential systems installed in 2014 had a capacity of 3–5 kW, with an installed price around $13,000–$25,000 (Barbose and Darghouth 2015). As demonstrated in Figure 7, only 10%–20% of the population has enough cash on hand to pay for these systems.87 If residential system prices are reduced to $1.60/W, those same systems would cost around $4,800–$8,000, giving 40% of families the ability to pay for a PV system using available cash on hand.
87 The median system size and price are higher at 6.1 kW and $26,000 in 2014.

64 This report is available at no cost from the National Renewable Energy Laboratory (NREL) at www.nrel.gov/publications.
Figure 7. Median transaction account balance by income level
Transaction accounts include families’ checking, savings, money market, and call accounts.
Source: “2013 Survey of Consumer Finances,” Federal Reserve (Board of Governors of the Federal Reserve System), http://www.federalreserve.gov/econresdata/scf/ scfindex.htm#table1, accessed October 21, 2015.
However, despite the lower price, not many household purchases of that size are financed through cash on hand. Retail companies often set up financing options to facilitate customer purchases (either with their own funds, or more typically through a third-party provider), or consumers use preexisting lines of credit.
Table 7 provides examples of companies offering these products. Just as in these industries, solar companies, from panel manufacturers to integrators, could offer financing. While the tenors of the loans in the other industries are shorter than many traditional solar offerings, this is in part a reflection of lower pricing. At lower costs, solar may be seen as a home upgrade (adding value to a home sales price) rather than an energy purchase. For example, the monthly payments to fully amortize a 0% annual percentage rate (APR), 48-month loan for a $1.6/W 3-kW PV system are approximately $100, similar to monthly payments for other home improvements such as window replacement at $11,198,88 wood flooring at $4,434,89 bathroom remodeling at $11,070, a new dining room at $3,549, or new furniture at $8,926.90 A financial arrangement at current PV costs would either require a significantly longer term (which is not offered for these products) or a significantly higher price, which would significantly restrict the potential customer base.
88 “2015 Cost vs. Value Report,” Remodeling, Hanley Wood, http://www.remodeling.hw.net/cost-vs-value/2015/, accessed October 18, 2015. 89 “How Much Does it Cost to Install Wood Flooring?” Home Advisor. http://www.homeadvisor.com/cost/flooring/install-wood-flooring/. Accessed October 18, 2015. 90 “Slideshow: The Real Cost of Home Improvement,” Ben Steverman, Bloomberg Business, http://www.bloomberg.com/consumer-spending/2012-08-27/the-real-cost-of-home-improvement.html, November 26, 2012, accessed October 18, 2015.
$0.6 $1.5 $3.1 $6.9
$13.5
$51.9
0
10
20
30
40
50
60
Less than 20 20–39.9 40–59.9 60–79.9 80–89.9 90–100
Med
ian
Tran
sact
ion
Acco
unt
Bal
ance
(201
5 $
'000
's)
Percentile of Income

65 This report is available at no cost from the National Renewable Energy Laboratory (NREL) at www.nrel.gov/publications.
If customers were unable or unwilling to finance PV in a short period (with an expense over that period potentially higher than existing energy bills), they could roll the principal into another line of credit. For example, 72% of non-cash financing for home remodeling is done through a bank or credit union (20% through a credit card).91 However, many home remodeling projects are significantly more expensive than future PV costs, ranging from average roof replacement costs of $19,528 to two-story additions costing $161,925.92 Because of the time and expense of obtaining a home-equity loan, very few are obtained explicitly to purchase equipment under $10,000. However, homeowners may use existing home-equity loans or lines of credit to fund a PV system or pay off another, higher-priced lender, when refinancing their mortgage later.
Table 7. Examples of Favorable Consumer Financing Options by Industry
Industry Company(s) Products Market Size
Home improvement
Home Depot (through Citibank); Lowe’s (through Synchrony, formerly GE Capital Retail)
Credit cards offering 0% interest, interest-only financing, or low-interest rate financing (e.g., 84-month fixed payments at 5.99% APR for purchases above $3,500)
23% ($19 billion) of Home Depot net sales in 2014 (Home Depot 2015) 4% ($2.4 billion) of Lowe’s net sales in 2014 (Lowe’s 2015) 2014 Home improvement market sales: $303 billiona
automotive Ally (formerly GMAC)
Retail financing and leasing for new and used GM (63%), Chrysler (17%), and other (20%) vehicles
In 2014 originated $30 billion in loans and $11 billion in leases (Ally Financial Inc. 2015). The auto industry has $886 billion in outstanding loans,b with 85% of new cars and 56% of used cars relying on lease or loan financing. Average term: 36 months (Zabritski 2015), rate 4.56%.c
Furniture Sleepys (Synchrony); Raymour & Flanigan; Bob’s Discount Furniture (Wells Fargo)
Credit cards offering favorable financing terms (e.g., 0% APR for up to 48 months)
Home furnishing industry estimated annual retail sales of $41 billiond
All dollars in this table are quoted in nominal terms. a “HIRI/IHS Global Insight up 4.0% in 2014, Expecting 5.7% Sales Growth in 2015,” Home Improvement Research Institute, https://www.hiri.org/?page=Media, March 5, 2015. b “Total Outstanding Automotive Loan Balances Reach All-Time High,” Experian Automotive, https://www.experianplc.com/media/news/2015/q4-2014-safm/, February 19, 2015. c “Car Buyers Borrow Most Ever, Make Record Payments,” James Healey, USA Today, http://www.usatoday.com/story/money/cars/2015/03/04/new-car-loan-record-payment/24363041/, March 4, 2015. d “Home-Furnishing Retailers' Web Aspirations Struggle,” Joan Solsman, Wall Street Journal. http://www.wsj.com/articles/SB10001424127887323713104578137402989630228, November 23, 2012.
91 “Homeowner Financing of Projects,” National Association of the Remodeling Industry, http://blog.nari.org/ 2014/11/17/homeowner-financing-of-projects/, November 17, 2014, accessed October 18, 2015. 92 “2015 Cost vs. Value Report,” Remodeling, Hanley Wood, http://www.remodeling.hw.net/cost-vs-value/2015/, accessed October 18, 2015.
66 This report is available at no cost from the National Renewable Energy Laboratory (NREL) at www.nrel.gov/publications.
5.3.2 Third-Party Ownership (TPO) Residential PV systems at $1.6/W with lower tax incentives are likely to reduce two of the main value propositions of TPO PV systems: their ability to use the tax benefits of solar property and customer avoidance of high upfront costs. However, strong PV market share by third-party owners likely will continue even in this changed environment. First, starting in 2022, the personal ITC expires while the business ITC reverts to 10%, creating a federal tax environment that may favor business ownership.93 The lowest-cost financing option (host owned or TPO) will depend on several factors, including system production, upfront costs, and customer and TPO WACC and tax rate. That said, as shown in Table 8, TPO provides a modest LCOE reduction if both parties have similar WACCs, though much less so at higher WACCs. If either party has a WACC advantage, that party’s LCOE is significantly lower: the ability to source cheap capital drives low-cost energy far more than does the additional 10% ITC.
Table 8. Percent Energy Cost Advantage due to TPO, Varied by Customer and TPO WACCa
Customer WACC (real)
Installer WACC (real) 2.0% 3.0% 4.0% 5.0% 6.0% 7.0% 8.0% 9.0% 10.0%
2.0% 10% 21% 30% 38% 44% 50% 54% 58% 61%
3.0% -4% 9% 19% 28% 36% 42% 47% 51% 55%
4.0% -19% -4% 8% 18% 26% 33% 39% 44% 49%
5.0% -35% -18% -5% 7% 16% 24% 31% 37% 42%
6.0% -52% -33% -18% -5% 6% 15% 22% 29% 35%
7.0% -70% -49% -32% -18% -6% 4% 13% 20% 27%
8.0% -89% -66% -47% -31% -17% -6% 3% 12% 19%
9.0% -108% -83% -62% -44% -30% -17% -7% 2% 10%
10.0% -129% -101% -78% -59% -42% -29% -17% -7% 1% a Key assumptions: residential PV system in Kansas City, MO (16% capacity factor); O&M 0.5% of installed cost per year; 30-year life; and 0.5% degradation factor
However, even if TPO financial arrangements are more expensive than host-owned options, many consumers may still choose not to own a PV system because it is less complicated, with fewer associated risks. This trend can be seen in other markets, from automobile leases to satellite and cable television. In 2014 DIRECTV spent $1.2 billion on subscriber-leased equipment and had $10.4 billion of subscriber-leased equipment on its balance sheet (DIRECTV 2015). Similarly Comcast spent $3.4 billion on customer equipment, with $27 billion on its balance sheet (NBCUniversal Media 2015).94 The risk tolerance of individuals and businesses varies; as companies (and the industry) get bigger, with a need for more capital and the ability to deploy more capital, there likely will be an increase in financing options designed to meet the varying risk tolerances of customers and financiers. 93 The business ITC also benefits because business can qualify for larger credits in 2022–2023 if they began construction before then, while the homeowners can only receive the personal ITC if the PV system was placed in service before 2022. Businesses also benefit from the 5-year MACRS depreciation schedule but must pay income taxes on earnings from PV systems, while individuals receive after-tax benefits of avoided electricity costs. 94 The dollar figures from the DIRECTV and Comcast refer to nominal dollars.

67 This report is available at no cost from the National Renewable Energy Laboratory (NREL) at www.nrel.gov/publications.
TPO providers also may have an advantage over host-owned systems depending on how customers are compensated for services provided to the grid. In theory, large third-party owners could offer grid services to utilities with their ability to control fleets of PV systems distributed throughout a service territory (or multiple service territories) in which they operate. This is similar to how third-party owners now have an advantage over residential host customers in their ability to aggregate RECs and sell them at a higher price. Host-owned systems could also participate in these types of programs (e.g., demand response programs), but that would require utilities to set up programs, as opposed to relying on the free market.
From a customer contract perspective, the lower costs and increased market size will likely mean that customers can sign contracts at varying tenors, payment terms (e.g., upfront payments versus ongoing payments), and rate structures. A broader range of customers will also likely be able to qualify for contracts, both geographically and from a credit-quality perspective. While customers with worse credit will not have access to favorable financing terms (as is the case with all unsubsidized financial offerings), they may still be able to sign contracts that lower their energy bills owing to the lower costs, larger market size, and lower economic risk of residential PV systems.
The capital used to finance TPO systems is also likely to change and become more varied. As PV companies grow, they will be able to finance projects themselves, similar to how the IPP market formed in the 1990s (see Section 3.2.1). Internally financing projects could significantly lower costs by removing high-cost investors and streamlining the process. Additionally, because tax-equity investors typically have more stipulations than normal equity (e.g., indemnification risk against ITC overvaluation, cash flow priority if IRR is not achieved in a certain timeframe), projects have historically been limited in how much debt they can use. By reducing the number and type of equity investors, projects can use more debt and thus lower their WACC. This is especially true because coverage ratios will also likely decrease owing to lower perceived technology and deal structure risks (i.e., fewer parties with an interest in project cash flows). Industry participants we spoke to suggested that the debt service coverage ratio, which is now 1.3–1.4, could decline to 1.15–1.2.
The percentage of debt in a project will depend on the price of energy at a specific location as well as the energy performance of the system. As other project benefits, such as tax credits, are reduced, investor returns will rely more on energy sales. A PPA contract of $0.12/kWh will be able to support more debt than a PPA of $0.08/kWh, thus a PV system in Arizona, with an average retail price of $0.12/kWh, will likely be able to support less debt than a California project with an average retail price of $0.16/kWh (EIA 2015a).95 Likewise, a system with better performance will become more important, so a PV system in a sunnier location, or with a better system design, may also achieve higher project leverage. Investors may also require stricter O&M procedures. Energy sales are, for the most part, less predictable than tax benefits and so, in some ways, project returns will be less certain in this new environment. However, with more standard operating procedures, a richer history of data, and a longer-term regulatory framework, system benefits should be fairly predictable.
95 As discussed earlier, retail rates do not necessarily reflect the value of energy generated by a distributed PV system in a specific territory; therefore, how a bill credit mechanism, such as net metering, is designed and the competitiveness of a specific pricing environment will impact project leverage.
68 This report is available at no cost from the National Renewable Energy Laboratory (NREL) at www.nrel.gov/publications.
In addition to being able to leverage a project, companies with the ability to use tax benefits efficiently will have an economic advantage over those without such ability. For this reason, there may be industry consolidation, with several large companies dominating the industry. Currently, while several companies install a large percentage of residential PV systems, a great heterogeneity in the marketplace still exists; many of the larger companies use cash flow to fund growth and therefore do not generate operating profits (and thus cannot efficiently use the tax benefits). As these companies reach more of a steady state, they will be more likely to generate profits and be able to use the diminished tax credits.96 The 10% ITC is still a large enough value proposition for companies to attempt to take advantage of this benefit. However, if companies cannot use the benefits in a timely manner, their willingness to finance systems with tax-equity investors will depend on the friction associated with these transactions. To stay competitive, tax-equity investors may need to accept low rates of return and structure project financial arrangements more efficiently. Some projects likely will still rely on tax-equity investors as part of a diverse set of potential capital sources that may be necessary for such a large amount of deployment.
Conversely, if the ITC is removed from the tax code, system prices are low, and relatively easy financing is made available, the residential market may become more heterogeneous. The large overhead associated with providing financial products and sourcing low-cost equipment may prove more of a burden than an advantage to these large companies. A corollary can be seen in other markets around the world, such as Germany, whose market has remained weighted toward smaller installers. Additionally, many home consumer goods in the United States, such as air-conditioners, roofing, and general contracting, are installed by small companies. One of the important factors that may determine whether residential PV systems are financed through large or small companies is whether the PV system functions more as a consumer product, requiring little or no oversight, or a sophisticated energy system, requiring a great deal of O&M.
Depending on specific regulatory environments, regulated utilities could also own residential PV systems. Regulated utilities can access cheaper sources of capital, such as low-cost debt, because of their inherent advantage as a monopoly and their ability to finance their capital expenditure through the rate-base. They also have more access to and control of the electric grid, which enables them to more easily handle integration issues and generate more value from installed PV systems. Historically, utilities have not owned much residential PV because of IRS requirements that they normalize tax credits and accelerated depreciation and the hesitancy of state utility commissions to allow regulated utilities to own these assets (in part due to concerns about unfair competition). However, certain utilities have recently been allowed to own residential PV on a limited basis. In addition, when the ITC is reduced, and costs of systems are at SunShot levels, the reduced value from normalization may be compensated for by a lower cost of capital. That said, uncertainty remains about whether state utility commissions will allow utility ownership of distributed assets on a wider scale.
96 Some of these companies have also relied upon a fair market value approach to calculate the tax credit basis that provides larger tax credits than a “cost plus” approach. These companies are likely to be impacted most by the step-down in ITC, but a smaller calculated basis will also make it easier for these companies to use the tax benefits themselves.

69 This report is available at no cost from the National Renewable Energy Laboratory (NREL) at www.nrel.gov/publications.
5.3.3 Modeling the Impact of Financing on Residential PV’s Levelized Cost of Energy (LCOE)
This section demonstrates the impact financial innovation can have on energy cost by modeling some of the project finance methods described previously.97 These methods are not the only possibilities. Variation in financial structure and terms result from customer preferences (e.g., to own or lease), customer creditworthiness, the risk profile of the project and financier, existing rate structures, and the ability of customers to obtain financing. We also did not model differences in installed system price or performance based on the financing arrangement, though some may exist in reality (e.g., better purchasing power or O&M procedures). That said, the following structures were modeled:
Host Owned • Historical Financing Method: Customer purchases system using cash. The cost of capital
(e.g., opportunity cost) may be high, and this option is limited to those with cash on hand.
• Recent Innovation: Customer receives a solar-specific loan product currently available in the marketplace.
• Long-Term Approach: Customer taps into a new or existing HELOC, obtains a home-equity loan, or even refinances the mortgage.98 This long-term refinancing is not done solely for the PV system, because the setup fees would likely overwhelm the value of the loan, but the customer leverages this financial transaction undertaken for other purposes to lower the energy cost of the PV system.
Third-Party Owned • Historical Financing Method: A third party leases the PV system to the host, offering the
homeowner a discount of 10% on the cost of retail energy. The third party uses a Partnership Flip structure to finance the deal, acting as sponsor and bringing in a tax-equity investor.
• Recent Innovation: This method is identical to the historical financing method, but the sponsor funds a large portion of its equity investment using capital raised from an ABS issuance (modeled as back leverage).
• Long-Term Approach: A third party leases the PV system to the host, offering the homeowner a discount of 10% on the cost of retail energy. The third party is large enough to use the reduced tax benefits itself (rather than partnering with tax equity), but the third party still funds much of its equity investment using capital raised from an ABS issuance (modeled
97 LCOE is calculated differently depending on the analysis and the objectives. For the modeling exercises performed in the residential and non-residential sectors, the LCOE can be thought of more as the “levelized price of energy” rather than the “levelized cost of energy.” In other words, the models determine what the energy price in the retail marketplace would need to be to provide the necessary returns for the customers, owners (if not owned by the customer), and other financial entities. For host-owned systems, the model determines the avoided cost a customer receives from generating its own energy. For TPO systems, the PPA rate is calculated to provide investors with their required rate of return. However, one must also determine the discount on retail electricity a customer expects to receive from the agreement (i.e., percent bill savings). For modeling purposes, we assume the PPA rate represents the LCOE reduced by the customer’s expected percent bill savings, or: LCOE = PPA / (1-% bill savings). For this reason, a host-owned system with the same cost of capital as a TPO system will have a lower LCOE. 98 This may likely be facilitated through a 0% APR interest-free loan for the first 12–48 months of the system, which would allow the homeowner more flexibility in when they can use equity from their home. However, for modeling purposes, we assume the refinancing occurs contemporaneously with the PV system installation.
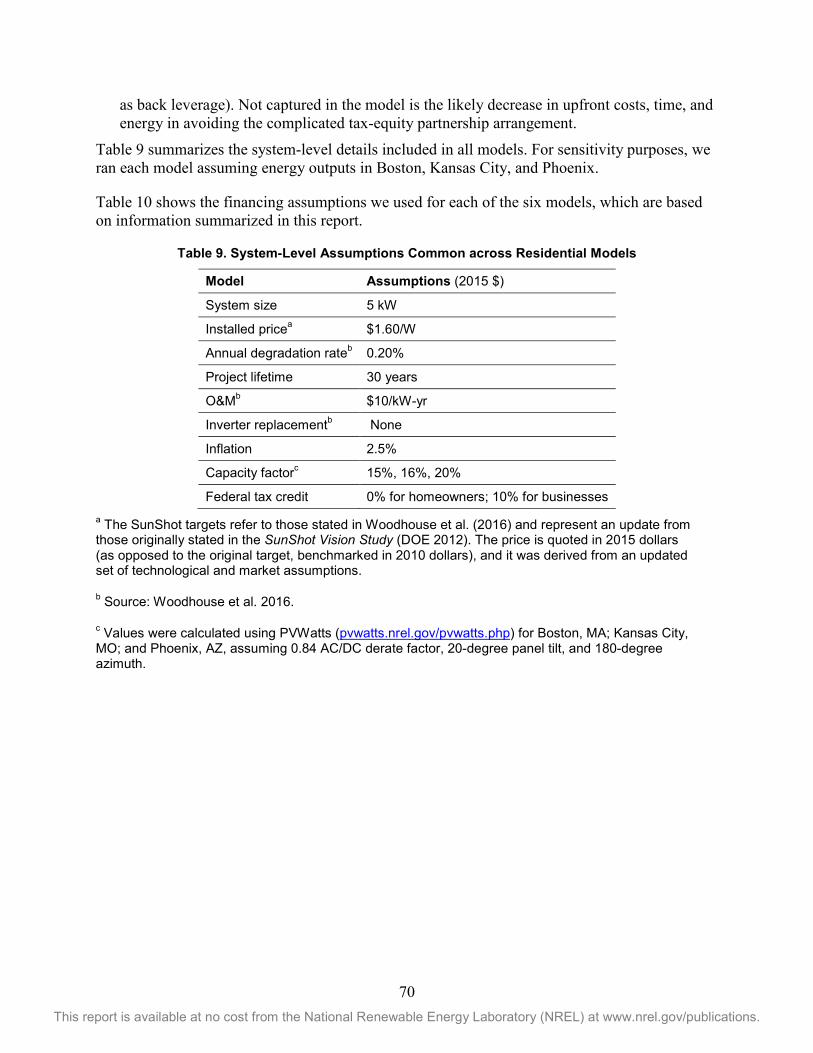
70 This report is available at no cost from the National Renewable Energy Laboratory (NREL) at www.nrel.gov/publications.
as back leverage). Not captured in the model is the likely decrease in upfront costs, time, and energy in avoiding the complicated tax-equity partnership arrangement.
Table 9 summarizes the system-level details included in all models. For sensitivity purposes, we ran each model assuming energy outputs in Boston, Kansas City, and Phoenix.
Table 10 shows the financing assumptions we used for each of the six models, which are based on information summarized in this report.
Table 9. System-Level Assumptions Common across Residential Models
Model Assumptions (2015 $)
System size 5 kW
Installed pricea $1.60/W
Annual degradation rateb 0.20%
Project lifetime 30 years
O&Mb $10/kW-yr
Inverter replacementb None
Inflation 2.5%
Capacity factorc 15%, 16%, 20%
Federal tax credit 0% for homeowners; 10% for businesses a The SunShot targets refer to those stated in Woodhouse et al. (2016) and represent an update from those originally stated in the SunShot Vision Study (DOE 2012). The price is quoted in 2015 dollars (as opposed to the original target, benchmarked in 2010 dollars), and it was derived from an updated set of technological and market assumptions.
b Source: Woodhouse et al. 2016.
c Values were calculated using PVWatts (pvwatts.nrel.gov/pvwatts.php) for Boston, MA; Kansas City, MO; and Phoenix, AZ, assuming 0.84 AC/DC derate factor, 20-degree panel tilt, and 180-degree azimuth.

71 This report is available at no cost from the National Renewable Energy Laboratory (NREL) at www.nrel.gov/publications.
Table 10. Financial Assumptions for Residential Models
Host Owned Third-Party Owned
Structure
Historical: Cash Purchase
Recent Innovation: Solar Loan Product
Long Term: Home Equity Loan
Historical: Sponsor and Tax Equity (Partnership Flip)
Recent Innovation: Sponsor, Leveraging ABS, and Tax Equity (Partnership Flip)
Long Term: Sponsor with Back-Leverage ABS
Sponsor Equity
% of project 100% - - 40%a 18%b 42%c
Rate of return 3%–17%,d median 10.0%
10% 10% 15%e 15% 15%
Tax Equity
% of project - - - 60% 45% -
Rate of return - - - 9.5%f 9.5% -
Debt
% of project - 100% 100% - 37% 58%
Interest rate - 6.95% –8.875%g (varies by credit), median 8.1%
6.3% - 5.9%h 4.51%i
Tenor - 15 years 30 years - 9 yearsj 9 years
Combined federal and state tax rate
N/A N/A N/A 39.55%k 39.55% 39.55%
WACC 10.0% 8.1% 6.3% 11.7% 8.2% 7.9% a See Table 3. b ABS leverage amount based on an advance rate of 68%; as tax equity represents 45% of the structure, the remaining 55% of funds comes from ABS (55% x (68% advance rate) = 37%) and sponsor equity (the remaining 18%). c Debt is sized to satisfy constraints, including debt coverage ratio averaging 1.35. d Sigrin 2013, e See Table 3., f Martin 2015b, g Admirals Bank Home Improvement Lending (2015) h As discussed in Section 4.1.1, the coupon does not represent the total cost of capital from ABS. Based on discussions with industry experts, we modeled the rate by increasing the bond coupon of the ABS summarized in Table 5 by the 150 basis points. Although a separate capital vehicle, this is similar to the YieldCo spread to cover corporate operating costs (Grant and Cornfeld 2015). i For modeling purposes, we assume that large ABS deals, with more historical operations experience, allow the spread for ABS transaction to narrow to levels seen in other industries. Based on conversations with industry experts, we estimate that to be between 10 and 12 basis points. j The average weighted life of a solar ABS (i.e., expected maturity) is estimated to be significantly shorter than the length of all contracted cash flows owing to the advance rate, customer prepayments, default, or renegotiation. For modeling purposes, we assume an average repayment date as summarized in Section 4.1.1. k Assumes a 35% federal and 7% state income tax rate
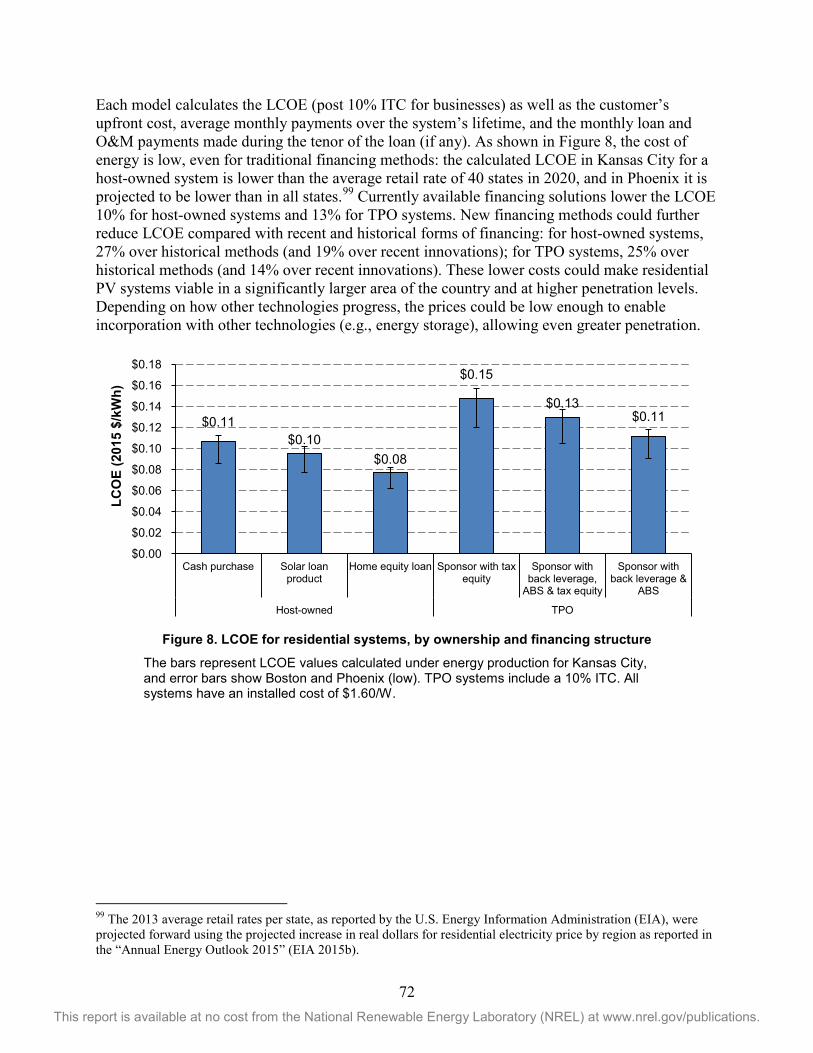
72 This report is available at no cost from the National Renewable Energy Laboratory (NREL) at www.nrel.gov/publications.
Each model calculates the LCOE (post 10% ITC for businesses) as well as the customer’s upfront cost, average monthly payments over the system’s lifetime, and the monthly loan and O&M payments made during the tenor of the loan (if any). As shown in Figure 8, the cost of energy is low, even for traditional financing methods: the calculated LCOE in Kansas City for a host-owned system is lower than the average retail rate of 40 states in 2020, and in Phoenix it is projected to be lower than in all states.99 Currently available financing solutions lower the LCOE 10% for host-owned systems and 13% for TPO systems. New financing methods could further reduce LCOE compared with recent and historical forms of financing: for host-owned systems, 27% over historical methods (and 19% over recent innovations); for TPO systems, 25% over historical methods (and 14% over recent innovations). These lower costs could make residential PV systems viable in a significantly larger area of the country and at higher penetration levels. Depending on how other technologies progress, the prices could be low enough to enable incorporation with other technologies (e.g., energy storage), allowing even greater penetration.
Figure 8. LCOE for residential systems, by ownership and financing structure
The bars represent LCOE values calculated under energy production for Kansas City, and error bars show Boston and Phoenix (low). TPO systems include a 10% ITC. All systems have an installed cost of $1.60/W.
99 The 2013 average retail rates per state, as reported by the U.S. Energy Information Administration (EIA), were projected forward using the projected increase in real dollars for residential electricity price by region as reported in the “Annual Energy Outlook 2015” (EIA 2015b).
$0.11 $0.10
$0.08
$0.15
$0.13 $0.11
$0.00
$0.02
$0.04
$0.06
$0.08
$0.10
$0.12
$0.14
$0.16
$0.18
Cash purchase Solar loanproduct
Home equity loan Sponsor with taxequity
Sponsor withback leverage,
ABS & tax equity
Sponsor withback leverage &
ABS
Host-owned TPO
LCO
E (2
015
$/kW
h)

73 This report is available at no cost from the National Renewable Energy Laboratory (NREL) at www.nrel.gov/publications.
Beyond lowering LCOE, the financial products also make solar available to more customers by replacing the high upfront cost ($8,000 in these models) with relatively low monthly payments, ranging from $45–$96/month for new financing methods (Figure 9).
Figure 9. Average monthly payments over lifetime of residential PV system and average monthly
loan and O&M payments during the tenor of a loan
While an $8,000 one-time payment may prevent many potential customers from purchasing a PV system, the other options shown have no upfront payments and relatively low monthly payments—lower in most cases than a cell phone bill. Additionally, these payments offset electricity purchases from the utility, so a customer will likely have net-positive cash flows each month (depending on retail rate structures).
There are additional reasons a customer may choose TPO or host-owned financing besides a lower energy cost. That said, Figure 8 shows the TPO financing options modeled offer a higher energy cost than host ownership, despite TPO financiers having access to very low-cost financing through capital raises from securities and receiving a 10% tax credit and accelerated depreciation, which are not available to host-owned systems. Two large reasons for these cost differences are that the hosts are modeled to have a lower cost of capital than third-party owners, and the capital raises by TPO financiers from securities have a shorter tenor than the loan products for host-owned systems. The shorter tenor makes the securities payments higher in the initial years (as their capital is returned over a shorter period of time), which limits the size of the capital raised (due to debt coverage ratios), and it provides less cash flow in the initial years to the third-party owners (which is significant due to the time-value of money).
If the tax credit is removed entirely (as some lawmakers and advocates have proposed), modeled LCOEs would shift upwards for TPO systems; similarly, if host-owned systems are granted a 10% ITC (as some lawmakers and advocates have proposed), modeled LCOEs would shift downwards. A summary of this effect is shown in Figure 10.
$6
$45
$56
$110
$96 $92
$0
$20
$40
$60
$80
$100
$120
Cash purchase Solar loan product Home equity loan Sponsor with taxequity
Sponsor with backleverage, ABS &
tax equity
Sponsor with backleverage & ABS
Host-owned TPO
Mon
thly
Pay
men
ts (2
015
$) Average monthly payments (lifetime)
Monthly loan payments and O&M (during tenor of loan)

74 This report is available at no cost from the National Renewable Energy Laboratory (NREL) at www.nrel.gov/publications.
Figure 10. LCOE for residential systems, by ownership, financing structure, and tax credit
BAU = business as usual (current law, post-2021); Alt = alternative option.
As demonstrated in Figure 10, the 10% ITC effect ranges from a 9%–13% reduction in LCOE. The impact is largest in financial arrangements with relatively high leverage, because the tax credit, which goes to the equity investor, represents a relatively large percentage of its investment. Removing the ITC differential between host-owned and TPO systems gives host-owned systems more favorable LCOEs. That said, there will continue to be other factors to consider, including the reality that the 10% ITC for businesses is permanent.
5.4 Long-term Non-Residential PV Finance If the non-residential PV market achieves SunShot-level pricing of $1.30/W, and the ITC is reduced to 10% for commercial entities in 2022, this will not resolve many of the financial difficulties for non-residential customers to the same degree SunShot-level pricing would affect the residential market. As discussed previously, the non-residential distributed PV market comprises a wide variety of customers, systems, building stocks, rate structures, and system performance characteristics—likely requiring a diverse set of financial solutions.
For non-profit and government customers, the reduced tax benefits will remove a historical barrier to efficient solar ownership, while many commercial customers have not had this challenge because they had the capacity to use depreciation and manage tax expenditures; that said, a reduced amount to use will make this work easier. The price-per-watt reduction will allow companies with relatively low revenues or assets on their books to finance much larger systems, yet non-residential PV systems could still represent millions of dollars of capital investment, which will make it difficult for some companies to finance.
$0.11
$0.10 $0.10 $0.09
$0.08 $0.07
$0.15 $0.16
$0.13
$0.15
$0.11 $0.12
$0.00
$0.02
$0.04
$0.06
$0.08
$0.10
$0.12
$0.14
$0.16
$0.18
no-ITC(BAU)
10% ITC(Alt)
no-ITC(BAU)
10% ITC(Alt)
no-ITC(BAU)
10% ITC(Alt)
10% ITC(BAU)
no-ITC(Alt)
10% ITC(BAU)
no-ITC(Alt)
10% ITC(BAU)
no-ITC(Alt)
Historic Recent Long term Historic Recent Long term
Host-owned TPO
LCO
E (2
015
$/kW
h)
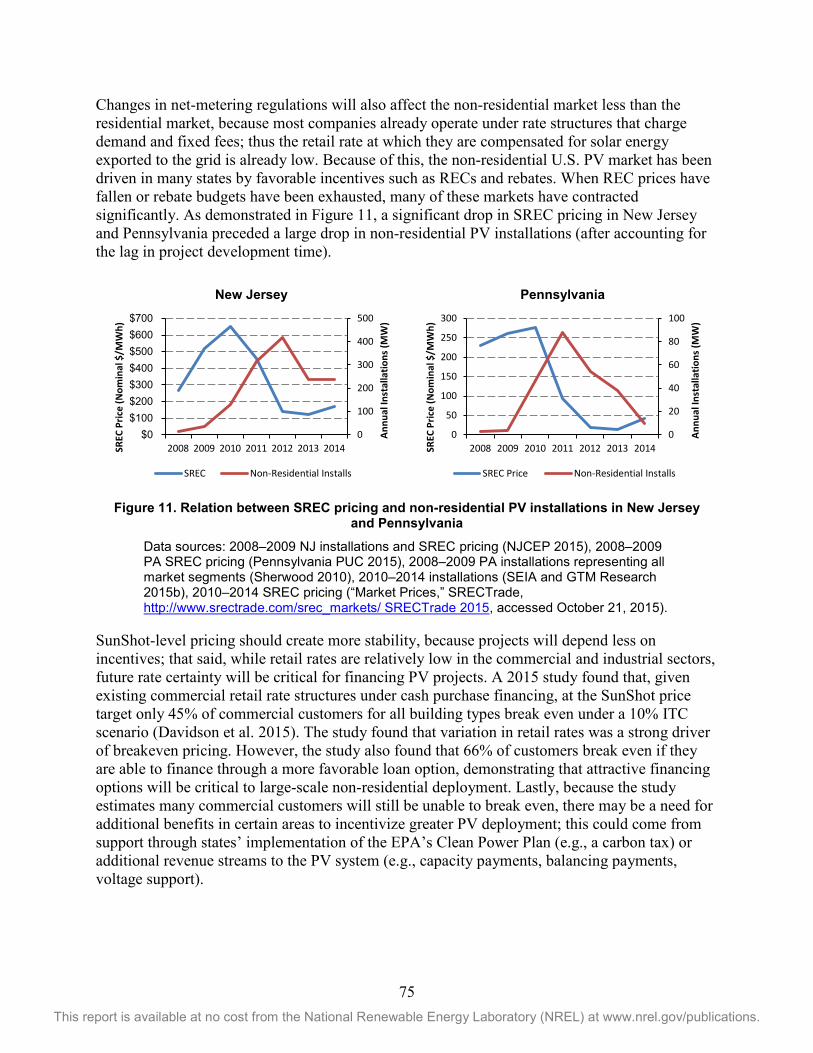
75 This report is available at no cost from the National Renewable Energy Laboratory (NREL) at www.nrel.gov/publications.
Changes in net-metering regulations will also affect the non-residential market less than the residential market, because most companies already operate under rate structures that charge demand and fixed fees; thus the retail rate at which they are compensated for solar energy exported to the grid is already low. Because of this, the non-residential U.S. PV market has been driven in many states by favorable incentives such as RECs and rebates. When REC prices have fallen or rebate budgets have been exhausted, many of these markets have contracted significantly. As demonstrated in Figure 11, a significant drop in SREC pricing in New Jersey and Pennsylvania preceded a large drop in non-residential PV installations (after accounting for the lag in project development time).
Figure 11. Relation between SREC pricing and non-residential PV installations in New Jersey
and Pennsylvania
Data sources: 2008–2009 NJ installations and SREC pricing (NJCEP 2015), 2008–2009 PA SREC pricing (Pennsylvania PUC 2015), 2008–2009 PA installations representing all market segments (Sherwood 2010), 2010–2014 installations (SEIA and GTM Research 2015b), 2010–2014 SREC pricing (“Market Prices,” SRECTrade, http://www.srectrade.com/srec_markets/ SRECTrade 2015, accessed October 21, 2015).
SunShot-level pricing should create more stability, because projects will depend less on incentives; that said, while retail rates are relatively low in the commercial and industrial sectors, future rate certainty will be critical for financing PV projects. A 2015 study found that, given existing commercial retail rate structures under cash purchase financing, at the SunShot price target only 45% of commercial customers for all building types break even under a 10% ITC scenario (Davidson et al. 2015). The study found that variation in retail rates was a strong driver of breakeven pricing. However, the study also found that 66% of customers break even if they are able to finance through a more favorable loan option, demonstrating that attractive financing options will be critical to large-scale non-residential deployment. Lastly, because the study estimates many commercial customers will still be unable to break even, there may be a need for additional benefits in certain areas to incentivize greater PV deployment; this could come from support through states’ implementation of the EPA’s Clean Power Plan (e.g., a carbon tax) or additional revenue streams to the PV system (e.g., capacity payments, balancing payments, voltage support).
0
100
200
300
400
500
$0$100$200$300$400$500$600$700
2008 2009 2010 2011 2012 2013 2014
Annu
al In
stal
latio
ns (M
W)
SREC
Pric
e (N
omin
al $
/MW
h)
New Jersey
SREC Non-Residential Installs
0
20
40
60
80
100
0
50
100
150
200
250
300
2008 2009 2010 2011 2012 2013 2014
Annu
al In
stal
latio
ns (M
W)
SREC
Pric
e (N
omin
al $
/MW
h)
Pennsylvania
SREC Price Non-Residential Installs

76 This report is available at no cost from the National Renewable Energy Laboratory (NREL) at www.nrel.gov/publications.
While there may be need for varied financial products for non-residential PV systems, this should not be an issue, because U.S. equipment financing is already a very robust marketplace. In 2014, an estimated $1.4 trillion (nominal) was invested in plant, equipment, and software, of which 62% (or approximately $900 billion) was financed through loans, leases, or lines of credit (ELFA 2015a). Various industries and applications account for this capital raise, as demonstrated in Table 11.
Table 11. Equipment Financing Expenditures in 2014, by Industry
Industry 2014 Expenditure on Equipment Financing (billions, nominal)
Transportation $257
IT and related services $178
Agriculture $102
Construction $99
Industrial/manufacturing $38
Office machines $38
Medical $36
Total $903
Source: ELFA 2015b
The amount of capital raised per industry in Table 11 is well within the range, and often in excess, of the SunShot Vision Study’s estimate of $45 billion in peak spending for all solar market sectors (residential, commercial, and central generation) (DOE 2012). Necessary spending for non-residential distributed PV is also dwarfed by the $1.8 trillion in commercial and industrial loans that U.S. commercial banks have outstanding, a number that has more than doubled in the past 10 years, suggesting substantial new capital can be raised in a relatively short period.100 Average commercial and industrial loans are also priced at a relatively low cost of capital. From 2000–2014 the average rate for all commercial and industrial loans was approximately 4.0%, and as of July 2015 the weighted average loan rate was 2.2% (though as high as 7.9% in 2000).101
100 “Commercial and Industrial Loans, All Commercial Banks,” Federal Reserve Bank of St. Louis, https://research.stlouisfed.org/fred2/series/BUSLOANS, accessed October 21, 2015. 101 “Weighted-Average Effective Loan Rate for All C&I Loans, All Commercial Banks, Percent, Quarterly, Not Seasonally Adjusted,” Federal Reserve Bank of St. Louis. https://research.stlouisfed.org/fred2/series/EEANQ, accessed October 21, 2015.

77 This report is available at no cost from the National Renewable Energy Laboratory (NREL) at www.nrel.gov/publications.
Leasing equipment typically costs more than companies financing equipment themselves. “To some degree, lessors benefit because they can access cheaper funds than … [lessees could] themselves … access; for example, GE, International Lease Finance Corporation, and Boeing Capital have credit ratings that are 7 to10 notches higher than those of the main U.S. airlines. But by and large, lessors’ returns come from the premium they charge … companies for flexibility” (Saxon 2012). This premium can be 10%–15% higher, in the case of leased aircrafts and trucks, or 25% more for ships (Saxon 2012). Regardless, there are various reasons why companies have and will continue to lease equipment rather than own it themselves, depending on their specific circumstances and risk profiles (which again emphasizes the diverse nature of the market). As a point of reference, 38% of the global fleet of airplanes was leased in 2014.102 Table 12 summarizes some of the common advantages and disadvantages for companies leasing and owning capital equipment.
Table 12. Advantages and Disadvantages of Leasing and Owning Capital Equipment
Advantages Disadvantages
Leasing • Less initial expense • Lease payments are tax deductible the
year they are made (as opposed to CapEx)
• Often offer more flexible terms, which is an advantage for companies with bad credit or the need for a longer term
• Off-balance-sheet transactiona • Elimination of O&M expenses and no
unexpected costs
• Typically higher overall costs • Do not own asset (and therefore cannot
sell it or get value from it after the lease) • Must provide an economic return to
lessor and lessee
Owning • Typically lower overall costs • Ownership of asset • Receive tax incentives
• Higher initial expense • On-balance-sheet transaction • Must maintain asset and manage
unexpected costs (e.g., inverter replacement)
• Businesses typically have a limit in the amount of debt they can raise
a As mentioned in footnote 52, FASB may change this standard in the next few years.
Clearly there are various reasons a company may choose one form of financing over the other. At the core of the question is the tradeoff a company makes between risk and profitability. Companies that own assets take more risk, but they are likely to make a larger return on investment. In industries with particularly tight margins, companies may view ownership of PV assets as a competitive advantage over their rivals by having a lower price of energy. On the other hand, companies may lease equipment because it is not part of their core competency, and they do not want to risk significant cash expenditures on non-core equipment. Additionally, not all of these products may be available to every company or every type of PV project.
102 “Lessor Fleet Share of 50% ‘Possible but Ambitious’,” Laurence Reid, Ascend Flightglobal Consultancy, http://www.ascendworldwide.com/2014/03/lessor-fleet-share-of-50-possible-but-ambitious.html, March 3, 2014.

78 This report is available at no cost from the National Renewable Energy Laboratory (NREL) at www.nrel.gov/publications.
As mentioned previously, many commercial PV projects have had difficulty receiving financing because of low credit ratings or because the system’s size made it too large and unique to fit into a project portfolio but too small to receive financing on its own. As the industry grows, financial institutions may be able to offer products to lower-rated institutions, or smaller PV systems, because the size of the market will make packaging systems and companies easier. Additionally, financing (as well as customer acquisition and transaction costs) may be reduced through bundling commercial PV systems with other energy or capital improvement projects. This process is currently done for many technologies with Energy Saving Performance Contracts; with decreased costs and complexities, PV systems could be part of these contracts as well. The industry will also have more data on historical performance of systems and a more established way of valuing projects and contracting agreements. However, broader access to and lower cost of capital through lower perceived risks will depend on continued standardization of documents and procedures, so risk and return are clearer for investors, as well as a simpler and more efficient way of financing these projects.
5.4.1 Modeling the Impact of Financing on Non-Residential PV’s Levelized Cost of Energy (LCOE)
This section demonstrates the impact financial innovation can have on LCOE by modeling some of the project finance methods described previously. These methods are not the only possibilities. Variations in financial structure and terms result from customer preferences (e.g., to own or lease), customer creditworthiness, the risk profile of the project and financier, existing rate structures, and the ability of customers to obtain financing. This is particularly true for the non-residential market, because it comprises so many different types of businesses, non-profits, and governments, each of which finances its activities and consumes electricity differently. We also did not model differences in installed system price or performance based on the financing arrangement, though some may exist in reality (e.g., better purchasing power or O&M procedures). That said, the following structures were modeled:
Host Owned • Historical Financing Method: Customer uses an equipment loan from a bank to fund a
portion of the system (up to the median reported advance rate for an equipment loan); the remainder is funded from the customer’s corporate balance sheet.
• Recent Innovation: Customer receives a solar-specific loan product currently available in the marketplace.
• Long-Term Approach: Customer receives a solar-specific loan product at more favorable terms than currently available in the marketplace; in this model, we lengthen the loan term from 5 to 10 years but keep the interest rate on par with a current 5-year loan.
Third-Party Owned • Historical Financing Method: A third party leases the PV system to the host, offering the
company a discount of 15% on the cost of energy. The third party uses a Partnership Flip structure to finance the deal, acting as sponsor and bringing in a tax-equity investor.
• Recent Innovation: This method is identical to the historical financing method, but the sponsor funds a large portion of its equity investment using capital raised from an ABS issuance (modeled as back leverage).

79 This report is available at no cost from the National Renewable Energy Laboratory (NREL) at www.nrel.gov/publications.
• Long-Term Approach: A third party leases the PV system to the host, offering the company a discount of 15% on the cost of energy. The third party is large enough to use the tax benefits itself (i.e., rather than partnering with tax equity), but the third party still funds a large portion of its equity investment using capital raised from an ABS issuance (modeled as back leverage). Not captured in the model is the likely decrease in upfront costs, time, and energy in avoiding the complicated tax-equity partnership arrangement.
Table 13 summarizes the system-level details included in all models. For sensitivity purposes, we ran each model assuming energy outputs in Boston, Kansas City, and Phoenix.
Table 14 shows the financing assumptions we used for each of the six models, which are based on information summarized in this report.
Table 13. System-Level Assumptions Common across Non-Residential Models
Model Assumptions (2015 $)
System size 500 kW
Installed pricea $1.30/W
Annual degradation rateb 0.20%
Project lifetime 30 years
O&Mb $7.50/kW-yr
Inverter replacementb None
Inflation 2.0%
Capacity factorb 14%, 15%, 18%
Federal tax credit 10% a The SunShot targets refer to those stated in Woodhouse et al. (2016) and represent an update from those originally stated in the SunShot Vision Study (DOE 2012). The price is quoted in 2015 dollars (as opposed to the original target, benchmarked in 2010 dollars), and it was derived from an updated set of technological and market assumptions.
b Source: Woodhouse et al. 2016
c Values were calculated using PVWatts (pvwatts.nrel.gov/pvwatts.php) for Boston, MA; Kansas City, MO; and Phoenix, AZ, assuming 0.84 AC/DC derate factor, 5-degree panel tilt, and 180-degree azimuth.
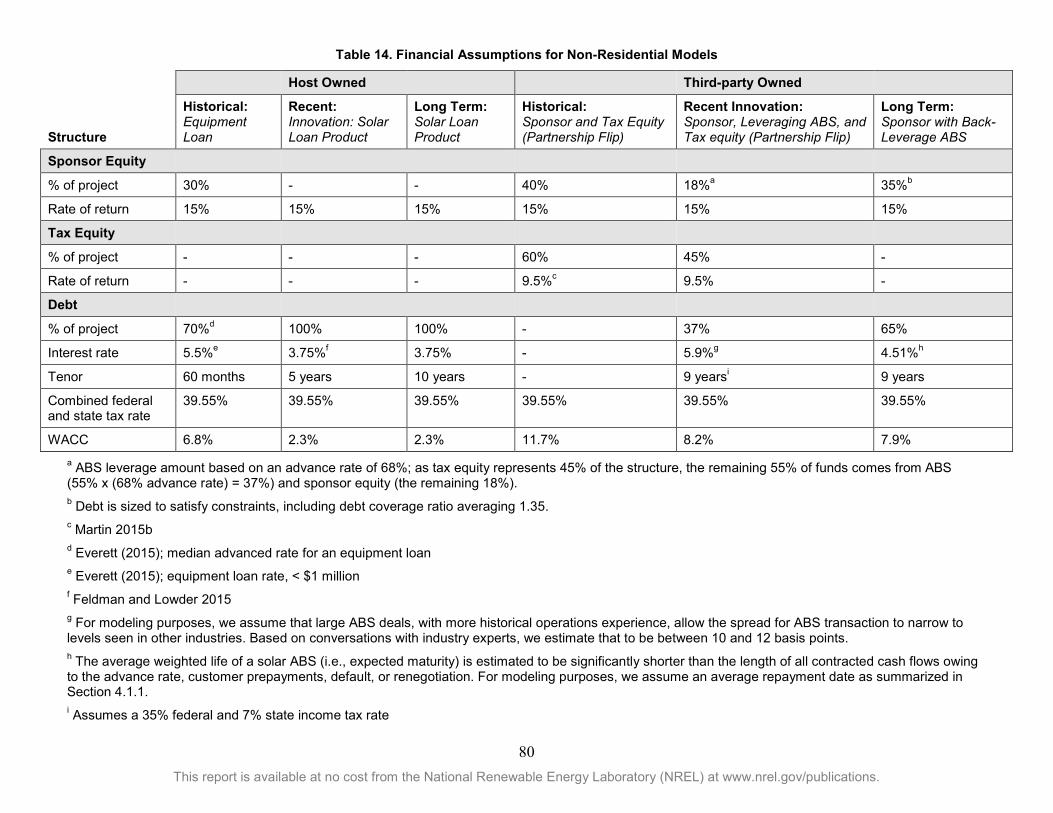
80 This report is available at no cost from the National Renewable Energy Laboratory (NREL) at www.nrel.gov/publications.
Table 14. Financial Assumptions for Non-Residential Models
Host Owned Third-party Owned
Structure
Historical: Equipment Loan
Recent: Innovation: Solar Loan Product
Long Term: Solar Loan Product
Historical: Sponsor and Tax Equity (Partnership Flip)
Recent Innovation: Sponsor, Leveraging ABS, and Tax equity (Partnership Flip)
Long Term: Sponsor with Back-Leverage ABS
Sponsor Equity
% of project 30% - - 40% 18%a 35%b
Rate of return 15% 15% 15% 15% 15% 15%
Tax Equity
% of project - - - 60% 45% -
Rate of return - - - 9.5%c 9.5% -
Debt
% of project 70%d 100% 100% - 37% 65%
Interest rate 5.5%e 3.75%f 3.75% - 5.9%g 4.51%h
Tenor 60 months 5 years 10 years - 9 yearsi 9 years
Combined federal and state tax rate
39.55% 39.55% 39.55% 39.55% 39.55% 39.55%
WACC 6.8% 2.3% 2.3% 11.7% 8.2% 7.9% a ABS leverage amount based on an advance rate of 68%; as tax equity represents 45% of the structure, the remaining 55% of funds comes from ABS (55% x (68% advance rate) = 37%) and sponsor equity (the remaining 18%). b Debt is sized to satisfy constraints, including debt coverage ratio averaging 1.35. c Martin 2015b d Everett (2015); median advanced rate for an equipment loan e Everett (2015); equipment loan rate, < $1 million f Feldman and Lowder 2015 g For modeling purposes, we assume that large ABS deals, with more historical operations experience, allow the spread for ABS transaction to narrow to levels seen in other industries. Based on conversations with industry experts, we estimate that to be between 10 and 12 basis points. h The average weighted life of a solar ABS (i.e., expected maturity) is estimated to be significantly shorter than the length of all contracted cash flows owing to the advance rate, customer prepayments, default, or renegotiation. For modeling purposes, we assume an average repayment date as summarized in Section 4.1.1. i Assumes a 35% federal and 7% state income tax rate

81 This report is available at no cost from the National Renewable Energy Laboratory (NREL) at www.nrel.gov/publications.
As shown in Figure 12, the LCOE is low, even for traditional financing methods, depending on location: the LCOE in Kansas City for a host-owned system is projected to be lower than the average commercial retail rate of 16 states in 2020, while the LCOE in Phoenix is projected to be lower than the rate in 40 states.103 Currently available financing solutions lower the LCOE 20% for host-owned systems and 18% for TPO systems. New financing methods have the potential to further lower the LCOE: for host-owned systems, by 51% over historical methods (and 39% over recent innovations); for TPO systems, 33% over historical methods (and 18% over recent innovations). These lower costs could make non-residential solar systems viable in a significantly larger area of the country and at higher penetration levels. Depending on how other technologies progress, the prices could be low enough to enable incorporation with other technologies (e.g., energy storage), allowing even greater penetration.
Figure 12. LCOE with 10% ITC for non-residential PV systems, by ownership and
financing structure
The bars represent LCOE values calculated under energy production for Kansas City with error bars showing Boston (high) and Phoenix (low).
Beyond lowering LCOE, the financial products also make solar available to more customers by replacing high upfront cost ($650,000 in these models) with relatively low monthly payments. Additionally, these payments offset electricity purchases from the utility, so a customer will likely have net-positive cash flows each month (depending on retail rate structures). As demonstrated above, access to low-cost capital could dramatically drive down LCOE for non-residential PV systems. That said, access to low-cost capital has not been the only factor inhibiting non-residential customers from financing a PV system. There will be a continued need to focus on the other challenges, such as contracting, landlord/tenant issues, risk assessment, and better incorporating a PV system into a non-residential customer’s energy system.
103 The 2013 average retail rates per state, as reported by EIA, were projected forward using the projected increase in real dollars for commercial electricity price by region as reported in the “Annual Energy Outlook 2015” (EIA 2015b).
$0.11
$0.09
$0.05
$0.14
$0.11
$0.09
$0.00
$0.02
$0.04
$0.06
$0.08
$0.10
$0.12
$0.14
$0.16
Equipment loan Solar loan product Longer term solarloan product
Sponsor with taxequity
Sponsor with backleverage ABS and
tax equity
Sponsor with backleverage & ABS
Host-owned TPO
LCO
E (2
015
$/kW
h)

82 This report is available at no cost from the National Renewable Energy Laboratory (NREL) at www.nrel.gov/publications.
5.5 Impact of Financing Costs across Market Sectors and Inherent Risks
Sections 5.2–5.4 discuss and isolate the reduction in solar’s LCOE that can be attributed solely to more-efficient and lower-cost financing in the utility-scale, residential, and non-residential sectors. Some of this progress has already occurred through innovations to historical financing approaches, while additional progress is anticipated as the industry enters a long-term, steady-state environment characterized by lower costs and less dependence on tax incentives.
Figure 13 consolidates the modeling results from Sections 5.2–5.4 into a single graphic to provide a more holistic picture of the actual and potential finance-driven LCOE reductions across all three sectors. In the residential and non-residential sectors, the LCOE range in each period reflects both a range of capacity factors and the difference between host-owned and TPO systems; in the utility-scale sector, the range reflects both the range of capacity factors seen in the market and, to a lesser extent, differences among various ownership or financing structures (as described in Section 5.2). To provide a sense of solar’s competitive position in the market, Figure 13 also compares solar’s LCOE to a range of retail or wholesale electricity rates.104
Figure 13. Impact of financing cost and structure on solar’s LCOE (assuming SunShot
cost targets)
104 The ranges of residential and commercial retail rates for 2020 were calculated by adjusting the 2013 average retail rates per state, as reported by EIA, using the projected increase in real dollars for residential and commercial electricity price by region (EIA 2015b). The range in wholesale rates for 2020 was calculated by adjusting the range reported in Wiser and Bolinger (2015), using the projected increase in the national average price of electricity generation (EIA 2015b). The range in retail rates is not a perfect comparison to the cost of energy for residential and non-residential PV systems, because customers may receive less than full retail credit for the energy generated by a PV system. This is particularly true for commercial and industrial customers, which typically have rate structures designed to recover a significant portion of electricity revenues from non-volumetric charges (e.g. demand charges).
$0.00
$0.05
$0.10
$0.15
$0.20
Historic Recent Long term Historic Recent Long term Historic Recent Long term
Residential ($1.60/W) Non-Residential ($1.30/W) Utility-Scale ($1.20/W)
LCO
E (2
015
$/kW
h) LCOE Range
Range of retail rates
Range of retail rates
Range of wholesale rates

83 This report is available at no cost from the National Renewable Energy Laboratory (NREL) at www.nrel.gov/publications.
In all three sectors, financial evolution and innovation have reduced—and will continue to reduce—solar’s LCOE over time, independent of installed cost reductions. In this way, financing will continue to contribute significantly toward reaching SunShot’s LCOE goals. Figure 13 also demonstrates that, because of the financial innovation described in this report (and under the SunShot cost targets for 2020), solar is likely to remain competitive with retail (in the case of residential and non-residential) and wholesale (in the case of utility-scale) rates going forward—even without the benefit of today’s federal tax incentives.
Although Figure 13 provides grounds for optimism, at least four different market-related risks could impact both solar’s LCOE as well as its competitive position:
Capital Market Risk Though initially hailed by some as a vehicle through which renewable projects sponsors could tap into an almost unlimited supply of low-cost public equity, YieldCos have since lost some of their shine as their share prices plummeted (and their cost of equity increased correspondingly) in the fall of 2015 following a period of overreach (see Section 4.1.1). While dispassionate financiers maintain that, under current law, YieldCos are still the most-efficient financing vehicle for long-term ownership of contracted cash-producing assets, it remains to be seen whether existing YieldCos can regain their former status and ability to monetize new assets as well as whether any new YieldCos are floated in the coming years.
Interest Rate Risk The United States is on the cusp of emerging from a prolonged period of extremely low interest rates. Short-term rates have hovered around 0% since 2009, and the 25 basis point increase in the Federal Funds Rate announced by the Federal Reserve Bank on December 16, 2015, was the first rate increase since 2006. Given that the first truly utility-scale PV project was built in 2007, and the first residential TPO contract was signed in 2008, the vast majority of solar capacity installed in the United States has been built during this period of extremely low interest rates. Though progress has been made in reducing solar financing costs, some or even much of that progress could be reversed by rising interest rates.
There are, however, reasons to believe that solar can weather a rising interest rate environment. First, the all-in cost of debt most often comprises three components: the base rate (3-month LIBOR), the swap rate (to convert the floating 3-month LIBOR rate to a fixed long-term interest rate), and the spread above the base rate (the margin the lender charges). While the base rate (which is currently close to 0%) will likely increase in the coming years, that increase may be offset to some degree by reductions in the swap rate (which tends to move counter to the base rate105) and/or spread (which could continue to narrow as lenders’ comfort with the sector increases), perhaps leaving the all-in interest rate little changed.
105 Fixed-for-floating swap rates are relatively high at present, because lenders believe LIBOR is likely to increase from its historically low levels and so lenders must be appropriately compensated (through the swap rate) for agreeing to be paid such a low LIBOR rate over extended terms. However, as LIBOR subsequently increases over time (fulfilling lender expectations), the degree of compensation required through the swap rate declines as the likelihood of further rate increases diminishes. Indeed, at the very top of a rate hike cycle, swap rates may even go negative as lenders are willing to pay a little in order to lock in being paid high LIBOR rates over extended terms.

84 This report is available at no cost from the National Renewable Energy Laboratory (NREL) at www.nrel.gov/publications.
Second, some debt markets use LIBOR floors to limit how low interest rates can go. For example, the Term Loan B market has a LIBOR floor of 1%, which means that, even though LIBOR is currently close to 0%, B loans are being priced as if LIBOR were instead at 1% (e.g., a loan priced at 400 basis points over LIBOR would have an all-in interest rate of 5% instead of closer to 4%). In any market that uses a LIBOR floor, the increase in LIBOR rates will not be felt until LIBOR actually moves above that floor. Hence, even though interest rates are likely to increase over the next few years, it could still be some time before they increase enough to make a difference in markets that use LIBOR floors.
Two other factors could help to mitigate the deterioration of solar’s competitive position resulting from rising interest rates. In the utility-scale sector, all other generating assets will be operating in the same rising interest rate environment. Although solar has historically been more capital intensive than most other forms of generation, making it more susceptible to rising interest rates, this is increasingly changing as solar costs come down to SunShot levels. In the residential and commercial sectors, the largest third-party owner of distributed PV has noted that rising interest rates tend to have an inflationary impact on retail electricity rates (SolarCity 2015b), which helps preserve the savings solar can offer to homeowners and businesses, even as costs increase.
Retail and Wholesale Rate Risk Numerous studies have shown that increased solar penetration erodes the value of solar energy generation (more so for PV than CSP) (Mills and Wiser 2013; Hirth 2013; Gilmore et al. 2015). Solar generation is typically highly correlated, intermittent, and available at certain times of the day. Further, many utilities and stakeholders have differing views on the value of solar energy. As solar becomes a larger percentage of the total energy mix, its value will likely be more scrutinized, and in many instances retail rate structures will be revised and wholesale markets will adjust in ways that are detrimental to solar.
This is already happening in many parts of the country with adjustments to net-metering regulations (e.g., Hawaii and California; see footnote 64) and suppression in day-timing pricing of wholesale electricity markets in California.106 For example, the impact that distributed PV can have on retail rates would be significantly changed by eliminating high-cost tiered rates, adding or increasing fixed charges, imposing minimum bills, providing net-metering compensation at avoided costs (or a VoS rate) rather than the full retail rate, increasing or adding demand charges as a larger share of utility revenue recovery, and, in the long term, switching to time-of-use rates. One study found that “future adoption of distributed PV is highly sensitive to retail rate structures. Whereas flat, time-invariant rates with net metering would lead to higher deployment levels, moving toward time-varying rates, rate structures with higher monthly fixed customer charges, or compensation at prices lower than the full retail rate can dramatically slow long-term customer adoption of PV” (Darghouth et al. 2015).
106 While PV systems do not typically sell into the wholesale market, in the long term a suppression of wholesale pricing is likely to impact the rate at which solar generation assets can sign power contracts.
85 This report is available at no cost from the National Renewable Energy Laboratory (NREL) at www.nrel.gov/publications.
Conversely, in the case of distributed PV, as more of a customer’s energy is generated on site, less comes from the utility, which therefore must recover its costs over a smaller amount of electricity sales. Some believe this could increase retail rates, effectively making distributed PV more competitive in the marketplace (which could cause more PV deployment and even higher retail rates). Darghouth et al. (2015) found that the reduction in rates due to time-varying rates is largely cancelled out by the “fixed-cost recovery” feedback. Much of this depends on how utilities and regulators incorporate solar into their total generation mix and how solar is valued in the marketplace. A different study found that eliminating net metering or significantly increasing fixed charges would only delay the decline in energy supplied from the grid, and it might increase the difficulties for utilities as customers defect from the grid entirely (Bronski et al. 2015). In addition, some wholesale and retail rate risk will be determined by the affordability of other technologies—such as storage, transmission, and load management—that support higher-penetration solar.
Continued Legal and Regulatory Support In 2015, the value of solar through 2030 was significantly altered by the 5-year extension of the federal ITC for solar equipment as well as the finalization of rules for the EPA’s Clean Power Plan. As described in Section 2.1, solar equipment will receive a tax credit of 22%–30% through 2021 (and, in many cases, through 2023). States are required to begin demonstrating compliance with their Clean Power Plan carbon-reduction goals starting in 2022. While each state can choose its own carbon-reduction methods, these methods will most likely involve incentivizing renewable energy or adding costs to traditional energy sources (e.g., with a carbon tax); in either case, solar generation is likely to be more competitive than it would be without those regulations. In the analysis summarized in Figure 13, a 10% ITC (or, in some cases, no ITC) is assumed to calculate the LCOE, no revenue is assumed from reductions in carbon emissions, and the retail and wholesale rates do not account for the implementation of the Clean Power Plan. The results of the comparisons in Figure 13 could change dramatically depending on how the Clean Power Plan is implemented by the states and whether the federal tax credits are extended again (as they have been in the past).
Although the four market risks discussed above are real and could shift the overall range of LCOEs shown in Figure 13 upward, it is unlikely that the relative decline in LCOEs from historical financing methods to recent innovations to long-term approaches would change appreciably. On the margin, financing costs—and, in turn, LCOE—will likely decline through ongoing financial evolution and innovation, regardless of how these market risks play out. In fact, financial innovation could become even more important as a way to mitigate the negative impacts of a rising interest rate environment where access to capital markets could be constrained and compensation for bill savings reduced.

86 This report is available at no cost from the National Renewable Energy Laboratory (NREL) at www.nrel.gov/publications.
6 Conclusions Since the SunShot Initiative launched in 2011, much progress has been made in solar cost reduction and financial innovation. As solar costs continue to decline, raising capital more efficiently and under improved terms will become increasingly important to achieving SunShot’s 2020 cost-competitiveness goals. Moreover, the solar industry’s growth—in terms of funding, deployment, and number of stakeholders—is increasing the transparency of financial transactions associated with solar technologies and thus the confidence investors have in solar. This has created significant opportunities for continued financial progress. As the industry continues to grow in size and scope, investors are likely to become more confident in the industry.
The development of complex solar financing has been based on the need to monetize tax credits. Going forward, however, evolution is more likely to produce simpler financing structures that tap into a broader base of lower-cost capital sources, in many cases giving the public a greater financial stake in solar’s long-term success. Once solar is much less costly and less subsidized, it might receive the type of lower-cost financing received by mature assets today. From a financing perspective, utility-scale solar could look much more like conventional generation assets, non-residential solar could look much like other capital improvements such as a new roof or an efficiency upgrade, and residential solar could look much like an expensive appliance. In this way, the simultaneous improvement of solar technologies, markets, and financing has the potential to facilitate the achievement of SunShot-level solar energy costs and deployment.

87 This report is available at no cost from the National Renewable Energy Laboratory (NREL) at www.nrel.gov/publications.
References Abrams, Nick. May 14, 2015. Telephone conversation with the authors, David Feldman and Mark Bolinger.
Admirals Bank Home Improvement Lending. 2015. “Title I Secured & Unsecured Rate Matrix.” Effective Date April 10, 2015.
Ally Financial Inc. 2015. “Form 10-K (Annual Report) for the Fiscal Year Ended December 31, 2014.”
Arreola, Georgina, Timothy Treadwell, and Ben Hoen. 2015. “Survey of Buyers, Sellers and Realtors Involved In San Diego Third-Party Owned Solar Home Transactions: A Qualitative Assessment.” Berkeley, CA: Lawrence Berkeley National Laboratory and the Center for Sustainable Energy.
Barbose, Galen, and Naïm Darghouth. 2015. Tracking the Sun VIII: An Historical Summary of the Installed Price of Photovoltaics in the United States from 1998 to 2014. Berkeley, CA: Lawrence Berkeley National Laboratory.
Barbose, Galen, John Miller, Ben Sigrin, Emerson Reiter, Karlynn Cory, Joyce McLaren, Joachim Seel, Andrew Mills, Naïm Darghouth, and Andrew Satchwell. 2016. On the Path to SunShot: Utility Regulatory and Business Model Reforms for Addressing the Financial Impacts of Distributed Solar on Utilities. Golden, CO: National Renewable Energy Laboratory. NREL/TP-6A20-65670. http://www.nrel.gov/docs/fy16osti/65670.pdf.
Berkshire Hathaway Energy. 2015. “Berkshire Hathaway Energy 2015 Fixed-Income Investor Conference.” April 9, 2015.
Bolinger, Mark. 2009. “Financing Non-Residential Photovoltaic Projects: Options and Implications.” Berkeley, CA: Lawrence Berkeley National Laboratory. LBNL-1410E.
———. 2014. “An Analysis of the Costs, Benefits, and Implications of Different Approaches to Capturing the Value of Renewable Energy Tax Incentives.” Berkeley, CA: Lawrence Berkeley National Laboratory. LBNL-6610E.
Bolinger, Mark, and Edward Holt. 2015. “A Survey of State and Local PV Program Response to Financial Innovation and Disparate Federal Tax Treatment in the Residential PV Sector.” Berkeley, CA: Lawrence Berkeley National Laboratory. LBNL-181290.
Bolinger, Mark, and Joachim Seel. 2015. “Utility-Scale Solar 2014: An Empirical Analysis of Project Cost, Performance, and Pricing Trends in the United States.” Berkeley, CA: Lawrence Berkeley National Laboratory. LBNL-1000917.
Bolinger, Mark, John Harper, and Matt Karcher. 2009. “A Review of Wind Project Financing Structures in the USA.” Wind Energy 12, no. 3: 295–309.

88 This report is available at no cost from the National Renewable Energy Laboratory (NREL) at www.nrel.gov/publications.
Bronski, Peter, Jon Creyts, Mark Crowdis (global X),Stephen Doig, John Glassmire (HOMER Energy), Leia Guccione, Peter Lilienthal (HOMER Energy), James Mandel, Bodhi Rader, Dan Seif (The Butler Firm), Helen Tocco (global X), Hervé Touati2015. “The Economics of Load Defection: How Grid-Connected Solar-Plus-Battery Systems Will Compete With Traditional Electric Service, Why It Matters, And Possible Paths Forward.” The Rocky Mountain Institute. April 2015.
Business Wire. 2013. “Solar Star Funding, LLC Announces Completion of $1 Billion Notes Offering for Solar Star Projects.” June 27, 2013.
CBO (Congress of the United States Congressional Budget Office). 2013. “The Distribution of Household Income and Federal Taxes, 2010.”
Chadbourne & Parke LLP. 2011. “Financing Rooftop Solar Projects in the US.” Project Finance Newswire, November 2011, pp. 24-33.
Chaudhry, Rohit. 2015. “New Financing Trends.” Chadbourne & Parke Project Finance News (July 2015).
Chung, Donald, Kelsey Horowitz, and Parthiv Kurup. 2016. On the Path to SunShot: Emerging Opportunities and Challenges in U.S. Solar Manufacturing. Golden, CO: National Renewable Energy Laboratory. NREL/TP-7A40-65788. http://www.nrel.gov/docs/fy16osti/65788.pdf.
D’Olier-Lees, T. 2015. “Solar Star Funding LLC.” Standard & Poor’s Rating Services, May 6, 2015.
———. May 28, 2015. Telephone conversation with the authors, David Feldman and Mark Bolinger.
D’Olier-Lees, T. and Berberian, L. 2015. “Standard & Poor's Approach to Rating Renewable Energy Project Finance Transactions.” Standard & Poor’s Rating Services, April 20, 2015.
Darghouth, Naïm R., Ryan Wiser, Galen Barbose, and Andrew Mills. 2015. “Net Metering and Market Feedback Loops: Exploring the Impact of Retail Rate Design on Distributed PV Deployment.” Berkeley, CA: Lawrence Berkeley National Laboratory. LBNL-183185.
Dastrup, Samuel R., Joshua Graff Zivin, Dora L. Costa, and Matthew E. Kahn. 2012. “Understanding the Solar Home Price Premium: Electricity Generation and “Green” Social Status.” European Economic Review 56: 961–973.
Davidson, Carolyn, Gagnon, Pieter, Denholm, Paul, and Margolis, Robert. 2015. “Nationwide Analysis of U.S. Commercial Building Solar Photovoltaic (PV) Breakeven Conditions.” Golden, CO: National Renewable Energy Laboratory. NREL/TP-6A20-64793.
Denholm, Paul, Kara Clark, and Matt O’Connell. 2016. On the Path to SunShot: Emerging Issues and Challenges in Integrating High Levels of Solar into the Electrical Generation and Transmission System. Golden, CO: National Renewable Energy Laboratory. NREL/TP-6A20-65800. http://www.nrel.gov/docs/fy16osti/65800.pdf.

89 This report is available at no cost from the National Renewable Energy Laboratory (NREL) at www.nrel.gov/publications.
Desmarais, Lisa. 2013. The Impact of Photovoltaic Systems on Market Value and Marketability: A Case Study of 30 Single‐Family Homes in the North and Northwest Denver Metro Area. Colorado Energy Office.
DIRECTV. 2015. “Form 10-K for the Period Ending 12/31/14.”
DOE (U.S. Department of Energy). 2012. “SunShot Vision Study.” Washington, DC: U.S. Department of Energy. DOE/GO-102012-3037. http://www.nrel.gov/docs/fy12osti/47927.pdf.
DSIRE (Database of State Incentives for Renewables & Efficiency). (2015). http://www.dsireusa.org/. Accessed October 30, 2015
EIA (U.S. Energy Information Administration). 2006. Form EIA-871A of the 2003 Commercial Buildings Energy Consumption Survey. Released October 2006. Washington, DC: U.S. Energy Information Administration.
EIA (U.S. Energy Information Administration). 2015a. “2013 Total Electric Industry- Average Retail Price (cents/kWh).” Forms EIA-861. Accessed October 21, 2015: http://www.eia.gov/electricity/data.cfm#sales.
———. 2015b. “Annual Energy Outlook 2015.” Data from Forms EIA-861: Schedules 4A-D, EIA-861S and EIA-861U.
ELFA (Equipment Leasing and Finance Association). 2015a. “Equipment Financing Volume & Public & Private Investment in Equipment & Software.” http://www.elfaonline.org/data/?fa=Trends Accessed October 21, 2015.
———. 2015b. "Fact Sheet: Equipment Finance in the Medical Equipment Industry." September 2015. https://www.elfaonline.org/data/PDFs/EMA/ELFAFactSheet_ MedicalEquipment_Sept15.pdf. Accessed October 21, 2015.
Emrath, Paul. 2013. “Latest Calculations Show Average Buyer Expected to Stay in a Home 13 Years.” National Association of Home Builders.
Everett, Craig. 2015. “2015 Capital Markets Report: Pepperdine Private Capital Markets Project.” Pepperdine University Graziadio School of Business and Management.
Farhar, Barbara C. 2008. “Advancing a Market for Zero-Energy Homes.” Solar Today 22, no 1: 24–29.
FASB (Financial Accounting Standards Board). 2015. “FASB Votes to Proceed with Final Standard on Leases.” http://www.fasb.org/cs/ContentServer?c=FASBContent_C&pagename= FASB%2FFASBContent_C%2FNewsPage&cid=1176167530388. November 11, 2015. Accessed December 15, 2015.
Feldman, David, and Edward Settle. 2013. “Master Limited Partnerships and Real Estate Investment Trusts: Opportunities and Potential Complications for Renewable Energy.” Golden, CO: National Renewable Energy Laboratory. NREL/TP-6A20-60413.

90 This report is available at no cost from the National Renewable Energy Laboratory (NREL) at www.nrel.gov/publications.
Feldman, David, and Mark Bolinger. 2016. On the Path to SunShot: Emerging Opportunities and Challenges in Financing Solar. Golden, CO: National Renewable Energy Laboratory. NREL/TP-6A20-65638. http://www.nrel.gov/docs/fy16osti/65638.pdf.
Feldman, David, and Robert Margolis. 2014. “To Own or Lease Solar: Understanding Commercial Retailers’ Decisions to Use Alternative Financing Models.” Golden, CO: National Renewable Energy Laboratory. NREL/TP-6A20-63216.
Feldman, David and Travis Lowder. 2014. “Banking on Solar: An Analysis of Banking Opportunities in the Distributed Photovoltaic Market.” Golden, CO: National Renewable Energy Laboratory. NREL/TP-6A20-62605.
Feldman, David, Anna M. Brockway, Elaine Ulrich, and Robert Margolis. 2015. “Shared Solar: Current Landscape, Market Potential, and the Impact of Federal Securities Regulation.” Golden, CO: National Renewable Energy Laboratory. NREL/TP-6A20-63892.
Ferguson, Michael. 2015. “Presale Report: Panda Temple Power LLC.” Standard & Poor’s Rating Services, February 17, 2015.
Fitch Ratings. 2012. “Differentiating Solar Technology Risks: A Comparative Focus at the Utility Scale, Special Report.” Global Infrastructure & Project Finance. September 11, 2012.
Fitch Ratings. 2015a. “Rating Criteria for Solar Power Projects Utility-Scale Photovoltaic, Concentrating Photovoltaic and Concentrating Solar Power.” May 28, 2015.
Fitch Ratings. 2015b. “Encouraging Early Results for Solar Power Projects (Uncertainty Remains for Long-Term Performance” October 20, 2015.
Gilmore, J., B. Vanderwaal, I. Rose, and J. Riesz. 2015. “Integration of Solar Generation into Electricity Markets: An Australian National Electricity Market Case Study.” IET Renewable Power Generation 9, no. 1: 46–56. doi:10.1049/iet-rpg.2014.0108.
Grant, Terry, and Cornfeld, Josh. (2015). “The Future of the YieldCo.” Marathon Capital white paper, November 2015.
Groobey, Chris, John Pierce, Michel Faber, and Greg Broome. 2010. “Project Finance Primer for Renewable Energy and Clean Tech Projects.” Wilson Sonsini Goodrich & Rosati. August 2010.
GTM Research. 2015a. “U.S. Residential Solar Financing: 2015–2020.” Boston, MA. Nicole Litvak. July 2015.
GTM Research. 2015b. “U.S. Community Solar Market Outlook 2015–2020.” Boston, MA. Cory Honeyman, MJ Shiao, and Camron Barati. June 2015.
Hansen, Lena, Virginia Lacy, and Devi Glick. 2013. “A Review of Solar PV Benefit & Cost Studies.” Boulder, CO: The Rocky Mountain Institute.

91 This report is available at no cost from the National Renewable Energy Laboratory (NREL) at www.nrel.gov/publications.
Heeter, J., Gelman, R., Bird, L. 2014. “Status of Net Metering: Assessing the Potential to Reach Program Caps.” Golden, CO: National Renewable Energy Laboratory. NREL/TP-6A20-61858.
Hirth, Lion. 2013. “The Market Value of Variable Renewables: The Effect of Solar Wind Power Variability on Their Relative Price.” Energy Economics, 38(July): 218–236.
Hoen, Ben, Ryan Wiser, Mark Thayer, and Peter Cappers. 2013. “Residential Photovoltaic Energy Systems in California: The Effect on Home Sales Prices.” Contemporary Economic Policy 31, no. 4: 708–718.
Hoen, Ben, Ryan Wiser, Peter Cappers, and Mark Thayer. 2011. “An Analysis of the Effects of Photovoltaic Energy Systems on Residential Selling Prices in California.” Berkeley, CA: Lawrence Berkeley National Laboratory. LBNL-4476E
Hoen, Ben, Ryan Wiser, Sandra Adomatis, Thomas Jackson, Joshua Graff-Zivin, Mark Thayer, and Geoffrey T. Klise. 2015. “Price Premium Analysis of a Multi-State Dataset of Solar Homes: Host-Owned Rooftop Solar adds Significant Value to U.S. Homes across 8 States.” Berkeley, CA: Lawrence Berkeley National Laboratory.
Home Depot. 2015. “Form 10-K (Annual Report) for the Fiscal Year Ended February 1, 2015.”
HUD (U.S. Department of Housing and Urban Development). 2015. “Guidance for Use of FHA Financing on Homes with Existing PACE Liens and Flexible Underwriting through Energy Department’s Home Energy Score.” From the desk of Ed Golding, Principal Deputy Assistant Secretary for Housing and Head of the FHA. August 24, 2015.
Justice, Sophie. 2009. “Private Financing of Renewable Energy: A Guide for Policymakers.” UNEP, SEFI, Bloomberg NEF, and Chatham House. December 2009.
Kidney, Sean. 2015. “Weekly Update.” Climate Bonds Initiative. March 10, 2015.
Kimber, Sheldon. 2013. “Financing Models that Move Solar into the Mainstream.” Recurrent Energy presentation at Intersolar 2013, San Francisco, California, July 10, 2013.
Kroll Bond Rating Agency. (2015). “Sunrun Callisto Issuer 2015-1, LLC, Series 2015-1.” June 23, 2015.
Lowder, Travis, and Michael Mendelsohn. 2013. “The Potential of Securitization in Solar PV Finance.” Golden, CO: The National Renewable Energy Laboratory. NREL/TP-6A20-60230.
Lowe’s. (2015). “2014 Annual Report.”
Martin, Keith. 2015a. “Solar Tax Equity Market: State of Play.” Chadbourne & Parke Project Finance News (May 2015).
Martin, Keith. 2015b. “Cost of Capital: 2015 Outlook.” Chadbourne & Parke Project Finance News (February 2015).
92 This report is available at no cost from the National Renewable Energy Laboratory (NREL) at www.nrel.gov/publications.
Mehos, Mark, Craig Turchi, Jennie Jorgenson, Paul Denholm, Clifford Ho, and Kenneth Armijo. 2016. On the Path to SunShot: Advancing Concentrating Solar Power Technology, Performance, and Dispatchability. Golden, CO: National Renewable Energy Laboratory. NREL/TP-5500-65668. http://www.nrel.gov/docs/fy16osti/65668.pdf.
Mendelsohn, Michael, and David Feldman. 2013. “Financing U.S. Renewable Energy Projects Through Public Capital Vehicles: Qualitative and Quantitative Benefits.” Golden, CO: National Renewable Energy Laboratory. NREL/TP-6A20-58315.
Mendelsohn, Michael, and John Harper. 2012. “§1603 Treasury Grant Expiration: Industry Insight on Financing and Market Implications.” Golden, CO: National Renewable Energy Laboratory. NREL/TP-6A20-53720.
Mills, Andrew D., and Ryan H. Wiser. 2013. “Changes in the Economic Value of Photovoltaic Generation at High Penetration Levels: A Pilot Case Study of California.” IEEE Journal of Photovoltaics, 3, no. 4: 1394–1402.
NBCUniversal Media. 2015. “Form 10-K (Annual Report) Filed 02/27/15 for the Period Ending 12/31/14.”
NREL (National Renewable Energy Laboratory). 2015. “NREL Activities to Open Capital Market Investment and Bank Lending for Solar Deployment.” https://financere.nrel.gov/ finance/files/Securitization_Presentation.pdf, May 6, 2015.
Palmintier, Bryan, Robert Broderick, Barry Mather, Michael Coddington, Kyri Baker, Fei Ding, Matthew Reno, Matthew Lave, and Ashwini Bharatkumar. 2016. On the Path to SunShot: Emerging Issues and Challenges in Integrating Solar with the Distribution System. Golden, CO: National Renewable Energy Laboratory. NREL/TP-5D00-65331. http://www.nrel.gov/docs/ fy16osti/65331.pdf.
Patterson, Dick, and Sandy Burns. June 26, 2015. Telephone conversation with the authors, David Feldman and Mark Bolinger.
Pennsylvania PUC (Public Utility Commission). 2015. “Pennsylvania AEPS Alternative Energy Credit Program.” http://paaeps.com/credit/pricing.do. Accessed October 21, 2015.
Puttré, Michael. 2015a. “News of the Yieldco’s Demise Has Been Greatly Exaggerated.” Solar Industry 8, no. 11 (December 2015).
———. 2015b. “Standard & Poor's Fine-Tunes Ratings Methodology for Solar Energy Projects.” Solar Industry 2, no. 44 (May 13, 2015_.
Reuters. 2013. “Forward Calendar: U.S. Corporate Bond New Issues.” June 20, 2013.
Saxon, Steve. 2012. “Getting More Value from Your Fleet.” McKinsey on Finance 43, Spring 2012.

93 This report is available at no cost from the National Renewable Energy Laboratory (NREL) at www.nrel.gov/publications.
Schwabe, Paul, Michael Mendelsohn, Felix Mormann, and Douglas J. Arent. 2012. “Mobilizing Public Markets to Finance Renewable Energy Projects: Insight from Expert Stakeholders.” Golden, CO: National Renewable Energy Laboratory. NREL/TP-6A20-55021.
Segal, Lewis M., and Daniel G. Sullivan. 1998. “Trends in Homeownership: Race, Demographics, and Income.” Federal Reserve Bank of Chicago. Economic Perspectives 22: 53–72
SEIA and GTM Research (Solar Energy Industries Association and GTM Research). 2015a. “U.S. Solar Market Insight: 2014 Year-in-Review.” Washington, DC: Solar Energy Industries Association. March 2015.
———. 2015b. “U.S. Solar Market Insight: Q2 2015.” Washington, DC: Solar Energy Industries Association. September 2015.
Sherwood, Larry. 2010. “U.S. Solar Market Trends 2009.” Interstate Renewable Energy Council. July 2010.
Sigrin, Benjamin. 2013. “Financial Modeling of Consumer Discount Rate in Residential Solar Photovoltaic Purchasing Decisions.” Thesis. University of Texas at Austin. May 2013. https://repositories.lib.utexas.edu/handle/2152/21759.
SolarCity. 2015a. “Form 10-K (Annual Report) Filed 02/24/15 for the Period Ending 12/31/14.”
SolarCity. 2015b. “Investor Presentation, November 2015.”
Stoltenberg, Blaise. 2012. “Funding Solar Projects at Federal Agencies: Mechanisms and Selection Criteria.” Golden, CO: National Renewable Energy Laboratory. NREL/BR-6A20-53322.
Sunrun. 2015. “Form S-1 Registration Statement.” As filed with the Securities and Exchange Commission on June 25, 2015.
Standard & Poor’s. 2014. “Ratings Direct: SolarCity LMC Series II LLC (Series 2014-1).” April 1, 2014.
U.S. Department of the Treasury. 2009. “Payments for Specified Energy Property in Lieu of Tax Credits under the American Recovery and Reinvestment Act of 2009: Program Guidance.”
U.S. Department of the Treasury. 2015. “Your Federal Income Tax for Individuals: Tax Guide 2014 for Individuals.” Internal Revenue Service Publication 17 Catalog Number 10311G. February 6, 2015.
U.S. GAO (United States Government Accountability Office). 2015. “DOE Loan Programs: Current Estimated Net Costs Include $2.2 Billion in Credit Subsidy, Plus Administrative Expenses.” Report to Congressional Committees. April 2015.

94 This report is available at no cost from the National Renewable Energy Laboratory (NREL) at www.nrel.gov/publications.
Vivint Solar. 2015. “Form 10-K (Annual Report) Filed 03/13/15 for the Period Ending 12/31/14.”
Watkins and Associates. 2011. “Market-Based Investigation of Residential Solar Installation Values in Oregon.” Portland, OR: Energy Trust of Oregon.
White, P. 2011. “Sale-Leaseback Community Wind: Phoenix Rising…Further?” AWEA’s Small & Community Wind Conference, Des Moines, IA, September 15, 2011.
Wiser, Ryan, and Mark Bolinger. 2015. “2014 Wind Technologies Market Report.” Washington, DC: U.S. Department of Energy. DOE/GO-102015-4702.
Wiser, Ryan, Trieu Mai, Dev Millstein, Jordan Macknick, Alberta Carpenter, Stuart Cohen, Wesley Cole, Bethany Frew, and Garvin A. Heath. 2016. On the Path to SunShot: The Environmental and Public Health Benefits of Achieving High Penetrations of Solar Energy in the United States. Golden, CO: National Renewable Energy Laboratory. NREL/TP-6A20-65628. http://www.nrel.gov/docs/fy16osti/65628.pdf.
Woodhouse, Michael, Rebecca Jones-Albertus, David Feldman, Ran Fu, Kelsey Horowitz, Donald Chung, Dirk Jordan, and Sarah Kurtz. 2016. On the Path to SunShot: The Role of Advancements in Solar Photovoltaic Efficiency, Reliability, and Costs. Golden, CO: National Renewable Energy Laboratory. NREL/TP-6A20-65464. http://www.nrel.gov/docs/fy16osti/ 65464.pdf.
Zabritski, Melinda. 2015. “State of the Automotive Finance Market First Quarter 2015.” Experian Automotive. June 11, 2015.