On the orientation of plane tensegrity cytoskeletons under...
14
Advances in Bioscience and Biotechnology, 2010, 1, 12-25 doi:10.4236/abb.2010.11003 Published Online April 2010 (http://www.SciRP.org/journal/abb/ ABB ). Published Online April 2010 in SciRes. http://www.scirp.org/journal/abb On the orientation of plane tensegrity cytoskeletons under biaxial substrate stretching Athanassios P. Pirentis, Konstantinos A. Lazopoulos * Department of Mechanics, Faculty of Applied Mathematical and Physical Sciences, National Technical University of Athens, Athens, Greece. Email: [email protected] Received 12 February 2010; revised 26 February 2010; accepted 6 March 2010. ABSTRACT Two different simple cases of plane tensegrity cy- toskeleton geometries are presented and investigated in terms of stability. The tensegrity frames are used to model adherent cell cytoskeletal behaviour under the application of plane substrate stretching and de- scribe thoroughly the experimentally observed re- orientation phenomenon. Both models comprise two elastic bars (microtubules), four elastic strings (actin filaments) and are attached on an elastic substrate. In the absence of external loading shape stability of the cytoskeleton is dominated by its prestress. Upon ap- plication of external loading, the cytoskeleton is re- organized in a new direction such that its total poten- tial energy is rendered a global minimum. Consider- ing linear constitutive relations, yet large deforma- tions, it is revealed that the reorientation phenome- non can be successfully treated as a problem of ma- thematical stability. It is found that apart from the magnitude of contractile prestress and the magnitude of extracellular stretching, the reorientation is strongly shape–dependent as well. Numerical appli- cations not only justify laboratory data reported in literature but such experimental evidence as the concurrent appearance of two distinct and symmetric directions of orientation, indicating the cellular coex- istence of phases phenomenon, are clearly detected and incorporated in the proposed mathematical treatment. Keywords: Tensegrity; Cytoskeleton; Adherent Cells; Reorientation; Stability; Coexistence of Phases 1. INTRODUCTION Active adherent cells alter their orientation direction, defined by their long axis, in response to substrate stret- ching. In absence of external strain field cells appear with random orientation; yet, the application of ex- tracellular strain results to a concerted reorganization of the components of the cytoskeleton (CSK) in the new direction. The CSK is the intracellular network that con- sists of different types of biopolymers such as actin and intermediate microfilaments, microtubules, myosin and other filaments, and acts concurrently as a supporting frame and chief regulator of cell deformability. Constant remodelling of the CSK directly affects almost all func- tions of living cells like growth, differentiation, mitosis, apoptosis, motility, cell locomotion, etc. ([1] and refer- ences therein). In the case of cells adherent to an elastic substrate, the actin CSK disassembles and reassembles under stretching of the substrate in order to mechanically stabilize the cell by means of the so-called intracellular contractile mechanism, that is, the generation of tensile forces in the actin filaments by myosin motor proteins through the ATP-driven process of myosin crossbridge cycling. Experimental observations report that the direc- tion of cellular orientation is primarily governed by the magnitude of the extracellular strain field and the strength of the contractile mechanism [2-5]. Depending on these agents, cells have been observed to align either with the direction of the maximum extracellular stretch component [6-9], or perpendicular to it [2-5,10-15]. Specifically, under the effect of static or quasi–static substrate stretch cells orient parallel to the direction of maximum stretch [6,7,9], whereas in response to dy- namic stretching they align perpendicularly to the direc- tion of maximum stretch [2-5,10-15]. However, there also exists a special case of cellular orientation behav- iour; independent experiments have confirmed the dis- covery that under the same substrate stretching such a configuration is possible that two distinct orientation directions (phases) of the cells coexist [3,5]. In the present study the cellular orientation phenome- non is addressed by employing two simple mechanical models belonging to a family of structural systems known as tensegrity. Tensegrities are reticulated struc- tures forming a highly geometric combination of bars
Transcript of On the orientation of plane tensegrity cytoskeletons under...
Advances in Bioscience and Biotechnology, 2010, 1, 12-25 doi:10.4236/abb.2010.11003 Published Online April 2010 (http://www.SciRP.org/journal/abb/
ABB ).
Published Online April 2010 in SciRes. http://www.scirp.org/journal/abb
On the orientation of plane tensegrity cytoskeletons under biaxial substrate stretching Athanassios P. Pirentis, Konstantinos A. Lazopoulos* Department of Mechanics, Faculty of Applied Mathematical and Physical Sciences, National Technical University of Athens, Athens, Greece. Email: [email protected] Received 12 February 2010; revised 26 February 2010; accepted 6 March 2010. ABSTRACT
Two different simple cases of plane tensegrity cy-toskeleton geometries are presented and investigated in terms of stability. The tensegrity frames are used to model adherent cell cytoskeletal behaviour under the application of plane substrate stretching and de-scribe thoroughly the experimentally observed re-orientation phenomenon. Both models comprise two elastic bars (microtubules), four elastic strings (actin filaments) and are attached on an elastic substrate. In the absence of external loading shape stability of the cytoskeleton is dominated by its prestress. Upon ap-plication of external loading, the cytoskeleton is re-organized in a new direction such that its total poten-tial energy is rendered a global minimum. Consider-ing linear constitutive relations, yet large deforma-tions, it is revealed that the reorientation phenome-non can be successfully treated as a problem of ma- thematical stability. It is found that apart from the magnitude of contractile prestress and the magnitude of extracellular stretching, the reorientation is strongly shape–dependent as well. Numerical appli-cations not only justify laboratory data reported in literature but such experimental evidence as the concurrent appearance of two distinct and symmetric directions of orientation, indicating the cellular coex-istence of phases phenomenon, are clearly detected and incorporated in the proposed mathematical treatment. Keywords: Tensegrity; Cytoskeleton; Adherent Cells; Reorientation; Stability; Coexistence of Phases
1. INTRODUCTION Active adherent cells alter their orientation direction, defined by their long axis, in response to substrate stret- ching. In absence of external strain field cells appear with random orientation; yet, the application of ex-
tracellular strain results to a concerted reorganization of the components of the cytoskeleton (CSK) in the new direction. The CSK is the intracellular network that con-sists of different types of biopolymers such as actin and intermediate microfilaments, microtubules, myosin and other filaments, and acts concurrently as a supporting frame and chief regulator of cell deformability. Constant remodelling of the CSK directly affects almost all func-tions of living cells like growth, differentiation, mitosis, apoptosis, motility, cell locomotion, etc. ([1] and refer-ences therein). In the case of cells adherent to an elastic substrate, the actin CSK disassembles and reassembles under stretching of the substrate in order to mechanically stabilize the cell by means of the so-called intracellular contractile mechanism, that is, the generation of tensile forces in the actin filaments by myosin motor proteins through the ATP-driven process of myosin crossbridge cycling. Experimental observations report that the direc-tion of cellular orientation is primarily governed by the magnitude of the extracellular strain field and the strength of the contractile mechanism [2-5]. Depending on these agents, cells have been observed to align either with the direction of the maximum extracellular stretch component [6-9], or perpendicular to it [2-5,10-15]. Specifically, under the effect of static or quasi–static substrate stretch cells orient parallel to the direction of maximum stretch [6,7,9], whereas in response to dy-namic stretching they align perpendicularly to the direc-tion of maximum stretch [2-5,10-15]. However, there also exists a special case of cellular orientation behav-iour; independent experiments have confirmed the dis-covery that under the same substrate stretching such a configuration is possible that two distinct orientation directions (phases) of the cells coexist [3,5].
In the present study the cellular orientation phenome-non is addressed by employing two simple mechanical models belonging to a family of structural systems known as tensegrity. Tensegrities are reticulated struc-tures forming a highly geometric combination of bars

A. P. Pirentis et al. / J. Advances in Bioscience and Biotechnology 1 (2010) 12-25 13
Copyright © 2010 SciRes. ABB
and strings in space. In fact, tensegrity is a portmanteau word for “tension-integrity” referring to the integrity of structures as being based in a synergy between balanced continuous tension (elastic strings) and discontinuous compression (elastic bars) components. Pre–existing tensile stress in the string members, termed prestress, is required even before the application of any external loading in order to maintain structural stability. There already exists extensive literature regarding the ad-vanced mathematics and mechanics used for the integral description of these structures [16-20], as well as the successful identification of the principles of tensegrity architecture to cytoskeletal biomechanics [21-24]. In fact, some of the characteristic mechanical properties of the CSK were initially predicted by the cellular tensegrity model and were later verified in laboratory experiments as such [21,24].
Since reorganization of the CSK is observed at high extracellular strains (of the order 10%–110%), Finite Elasticity principles and methods will be followed. Adopting Maxwell’s convention for stability [25,26], two different planar tensegrity CSK geometries are introduced and the stability of their orientation direc-tions under the application of biaxial substrate stretching is studied. As it is the case for their biologi-cal counterparts, under the effect of stretching, the planar tensegrity models are considered to deform and reorient in a new direction. In concert to Maxwell’s convention, it is assumed that this new orientation di-rection, out of all the available ones, renders the total potential energy function of the given tensegrity CSK model a global minimum. Recently, the same analyti-cal methodology presented in this study was used to theoretically investigate the problem of stress fibre reorientation under both static and cyclic substrate stretching [27-29]. The current treatment is an exten-sion of the previous work to the cellular scale, and enhances further the former effort that had not focused on the intracellular microstructure but considered the cell as a generalized Mooney–Rivlin elastic material [30]. The properties of the plane tensegrity models are discussed in detail in the next sections. However, it is pointed out that in the following and in terms of cell physiology, elastic string members correspond to actin microfilaments, elastic bar members correspond to microtubules and the tensegrity frames are anchored on the elastic substrate through their vertices, repre-senting focal adhesions complexes on the extracellular matrix.
2. THE PLANE TENSEGRITY CYTOSKELETON MODELS
For the theoretical description of the reorientation phe- nomenon the CSK is modelled by two independent pla-nar tensegrity frames of rectangular and rhombic shape,
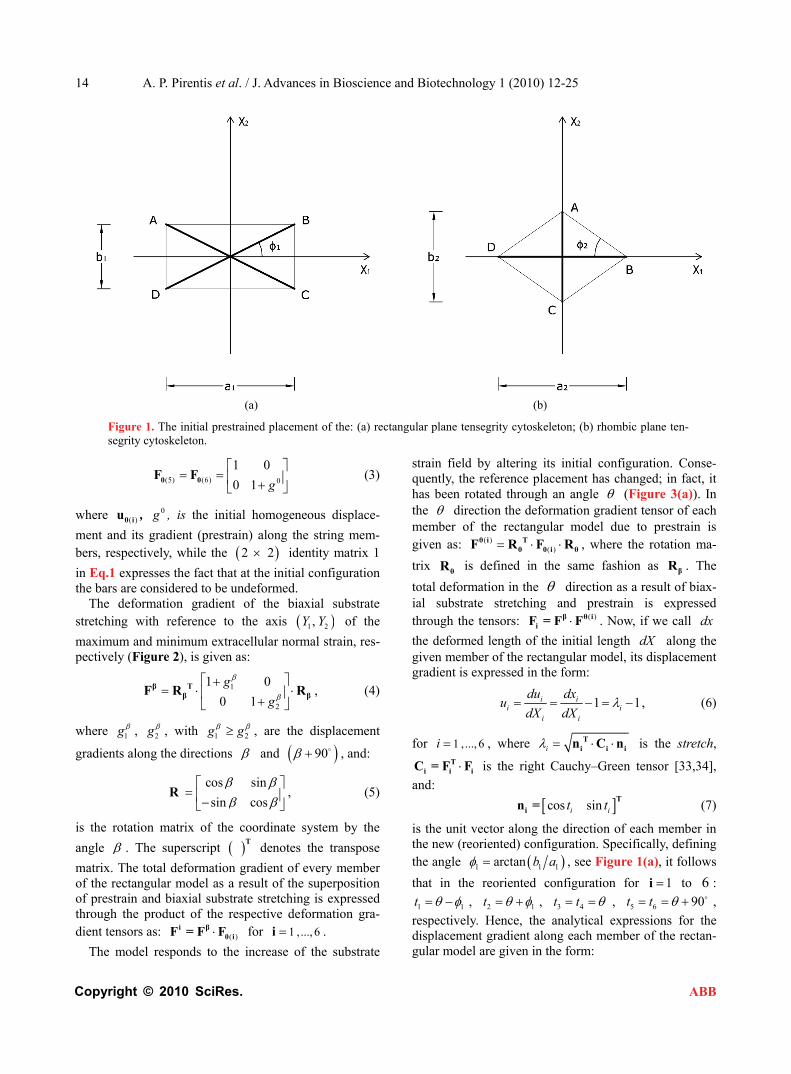
respectively (Figure 1). Both frames comprise four elas-tic strings and two elastic bars (not joint at their intersec-tion) and are attached upon an elastic substrate through their vertices. It is apparent from Figure 1 that the strings occupy the sides of the models while the bars are identified with the diagonals. In accordance to cellular physiology, the cross–section area of the bars is consid-ered to be eight (8) times that of the strings [21,31], the elastic moduli of all members (both strings and bars) are assumed to be the same [21,31], and their constitutive equations are considered to be linear [21,31]. Albeit, nonlinear behaviour of the system may still be exhibited; it has been shown that it is mainly a result of geometrical rearrangement of the structural members under the effect of external loading, rather than intrinsic nonlinearity of the members themselves [32]. Further, in the initial con-figuration where no stretch is applied, it is assumed that all string members acquire the same prestrain due to the existing myosin–actin contractility motor systems. The prestrain of the strings is equilibrated entirely through reaction forces applied by the substrate at the vertices of the tensegrity model. Thus, the bars are considered to be initially unstressed. Finally, in the initial configuration, the origin of an orthogonal Cartesian coordinate system
is defined to coincide with the geometric centre
of the models, while their long axis is originally aligned with the
1 2OX X
1X axis of the coordinate system (Figure 1).
In absence of extracellular strain field the shape sta-bility of the models is controlled by prestrain. Next, bi-axial substrate stretching is applied in the directions de-fined by the angles and ( ), cf. Figure 2. As
mentioned above, due to the increased strain in the sub-strate the models deform and reorient to a new (current) orientation direction (Figure 3). The current direction is the one, out of all available orientation directions, that corresponds to the global minimum of the total potential energy of the models.
90
2.1. The Rectangular Model
The initial configuration of the rectangular tensegrity CSK model (henceforth simply rectangular model) is illustrated in Figure 1(a). Assigning the index values: i = 1, 2 to the bars (AC) and (BD), i = 3, 4 to the strings (AB) and (CD) with initial length a1, i = 5, 6 to the strings (BC) και (DA) with initial length b1, and taking advantage of the model geometry, the initial deformation of every structural member due to prestrain is described by the deformation gradient tensors , in the
fashion: ( ) ( )0 i 0 iF = I + u
I
0
(1) ( ) ( ) 0 1 0 2F F
0
(3) (4)
1
0 1
g
0 0F F (2)
14 A. P. Pirentis et al. / J. Advances in Bioscience and Biotechnology 1 (2010) 12-25
Copyright © 2010 SciRes.
(a) (b)
Figure 1. The initial prestrained placement of the: (a) rectangular plane tensegrity cytoskeleton; (b) rhombic plane ten-segrity cytoskeleton.
(5) (6) 0
1 0
0 1 g
0 0F F (3)
where , ( )0 iu 0g , is the initial homogeneous displace-
ment and its gradient (prestrain) along the string mem-bers, respectively, while the 2 2 identity matrix 1
in Eq.1 expresses the fact that at the initial configuration the bars are considered to be undeformed.
The deformation gradient of the biaxial substrate stretching with reference to the axis 1 2,Y Y of the
maximum and minimum extracellular normal strain, res- pectively (Figure 2), is given as:
1
2
1 0
0 1
g
g
β Tβ βF R R , (4)
ABB
where 1g , 2g , with 1 2g g , are the displacement
gradients along the directions and , and: 90
cos sin
sin cos
β
R , (5)
is the rotation matrix of the coordinate system by the
angle . The superscript denotes the transpose
matrix. The total deformation gradient of every member of the rectangular model as a result of the superposition of prestrain and biaxial substrate stretching is expressed through the product of the respective deformation gra-dient tensors as: for .
T
( )0 iFi βF = F 1 ,..., 6i
The model responds to the increase of the substrate
strain field by altering its initial configuration. Conse-quently, the reference placement has changed; in fact, it has been rotated through an angle (Figure 3(a)). In the direction the deformation gradient tensor of each member of the rectangular model due to prestrain is given as: ( )
( ) θ i Tθ 0 i θF R F R , where the rotation ma-
trix θR is defined in the same fashion as . The
total deformation in the βR
direction as a result of biax-ial substrate stretching and prestrain is expressed through the tensors: . Now, if we call
the deformed length of the initial length along the given member of the rectangular model, its displacement gradient is expressed in the form:
( )θ iβiF = F F dx
dX
1i ii i
i i
du dxu
dX dX 1 , (6)
for 1 ,..., 6i , where i Ti in C ni is the stretch,
Ti i iC = F F is the right Cauchy–Green tensor [33,34],
and:
cos sini it tT
in = (7)
is the unit vector along the direction of each member in the new (reoriented) configuration. Specifically, defining the angle 1 1arctan b a 1 , see Figure 1(a), it follows
that in the reoriented configuration for 1i to : 6
1 1t , 2 1t , 3 4t t , ,
respectively. Hence, the analytical expressions for the displacement gradient along each member of the rectan- gular model are given in the form:
5 6t t 90

A. P. Pirentis et al. / J. Advances in Bioscience and Biotechnology 1 (2010) 12-25 15
Copyright © 2010 SciRes. ABB
1 1 1 2 2
12
1 1 2 2 1 1
11 2 2 2
2
2 2 cos 2 arctan ,
{
}
u g g g g
g g g g b a
(8)
2 1 1 2 2
12
1 1 2 2 1 1
11 2 2 2
2
2 2 cos 2 arctan ,
{
}
u g g g g
g g g g b a
(9)
03 4 1 1 2 2
12
1 1 2 2
11 1 2 2 2
2
2 2 cos 2
{
}
u u g g g g g
g g g g
,
(10)
05 6 1 1 2 2
12
1 1 2 2
11 1 2 2 2
2
2 2 cos 2
{
}
u u g g g g g
g g g g
.
(11)
2.2. The Rhombic Model
The initial configuration of the rhombic tensegrity CSK model (henceforth simply rhombic model) is illustrated in Figure 1(b). The deformation analysis of the model follows the exact same steps as in the previous section. Thus, we assign the index values: 1j to the bar
with initial length , DB 2a 2j to the bar CA
with initial length , and 2b 3j to to the strings 6
AB , , , , respectively, that consti-
tute the rhombic model perimeter. The initial deforma-tion of each member due to prestrain is described in terms of the deformation gradient tensors as:
BC CD DA
( )0 jF
( ) ( ) 0 1 0 2F F I (12)
0
( )
1 0
0 1
g
T
0 j ω ωj jF R R , with 3 ,...,6j , (13)
where 0g is the initial homogeneous displacement gra-
dient (prestrain) along the strings, is the I 2 2
identity matrix expressing, again, the fact that at the ini-tial configuration the bars are considered to be unde-formed, and ωj
R is the rotation matrix with explicit
form:
cos sin
sin cosj j
j j
ωjR
(14)
Defining the angle 2 2arctan b a
Figure 2. The geometry of the biaxial substrate stretching and
ation gradient of the biaxial substrate
its coordinate system.
spectively. reThe deform
stretching is provided again from Eq.4. The total defor-mation gradient of the members of the rhombic model, as a result of prestrain and the strain field of the sub-strate, is given through the product of the respective de-formation gradient tensors as: ( )j β
0 jF = F F with
1 ,...,6j . In response to the increas initial
ion of the model is changed to the new direc-tion
ed strain the
configurat . In the direction the deformation gradient
tensor each me ber of the rhombic model due to pre-strain is given as: ( )
( )
of m θ j T
θ 0 j θF R F R . Hence, the total
deformation in the direction due to prestrain and the superimposed biaxial substrate stretching is expressed through the tensors: ( )β θ j
jF = F F . Now, the displace-
2 , see Figure 1(b),
from the rhombic model geometry follows that for 3j
to 6 : 23 , 24 , 25 , 26 ,
16 A. P. Pirentis et al. / J. Advances in Bioscience and Biotechnology 1 (2010) 12-25
Copyright © 2010 SciRes. ABB
(a) (b)
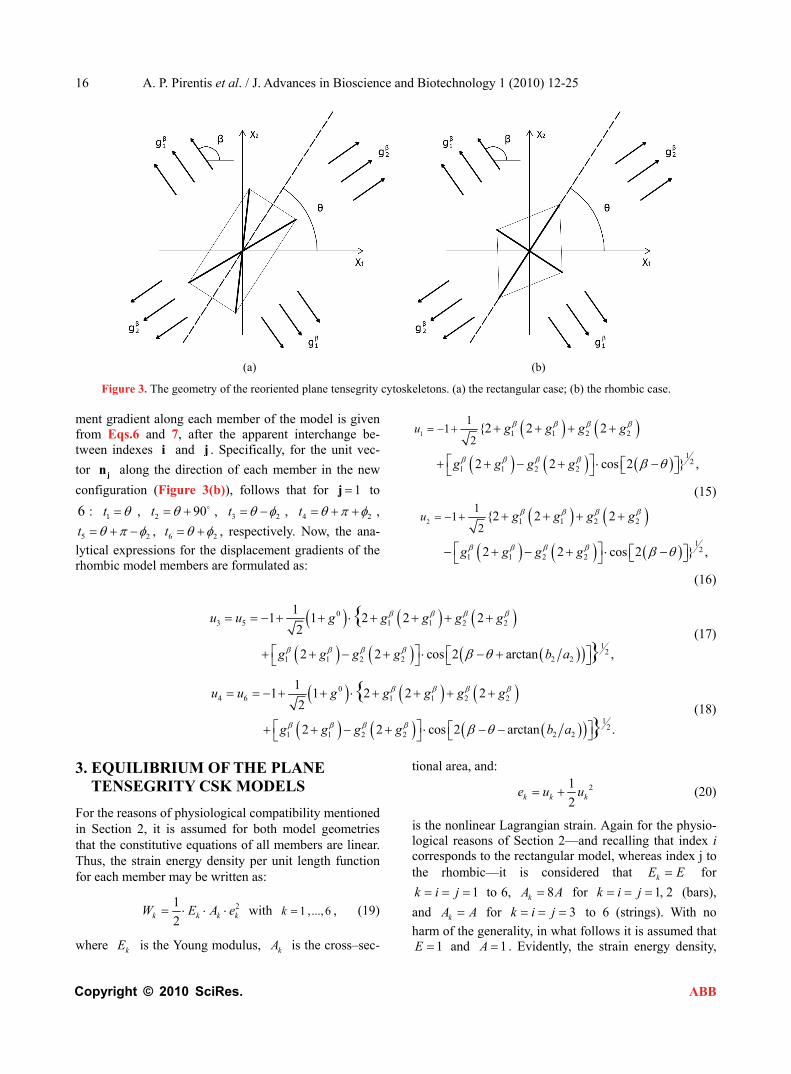
igure 3. The geometr se; (b) the rhombic case.
en
F y of the reoriented plane tensegrity cytoskeletons. (a) the rectangular ca
m t gradient along each member of the model is given from Eqs.6 and 7, after the apparent interchange be-tween indexes i and j . Specifically, for the unit vec-
tor jn along the direction of each member in the new
conf ration (Figure 3(b)), follows that for 1igu j to
6 : 1t , 2 90t , 3 2t , 4 2t ,
5 2t , t6 2 , y. -
sio displacement gradients of the rhombic model members are formulated as:
respectivel Now, a the an
1 1 1 2 2
12
1 1 2 2
11
2{2 2 2
2 2 cos 2
u g g g g
g g g g
} ,
(15)
2 1 1 2 2
12
1 1 2 2
11
2{2 2 2
2 2 cos 2
u g g g g
g g g g
lytical expres ns for the } ,
(16)
03 5 1 1 2 2
12
1 1 2 2 2 2
11 1 2 2 2
2
2 2 cos 2 arctan ,
{
}
u u g g g g g
g g g g b a
(17)
04 6 1 1 2 2
12
1 1 2 2 2 2
11 1 2 2 2
2
2 2 cos 2 arctan .
{
}
u u g g g g g
g g g g b a
(18)
. EQUILIBRIUM OF THE PLANE
Fo y mentioned
3TENSEGRITY CSK MODELS
r the reasons of physiological compatibilitin Section 2, it is assumed for both model geometries that the constitutive equations of all members are linear. Thus, the strain energy density per unit length function for each member may be written as:
21W E A e with
2k k k k (19)
where is the Young modulus,
1 ,..., 6k ,
is the cross–sec-
tional area, and:
kE kA
21k k ke u u (20)
2
is the nonlinear Lagrangian strainlogical reasons of Section 2—and
. Again for the physio- recalling that index i
corresponds to the rectangular model, whereas index j tothe rhombic—it is considered that kE E for
1k i j to 6, 8kA A for 1, 2k i j (bars),
and kA A for 3k i j to 6 (string h no
ed that
s). Wit
assumharm1E of the generality, in what follows it is
and 1A . Evidently, the strain ener , gy density

A. P. Pirentis et al. / J. Advances in Bioscience and Biotechnology 1 (2010) 12-25 17
Copyright © 2010 SciRes.
gh the ngian strain
Then
re
ABB
throu Lagra of Eq.20, may be ex-pressed as a function of the displacement gradient ku .
, the total potential energy of each model is written as:
6
1k k k k
kV W P u l
(21)
whe k kP W u k is the first Piola–Kirc
stress along each member, and is it
ngth. In the case
hhoff
kl s natural (un-
stressed) le of the rectangular model
k i etry of the initial configuration,
Figure 1(a), follows that:
, from the geom
2 21 2 1 1a b , l l 1
3 4 0
al l
1 g ,
1
5 6 0
bl l
1 g ,
whereas for the rhombic model , from Fi
1(b):
(22)
gu k j re
1 2l a , 2 2l b ,
2 22 2
3 4 5 0
bl l l l6
2 1
a
g
. (23)
The com ination of Eqs.8 to 11, 19 for b k i , and poten-Eq.22 yields the analytical expression of the
tial energy density function of the rectanSi
here du
totalgular m
8, 19odel.
milarly, the combination of Eqs.15 to 1 for k j , and Eq.23 yields the analytical expression of
the total potential energy density function of the rhombic model. The explicit form of both functions is not given
e to their large representations; albeit, in compact form they are expressed as:
01 2, , , , , ,V V a b g g g (24)
where a a , b b , fo1
2 , be stressed t
lation andn show
1
2 , for the
h facto
a
r the rectangular m
rhombic model.
at after some elementary algebraic
odel, and
a ait should
functio
b b Furthermore,
manipu rization, the potential energy s very strong dependence on the ratio
b a rather than on the individual lengths themselves.
It is straightforward that the value of this ratio directly controls the shape geometry of the two plane tensegrity
s. Assuming that b a , as already implied in Figure 1, from the geometrical point of view, low ratio values correspond to elongated tensegrity frames, whereas at the limiting ca re the ratio assumes the value equal to unity the shape of the frames degenerates to exactly square. As it will become evident in the fol-lowing, the value of the elongation ratio
model
se whe
b a (hence-
forth simply ER) strongly affects the orientation direc-tion of the models.
Finally, the stable equilibrium directions are detected
from the minimization of the total potential energy of both models, i.e., when the following two conditions are met simultaneously:
0V
(a) and 2
20
V
(b) (25)
4. GLOBALLDIRECTIO
It dir t emerge as sol s that addi-
Y STABLE EQUILIBRIUM NS OF THE PLANE
TENSEGRITY CSK MODELS
is evident that there exists a number of equilibriumections for the plane tensegrity models tha utions to Eq.25(a); among them, the one
tionally satisfy Eq.25(b) are stable. The investigation of the stability of the equilibrium requires the definition and adoption of the appropriate explicit stability criteria for the given problem. The orientation of active adherent cells, or even of stress fibres within them, is experimen-tally established to be one of the natural phenomena that exhibit coexistence of phases. Here, coexistence of phases is translated to the emergence of two distinct and concurrent orientation directions in a two–dimensional culture of cells or stress fibres, under the application of the same substrate stretching [3,5]. This kind of behav-iour can be met at many different fields of the physical sciences, e.g., the melting of ice, or the coexistence of crystallographic systems in solids [35,36]. In order that our present framework is compatible to this behaviour, we adopt Maxwell’s convention for stability which al-lows coexistence of phases phenomena and declares that the system state is such that globally minimizes the po-tential [25]. In this context, the fundamental physical reasoning behind cellular reorientation is that when the strain field under the substrate anchored CSK changes, the orientation direction that renders the total potential energy minimum, with respect to all equilibrium direc-tions , will be chosen. Accordingly, under the appli-cation of substrate stretching, the plane tensegrity mod-els will equilibrate at such a placement where their total potent l energy value is a global minimum.
For the integral study of the reorientation phenome-non, the mechanical response of both tensegrity frame geometries will be examined for a broad r
ia
ange of the problem parameters. The general outline is sketched through numerical inspection of the stability of the equi-librium solutions of Eqs.25. To this end, a series of graphs is produced that illustrate the variation of the total potential energy density function of each model with respect to the orientation direction . Specifically,
for a given set of the parameters ( 0g , 1g , 2g , )
the potential energy is plotted for selected, increasing values of the ER until its maximum value equal to unity. In this fashion, the differences in mechanic viour between the two shape geometries, and between more or
al beha
18 A. P. Pirentis et al. / J. Advances in Bioscience and Biotechnology 1 (2010) 12-25
Copyright © 2010 SciRes.
o-
dire
less elongated frames of the same geometry, are both successfully detected. Moreover, comparison between graphs that correspond to the same ER value, yet differ-ent substrate stretching or prestrain conditions, allows the interpretation of the individual parameter effect on the stability of the orientation direction and on the con-trol of the phenomenon in general. Finally, in this way, the direct cross–examination between experimental data and theoretical predictions is also possible.
4.1. Globally Stable Equilibrium Directions of the Rectangular Model
ABB
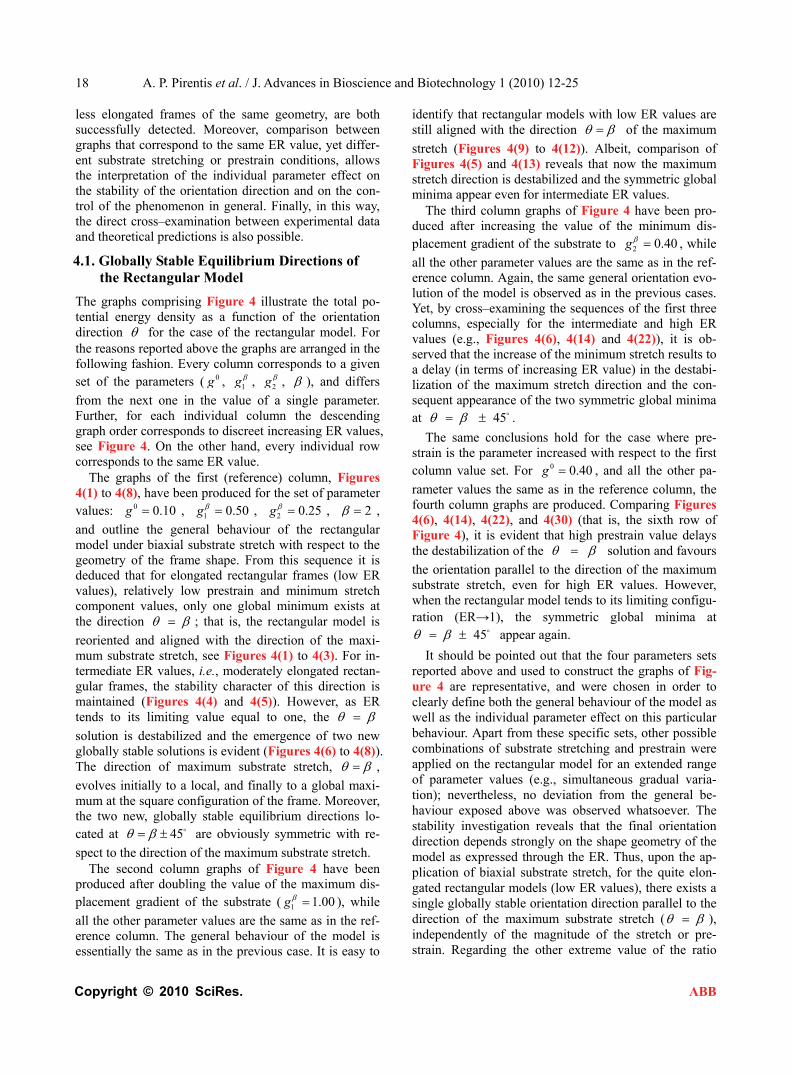
The graphs comprising Figure 4 illustrate the total ptential energy density as a function of the orientation
ction for the case of the rectangular model. For the reasons reported above the graphs are arranged in the following fashion. Every column corresponds to a given set of the arameters ( 0 p g , 1g , 2g , ), and differs
from the next one in the value of a single parameter. Further, for each individual column the descending graph order corresponds di ing ER values, see Figure 4. On the other hand, every individual row corresponds to the same ER value.
The graphs of the first (reference) column, Figures 4(1) to 4(8), have been produced for the set of parameter values: 0 0.10g , 0.50g ,
to screet increas
, 1 2 20.25g ,
and outline the general behaviour of the rectangular model under biaxial substrate stretch with respect to the geometr ro ence deduced that for elongated rectangular frames (low ER values), relatively low prestrain and minimum stretch component values, only one global minimum exists at the direction
y of the frame shape. F m this sequ it is
; that is, the rectangular model is
reoriented and aligned with the direction of the maxi-mum substrate stretch, see Figures 4(1) to 4(3). For in-termediate ER i.e., moderately elongated rectan-gular frames, the stability character of this direction is maintained (Figures 4(4) and 4(5)). However, as ER tends to its limiting value equal to one, the
values,
solution is destabilized and the emergence of two new globally stable solutions is evident (Figures 4(6) to 4(8)). The direction of maximum substrate stretch, ,
evolves initially to a local, and finally to a global maxi-mum at the square configuration of the frame. Moreover, the two new, globally stable equilibrium directions lo-cated at 45 are obviously symmetric with re-
spect to the direction of the maximum substrate stretch. The second column graphs of Figure 4 have been
produced afte ling the value of the maximum dis-placement gradient of the substrate ( 1.00g ), while
r doub
case. It i
1
all the other parameter values are the same as in the ref-erence column. The general behaviour of the model is essentially the same as in the previous s easy to
identify that rectangular models with low ER values are still aligned with the direction of the maximum
stretch (Figures 4(9) to 4(12)). Albeit, comparison of Figures 4(5) and 4(13) reveals that now the maximum stretch direction is destabilized a symmetric global minima appear even for intermediate ER values.
The third column graphs of Figure 4 have been pro-duced after increasing the value of the minimum dis-placement gradient of the substrate to 0.40g
nd the
, while
umn value set. For , and all the other pa-
2
all the other parameter values are the same as in the ref-erence column. Again, the same general orientation evo-lution of the model is observed as in the previous cases. Yet, by cross–examining the sequences of the first three columns, especially for the intermediate and high ER values (e.g., Figures 4(6), 4(14) and 4(22)), it is ob-served that the increase of the minimum stretch results to a delay (in terms of increasing ER value) in the destabi-lization of the maximum stretch direction and the con-sequent appearance of the two symmetric global minima at 45 .
The same conclusions hold for the case where pre-strain is the parameter increased with respect to the first col 0 0.40g
4(30) (tha
rameter values the same as in the reference column, the fourth column graphs are produced. Comparing Figures 4(6), 4(14), 4(22), and t is, the sixth row of Figure 4), it is evident that high prestrain value delays the destabilization of the solution and favours
the orientation parallel to the direction of the maximum substrate stretch, even for high ER values. However, when the rectangular mod to its limiting configu- ration (ER→1), the symmetric global minima at
45 appear again.
el tends
ure 4 are rep were chosen in order to cl
It should be pointed out that the four parameters sets reported above and used to construct the graphs of Fig-
resentative, and early define both the general behaviour of the model as
well as the individual parameter effect on this particular behaviour. Apart from these specific sets, other possible combinations of substrate stretching and prestrain were applied on the rectangular model for an extended range of parameter values (e.g., simultaneous gradual varia-tion); nevertheless, no deviation from the general be-haviour exposed above was observed whatsoever. The stability investigation reveals that the final orientation direction depends strongly on the shape geometry of the model as expressed through the ER. Thus, upon the ap-plication of biaxial substrate stretch, for the quite elon-gated rectangular models (low ER values), there exists a single globally stable orientation direction parallel to the direction of the maximum substrate stretch ( ), independently of the magnitude of the stretch or pre-strain. Regarding the other extreme value of the ratio
A. P. Pirentis et al. / J. Advances in Bioscience and Biotechnology 1 (2010) 12-25 19
Copyright © 2010 SciRes. ABB
Figure 4. Graphs illustrating the variation of the total potential energy function with respect to the reorientation angle
for the rectangular tensegrity cytoskeleton. For graph parameters and thorough description see Subsection 4.1. (ER
ere exist two globally stable orientations
pendently
. The stability character for intermediate ER values is determined pri-
= 1), where the rectangular frame evolves to square, the magnitude of the stretch or prestrainth ( 45 ),
symmetrically arranged with respect to the direction of the maximum substrate stretch, again inde of
marily by the magnitude of the maximum substrate stretch component. Initially, the direction of the maxi-

20 A. P. Pirentis et al. / J. Advances in Bioscience and Biotechnology 1 (2010) 12-25
Copyright © 2010 SciRes. ABB
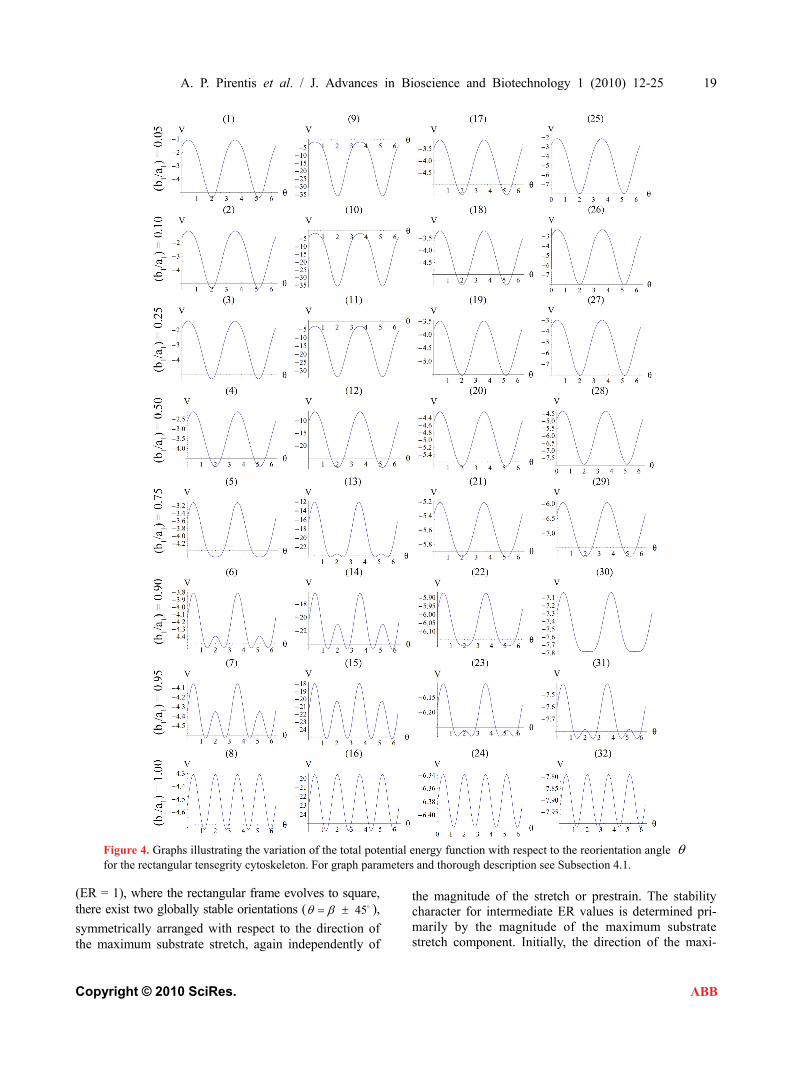
Figure 5. Graphs illustrating the variation of the total potential energy function with respect to the reorientation angle for the rhombic tensegrity cytoskeleton. For graph parameters and thorough description see Subsection 4.2. mum stretch is globally stable, but as the value
of 1g increa aforementioned direction destabi-
lizes and the symmetric globally stable minima emer . On the other hand, increase of the minimum
and the appearance of the symmetric global minima until relatively higher ER values only when the values of
ses, the
new, ge
spect to, either constant or increasing, maximum stretch, delays the destabilization stretch or prestrain with re
2g

A. P. Pirentis et al. / J. Advances in Bioscience and Biotechnology 1 (2010) 12-25 21
Copyright © 2010 SciRes. ABB
and 0g are comparable to the value of 1g . In any case,
the increase of 2g , 0g , values does not prevent the
destabilization from happening, and their effect is ob-served to diminish for high 1g values. Hence, as it is
conc ed by the preceding analysis of the ctangular model, its stability is s ng shape dependent and it is affected by other agents as well, of which the magnitude of the maximum substrate stretch is the primary one.
4.2. Globally Stable Equilibrium Directions of the Rhombic Model
The graphs comprising Figure 5 illustrate the total po-tential energy density as a function of the orientat
lud re
ion
tro ly
direction for the case of the rhombic model. Thgement of the graphs fol
e arra the ashion as in n lows same fFigure 4 (cf. Subsection 4.1 for details).
The graphs of the first (reference) column, Figure 5(1) to 5(8), have been produced for the set of parameter val-ues: 0 0.10g , 1 0.50g , 2 0.25g , 2 ,
and outline the general behaviour of the rectangular model under biaxial substrate stretch with respect to the geometry of the frame shape. From this sequence it is deduced that for elongated rhombic frames (low ER val-ues), relatively low prestrain and minimum stretch component values, only one global minimum exists at the direction ; that is, the rhombic model is re-
oriented and aligned with the direction of the maximum substrate stretch, see Figures 5(1) to 5(4). In contrast to the rectangular frame case, here, as the ER value in-creases, equilibrium direction maintains its globally
stable character for the entire range of the ratio values, even for the limiting square configuration (Figures 5(5) to 5(8)). Nevertheless, increase of ER values generates the change of stability character in other directions-
solutions. Specifically, directions 90 , which
initially corresponded to global maxima, Figures 5(1) to 5(4), are gradually developed to local minima, Figures 5(5) to 5(7), and at the limit case (ER = 1), eir stability becomes global, Figure 5(8).
Doubling the value of the maximum displacement gradient of the substrate ( 1 1.00g ), while keeping all
the other parameter values the same as in the reference column, the second column graphs of Figure 5 are pro-du
th
ced. The general behaviour observed above for the reference column is identically traced here as well, the only actual difference being that the stability transition of directions 90 from unstable global maxima to
stable local minima takes place even for intermediate ER values (compare Figures 5(4) and 5(12)).
The exact opposite case holds when the parameter values that are increased with respect to the reference column corres he minimum displacement gradi-
ent of the substrate (third column, 2 0.40g ), or pre-
str 0
p o
frame arameter effect on this behaviour. Other
po
ond t t
ain (fourth column, 0.40g ). Upon comparing
Figures 5(5) with 5(21) and 5(29) it is concluded that increased values of the aforementioned parameters allow the stability transition of directions only for
high ER values. It is pointed out once again that the parameter sets re-
ported above for the construction of the graphs of Fig-ure 5 are representative, in order to clearly define both the general behaviour of the rhombic s well as the individual pa
90
ssible combinations of parameter variation were also tested for an extended range of values, yet the frame response was essentially the same in every respect. The stability investigation for the case of the rhombic tenseg-rity model reveals that the dominant orientation direction strongly depends on the shape geometry also. Thus, upon the application of biaxial substrate stretch, elon-gated rhombic frames (low ER values) are always aligned parallel with the maximum stretch direction, which corresponds to the unique global minimum of the total potential energy, independently of the stretch or prestrain magnitudes. In the limiting configuration where the rhombus evolves into a square (ER = 1), apart from the globally stable direction , there exists
concurrently a second globally stable direction at 90 , that is, perpendicular to the maximum
stretch direction. The stability character for the interme-diate shape geometries is dominated, again, by the mag-nitude of the maximum stretch component. Increasing
the magnitude of 1g not only does not affect the glob-
ally stable character of the solution for any
feasible ER value, but new–normal to the initial stable direction–local minima appear at formerly unstable di-rections. The emer ce of the new minima takes place for intermediate or even low ER values provided that the magnitude of 1
gen
g is sufficiently high. On the other
hand, increase of the minimum stretch or prestrain with respect to, either constant or increasing, maximum stretch does not affect the stability character of the maximum stretch direction , and delays the
emergence of the new symmetric minima until relatively higher ER values, only when 2g and 0g values are-
comparable to 1g . In any case, the 2g or 0g value
increase does not prevent the ence of the new minima and their transition from local to global. Further, the influence of 2
emerg
g and 0g observed to diminish
for high 1
is
g values. Consequently, it is dedu d from
the analysis of this section that the orientation stability of the rhombic model is strongly shape dependent, and
ce
that it is controlled secondarily by the magnitude of the

22 A. P. Pirentis et al. / J. Advances in Bioscience and Biotechnology 1 (2010) 12-25
Copyright © 2010 SciRes. ABB
(a) (b)
Figu e 6. The cellular coexistence of phases phenomenon. (a) the rectangular cytoskeleton case; (b) the rhombic cy-tosk case.
maximum substrate stretch.
5. D
the stability investigation dels in the context of Max-
ollowing can be said. The orien-
releton
ISCUSSION
Summarizing the findings ofof both plane tensegrity mowell’s convention, the ftation direction is defined primarily by the shape geome-try of the models (ER value), and secondarily the mag-nitude of the maximum substrate stretch. The similar contribution that present the minimum stretch and pre-strain is rather negligible and is only detected when their values are comparable to the maximum stretch compo-nent. The rectangular model, for the greatest part of the ER value range, is aligned parallel to the direction
of the maximum substrate stretch, while for the high ER or maximum stretch values it is symmetrically aligned
45 away from the aforementioned direction. The rhombic model is oriented parallel to the direction of the maximum stretch for all ER values; albeit, in the liming configuration where it degenerates to a square (ER = 1), it can also align perpendicular to the direction. In
terms of increasing ER values, the orientation of both models evolves from a single, globally stable orientation direction, to the appearance of multiple stable directions, Figure 6. In conjunction to previous studies [27,28], it should be pointed out that even though the strain energy of individual structural members of each model has been assumed to be convex, multiple stable equilibrium solu-tions appear here too, and the total potential energy of both models may be a non–convex function of the ori-entation direction. This fact affects the shape geometry the models as well.
The discords in the described above orientation evolu-tion of the two models may be attributed both to the dif-
elastic strings, whereas for the rhombic model it is a ratio of length of ela
ferent initial shape geometries, and the slightly different
n the case of the rectangular model it is a ratio of length of
stic bars, Figure 1. Furthermore, in
definitions of the ER. Although ER expresses essentiallythe same thing for both frames, it is evident that i
the initial configuration of the rectangular model the two bars are of the same length, while the length of the strings differs in pairs. On the other hand, in the initial configuration of the rhombic model the length of all strings is equal and of the two bars different. However, all these differences are eliminated at the limit–case
1 1 2 2 1b a b a , where both initial geometries
degenerate to precisely square. At this special configura-tion, the “rectangular–square” and the “rhombic–square” identify with each other provided that either one of them is rotated by 45 with respect to its geometric centre. This can be independently confirmed upon qualitative inspection and comparison of the last row graphs in
It is found that the locations of the global minima in the “rectangular–square” case co-incide with the locations of the global minima in the “rhombic–square” case if either one of the plot families is translated parallel to the
Figure 4 and e 5. Figur
–axis by 45 . For the low and intermediate ER values, that corre-
spond to physiologically more compatible cellular con-figurations, the stability analysis of the two models pre-dicts orientation parallel to the direction of the maximum substrate stretch. This response is consistent to the ex-perimental observations of the behaviour of active ad-herent cells cultured on an elastic substrate under the effect of static or quasi–static stretching 9]. [6- For low
values (ER→0), it is reasonable to consider that the models now represent stress fibres, rather than the entire
ER

A. P. Pirentis et al. / J. Advances in Bioscience and Biotechnology 1 (2010) 12-25 23
Copyright © 2010 SciRes.
t a different re-sp
agreement with experimental data reported in literature
arameters as the magnitude of the ex-ents, of which the maximum one, and the strength of the
ba
ABB
CSK [24]. In this case, the analysis predicts alignment with the direction of the maximum substrate stretch, again, in concert to the experimental observations for static stretch [6,8,14]. Further, according to the per-formed stability analysis, for a certain range of parame-ter values the concurrent existence of more than one orientation directions is possible, Figure 6, a fact that has also been certified experimentally (cellular coexis-tence of phases phenomenon) [3,5]. In the case of the rectangular model, increase of the maximum substrate stretch value results to alignment away from the direc-tion of maximum stretch. The same response to stretch increase is observed for adherent cells under the effect of cyclic substrate stretch [2,4,5,10-13,15], in order to avoid the excessive stretching that may cause rapid dis-assembly of the cytoskeletal filament network [11,14,37]. Nevertheless, this kind of behaviour is not presented during the orientation evolution of the rhombic model. For this frame type, the increase of the maximum sub-strate stretch results to a stability transition of the per-pendicular to the maximum stretch direction from glob-ally unstable to locally stable. This direction continues to correspond to local only minima until the limit square– configuration, where its stability is rendered global. Hence, according to Maxwell’s convention, the rhombic model orients parallel to the direction of the maximum substrate stretch, since in the perpendicular to the latter direction the total potential energy is not globally mini-mum (except, of course, when ER = 1).
Apart from this last discrepancy between theoretical predictions and experimental observations there appears to be another one related to the effect of prestrain. For both model geometries, increase of prestrain while keeping all the other parameter values constant seems to promote alignment parallel to the maximum stretch di-rection. Nevertheless, experimental observations for the case of cyclic substrate stretching repor
onse [11]. Since in previous theoretical work on the subject, [27,28], model predictions were in concert to experimental data regarding the prestrain effect, it is possible and reasonable to ascribe this discrepancy to the assumption of linear elastic strings. Quite often, in two–dimensional cultures of stationary cells on artificial substrata, actin filaments are bundled to form stress fi-bres (in fact, in such cases stress fibres are the prominent cytoskeletal feature). If instead of actin filaments we assume that the elastic strings of the two plane tensegrity models correspond to stress fibres, then the strain energy function of Eq.19 should be modified (e.g., by adding a higher order term), since experimental data suggest that for strains exceeding 40% their behaviour is nonlinear [38]. However, such a consideration would only be in expense of mathematical calculations without improving the physical motivation. In any case, the general behav-iour of the two plane tensegrity models is in good
for the cellular orientation under static biaxial substrate stretching, whereas the detected inconsistencies are re-lated to cyclic stretching observations (which are not examined here).
6. CONCLUSIONS
A general integral stability analysis of two plane tenseg-rity frames used for the description of cellular reorienta-tion under biaxial substrate stretching has been presented. Adopting Maxwell’s convention for stability, the analy-sis was performed in the context of Finite Elasticity Theory. It has been shown that the reorientation is con-trolled by such ptracellular stretch componcomponent is the primaryintracellular contractile mechanism. This dependence is consistent to numerous well documented laboratory re-ports (see Refs. in Introduction). It is also in accord with previous theoretical modelling of the reorientation of cellular stress fibres as well [27,28]; yet, the present study focuses on the response of the entire intracellular biopolymer network, which is a substantially more dif-ficult undertaking than studying individual, isolated stress fibres. The new finding, when working with a plane tensegrity CSK, is the governing role of the shape– geometry of the frame. The properties and general be-haviour of the two different tensegrity frame geometries have been thoroughly analysed and discussed in the text.
Cellular orientation is a mechanochemical process involving the transduction of a mechanical stretching signal to changes in intracellular biochemistry (and vice versa), while the CSK exhibits dynamic, viscoelastic behaviour. Furthermore, it is certain that cellular archi-tecture is far more complicated than any of its existing mechanical descriptions, and that tensegrity modelling is,rather, a simplification. For these reasons, the good agreement between experimental data and predictions,
sed on elastic stability considerations of the two, purely mechanical, plane tensegrity models, is quite re-markable. However, the models employed here are sim-ple, physiologically compatible, and the analysis is based on fundamental principles; moreover, no far– fetched assumptions that could bias the results have been introduced. Taking all these into account, it is revealed that mechanical stability is a major determinant of cy-toskeletal rearrangement, and that cellular orientation can be successfully treated as a problem of elastic stabil-ity. This conclusion does not–in any way–exclude other (chemical) agents that could influence the determination of the orientation direction. Albeit, the consistency of theoretical predictions to the experimental data suggests that the extent of the other agents effect is rather limited, or that their contribution is already integrated to the analysis through their mechanical expressions (e.g., pre-strain).
24 A. P. Pirentis et al. / J. Advances in Bioscience and Biotechnology 1 (2010) 12-25
Copyright © 2010 SciRes.
emasa, T., Sugimoto, K. and Yamashita, K. (1997)
c strain. Experimental Cell Research,
m cells.
5,
ten-
tures (chapter 17), CRC Press.
ABB
REFERENCES
[1] Suresh, S. (2007) Biomechanics and biophysics of cancer cells. Acta Biomaterialia, 3, 413-438.
[2] Dartsch, P.C. and Haemmerle, H. (1986) Orientation response of arterial smooth muscle cells to mechanical stimulation. European Journal of Cell Biology, 41, 339-346.
[3] TakAmplitude - dependent stress–firesponse to cycli
ber reorientation in early
230, 407-410. [4] Neidlinger-Wilke, C., Grood, E.S., Wang, J.H.–C., Brand,
R.A. and Claes, L. (2001) Cell alignment is induced by cyclic changes in cell length: studies of cells grown in cyclically stretched substrates. Journal of Orthopaedic Research, 19, 286-293.
[5] Wang, J.H.-C., Goldschmidt-Clermont, P., Wille, J. and Yin, F.C.-P. (2001) Specificity of endothelial cell reori-entation in response to cyclic mechanical stretching. Journal of Biomechanics, 34, 1563-1572.
[6] Takakuda, K. and Miyairi, H. (1996) Tensile behavior of fibroblasts cultured in collagen gel. Biomaterials, 17, 1393-1397.
[7] Eastwood, M., Mudera, V.C., Mcgrouther, D.A. and Brown, R.A. (1998) Effect of precise mechanical loading on fibroblast populated collagen lattices: morphological changes. Cell Motility and the Cytoskeleton, 40, 13-21.
[8] Collinsworth, A.M., Torgan, C.E., Nagada, S.N., Rajal-ingam, R.J., Kraus, W.E. and Truskey, G.A. (2000) Ori-entation and length of mammalian skeletal myocytes in response to unidirectional stretch. Cell and Tissue Re-search, 302, 243-251.
[9] Ignatius, A., Blessing, H., Liedert, A., Kaspar, D., Kreja, L., Friemert, B. and Claes, L. (2004) Effects of me-chanical strain on human osteoblastic precursor cells in type I collagen matrices. Orthopade, 33, 1386-1393.
[10] Iba, I. and Sumpio, B.E. (1991) Morphological response of human endothelial cells subjected to cyclic strain in vitro. Microvascular Research, 42, 245-254.
[11] Wang, J.H.-C., Goldschmidt-Clermont, P. and Yin, F.C.-P. (2000) Contractility affects stress fiber remodelling and reorientation of endothelial cells subjected to cyclic me-chanical stretching. Annals of Biomedical Engineering, 28, 1165-1171.
[12] Sipkema, P., van der Linden, J.W., Westerhof, N. and Yin, F.C.-P. (2003) Effect of cyclic axial stretch or rat arteries on endothelial cytoskeletal morphology and vascular re-activity. Journal of Biomechanics, 36, 653-659.
[13] Wille, J.J., Ambrosi, C.A. and Yin, F.C.-P. (2004) Com-parison of the effects of cyclic stretching and compres-sion on endothelial cell morphological responses. ASME Journal of Biomechanical Engineering, 126, 545-551.
[14] Kaunas, R., Nguyen, P., Usami, S. and Chien, S. (2005) Cooperative effects of Rho and mechanical stretch on stress fiber organization. Proceedings of the National Academy of Sciences of the USA, 102, 15895-15900.
[15] Kurpinski, K., Chu, J., Hashi, C. and Li, S. (2006) Ani-sotropic mechanosensing by mesenchimal stemProceedings of National Academy Sciences, USA, 103, 16095-16100.
[16] Roth, B. and Whiteley, W. (1981) Tensegrity frameworks. Transactions of the American Mathematical Society, 26419-446.
[17] Motro, R. (1992) Tensegrity systems: the state of art. Int. Journal of Space Structure, 7(2), 75-83.
[18] Connelly R. and Back, A. (1998) Mathematics and segrity, American Scientist, 86, 142-151.
[19] Skelton, R.E., Helton, J., Adhikari, R., Pinaud, J. and Chan, W. (2002) An introduction to the mechanics of tensegrity struc
[20] Williams, W.O. (2007) A primer on the mechanics of ten- segrity structures. http://www.math.cmu.edu/users/wow/ papers/newprimer.pdf
, Kamm, R.D.
attan, 103-128.
ensegrity-based mechanosensing
(2007) Substrate
rnational Journal of Solids and
strate stretching. Ar-
ntis, A. and Suki,
al model.
r and Biomechanics, 3, 43-48.
echanics:
-
[21] Stamenović, D. (2006) Models of cytoskeletal mechanics based on tensegrity. In Mofrad, M.R.K.(Eds.), Cytoskeletal mechanics: models and measure-ments, Cambridge University Press, Manh
[22] Ingber, D.E. (1993) Cellular tensegrity: defining new rules of biological design that govern the cytoskeleton. Journal of Cell Science, 104, 613-627.
[23] Ingber, D.E. (1998) The architecture of life. American Science, 48(1), 75-83.
[24] Ingber, D.E. (2008) Tfrom macro to micro. Progress in Biophysics and Mo-lecular Biology, 97(2-3), 163-179.
[25] Gilmore, R. (1981) Catastrophe theory for scientists and engineers. Wiley and Sons, New York.
[26] Thompson, J.M.T. and Hunt, G.W. (1984) Elastic insta-bility phenomena. Wiley and Sons, Chichester.
[27] Lazopoulos, K.A. and Pirentis, A. stretching and reorganization of stress fibers as a finite elasticity problem. InteStructures, 44, 8285-8296.
[28] Pirentis, A.P. and Lazopoulos, K.A. (2009) On stress fibre reorientation under plane subchives of Applied Mechanics, 79, 263-277.
[29] Stamenović, D., Lazopoulos, K.A., PireB. (2009) Mechanical stability determines stress fiber and focal adhesion orientation: a mathematicCellular and Molecular Bioengineering, 2(4), 475-485.
[30] Lazopoulos, K.A. and Stamenovic, D. (2006) A mathe-matical model of cell reorientation in response to substrate stretching. Molecular Cellula
[31] Kamm, R.D. and Mofrad, M.R.K. (2006) Introduction, with the biological basis for cell mechanics. In: Mofrad, M.R.K., Kamm, R.D. (Eds.), Cytoskeletal mmodels and measurements. Cambridge University Press, Manhattan, 1-17.
[32] Stamenović, D., Fredberg, J.J., Wang, N., Butler, J.P. and Ingber, D.E. (1996) A microstructural approach to cytoskeletal mechanics based on tensegrity. Journal of Theoretical Biology, 181, 125-136.
[33] Ogden, R.W. (1997) Non–linear elastic deformations.

A. P. Pirentis et al. / J. Advances in Bioscience and Biotechnology 1 (2010) 12-25 25
Copyright © 2010 SciRes.
1) Introduction to the thermodynamics
n crystals. Chapman,
cells and stress fibers under
. and Sato, M. (2006) Tensile
ABB
Dover, New York. [34] Holzapfel, G.A. (2000) Nonlinear solid mechanics: a
continuum approach for engineering. Wiley and Sons, Chichester.
[35] Ericksen, J.L. (199of solids. In: Knops, R.J., Morton, K.W. (Eds.). Chapman & Hall, London, 39-61.
[36] Pitteri, M. and Zanzotto, G. (2003) Continuum models for phase transitions and twinning i
et al., Boca Raton, etc. [37] Hayakawa, K., Sato, N. and Obinata, T. (2001) Dynamic
reorientation of cultured mechanical stress from periodic stretching. Experimental Cell Research, 268, 104-114.
[38] Deguchi, S., Ohashi, Sproperties of single stress fibers isolated from cultured vascular smooth muscle cells. Journal of Biomechanics, 39, 2603-2610.