On the neural basis of atypical visual perception in ...
151
On the neural basis of atypical visual perception in Autism Spectrum Disorder
Transcript of On the neural basis of atypical visual perception in ...

On the neural basis of atypical visual perception in Autism Spectrum Disorder

ISBN: 978-90-393-4797-3 Printed by: PrintPartners Ipskamp B.V., Enschede Cover design: by Karianne C.E. Vozza-Vandenbroucke, based on
Figure 3C, page 79 Copyright © by M.W.G. Vandenbroucke The research presented in this thesis was performed at the Department of Psychology, University of Amsterdam, Amsterdam, the Netherlands, and at the Department of Child and Adolescent Psychiatry, University Medical Centre Utrecht, Utrecht, the Netherlands. Printing of this thesis was supported by:
prof. dr. L.N.J. Kampstichting

On the neural basis of atypical visual perception in Autism Spectrum Disorder
Over de neurale basis voor afwijkende visuele waarneming in Autisme Spectrum Stoornis
(met een samenvatting in het Nederlands)
Proefschrift
ter verkrijging van de graad van doctor aan de Universiteit Utrecht op gezag van de rector magnificus, prof.dr. J.C. Stoof, ingevolge het besluit van het college voor
promoties in het openbaar te verdedigen op
donderdag 22 mei 2008 des ochtends te 10.30 uur
door
Myriam Waldina Giovanna Vandenbroucke geboren op 10 februari 1980 te ‘s Gravenhage

Promotoren: prof.dr. H. van Engeland prof.dr. C. Kemner prof.dr. V. A. F. Lamme Co-Promotor: dr. H. S. Scholte The research presented in this thesis was supported by an Innovational Research Incentives grant (VIDI-scheme, 402-01-094) of the Netherlands Organization for Scientific Research (NWO) to Chantal Kemner.
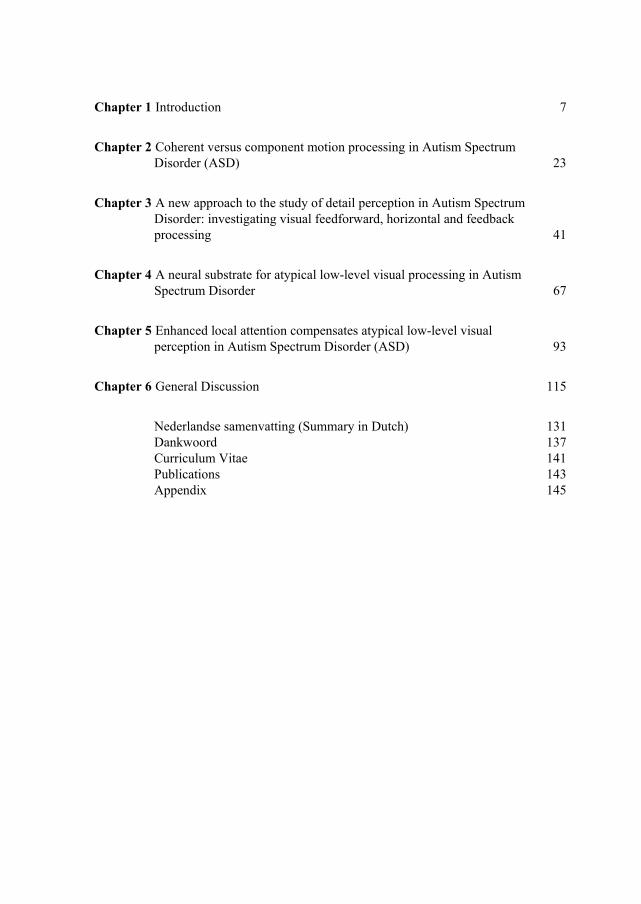
Chapter 1 Introduction 7
Chapter 2 Coherent versus component motion processing in Autism Spectrum Disorder (ASD) 23
Chapter 3 A new approach to the study of detail perception in Autism Spectrum Disorder: investigating visual feedforward, horizontal and feedback processing 41
Chapter 4 A neural substrate for atypical low-level visual processing in Autism Spectrum Disorder 67
Chapter 5 Enhanced local attention compensates atypical low-level visual perception in Autism Spectrum Disorder (ASD) 93
Chapter 6 General Discussion 115
Nederlandse samenvatting (Summary in Dutch) 131 Dankwoord 137 Curriculum Vitae 141 Publications 143 Appendix 145


Introduction
7
Chapter 1
Introduction “Autism is a developmental disorder which impedes someone’s development in a very intrusive way … Autism is different from a mental handicap, although autism is commonly accompanied with an additional developmental delay. However, there is also a minority that is normal or even highly talented. My little brother is one of the latter minority.” “Autism is a handicap with many faces…sometimes they even have surprising talents, for example my little brother who looked at a road map for three hours and knows almost all roads by heart.”
Translated from the webpage of one of my subjects with autism (with permission, www.knikkerbaan.nl )
These descriptions of autism touch the pervasiveness of the disorder, as well as its heterogeneity (Veenstra-VanderWeele, Christian, & Cook, 2004). The various symptoms of autism, evident before the age of three, can be classified into three groups: abnormalities in social interaction and play (e.g. problems in making eye contact), atypical communicative skills (e.g. absence or limited use of gestures and facial expressions and delayed language development), and stereotyped and repetitive patterns of behavior (e.g. queuing up toy cars over and over again). Besides these higher-level cognitive impairments, there is a growing body of evidence that autism also encompasses pure perceptual aberrancies such as enhanced visual detail perception and probably also altered global processing and visual grouping (Dakin & Frith, 2005; Happé & Frith, 2006). Although autism is a genetically determined, neurodevelopmental disorder (see below), there is as yet no generally accepted neural explanation for atypical visual perception in these patients. In this thesis we tried to establish the neural basis of atypical visual perception in autism by studying integration properties of the visual system, necessary for global processing, as well as the integrity of neural interactions associated with detail perception and grouping. Prior to elaborating on our findings in the following chapters, I will give a short introduction on the epidemiology of autism and as overview of the main findings on atypical visual perception in this disorder. In addition, I will point out how aberrant visual processing in autism was studied in the current thesis to reveal a neural basis of this aspect of autism.

Chapter 1
8
1.1 Autism Spectrum Disorder (ASD): epidemiology and genetics The word autism stems from the Greek word ‘αυτος’ meaning ‘self’ Although I started off talking about ‘autism’, in this thesis we studied a sample of people with so called ‘Autism Spectrum Disorder’ (ASD). The spectrum of autism disorders covers Asperger syndrome, Pervasive Developmental Disorder-Not Otherwise Specified (PDD-NOS) and Autistic Disorder. These are highly similar disorders defined by the three classes of symptoms described above for Autistic Disorder, but they differ in some respects and in severity (Veenstra-VanderWeele et al., 2004). Asperger syndrome differs from Autistic Disorder in that language processing has normally developed and that less pervasive impairments are present in communication skills (A.P.A., 1994). In PDD-NOS the criteria for Autistic Disorder are not met because of the late age of onset (after the age of three), atypical symptomatology and/or subthreshold symptomatology (A.P.A., 1994). In our patient population no persons with PDD-NOS were included. The prevalence of ASD is estimated at 30-60 cases per 10,000, with a sex ratio of 4:1 for boys versus girls (Fombonne, 2005). Intelligence differs somewhat within ASD. Whereas in autism about 40 % is in the range of serious to profound mental retardation and 30 % is mild to moderate mentally retarded, in Asperger syndrome and PDD-NOS about 70 % of the individuals has normal (70-80) or above normal IQ scores, (Fombonne, 2005). In the current thesis only subjects with an above normal IQ were tested to make sure task instructions were clearly understood and experiments could be performed in a functional MRI and electro-encephalogram (EEG) setting. ASD is a strongly genetically determined psychiatric disorder. The concordance rate of ASD in monozygotic twins is approximately 60-90 % compared with 0-10 % in dizygotic twins (Bailey, Palferman, Heavey, & Le Couteur, 1998; Veenstra-VanderWeele et al., 2004). Also, family studies showed that the prevalence of ASD in siblings of affected individuals is 3-6 %, which is about 100 times higher than the prevalence in the general population (Bailey et al., 1998). In addition, first-degree relatives of individuals with ASD show similar deficits in social interaction, communication and repetitive behavior as seen in ASD, but in a milder form (Bailey et al., 1998). A recent study by De Jonge et al. (De Jonge, Kemner, & van Engeland, 2006; see also Happé, Briskman, & Frith, 2001) elaborated on this by showing that also some of the aberrancies in visual processing in ASD can be found in parents of people with ASD.

Introduction
9
1.2 Atypical visual perception in ASD “The inability to experience wholes without full attention to the constituent parts...” (Kanner, 1943, p. 246) Leo Kanner already mentioned in the original description of ASD that people with ASD are particularly attentive to visual details or featural information. In daily life enhanced detail perception can be reflected in an exceptional ability to copy and memorize features of visual information (Mottron & Belleville, 1993). Experimental settings have shown both superior and inferior performance in ASD depending on the task requirements, respectively a detailed or global analysis of a visual stimulus. The most commonly used paradigms to study visual perception in ASD, are (some form of) the Navon task, the Embedded Figures Test, visual search tasks, the block design test and the random dot motion task (see Fig. 1). Figure 1. Examples of commonly used stimuli and paradigms to study visual perception in ASD. A) In the Navon task subjects have to report the letter at the global or the local level, which can either be the same (congruent) or different (incongruent, here). B) Global processing can also be tested using the Random Dot Motion task. Here the amount of dots moving coherently to the left or right is manipulated and subjects have to indicate the direction of motion. C) In the Embedded Figures Test subjects have to find the geometrical shape in a complex pattern of line elements. D) In the Block Design Test subjects have to duplicate a visual pattern with half colored blocks (see drawing). E and F). Visual search tasks are used to test the perceptual discrimination ability. Note: for a color version of this figure, see Appendix The Navon task (Fig. 1A) has been used to study global perception of a visual scene. In the Navon task subjects have to report the letter at the global or the local level, which can either be the same (congruent) or different (incongruent, Fig 1A). Typically, people

Chapter 1
10
are faster when responding to the global than to the local level (global advantage) and their responses to the local level are slowed when this is incongruent with the global level (global interference). Similar findings have been shown in ASD (Rinehart, Bradshaw, Moss, Brereton, & Tonge, 2000; Plaisted, Swettenham, & Rees, 1999). However, when ASD and control subjects had to respond to the global level in the incongruent condition, reaction times were slowed in the ASD but not in the control subjects, indicating local interference in these patients (Rinehart et al., 2000; Behrmann et al., 2006; Plaisted et al., 1999). The Random Dot Motion task is also used to study global processing (Fig. 1B). In this task a certain amount of dots are moving coherently to the left or right within a display of randomly moving dots. The amount of coherently moving dots is manipulated and subjects have to indicate the direction of motion. Several studies have shown that people with ASD need a higher amount of dots to correctly detect the direction of motion compared to controls. Lower sensitivity to coherency cues is an indication for impaired global perception (Milne et al., 2002; Pellicano, Gibson, Maybery, Durkin, & Badcock, 2005; Spencer et al., 2000; but see De Jonge et al., 2007; Del Viva, Igliozzi, Tancredi, & Brizzolara, 2006). The strength of visual grouping and also relatively enhanced local perception can be examined using the Embedded Figures Test (Fig. 1C). In this task subjects have to find a geometrical shape in a complex pattern of line elements. Shorter reaction times and higher performance are taken as an indication of weaker grouping and/or stronger locally oriented perception, which indeed has repeatedly been shown in ASD subjects (De Jonge et al., 2006; Bolte, Holtmann, Poustka, Scheurich, & Schmidt, 2007; Caron, Mottron, Berthiaume, & Dawson, 2006; Jolliffe & Baron-Cohen, 1997). A similar conclusion on atypical visual perception in ASD can be drawn from findings on the Block Design Test (Fig. 1D). In this task subjects have to duplicate a two dimensional visual pattern with full and half colored blocks. It turned out that subjects with ASD are faster in this task compared to controls (Caron et al., 2006), which indicates a relative piecemeal analysis of a visual scene in ASD. Finally, visual search tasks (Fig. 1D and 1E) have been used to test the perceptual discrimination ability in ASD. Subjects have to find a local target in a field of distracters. The target can be defined on the basis of a single feature (feature search, e.g. color as in Fig. 1D) or on the basis of a combination of features (conjunction search, e.g. shape and color as in Fig. 1E). In both situations subjects with ASD are faster, less prone to errors and they do not show any slowing as the number of distracters increases (O'Riordan, 2004; O'Riordan & Plaisted, 2001; O'Riordan, Plaisted, Driver, & Baron-Cohen, 2001). Apparently, the ability to discriminate between items is enhanced in ASD. This effect is probably perceptual by nature and not due to a difference in search strategy, e.g. differences in eye movements (Kemner, van Ewijk, van Engeland, & Hooge, 2007).

Introduction
11
As mentioned above, although ASD is a neurodevelopmental disorder, there is as yet no standing neural explanation for aberrancies in visual perception. From experimental psychology, several theories have been put forward which can explain a number of the visual abnormalities in the disorder. Two influential theories are the weak central coherence (WCC) theory and the enhanced perceptual functioning (EPF) theory. In the WCC theory enhanced detail perception is seen as a cognitive bias, at the expense of global processing, which however, can be overcome when global processing is explicitly demanded (Happé & Frith, 2006). The EPF account proposes that enhanced processing of stimulus elements is facilitated in ASD due to an overdevelopment of low-level perceptual processes operating in early visual areas (Mottron, Dawson, Soulieres, Hubert, & Burack, 2006; see also O'Riordan & Plaisted, 2001; Plaisted, Saksida, Alcantara, & Weisblatt, 2003). However, these theories are descriptive in nature, and do not provide an explicit explanation for atypical visual perception in terms of specific neural functioning. In fact, there is often strong disagreement on the neural substrate of perceptual aberrancies found in ASD. For example, some researchers have suggested that atypical coherent motion processing is due to aberrant dorsal stream functioning (Milne et al., 2002; Pellicano et al., 2005; Spencer et al., 2000). However, this explanation merely accounts for atypical motion processing. Also, it has already been rejected by some authors (Bertone, Mottron, Jelenic, & Faubert, 2003) who showed that subjects with ASD are able to detect the direction of first order, luminance defined, motion stimuli, while direction discrimination of second order, texture defined, motion stimuli was impaired. This argues against general dorsal stream malfunctioning. The authors suggest that a perceptual deficiency lies in the decreased capacity to integrate ‘complex’ visual information (see also Bertone, Mottron, Jelenic, & Faubert, 2005). However, given the atypical brain development in ASD (Casanova et al., 2006; Courchesne, 2002), we conjectured that there is a specific neural cause that can account for atypical visual perception (see also Bertone et al., 2005). To reveal this, we investigated the balance between neural connection types and interactions in the visual cortex of people with ASD that are important for the above mentioned aspects of visual perception, i.e. detail perception and global processing or grouping. In the next paragraph, I will give a short introduction on the role of some neural interactions in visual perception and the connection types we investigated.

Chapter 1
12
1.3 The role of neural interactions in the visual cortex “In both science and art, it is important to distill a problem down to its fundamentals as much as possible, while still expressing yourself creatively.” ("Abstractions", 2006) Our visual world is made up of many different image elements such as form, color, texture, luminance and motion, composed in a complex way. To correctly interpret a visual scene, individual elements that belong to a single object have to be extracted and subsequently integrated or grouped together. Grouping of elementary features is based on low-level Gestalt rules like similarity (similar elements are bound as an object), but it also requires high-level grouping cues, such as familiarity with the shape of an object (Roelfsema, 2006; Gilbert & Sigman, 2007). Interactions between (groups of) neurons within cortical areas can establish grouping based on similarity, while top-down interactions can give higher order cues. Since the focus of visual perception in ASD is towards details while global processing and grouping could be impaired in these patients, we investigated the neural interactions that are involved in these aspects of visual perception. 1.3.1 Global processing and neural integration We first focused on the integration properties of the visual system in people with ASD by studying pooling of visual information over space (Chapter 2). Through pooling of features in a visual scene, global information can be extracted (Dakin & Frith, 2005) and this aspect of perception can be studied using plaid motion stimuli. Plaid stimuli are composed of two superimposed square-wave gratings with different orientations shown through a circular aperture (see Fig. 2). Figure 2. Plaid motion stimuli. During the experiment the gratings moved separately, each in a different direction. Subjects could either see a coherent plaid moving in one direction or they could see the two gratings moving as independent components. These gratings are moving each in a different direction and the resulting percept can be either a coherent plaid pattern moving in one direction or two transparent gratings sliding over each other in different directions. Adelson and Movshon (Adelson &

Introduction
13
Movshon, 1982) proposed a two-stage model for processing these coherent plaid patterns. At an early level in the visual pathway neurons in the occipital cortex are selective for orientation and spatial frequency of the separate gratings and they are sensitive to the direction of motion of one-dimensional contours. The visual mechanisms at this early stage, however, are not able to detect the direction of motion of two-dimensional patterns. Therefore, the perceptual coherence of two gratings into a single plaid is established by a second, higher order visual mechanism. At this second stage, the integration of the previous one-dimensional motion analyses is established (see also Welch, 1989). This means that the interpretation of a plaid stimulus depends on the level of integration of superimposed moving gratings. Accordingly, we used plaid motion stimuli to test the ability to integrate visual features over space in ASD. 1.3.2 The Reverse Hierarchy Theory The second focus of the research presented in the current thesis is on the neural connection types important for detail perception and grouping. In a recent model on visual perception, the reverse hierarchy theory (Hochstein & Ahissar, 2002), feedforward and feedback processing are directly associated with the perception of global and local aspects of a stimulus, respectively. According to this theory, feedforward processing from lower to higher visual areas occurs first, resulting in a global representation of a scene at higher cortical levels. Later recurrent processing back to lower areas provides detailed information. The balance between feedforward and feedback activity is probably essential for the character of visual perception. If feedforward activation is stronger than feedback, there will be a relatively large impact of global features on the resulting percept, leading to, for instance, global precedence in a Navon task, as is the case in people without psychiatric impairments (Navon, 1981). On the other hand, if feedback activity is stronger compared to feedforward, this will lead to an overrepresentation of details in a visual scene. Previous research on ASD has indicated impaired global precedence (Rinehart et al., 2000) as well as enhanced detail perception (Behrmann et al., 2006), reflecting a disturbed balance between feedforward and feedback. The balance could apparently be due to weaker feedforward or stronger feedback activity; either way it is probably in favor of feedback. For this reason, in the present thesis visual feedforward and feedback functioning was studied in subjects with ASD. This was done in line with a neural network model of Roelfsema et al. which is explicit about the role of feedforward, feedback and also horizontal interactions in the process of segregating scenes into objects and background (Roelfsema, Lamme, Spekreijse, & Bosch, 2002). Numerous findings in monkey visual cortex have provided evidence for the model, as is outlined below.

Chapter 1
14
1.3.3 Visual feedforward, horizontal and feedback processing The function of feedforward, horizontal and feedback processing has been extensively studied using textured stimuli as displayed in Figure 3. The texture stimulus on the left represents a square on a background. The figure is made of black line elements on a white background and one can distinguish orientation boundaries (where two different orientations meet) and a surface composed of lines with a different orientation compared to the background. Figure 3. Contextual modulation (shaded region): the response of a V1 neuron is relatively enhanced when it has its receptive field on a figure (left), compared to when compared to when it is stimulated by identical background elements (right). (This figure is modified from Roelfsema et al., 2002). Note: for a color version of this figure, see Appendix Texture elements, such as the line segments, are detected by neurons in V1 that are selectively tuned to features such as orientation (Hubel & Wiesel, 1959). Victor Lamme showed that the response of a V1 neuron is modulated (i.e. enhanced) when it has its receptive field on the inside of the square (Fig. 3, left) compared to when it is stimulated by identical background elements (Fig. 3, right), even though the neuron’s receptive field is much smaller than the size of the square (Lamme, 1995; Zipser, Lamme, & Schiller, 1996). This relative enhancement is called contextual modulation and leads to the filling-in of a figure surface (see also Fig. 4). Subsequent studies showed the role of cortical feedback in this phenomenon: by lesioning or inactivating extrastriate areas filling-in of the figure surface in V1 was strongly reduced (Fig. 4, Hupé et al., 1998; Lamme, Zipser, & Spekreijse, 1998). The detection of orientation boundaries is mediated by lateral inhibition between neurons with similar orientation preference (Knierim & Vanessen, 1992) and was not influenced by extrastriate lesions (see Fig. 4).

Introduction
15
Such inhibition will lead to an enhanced response at locations where different orientations meet. It has been shown that horizontal connections between cells with similar orientation tuning play an important role in such effects (Gilbert & Wiesel, 1989; Malach, Amir, Harel, & Grinvald, 1993; Stettler, Das, Bennett, & Gilbert, 2002). As can be seen from Fig. 4, boundary detection precedes surface filling in (Lamme, Rodriguez-Rodriguez, & Spekreijse, 1999). Figure 4. This figure shows the response enhancement of monkey V1 to a textured square (left) before (‘Control’) and after (‘Lesion’) inactivation of extrastriate areas, as a function of time. Middle: the response enhancement to the boundaries starts before filling-in of the surface. Right: Filling-in of the interior of the figure is strongly diminished after a lesion, whereas boundary detection remains. (This figure is modified from Roelfsema et al., 2002). These neurophysiological findings on boundary detection and contextual modulation are integrated in an explicit neural network model of Roelfsema et al. (Roelfsema et al., 2002), showing how the specific contributions of feedforward, horizontal and feedback connections yield the process of figure-ground segregation. In short: 1. Information on the texture elements is mediated by feedforward processing, building orientation selective receptive fields at different spatial scales. 2. The detection of texture boundaries (where two orientations meet) is established by lateral inhibition between these receptive fields, coming from horizontal connections. 3. Filling-in of the surface is mediated by feedback processing, i.e. recurrent interactions between higher and lower visual areas. After filling-in, a figure surface is fully segregated from its background.
In the current thesis, we used stimuli composed of oriented line segments, which contained different amounts of figure surfaces and boundaries (see Fig. 2 in Chapter 3) to study feedforward, horizontal and feedback processing in ASD. The development of these stimuli was based on the electrophysiological findings in monkeys and the model of Roelfsema et al. (Roelfsema et al., 2002), and the stimuli allow singling out neural responses related to boundary detection and surface segregation in humans. This enables us to compare the balance between feedforward, horizontal and feedback processing in subjects with ASD to controls.

Chapter 1
16
It should be noted that in the model of Roelfsema et al. (Roelfsema et al., 2002) the role of visual feedforward/horizontal and feedback processing is related to texture boundary detection and surface segregation respectively, whereas in the model of Hochstein en Ahissar (Hochstein & Ahissar, 2002) these neural mechanisms are related more explicitly to the perception of global information and details respectively. In both models the same visual mechanisms are described, but from a relatively different perspective. Since Roelfsema et al. are explicit about the role of feedforward and feedback processing in figure-ground segregation, their model offers a good opportunity to test these mechanisms in ASD. 1.4 Outline of this thesis “A latent objective does not necessarily lead to a single type of research, or to a single study” (J.P. Vandenbroucke, 2002) In the following chapters I will provide evidence for malfunctioning of neural interactions and enhanced low-level visual processing, probably related to aberrant detail perception and grouping in people with ASD. We studied a group of 13 high functioning people with ASD (average IQ = 121 and age = 21) and compared them to control subjects without psychiatric impairments who were matched on both IQ and age. In Chapter 2 we studied global motion processing in ASD by using plaid stimuli. Plaids can be perceived as a coherently moving pattern or as two transparent gratings sliding over each other. Plaid stimuli offer the opportunity to study global visual processing directly since these stimuli require extensive pooling of motion features over space. We suggested that if global motion detection is impaired in ASD, this would lead to a decrease of the total time that a coherent pattern is perceived. In Chapters 3, 4 and 5 we investigated the balance between visual feedforward, horizontal and feedback processing in ASD to find a neural explanation for enhanced detail perception. Presumably, the balance between visual feedforward and feedback processing is essential for the character of visual perception and we assumed there is an imbalance between these mechanisms in ASD, in favour of feedback. We used a new texture discrimination task, where surface segregation was varied independently from orientation boundaries. This allowed us to separate feedforward, horizontal and feedback processing. The task was applied at three different moments in time to reveal possible learning effects. In addition, we measured EEG and fMRI activity to investigate the functional integrity of visual feedforward, horizontal and feedback connections in people with ASD. The discussion elaborates on the strengths and weaknesses of the studies presented in this thesis as well as the relation between our results and previous findings

Introduction
17
on visual perception in ASD. I will also indicate what would be promising directions for future research and how our findings could be related to other aspects of ASD, such as deficits in the social domain.
Chapter 1
18
References A.P.A. (1994). Diagnostic and Statistical Manual of Mental Disorders (DSM-IV) (4th
ed.). Washington D.C.: American Psychiatric Association. Abstractions. (2006). Nature, 441, xi - xi. Adelson, E. H., & Movshon, J. A. (1982). Phenomenal coherence of moving visual
patterns. Nature, 300(5892), 523-525. Bailey, A., Palferman, S., Heavey, L., & Le Couteur, A. (1998). Autism: The phenotype
in relatives. Journal of Autism and Developmental Disorders, 28(5), 369-392. Behrmann, M., Avidan, G., Leonard, G. L., Kimchi, R., Luna, B., Humphreys, K., et al.
(2006). Configural processing in autism and its relationship to face processing. Neuropsychologia, 44(1), 110-129.
Bertone, A., Mottron, L., Jelenic, P., & Faubert, J. (2003). Motion perception in autism: a "complex" issue. Journal of Cognitive Neuroscience, 15(2), 218-225.
Bertone, A., Mottron, L., Jelenic, P., & Faubert, J. (2005). Enhanced and diminished visuo-spatial information processing in autism depends on stimulus complexity. Brain, 128, 2430-2441.
Bolte, S., Holtmann, M., Poustka, F., Scheurich, A., & Schmidt, L. (2007). Gestalt perception and local-global processing in high-functioning autism. Journal of Autism and Developmental Disorders, 37(8), 1493-1504.
Caron, M. J., Mottron, L., Berthiaume, C., & Dawson, M. (2006). Cognitive mechanisms, specificity and neural underpinnings of visuospatial peaks in autism. Brain, 129, 1789-1802.
Casanova, M. F., van Kooten, I. A. J., Switala, A. E., van Engeland, H., Heinsen, H., Steinbusch, H. W. M., et al. (2006). Minicolumnar abnormalities in autism. Acta Neuropathologica, 112(3), 287-303.
Courchesne, E. (2002). Abnormal early brain development in autism. Molecular Psychiatry, 7, S21-S23.
Dakin, S., & Frith, U. (2005). Vagaries of visual perception in autism. Neuron, 48(3), 497-507.
De Jonge, M. V., Kemner, C., de Haan, E. H., Coppens, J. E., van den Berg, T. J. T. P., & van Engeland, H. (2007). Visual information processing in high-functioning individuals with autism spectrum disorders and their parents. Neuropsychology, 21(1), 65-73.
De Jonge, M. V., Kemner, C., & van Engeland, H. (2006). Superior disembedding performance of high-functioning individuals with autism spectrum disorders and their parents: The need for subtle measures. Journal of Autism and Developmental Disorders, 36(5), 677-683.
Del Viva, M. M., Igliozzi, R., Tancredi, R., & Brizzolara, D. (2006). Spatial and motion integration in children with autism. Vision Research, 46(8-9), 1242-1252.

Introduction
19
Fombonne, E. (2005). The changing epidemiology of autism. Journal of Applied Research in Intellectual Disabilities, 18(4), 281-294.
Gilbert, C. D., & Sigman, M. (2007). Brain states: top-down influences in sensory processing. Neuron, 54(5), 677-696.
Gilbert, C. D., & Wiesel, T. N. (1989). Columnar Specificity of Intrinsic Horizontal and Corticocortical Connections in Cat Visual-Cortex. Journal of Neuroscience, 9(7), 2432-2442.
Happé, F., Briskman, J., & Frith, U. (2001). Exploring the cognitive phenotype of autism: Weak "central coherence" in parents and siblings of children with autism: I. Experimental tests. Journal of Child Psychology and Psychiatry and Allied Disciplines, 42(3), 299-307.
Happé, F., & Frith, U. (2006). The weak coherence account: Detail-focused cognitive style in autism spectrum disorders. Journal of Autism and Developmental Disorders, 36(1), 5-25.
Hochstein, S., & Ahissar, M. (2002). View from the top: Hierarchies and reverse hierarchies in the visual system. Neuron, 36(5), 791-804.
Hubel, D. H., & Wiesel, T. N. (1959). Receptive fields of single neurons in cat's striate cortex. Journal of Physiology, London, 148, 574-591.
Hupe, J. M., James, A. C., Payne, B. R., Lomber, S. G., Girard, P., & Bullier, J. (1998). Cortical feedback improves discrimination between figure and background by V1, V2 and V3 neurons. Nature, 394(6695), 784-787.
Jolliffe, T., & Baron-Cohen, S. (1997). Are people with autism and Asperger syndrome faster than normal on the embedded figures test? Journal of Child Psychology and Psychiatry, and Allied Disciplines, 38(5), 527-534.
Kanner, L. (1943). Autistic disturbances of affective contact. In Nervous Child, 2, pp. 217-250.
Kemner, C., van Ewijk, L., van Engeland, H., & Hooge, I. (2007). Brief Report: Eye Movements During Visual Search Tasks Indicate Enhanced Stimulus Discriminability in Subjects with PDD. Journal of Autism and Developmental Disorders.
Knierim, J. J., & Vanessen, D. C. (1992). Neuronal Responses to Static Texture Patterns in Area-V1 of the Alert Macaque Monkey. Journal of Neurophysiology, 67(4), 961-980.
Lamme, V. A. F. (1995). The Neurophysiology of Figure Ground Segregation in Primary Visual-Cortex. Journal of Neuroscience, 15(2), 1605-1615.
Lamme, V. A. F., Rodriguez-Rodriguez, V., & Spekreijse, H. (1999). Separate processing dynamics for texture elements, boundaries and surfaces in primary visual cortex of the macaque monkey. Cerebral Cortex, 9(4), 406-413.

Chapter 1
20
Lamme, V. A. F., Zipser, K., & Spekreijse, H. (1998). Figure-ground activity in primary visual cortex is suppressed by anesthesia. Proceedings of the National Academy of Sciences of the United States of America, 95(6), 3263-3268.
Malach, R., Amir, Y., Harel, M., & Grinvald, A. (1993). Relationship between Intrinsic Connections and Functional Architecture Revealed by Optical Imaging and in-Vivo Targeted Biocytin Injections in Primate Striate Cortex. Proceedings of the National Academy of Sciences of the United States of America, 90(22), 10469-10473.
Milne, E., Swettenham, J., Hansen, P., Campbell, R., Jeffries, H., & Plaisted, K. (2002). High motion coherence thresholds in children with autism. Journal of Child Psychology and Psychiatry and Allied Disciplines, 43(2), 255-263.
Mottron, L., & Belleville, S. (1993). A Study of Perceptual Analysis in a High-Level Autistic Subject with Exceptional Graphic Abilities. Brain and Cognition, 23(2), 279-309.
Mottron, L., Dawson, M., Soulieres, I., Hubert, B., & Burack, J. (2006). Enhanced perceptual functioning in autism: An update, and eight principles of autistic perception. Journal of Autism and Developmental Disorders, 36(1), 27-43.
Navon, D. (1981). The Forest Revisited: More on Global Precedence. Psychological research, 43, 1-32.
O'Riordan, M., & Plaisted, K. (2001). Enhanced discrimination in autism. Quarterly Journal of Experimental Psychology Section a-Human Experimental Psychology, 54(4), 961-979.
O'Riordan, M. A. (2004). Superior visual search in adults with autism. Autism, 8(3), 229-248.
O'Riordan, M. A., Plaisted, K. C., Driver, J., & Baron-Cohen, S. (2001). Superior visual search in autism. Journal of Experimental Psychology-Human Perception and Performance, 27(3), 719-730.
Pellicano, E., Gibson, L., Maybery, M., Durkin, K., & Badcock, D. R. (2005). Abnormal global processing along the dorsal visual pathway in autism: a possible mechanism for weak visuospatial coherence? Neuropsychologia 43(7), 1044-1053.
Plaisted, K., Saksida, L., Alcantara, J., & Weisblatt, E. (2003). Towards an understanding of the mechanisms of weak central coherence effects: experiments in visual configural learning and auditory perception. Philosophical Transactions of the Royal Society of London Series B-Biological Sciences, 358(1430), 375-386.
Plaisted, K., Swettenham, J., & Rees, L. (1999). Children with autism show local precedence in a divided attention task and global precedence in a selective attention task. Journal of Child Psychology and Psychiatry and Allied Disciplines, 40(5), 733-742.

Introduction
21
Rinehart, N. J., Bradshaw, J. L., Moss, S. A., Brereton, A. V., & Tonge, B. J. (2000). Atypical interference of local detail on global processing in high-functioning autism and Asperger's disorder. Journal of Child Psychology and Psychiatry and Allied Disciplines, 41(6), 769-778.
Roelfsema, P. R. (2006). Cortical algorithms for perceptual grouping. Annual Review of Neuroscience, 29, 203-227.
Roelfsema, P. R., Lamme, V. A. F., Spekreijse, H., & Bosch, H. (2002). Figure-ground segregation in a recurrent network architecture. Journal of Cognitive Neuroscience, 14(4), 525-537.
Spencer, J., O'Brien, J., Riggs, K., Braddick, O., Atkinson, J., & Wattam-Bell, J. (2000). Motion processing in autism: evidence for a dorsal stream deficiency. Neuroreport 11(12), 2765-2767.
Stettler, D. D., Das, A., Bennett, J., & Gilbert, C. D. (2002). Lateral connectivity and contextual interactions in macaque primary visual cortex. Neuron, 36(4), 739-750.
Vandenbroucke, J. P. (2002). Alvan Feinstein and the art of consulting: how to define a research question. Journal of Clinical Epidemiology, 55(12), 1176-1177.
Veenstra-VanderWeele, J., Christian, S. L., & Cook, E. H. (2004). Autism as a paradigmatic complex genetic disorder. Annual Review of Genomics and Human Genetics, 5, 379-405.
Welch, L. (1989). The perception of moving plaids reveals two motion-processing stages. Nature, 337(6209), 734-736.
Zipser, K., Lamme, V. A. F., & Schiller, P. H. (1996). Contextual modulation in primary visual cortex. Journal of Neuroscience, 16(22), 7376-7389.

Chapter 1
22

Motion processing in ASD
23
Chapter 2
Coherent versus component motion processing in Autism Spectrum Disorder (ASD) Research on visual perception in ASD tries to reveal the underlying mechanisms of aberrant local and global processing. Global motion perception is one way to study this aspect of ASD. We used plaid motion stimuli, which can be perceived as a coherently moving pattern, requiring feature integration, or as two transparent gratings sliding over each other. If global motion detection is impaired in ASD, this would lead to a decrease of the total time that a coherent pattern is perceived. However, in contrast to other studies in the literature, our results gave no evidence of impaired global motion perception in people with ASD. A reconciliation of the different outcomes is proposed based on spatial frequency processing in ASD. Vandenbroucke, M.W.G., Scholte, H.S., van Engeland, H., Lamme, V.A.F., Kemner, C. (2007). Coherent versus component motion processing in Autism Spectrum Disorder. Journal of Autism and Developmental Disorders, Epub ahead of print, October 19th

Chapter 2
24
2.1 Introduction Visual perception research in Autism Spectrum Disorder (ASD) has revealed a focus on visual details in this patient group. While typical controls attend more to the global scene, it has been shown that people with ASD have a perceptual bias away from global processing. This has been demonstrated by, for instance, studies using the Embedded Figures Test, the Navon task and experiments where performance relies on Gestalt principles (Brosnan, Scott, Fox, & Pye, 2004; Mottron, Burack, Iarocci, Belleville, & Enns, 2003; Pellicano, Gibson, Maybery, Durkin, & Badcock, 2005; Plaisted, Swettenham, & Rees, 1999). However, Dakin and Frith (Dakin & Frith, 2005) argued in a recent paper that many of these tasks on global processing have generally not precluded observers using local grouping. Subjects with ASD could perform these tasks on the basis of local cues, which made it appear as if they have a global processing deficit. This means that a local bias has become evident from these tests, but the studies did not clarify whether there is also a global processing deficit in this patient group (Dakin & Frith, 2005; Mottron et al., 2003). The most commonly used paradigm for studying global motion perception in ASD is by means of coherency experiments, such as the Global Dot Motion (GDM) task. In this task randomly distributed dots are moving on a computer screen. Part of the dots move in the same direction, while the rest of the dots are moving in random directions, and subjects have to indicate what the direction of the coherently moving dots is. Unfortunately, studies using the GDM paradigm in ASD revealed contradictory results (Del Viva, Igliozzi, Tancredi, & Brizzolara, 2006; Milne et al., 2002; Pellicano et al., 2005; Spencer et al., 2000; Spencer & O'Brien, 2006). Spencer et al. (2000 and 2006), Milne et al., and Pellicano et al. showed higher motion coherence thresholds in ASD compared to control subjects. On the contrary, results from a GDM task in the study of Del Viva et al. and of De Jonge et al. (de Jonge et al., 2007) did not reveal a difference in coherence thresholds between subjects with ASD and control subjects. Additional controversy on motion processing in ASD was introduced by a study of Bertone et al. (Bertone, Mottron, Jelenic, & Faubert, 2003), where first and second order moving stimuli were used. First order stimuli are solely defined by differences in luminance while second order stimuli are defined by other features such as texture contrast. Their results revealed higher direction discrimination thresholds for people with ASD compared to typical control subjects when indicating the direction of movement of second order motion stimuli, but not for first order stimuli. The authors stated that processing of first order stimuli only requires a single visual area, while second order stimuli require more integrative functioning of neural networks, making these stimuli more ‘complex’. It was conjectured that a neural integration deficiency in ASD leads to aberrant processing of complex as compared to simple stimuli and hence to a deficit in second order, and not first order motion detection. However, the

Motion processing in ASD
25
complexity of second order stimuli in the study of Bertone et al. is not clearly defined (Dakin & Frith, 2005). More importantly, the relation of these stimuli to global motion processing is not entirely clear: global processing is best tested by tasks that require extensive pooling over space, while this is not necessary to detect the direction of motion of second-order motion stimuli (Dakin & Frith, 2005; Seiffert, Somers, Dale, & Tootell, 2003). For example, complex cells in primary visual cortex can reliably signal the direction of motion of random dot stimuli (Hammond, 1991; Hammond & MacKay, 1977), indicating that second order motion direction may be extracted on the basis of fairly small receptive fields. Concerning the inconsistent results on motion perception in ASD, we reinvestigated global motion processing, specifically in relation to integration properties of the visual system. We exposed control subjects and subjects with ASD to so called plaid stimuli for which the integration of motion features plays an important role (Stoner & Albright, 1992; see Fig. 1). Figure 1. The experimental plaids. (left) Plaid A. (right) Plaid B. Plaid stimuli are composed of two superimposed square-wave gratings with different orientations shown through a circular aperture. These gratings are moving each in the direction orthogonal to their orientation. The resulting percept can be either a coherent plaid pattern moving in one direction or two transparent gratings sliding over each other in different directions. Adelson and Movshon (Adelson & Movshon, 1982) proposed a two-stage model for processing these coherent plaid patterns. At an early level in the visual pathway neurons in the occipital cortex are selective for orientation and spatial frequency of the separate gratings and they are sensitive to the direction of motion of one-dimensional contours. The visual mechanisms at this early stage, however, are not able to detect the direction of motion of two-dimensional patterns. Therefore, the perceptual coherence of two gratings into a single plaid is established by a second, higher order visual mechanism. At this second stage, the integration of the previous one-dimensional motion analyses is established (see also Welch, 1989). This means that the interpretation of a plaid stimulus depends on the level of integration of superimposed moving gratings. Indeed, monkey studies and fMRI research on plaids have shown that the percept of a coherently moving pattern is selectively represented by pattern neurons in

Chapter 2
26
V5/MT (with large receptive fields), where integration of motion features over space is established (Adelson & Movshon, 1982; Huk & Heeger, 2002; Stoner & Albright, 1992). These data suggest that plaid stimuli indeed do require global processing by neurons with large receptive fields, i.e. extensive pooling over space. This is in contrast to random dot displays, where the direction of coherently moving dots can be detected by neurons in V1 (complex cells, for instance), which have smaller receptive fields and only receive input of a part of the visual field (Hammond, 1991; Hammond & MacKay, 1977). Additional evidence for global processing of plaids is that the rivalry observed between component or coherent motion with plaid stimuli belongs to the category of perceptual rivalry: either the whole scene is seen as a component motion stimulus, or as a coherent plaid. Patchy rivalry, as may be observed in the case of binocular rivalry (Lee, Blake, & Heeger, 2005), does not occur, i.e. never do subjects report seeing coherent motion in one part of the visual field, and component motion in others. This also indicates that the perceptual interpretation of the plaid stimulus depends on a process that operates over the whole scene at once. Altogether, plaid stimuli are considered adequate for studying global motion detection and integration properties of the visual system in ASD. Another interesting finding on plaids is that with longer exposure times these stimuli produce a bi-stable percept, meaning that the percept changes over time between the two alternatives (Hupe & Rubin, 2003). This is particularly useful for revealing a possible motion processing deficit in our patient group. We hypothesized that if there is a problem in global motion processing which is due to a deficit in neural integration in people with ASD, this patient group would show a bias of the bi-stable percept in favor of the transparent, non-coherently moving gratings in comparison to controls. To test this we exposed our subjects to two different plaids, each leading to different degrees of coherent motion perception. Finally, it has been shown that in schizophrenia and bipolar disorder, perceptual rivalry rates (i.e. the frequency of alternations) are respectively higher and lower compared to those of control subjects (Keil, Elbert, Rockstroh, & Ray, 1998; Miller et al., 2003). According to Keil et al. rivalry rate patterns reflect the stability of perceptual processes, suggesting lower stability of visual processing in schizophrenia. Therefore, we also explored the rivalry rate of the bi-stable percept of plaids in our patient group. 2.2 Methods 2.2.1 Subjects The sample consisted of 27 typical controls (25 males) and 13 subjects diagnosed with ASD (11 males; five subjects had a diagnosis of Autistic syndrome and eight had a diagnosis of Asperger syndrome), aged between 16 years and 4 months and 28 years

Motion processing in ASD
27
and 10 months. There were no significant age or IQ differences between the groups (see Table 1).
Table 1. Age and IQ. IQ was measured using the full WAIS-III for subjects with ASD. A short version of the WAIS-III was used to determine the IQ score for the control subjects. All subjects had normal or corrected to normal vision. The diagnostic evaluation included a psychiatric observation and a review of prior records (developmental history, child psychiatric and psychological observations and tests). ASD was diagnosed by a child psychiatrist, using the DSM-IV criteria. The parents of the subjects with ASD were administered the Autism Diagnostic Interview Revised (ADI-R, Lord, Rutter, & Le Couteur, 1994) by a trained rater. Subjects with ASD were administered the Autism Diagnostic Observation Schedule General (ADOS-G, Lord et al., 1989) by a trained rater. Thirteen subjects met ADI-R criteria for autism or autism spectrum disorder; one subject did not meet criteria for Stereotyped Behavior (this subject did meet ADOS-G criteria). All subjects, but one (who did meet ADI-R criteria), met the full ADOS-G criteria for autism or autism spectrum disorder. The subjects were medication free except for one subject with ASD (who used 20 mg Seroxat and 3 mg Risperdal per day) and had no significant neurological history. Both the subjects with ASD and the control subjects received a money reward for their participation. The study was approved by the medical ethics committee of the University Medical Centre Utrecht and subjects gave written informed consent prior to participation. 2.2.2 Apparatus Stimuli were displayed on a 19 inch monitor with a screen resolution of 1024 x 768 pixels at a frame rate of 60 Hz. MatLab software (The MathWorks Inc.) and a stimulus delivery program (Presentation Software, from Neurobehavioral Systems Inc.) were used to generate and present the stimuli. 2.2.3 Stimuli Plaids composed of two superimposed square-wave gratings were presented through a circular aperture, 11.6º of visual angle in diameter (see Figure 1), and each grating moved in a direction perpendicular to its orientation. The white background inside the aperture had a luminance of 104.8 cd/m2 and the luminance of the background outside the aperture was 0.1 cd/m2. The orientations of the gratings were always 30º and 150º
Age in years (SD) TIQ (SD)
Controls (N = 27) 21.6 (2.1) 117.4 (8.3)
ASD (N = 13) 20.8 (4.1) 120.5 (11.1)
Chapter 2
28
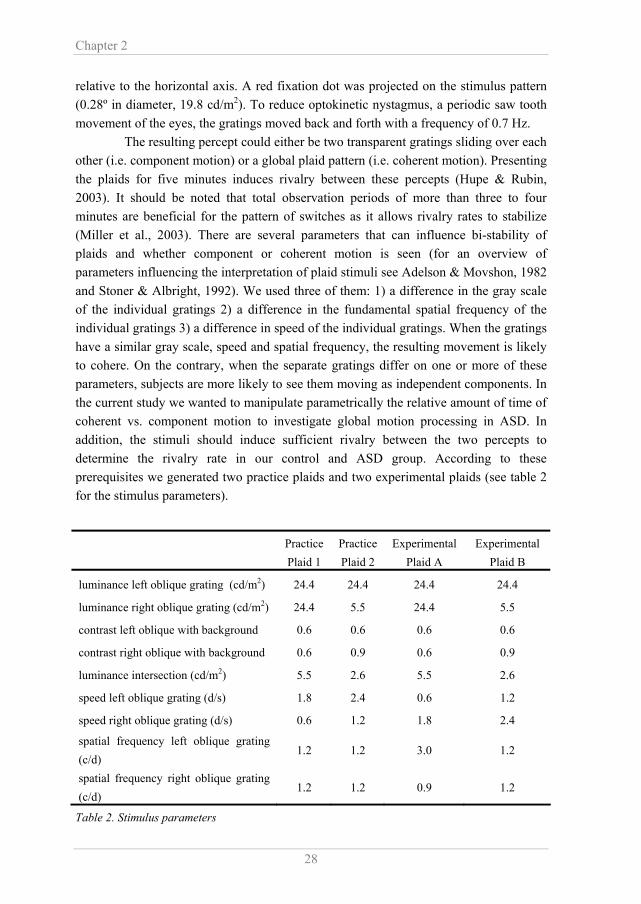
relative to the horizontal axis. A red fixation dot was projected on the stimulus pattern (0.28º in diameter, 19.8 cd/m2). To reduce optokinetic nystagmus, a periodic saw tooth movement of the eyes, the gratings moved back and forth with a frequency of 0.7 Hz. The resulting percept could either be two transparent gratings sliding over each other (i.e. component motion) or a global plaid pattern (i.e. coherent motion). Presenting the plaids for five minutes induces rivalry between these percepts (Hupe & Rubin, 2003). It should be noted that total observation periods of more than three to four minutes are beneficial for the pattern of switches as it allows rivalry rates to stabilize (Miller et al., 2003). There are several parameters that can influence bi-stability of plaids and whether component or coherent motion is seen (for an overview of parameters influencing the interpretation of plaid stimuli see Adelson & Movshon, 1982 and Stoner & Albright, 1992). We used three of them: 1) a difference in the gray scale of the individual gratings 2) a difference in the fundamental spatial frequency of the individual gratings 3) a difference in speed of the individual gratings. When the gratings have a similar gray scale, speed and spatial frequency, the resulting movement is likely to cohere. On the contrary, when the separate gratings differ on one or more of these parameters, subjects are more likely to see them moving as independent components. In the current study we wanted to manipulate parametrically the relative amount of time of coherent vs. component motion to investigate global motion processing in ASD. In addition, the stimuli should induce sufficient rivalry between the two percepts to determine the rivalry rate in our control and ASD group. According to these prerequisites we generated two practice plaids and two experimental plaids (see table 2 for the stimulus parameters).
Table 2. Stimulus parameters
Practice Plaid 1
Practice Plaid 2
Experimental Plaid A
Experimental Plaid B
luminance left oblique grating (cd/m2) 24.4 24.4 24.4 24.4
luminance right oblique grating (cd/m2) 24.4 5.5 24.4 5.5
contrast left oblique with background 0.6 0.6 0.6 0.6
contrast right oblique with background 0.6 0.9 0.6 0.9
luminance intersection (cd/m2) 5.5 2.6 5.5 2.6
speed left oblique grating (d/s) 1.8 2.4 0.6 1.2
speed right oblique grating (d/s) 0.6 1.2 1.8 2.4
spatial frequency left oblique grating (c/d)
1.2 1.2 3.0 1.2
spatial frequency right oblique grating (c/d)
1.2 1.2 0.9 1.2

Motion processing in ASD
29
To make people familiar with coherent motion, we designed one practice plaid which induced almost no switches and the dominant percept was a coherently moving pattern (practice plaid 1; pilot studies confirmed this). The second practice plaid was designed to make people familiar with component motion (practice plaid 2). This plaid induced more switches and component motion would be experienced a larger amount of time (pilot studies confirmed this). The experimental plaids (plaid A and plaid B) were both designed in such a way as to provoke many switches. In addition, the percept of plaid B would induce a longer time perceiving coherent motion as compared to plaid A (pilot studies confirmed this). Besides the importance of a parametric exploration of a possible integration deficit in ASD (Dakin & Frith, 2005), it is essential to know if the manipulation leads to the expected perceptual interpretation. If the manipulation was successful, one can be convinced that subjects were able to perform the task and that they could correctly report about their percept. 2.2.4 Procedure Prior to the practice trials, the potential bi-stability of the percept was explained to the subjects. The practice plaids were each exposed once for five minutes to the subjects. Subjects were instructed to keep their eyes on the fixation point and attend the whole computer screen. When seeing a coherently moving plaid pattern, subjects held down the left button of a computer mouse and when the two gratings were perceived as sliding over each other, the right mouse button was held down. If subjects were not sure about what they saw, they were instructed to release the button they were holding and to press a button as soon as they were confident again. The time that no button was pressed gives an indication of the criterion people used to base their perceptual interpretation on (i.e. coherent or component motion). According to signal detection theory, a criterion determines the threshold above which a response is made (Wickens, 2002). Longer times of no response suggest that people responded in a conservative way and shorter times suggest that people were liberal in their decision. We wanted to have an indication of whether both subject groups employed the same criterion and the time no button was pressed was compared between groups using a Repeated Measures ANOVA. After exposure to the two practice plaids and confirmation of the subjects that they were able to experience the two different percepts, the experiment started. The two experimental plaids were exposed each three times for five minutes, alternated with each other in a fixed order. 2.2.5 Data Analysis To check whether the manipulation of the different plaid types had succeeded (i.e. plaid B induced a higher dominance of coherent motion compared to plaid A) and to compare coherent motion processing between the two groups, the so-called predominance ratio was calculated. This was the total time subjects had seen a coherently moving pattern

Chapter 2
30
divided by the total time a subject had perceived transparent motion (values greater than one indicate dominance of coherent motion perception). In addition, the rivalry rate (switches per second) was calculated to explore the rivalry pattern of both subject groups. Both dependent variables were separately analyzed in a Repeated Measures ANOVA with plaid type (A/B) as within subjects factor and group (control/ASD) as between subjects factor. 2.3 Results 2.3.1 Subjects First of all, it should be noted that, as a homogeneous subject sample is important in research on ASD, in- or excluding female subjects did not influence the results displayed below. If subjects had reported after the two practice blocks that they solely perceived either of the two percepts (i.e. coherent motion or component motion) or they reported that they could generate the different percepts at will, they were excluded from further analyses. On the basis of this criterion, one subject with ASD and three control subjects dropped out. In addition, subjects were excluded if their predominance ratio deviated more than two standard deviations from the group mean. A very high or very low predominance ratio indicates that subjects had almost continuously pressed either of the two mouse buttons, suggesting that they had not been fully engaged in the task. On the basis of this criterion, two subjects with ASD and one control subjects dropped out (see Figure 2). These subjects were not included in any of the statistical analyses of either plaid (however, including them did not influence the group results described below). There were no differences between the groups in the total amount of time that they did not press any button which was 175 sec (10 %, SEM = 24) and 140 sec (8 %, SEM = 38) for the control and ASD subjects respectively (F(1,31) = 0.980, p = 0.330). This indicates that subjects with ASD and controls employed the same criterion for their perceptual interpretation (coherent or component motion). 2.3.2 Predominance Ratio and Rivalry Rate The scatter plots in figures 2 and 3 show the predominance ratio and rivalry rate per subject for each experimental plaid. Visual inspection of the individual data reveals that the variability of both measures is similar for the subjects with ASD as for the control subjects.

Motion processing in ASD
31
Figure 2. Predominance ratio (the total time of a coherent plaid percept divided by the total time of the percept of transparent gratings) per subject for plaid A (left) and plaid B (right). Note: Three subjects, surrounded by a circle ( subject symbols), were not included in any of the statistical analysis as their predominance ratio deviated more than two standard deviations from the group mean on either plaid A or plaid B (see text). However, including these subjects in the analysis did not result in a significant difference between ASD and control subjects either. Figure 3. Rivalry rate (in Hz) per subject for plaid A (left) and plaid B (right). Note: On the basis of the predominance ratio (see Fig. 2) three subjects were not included in any of the statistical analysis ( subject symbols). However, including these subjects in the analysis did not result in a significant difference between ASD and control subjects either. Figure 4 shows the group averages. The Repeated Measures ANOVA with predominance ratio as a within subject variable, and group as a between subject factor revealed, first of all, that plaid B induced a higher predominance ratio as compared to plaid A (F(1,31) = 8.407, p = .007, see Fig. 4). This means that the manipulation of the plaids had succeeded: our subjects’ percept of plaid B was more in favor of coherent motion as compared to the percept of plaid A. However, in contradiction to our

Chapter 2
32
expectation, the subjects with ASD did not show a bias in favor of component motion. There was no overall difference between the groups (F(1,31) = .077, p = .783), and there was no interaction of group x plaid type (F(1,31) = .397, p = .533, see Fig. 4). The bi-stability of the two percepts was the same for plaid A as for plaid B as they induced the same rivalry rate (F(1,31) = .777, p = .385, see Fig. 4). Also, there were no overall differences between groups in the rivalry rate (F(1,31) = .813, p = .374), nor an interaction of group x plaid type (F(1,31) = .121, p = .731), indicating that this measure does not differentiate people with ASD and controls. Figure 4. Group means of the predominance ratio and the rivalry rate for plaid A and B. Error bars represent the standard error of the mean. (left) The predominance ratio revealed that the manipulation of the plaids had succeeded: plaid B produced a higher predominance ratio than plaid A, * p< .05. There was no difference between the control and the patient group on this measure. (right) There were no differences between plaids or between groups on the rivalry rate. Finally, as can be seen from the data in Figures 2 and 4, the variance of the predominance ratio is moderately high in both subject groups for both kinds of plaids. To check whether there was considerable regularity in the data and to demonstrate the reliability and the successful manipulation of the stimuli, we plotted the individual subject data of the predominance ratio for each plaid in a correlation graph and calculated the Pearson’s correlation coefficient (see Fig. 5). The graph shows there was a strong correlation between the predominance ratio on plaid A and plaid B (Pearson’s r = .691, p = .000), indicating that the results are consistent (the correlation was of similar magnitude and strength for the ASD and the control group separately). In addition, this correlation graph again shows that the predominance ratio for plaid B was higher compared to plaid A (higher values on plaid B correspond to lower values on plaid A).

Motion processing in ASD
33
Figure 5. Correlation graph of the predominance ratio for plaid A and plaid B. Since the correlation between both predominance ratios was high (ρ = .691, p = .000; and ρ = .602, p = .000 after removing the three points on the right of the figure. Note: these are not outliers as shown in figure 2), the stimuli were reliable and the manipulation was successful. Although it seems that there were three additional outliers in the data (two control and one ASD subject), this is not so according to the definition of an outlier as used here (i.e. deviating more than two standard deviations from the group mean). These subjects probably contributed to the variance in the data. However, also without these three subjects the correlation was still strongly significant (Pearson’s r = .602, p = .000). It should be noted that including all subjects in the analyses (i.e. also including the three real outliers) did not influence the group effects displayed above. Studying the whole population, we still did not find any differences between the groups on the predominance ratio or in the rivalry rate. 2.4 Discussion The current study focused on the integration properties of the visual system for global motion processing in ASD by using plaid motion stimuli. These stimuli can be perceived as either two individual gratings sliding over each other or as a coherently moving pattern, requiring integration of motion features over space. According to previous research showing higher coherent motion thresholds and aberrant processing of second order motion stimuli in ASD (Bertone et al., 2003; Milne et al., 2002; Pellicano et al., 2005; Spencer et al., 2000; Spencer & O'Brien, 2006), we hypothesized that our patient group would perceive the coherent pattern motion for a shorter amount of time as compared to the control group. In addition, we looked at the rivalry rate of the bi-stable percept as it has been suggested that the rivalry rate reflects the stability of
Chapter 2
34
perceptual processes (Keil et al., 1998). Our data did not reveal any differences between the subjects with ASD and the control subjects on either measure. These results do not give an indication for impaired neural integration of global motion stimuli in ASD, nor are there indications of an altered stability of perceptual processes in this group. Since the stimulus manipulation was successful, i.e. there was a difference between plaid A and B in the total time that coherent motion was seen in both groups (see Fig. 4), we can refute an inability to perform the task as an alternative explanation for our negative results concerning a difference between the two groups. Also, there was a strong correlation between the predominance ratio of plaid A and B indicating the reliability of the stimuli and the successful manipulation (see Fig. 5). Another confound could be that eye movements influence the percept of a coherently moving pattern (Thiele & Stoner, 2003). An inherently lower tendency of ASD subjects to perceive coherent plaids (due to abnormal motion integration mechanisms) could possibly be compensated by a higher rate of eye movements (leading to higher coherence). This would then result in the false conclusion of normal visual integration in the ASD patients. However, to our knowledge there is no evidence that ASD patients make more eye movements while maintaining fixation at a centrally presented stimulus. In addition, the manipulation of the plaids had a similar effect on subjects with ASD as on control subjects, which would be hard to explain by a generally increased number of eye movements. 2.4.1 Comparison to previous findings In contrast to several studies showing impaired motion detection in ASD by using some form of the GDM task (Milne et al., 2002; Pellicano et al., 2005; Spencer et al., 2000; Spencer & O'Brien, 2006) or by using second order, contrast defined, stimuli (Bertone et al., 2003), no coherent motion processing abnormalities were found in ASD in the study from Del Viva et al. (Del Viva et al., 2006) and De Jonge et al. (de Jonge et al., 2007) using the GDM task, nor in Bertone’s data on motion processing of first order, luminance defined, stimuli, nor in the current study. It should be noted that in all the studies mentioned above children or young adults with high functioning autism or autism spectrum disorder were tested, making a comparison between results possible. The only exceptions are the study of Spencer et al. (2000), where no details on IQ are given (subjects were matched on verbal mental age), and of Del Viva et al., where a small number of low functioning autistic subjects (i.e. IQ < 70) was part of the total sample. However, we do think there is some consistency in the seemingly contradictory findings on motion processing in ASD. We suggest that differences in the spatial frequency content of the motion signal have resulted in differences in performance between studies in this patient group. The motion signal of the first order stimuli of Bertone et al. (2003) and that of our own plaid stimuli is based on low spatial

Motion processing in ASD
35
frequencies. Conversely, the motion signal in random dot stimulus patterns, as applied by Milne et al. (2002), Pellicano et al. (2005), Spencer et al., (2000) and Spencer and O’Brien (2006) contains mainly high spatial frequencies. Also, in the second order stimuli from Bertone et al. the carrier of contrast information is composed of high spatial frequencies. We conjecture that when motion patterns contain low spatial frequencies, motion processing is intact in people with ASD. On the contrary, when the motion signal has to be extracted from high spatial frequency features, results from several studies indicate that people with ASD need more coherency cues to reach performance levels similar to typical controls. (but see Del Viva et al., 2006 and De Jonge et al., 2007. Different findings in the latter could be due to the fact that the coherently moving dots formed a figure on randomly moving background dots, which requires alternative visual processing, namely figure-ground segregation (Lamme, 1995). Abnormal processing of spatial frequencies has been noted by several studies in our group (Boeschoten, Kenemans, Engeland, & Kemner, 2007; Boeschoten, Kenemans, van Engeland, & Kemner, 2007). 2.4.2 An indication of intact neural synchronization? Castelo-Branco et al. (Castelo-Branco, Goebel, Neuenschwander, & Singer, 2000) have shown that neurons in area 18 (V2) and the postero-medial bank of the lateral suprasylvian sulcus of the cat visual cortex, sensitive to the individual gratings of a plaid stimulus, fired in synchronization when they responded to coherently moving gratings. This study indicates that synchronization serves to group neuronal responses for further joint evaluation of the coherent motion signal in higher visual areas (Castelo-Branco et al., 2000). On the contrary, Thiele and Stoner (Thiele & Stoner, 2003) found that neurons in MT synchronize in response to transparent motion. Apparently, it is not clear whether the percept of coherent or transparent plaid motion can be related to synchronous activation patterns in higher visual areas. Either way, our subjects with ASD showed typical processing of plaid stimuli, suggesting normal synchronization of neurons at different levels in the visual cortex. In addition, if synchronization is indeed related to perceptual grouping (Castelo-Branco et al., 2000), it can be speculated that synchronization may not be the underlying cause of perceptual grouping abnormalities sometimes found in people with ASD (Brosnan et al., 2004). 2.4.3 Implications for global processing of static stimuli As indicated in the introduction, for static stimuli it is also not yet clear if holistic processing or grouping is intact in ASD (Happe & Frith, 2006). Atypical global processing has been shown for hierarchical stimuli (Behrmann et al., 2006), Gestalt processing (Brosnan et al., 2004) and visual illusions (Happe, 1996; but see Ropar & Mitchell, 2001). Additional evidence for impaired global perception comes from the study of Spencer and O’Brien (2006), in which they show that people with ASD need

Chapter 2
36
higher coherence cues for the perception of form in static Glass patterns. On the contrary, there is a growing body of evidence that ASD patients are capable of global processing but that enhanced detail processing (Mottron, Dawson, Soulieres, Hubert, & Burack, 2006) might result in altered performance on global tasks (Plaisted, Saksida, Alcantara, & Weisblatt, 2003; Rinehart, Bradshaw, Moss, Brereton, & Tonge, 2000). Also, it probably depends on the task demands whether there is a processing bias away from global perception (Plaisted et al., 1999; see also Mottron, Burack, Stauder, & Robaey, 1999). Our findings of normal plaid perception in ASD subjects support the view of intact global perception and grouping since these results give no evidence of deficient integration of features over space or deficient synchronization of neurons in different cortical areas (see also Dakin & Frith, 2005). 2.4.4 Conclusion To conclude, our data do not point to a neural integration or synchronization deficit in ASD for global motion stimuli. Although there are still inconsistencies regarding a deficit of motion processing in ASD and the underlying mechanisms, we conjecture that there might be a problem in the detection of coherent motion based on high spatial frequencies, but not when it is based on low spatial frequencies. We suggest that a more thorough investigation of the role of spatial frequency processing in moving stimuli in ASD is necessary. Finally, perceptual rivalry patterns for plaid motion stimuli are not abnormal in ASD, which indicates stability of the perceptual processes in this patient group.

Motion processing in ASD
37
2.5 References Adelson, E. H., & Movshon, J. A. (1982). Phenomenal coherence of moving visual
patterns. Nature, 300(5892), 523-525. Behrmann, M., Avidan, G., Leonard, G. L., Kimchi, R., Luna, B., Humphreys, K., et al.
(2006). Configural processing in autism and its relationship to face processing. Neuropsychologia, 44(1), 110-129.
Bertone, A., Mottron, L., Jelenic, P., & Faubert, J. (2003). Motion perception in autism: a "complex" issue. Journal of Cognitive Neuroscience, 15(2), 218-225.
Boeschoten, M. A., Kenemans, J. L., Engeland, H., & Kemner, C. (2007). Abnormal spatial frequency processing in high-functioning children with pervasive developmental disorder (PDD). Clinical Neurophysiology, 118(9), 2076-2088.
Boeschoten, M. A., Kenemans, J. L., van Engeland, H., & Kemner, C. (in press). Face processing in Pervasive Developmental Disorder (PDD): the roles of expertise and spatial frequency. Journal of Neural Transmission.
Brosnan, M. J., Scott, F. J., Fox, S., & Pye, J. (2004). Gestalt processing in autism: failure to process perceptual relationships and the implications for contextual understanding. Journal of Child Psychology Psychiatry, 45(3), 459-469.
Castelo-Branco, M., Goebel, R., Neuenschwander, S., & Singer, W. (2000). Neural synchrony correlates with surface segregation rules. Nature, 405(6787), 685-689.
Dakin, S., & Frith, U. (2005). Vagaries of visual perception in autism. Neuron, 48(3), 497-507.
De Jonge, M. V., Kemner, C., de Haan, E. H., Coppens, J. E., van den Berg, T. J. T. P., & van Engeland, H. (2007). Visual information processing in high-functioning individuals with autism spectrum disorders and their parents. Neuropsychology, 21(1), 65-73.
Del Viva, M. M., Igliozzi, R., Tancredi, R., & Brizzolara, D. (2006). Spatial and motion integration in children with autism. Vision Research, 46(8-9), 1242-1252.
Hammond, P. (1991). On the response of simple and complex cells to random dot patterns: a reply to Skottun, Grosof and De Valois. Vision Research, 31(1), 47-50.
Hammond, P., & MacKay, D. M. (1977). Differential responsiveness of simple and complex cells in cat striate cortex to visual texture. Experimental Brain Research, 30(2-3), 275-296.
Happe, F., & Frith, U. (2006). The weak coherence account: Detail-focused cognitive style in autism spectrum disorders. Journal of Autism and Developmental Disorders, 36(1), 5-25.

Chapter 2
38
Happe, F. G. E. (1996). Studying weak central coherence at low levels: Children with autism do not succumb to visual illusions. A research note. Journal of Child Psychology and Psychiatry and Allied Disciplines, 37(7), 873-877.
Huk, A. C., & Heeger, D. J. (2002). Pattern-motion responses in human visual cortex. Nature Neuroscience, 5(1), 72-75.
Hupe, J. M., & Rubin, N. (2003). The dynamics of bi-stable alternation in ambiguous motion displays: a fresh look at plaids. Vision Research, 43(5), 531-548.
Keil, A., Elbert, T., Rockstroh, B., & Ray, W. J. (1998). Dynamical aspects of motor and perceptual processes in schizophrenic patients and healthy controls. Schizophrenia Research, 33(3), 169-178.
Lamme, V. A. F. (1995). The Neurophysiology of Figure Ground Segregation in Primary Visual-Cortex. Journal of Neuroscience, 15(2), 1605-1615.
Lee, S. H., Blake, R., & Heeger, D. J. (2005). Traveling waves of activity in primary visual cortex during binocular rivalry. Nature Neuroscience, 8(1), 22-23.
Lord, C., Rutter, M., Goode, S., Heemsbergen, J., Jordan, H., Mawhood, L., et al. (1989). Autism diagnostic observation schedule: a standardized observation of communicative and social behavior. Journal of Autism and Developmental Disorders, 19(2), 185-212.
Lord, C., Rutter, M., & Le Couteur, A. (1994). Autism Diagnostic Interview-Revised: a revised version of a diagnostic interview for caregivers of individuals with possible pervasive developmental disorders. Journal of Autism and Developmental Disorders, 24(5), 659-685.
Miller, S. M., Gynther, B. D., Heslop, K. R., Liu, G. B., Mitchell, P. B., Ngo, T. T., et al. (2003). Slow binocular rivalry in bipolar disorder. Psychological Medicine, 33(4), 683-692.
Milne, E., Swettenham, J., Hansen, P., Campbell, R., Jeffries, H., & Plaisted, K. (2002). High motion coherence thresholds in children with autism. Journal of Child Psychology and Psychiatry, 43(2), 255-263.
Mottron, L., Burack, J. A., Stauder, J. E. A., & Robaey, P. (1999). Perceptual processing among high-functioning persons with autism. Journal of Child Psychology and Psychiatry and Allied Disciplines, 40(2), 203-211.
Mottron, L., Burack, J. A., Iarocci, G., Belleville, S., & Enns, J. T. (2003). Locally oriented perception with intact global processing among adolescents with high-functioning autism: evidence from multiple paradigms. Journal of Child Psychology and Psychiatry, 44(6), 904-913.
Mottron, L., Dawson, M., Soulieres, I., Hubert, B., & Burack, J. (2006). Enhanced perceptual functioning in autism: An update, and eight principles of autistic perception. Journal of Autism and Developmental Disorders, 36(1), 27-43.
Pellicano, E., Gibson, L., Maybery, M., Durkin, K., & Badcock, D. R. (2005). Abnormal global processing along the dorsal visual pathway in autism: a

Motion processing in ASD
39
possible mechanism for weak visuospatial coherence? Neuropsychologia, 43(7), 1044-1053.
Plaisted, K., Saksida, L., Alcantara, J., & Weisblatt, E. (2003). Towards an understanding of the mechanisms of weak central coherence effects: experiments in visual configural learning and auditory perception. Philosophical Transactions of the Royal Society of London Series B-Biological Sciences, 358(1430), 375-386.
Plaisted, K., Swettenham, J., & Rees, L. (1999). Children with autism show local precedence in a divided attention task and global precedence in a selective attention task. Journal of Child Psychology and Psychiatry, 40(5), 733-742.
Rinehart, N. J., Bradshaw, J. L., Moss, S. A., Brereton, A. V., & Tonge, B. J. (2000). Atypical interference of local detail on global processing in high-functioning autism and Asperger's disorder. Journal of Child Psychology and Psychiatry and Allied Disciplines, 41(6), 769-778.
Ropar, D., & Mitchell, P. (2001). Susceptibility to illusions and performance on visuospatial tasks in individuals with autism. Journal of Child Psychology and Psychiatry and Allied Disciplines, 42(4), 539-549.
Seiffert, A. E., Somers, D. C., Dale, A. M., & Tootell, R. B. (2003). Functional MRI studies of human visual motion perception: texture, luminance, attention and after-effects. Cerebral Cortex, 13(4), 340-349.
Spencer, J. V., & O'Brien, J. M. D. (2006). Visual form-processing deficits in autism. Perception, 35(8), 1047-1055.
Spencer, J., O'Brien, J., Riggs, K., Braddick, O., Atkinson, J., & Wattam-Bell, J. (2000). Motion processing in autism: evidence for a dorsal stream deficiency. Neuroreport, 11(12), 2765-2767.
Stoner, G. R., & Albright, T. D. (1992). Neural correlates of perceptual motion coherence. Nature, 358(6385), 412-414.
Thiele, A., & Stoner, G. (2003). Neuronal synchrony does not correlate with motion coherence in cortical area MT. Nature, 421(6921), 366-370.
Welch, L. (1989). The perception of moving plaids reveals two motion-processing stages. Nature, 337(6209), 734-736.
Wickens, T. (2002). Elementary Signal Detection Theory. New York: Oxford University Press. Inc.

Chapter 2
40

A new approach
41
Chapter 3
A new approach to the study of detail perception in Autism Spectrum Disorder: investigating visual feedforward, horizontal and feedback processing Previous studies on enhanced detail processing in ASD could not yet provide a neural explanation for this characteristic. Since the balance between visual feedforward and feedback processing is probably essential for the character of visual perception, we conjectured that this balance is disturbed in ASD. Using a new texture discrimination task, where surface segregation was varied independently from orientation boundaries, we showed that subjects with ASD scored lower than controls, probably caused by enhanced feedback. Interestingly, performance improved in the ASD group when repeating the task two additional times, indicating a compensation for the imbalance between feedforward and feedback processing. Vandenbroucke, M.W.G., Scholte, H.S., van Engeland, H., Lamme, V.A.F., Kemner, C. (in press). A new approach to the study of detail perception in Autism Spectrum Disorder: investigating visual feedforward, horizontal and feedback processing. Vision Research, Doi: 10.1016/j.visres.2007.12.017

Chapter 3
42
3.1 Introduction Autism Spectrum Disorder (ASD) is defined by several behavioral characteristics, including a strong tendency for visual detail processing as compared to typically developed people (for a review and discussion see Dakin & Frith, 2005). However, as yet, there is no standing explanation for this aspect of ASD from a neurobiological point of view. In the current paper, a clarification for increased visual detail processing in ASD is proposed and investigated based on insights in the role of feedforward and feedback activity in visual perception (Altmann, Bulthoff, & Kourtzi, 2003; Bullier, 2001; Deco & Zihl, 2001; Hupe et al., 1998). In a recent model on visual perception, the reverse hierarchy theory, feedforward and feedback processing are directly associated with the perception of global and local aspects of a stimulus, respectively. According to this theory, feedforward processing occurs first, resulting in a representation of the global aspects of a scene at higher cortical levels. Later recurrent processing to lower areas provides detailed information (Hochstein & Ahissar, 2002). The balance between feedforward and feedback activity is probably essential for the character of visual perception. If feedforward activation is stronger than feedback, there will be a relatively large impact of global features on the resulting percept, leading to, for instance, global precedence in a Navon task as is the case in healthy people (Navon, 1981). On the other hand, if feedback activity is stronger compared to feedforward, this will lead to an overrepresentation of details in a visual scene. Previous research on ASD has indicated impaired global precedence (Plaisted, Swettenham, & Rees, 1999; Rinehart, Bradshaw, Moss, Brereton, & Tonge, 2000) as well as enhanced detail perception (Behrmann, Thomas, & Humphreys, 2006; Happé & Frith, 2006). Apparently, a disturbed balance between feedforward and feedback processing in ASD could be due to weaker feedforward or stronger feedback activity. Either way, the imbalance seems in favor of feedback. For this reason, the present study is aimed at testing visual feedforward and feedback functioning in subjects with ASD. This will be done according to a model about how feedforward and feedback processing contribute to the process of segregating scenes into objects and background (Roelfsema, Lamme, Spekreijse, & Bosch, 2002). The model is based on numerous findings in monkey visual cortex (Angelucci et al., 2002; Lamme, 1995; Lamme, Rodriguez-Rodriguez, & Spekreijse, 1999; Lamme & Roelfsema, 2000; Super, Spekreijse, & Lamme, 2001; Vanessen, Anderson, & Felleman, 1992) and formalized in a neural network version, that is explicit about the role of feedforward and feedback processing, as shown in Figure 1. In the model (Roelfsema et al., 2002), elementary features such as lines and orientations (Fig. 1A) are detected by neurons in early visual areas (e.g. V1, see Fig. 1B).

A new approach
43
Figure 1. A) Example of a texture defined stimulus. B) In the model of Roelfsema et al. (2002) activity in feedforward, horizontal and feedback connections is essential for the perception of a figure on a background (‘Input’, schematic representation of A). Different grey levels represent different line orientations. Note: for a color version of this figure, see Appendix Lateral inhibition between orientation detectors with similar tuning preferences is mediated by horizontal connections (blue arrows in Fig. 1B). This inhibition reduces activity when adjacent neurons are stimulated with similar orientation (as is shown in numerous neurophysiological recordings, e.g. Knierim & Vanessen, 1992). Consequently, activity is relatively elevated at the boundary between regions of different orientation (the ‘bumps’ in Fig. 1B), i.e. at the figure-ground boundary. The V1 signal is projected to areas V2, V4, and IT via feedforward connections (red arrows in Fig. 1B). At the level where the receptive field of the neurons encompass the whole figure (e.g. in IT, see left panels in Fig. 1B), the bumps of elevated activity merge into a single bump. Feedback connections (green arrows in Fig. 1B) send signals from higher to lower areas, resulting in the ‘filling in’ of activity between the bumps. In the end, the

Chapter 3
44
region of V1 neurons corresponding to the figure has a uniformly elevated activity compared to the region of V1 neurons corresponding to the background (Fig. 1B, right panel). The model thus provides a strict and neurophysiologically motivated basis for studying the hypothesized imbalance between feedforward and feedback processing in ASD patients. It should be noted that in this model the role of visual feedforward or horizontal and feedback processing is related to texture boundary detection and surface segregation respectively, whereas in the model of Hochstein en Ahissar (Hochstein & Ahissar, 2002) these neural mechanisms are related more explicitly to the perception of global information and details respectively. In both models the same visual mechanisms are described, but from a relatively different perspective. Since Roelfsema et al. are explicit about the role of feedforward and feedback processing in figure-ground segregation, their model offers a good opportunity to test these mechanisms in ASD. Recently, Scholte (Scholte, 2003; Scholte, Jolij, Spekreijse, & Lamme, 2003; see also Vandenbroucke, Scholte, Engeland, Lamme, & Kemner, in press) has shown how visual feedforward and feedback interactions relate to figure-ground segregation in human visual cortex. Scholte used three stimuli: a textured background where no figure was present, called the homogeneous stimulus, and so-called ‘frame’ and ‘stack’ stimuli (see Fig. 2). The frame stimulus consists of an ‘empty’ frame (border) on a homogeneous background. In case of the stack stimulus the inside of the frame is filled with lines of a third orientation. These three stimuli contain the same elementary features, i.e. lines with specific orientations. By using, in different exemplars of each stimulus, all orientations for background, frame, or the region within the frame, these low level features can be fully balanced over trials. In addition, the setup allows for selectively discounting activity that is caused by the orientation discontinuity (arising from horizontal interactions, see Fig. 1): stacks and frames contain the same amount of orientation boundaries. The only difference between stacks and frames is that stacks contain an extra texture defined surface, which results in a percept of the stacking of two squares. Scholte applied these stimuli both in an EEG and functional MRI setting. When contrasting the neuroimaging signals of the frame and homogeneous stimulus, for which the resulting signal is related mainly to boundary detection, activity reflecting early feedforward and horizontal processing was revealed. The ‘stack minus frame’ contrast, which is related to the difference in surface segregation, revealed recurrent processing throughout the occipital cortex (Scholte, 2003; Scholte et al., 2003; see also Scholte, Jolij, & Lamme, 2006). A comparable, depth-cued frame stimulus was used by Zipser et al. (Zipser, Lamme, & Schiller, 1996) who also showed a lack of the figure-ground related signal in V1 for the frame-homogeneous contrast. On the contrary, so called ‘moat’ stimuli, where a depth-cued square is separated from a background by a moat, did reveal figure-ground segregation in V1 (Zipser et al., 1996).

A new approach
45
Figure 2. Examples of a homogeneous, a frame and a stack stimulus. Upper figures: actual figure configurations. Lower figures: schematic representation of the three stimuli. The different gray levels represent different line orientations. Apparently, by using homogeneous stimuli, stacks, and frames, feedforward and feedback activity can be disentangled. Therefore, we used these stimuli in a discrimination task, to study visual perception in ASD. We conjectured that the balance between feedforward and feedback activity will be disturbed in favor of feedback in people with ASD, which would lead to lower performance scores on the discrimination task. More specifically, we expected that if feedforward or horizontal processing is weak, edge detection mechanisms will be disturbed and frames (and possibly stacks) will be incorrectly perceived as homogeneous stimuli. On the contrary, if feedback activity is stronger in ASD, figure-ground segregation mechanisms will be relatively enhanced, resulting in incorrectly judging frames as stacks (i.e. filling-in of the figure inside the frame).
We extended the experimental stimuli and conditions as used by Scholte (Scholte, 2003; Scholte et al., 2003), to parametrically investigate possible abnormalities in visual feedforward and feedback mechanisms in ASD. First, we used

Chapter 3
46
various widths of the borders. In addition, we have applied the paradigm three times; initially, only performance was measured, while in the second and third session brain activity was measured as well using EEG and functional MRI. In the present paper, we present and discuss the behavioral data of the three sessions.
3.2 Methods
3.2.1 First measurement 3.2.1.1 Subjects Thirty-one control subjects (three females) and 13 subjects (two females) with ASD participated in this study (five with a diagnosis of Autistic syndrome, eight with a diagnosis of Asperger Syndrome). The diagnostic evaluation included a psychiatric observation (using DSM-IV criteria) and a review of prior records (developmental history, child psychiatric and psychological observations). There were no significant age or IQ differences between the groups (see Table 1). All subjects had normal or corrected to normal vision. The parents of the subjects with ASD were administered the Autism Diagnostic Interview Revised (Lord, Rutter, & Le Couteur, 1994) and subjects with ASD were administered the Autism Diagnostic Observation Schedule General (Lord et al., 1989), both by a trained rater. Twelve subjects met ADI-R criteria for ASD; one subject did not meet criteria for Stereotyped Behavior (this subject did meet ADOS-G criteria). All patients, but one (who did meet ADI-R criteria), met the full ADOS-G criteria for ASD. All subjects were medication free except for one subject with ASD (who used 20 mg Seroxat and 3 mg Risperdal per day) and had no significant neurological history. All subjects received a money reward for their participation. The study was approved by the medical ethics committee of the University Medical Centre Utrecht and subjects gave written informed consent prior to participation.
Age in years TIQ (SD)
Control (N = 31) 21,6 (2,1) 117,3 (7,9)
ASD (N = 13) 20,8 (4,1) 120,5 (11,1)
Table 1. IQ was measured using the full WAIS-III for subjects with ASD. A short version of the WAIS-III was used to determine IQ for the control subjects. 3.2.1.2 Stimuli, conditions and procedure Stack, frame and homogeneous stimuli (Fig. 2) were made of black line segments (0.9 cd/m2), with a length of 0.36°, a width of 0.02° and an average density of 4.2 line segments per degree, projected randomly on a white background (103 cd/m2). Four orientations (22.5, 67.5, 112.5, 157.5 degrees) of the line segments were used in a

A new approach
47
balanced way to create the stimuli. The line orientation at each edge of the texture border of frame and stack stimuli was always at 45° with that of the background and at 45° with that of the region enclosed by the border. In frame stimuli, the line orientation of the enclosed region was the same as that of the background, whereas in stack stimuli the line orientation of the enclosed region was at 90° with that of the background. Figure 3. Examples of frame stimuli in the three conditions, each with five levels of manipulation. Different grey levels reflect different line orientations.

Chapter 3
48
The difficulty level of the discrimination task was manipulated in three experimental conditions by changing different stimulus attributes: 1) the width of the border was varied (condition A, see Fig 3), 2) the size of the inner square was varied (condition B, see Fig 3), 3) both the border and the inner square were varied in size, but the total figure size remained the same (condition C, see Fig 3). The latter condition was added to control for total figure size as a possible confound on performance levels. For each condition, five levels were used. In condition A the border width was varied from 0.32 to 1.29 degrees and inner square size was always 1.93 degrees. In condition B the inner square size ranged from 0.97 to 2.89 degrees and the border width was always 0.80 degrees. In condition C the total figure size was constant (3.53 degrees), the border width varied from 0.32 to 1.29 degrees and the inner square size varied from 0.97 to 2.89 degrees. We expected that increasing the border width and decreasing the inner square size would lead to a less accurate perceptual interpretation of the stimuli in both groups, in particular a higher rate of confounding stacks and frames. Subjects fixated a red dot (24 cd/m2, 0.24°) in the centre of the computer screen which was present during the whole trial. Stimuli were presented randomly for 267 ms at an unpredictable location in one of the quadrants of the screen (eccentricity = 1.7°), followed by a mask (1017 ms), consisting of the same line elements, but now in random orientations. Subjects had to indicate as fast as possible with a button press which of the three stimuli they had seen (right index finger for frame stimuli, left index finger for stack stimuli, left middle finger for homogeneous stimuli). Responses that occurred after the start of the next trial were registered as miss trials. Three experimental settings made sure subjects had to rely on their initial percept and that a direct ‘cognitive’ comparison of the inner square with the background would be impossible: 1) the short presentation duration of the stimuli (267 ms), 2) the unpredictable appearance of the stimuli in one of the quadrants of the screen, 3) the appearance of the mask. Subjects practiced the discrimination task beforehand with three different practice blocks. Then, four experimental blocks with four stimuli per level and four homogeneous stimuli were presented. 3.2.1.3 Data analysis Percentage correct and reaction times were separately analyzed in a repeated measures ANOVA with Stimulus type (stack/frame), Condition (3 Conditions) and Level of manipulation (i.e. border width and/or inner square size, 5 Levels) as within subject factors and Group (patient/control) as a between subjects factor. Since the homogenous stimuli could not be parametrically manipulated, percentage correct and reaction time data for this stimulus were compared between groups using a one-way ANOVA. As indicated in the introduction, the incorrect response pattern (e.g. classifying frames as stacks) gives the ability to point more specifically at a deficit in either feedforward or feedback processing in ASD. The incorrect responses were analyzed post-hoc.
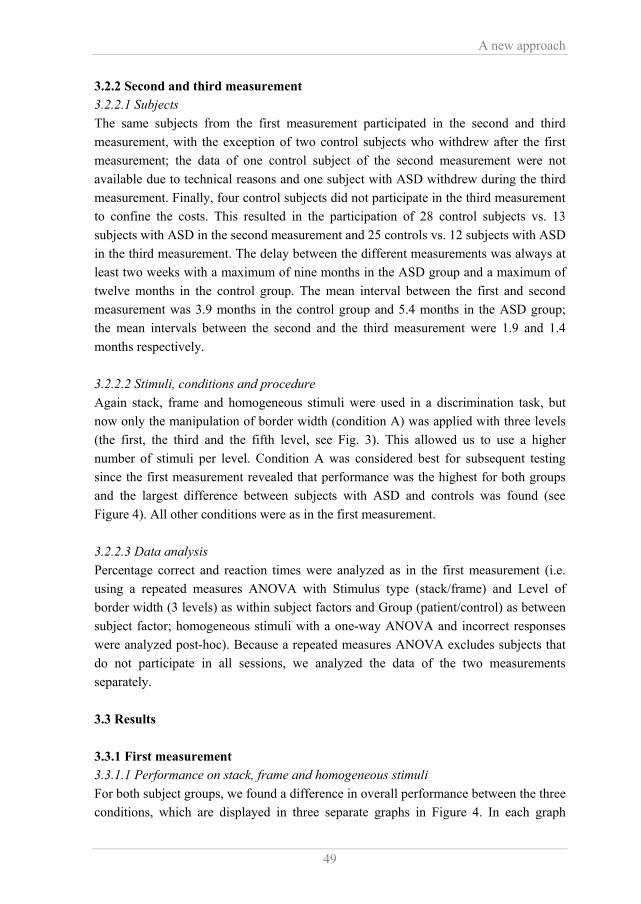
A new approach
49
3.2.2 Second and third measurement 3.2.2.1 Subjects The same subjects from the first measurement participated in the second and third measurement, with the exception of two control subjects who withdrew after the first measurement; the data of one control subject of the second measurement were not available due to technical reasons and one subject with ASD withdrew during the third measurement. Finally, four control subjects did not participate in the third measurement to confine the costs. This resulted in the participation of 28 control subjects vs. 13 subjects with ASD in the second measurement and 25 controls vs. 12 subjects with ASD in the third measurement. The delay between the different measurements was always at least two weeks with a maximum of nine months in the ASD group and a maximum of twelve months in the control group. The mean interval between the first and second measurement was 3.9 months in the control group and 5.4 months in the ASD group; the mean intervals between the second and the third measurement were 1.9 and 1.4 months respectively. 3.2.2.2 Stimuli, conditions and procedure Again stack, frame and homogeneous stimuli were used in a discrimination task, but now only the manipulation of border width (condition A) was applied with three levels (the first, the third and the fifth level, see Fig. 3). This allowed us to use a higher number of stimuli per level. Condition A was considered best for subsequent testing since the first measurement revealed that performance was the highest for both groups and the largest difference between subjects with ASD and controls was found (see Figure 4). All other conditions were as in the first measurement. 3.2.2.3 Data analysis Percentage correct and reaction times were analyzed as in the first measurement (i.e. using a repeated measures ANOVA with Stimulus type (stack/frame) and Level of border width (3 levels) as within subject factors and Group (patient/control) as between subject factor; homogeneous stimuli with a one-way ANOVA and incorrect responses were analyzed post-hoc). Because a repeated measures ANOVA excludes subjects that do not participate in all sessions, we analyzed the data of the two measurements separately. 3.3 Results 3.3.1 First measurement 3.3.1.1 Performance on stack, frame and homogeneous stimuli For both subject groups, we found a difference in overall performance between the three conditions, which are displayed in three separate graphs in Figure 4. In each graph

Chapter 3
50
percentage correct for both groups is plotted against Level of manipulation (one through five, see also Fig. 3 for the different conditions and levels). The manipulation of the inner square size (condition B) and the manipulation of both the inner square and the border width (condition C) resulted in overall lower performance scores as compared to the condition where only the border width was varied (Condition A, F(84,2) = 7.035, p = .001). Figure 4 also reveals that, as expected, performance decreased with increasing border width and decreasing inner square size (i.e. a main effect of Level of manipulation, F(168,4) = 71.644, p = .000). We would like to note that the total figure size did not influence performance. Percentage correct in condition C, where total figure size was held constant, was similarly influenced by the manipulation level of inner square size and border width as performance in conditions A and B, where total figure size changed with manipulation level (see Fig. 4). Further, we analyzed which stimuli were best identified in the different conditions. In all three conditions, both subject groups scored lower on frame stimuli than on stack stimuli as indicated by a main effect of Stimulus type (F(42,1) = 31.323, p = .000). In Figure 5 percentage correct for stack and frame stimuli is separately plotted against Level of manipulation for each subject group. The figure shows that performance for stack and frame stimuli was differently influenced by Level of manipulation. These stimuli were equally well identified when borders were thin and the inner square was large (level one), whereas with increasing border width and decreasing inner square size (level two to five), performance declined for frame stimuli, while the correct identification of stack stimuli was maintained (this interaction between Level of manipulation and Stimulus type was apparent in all three conditions, F(168,4) = 32.907, p = .000).
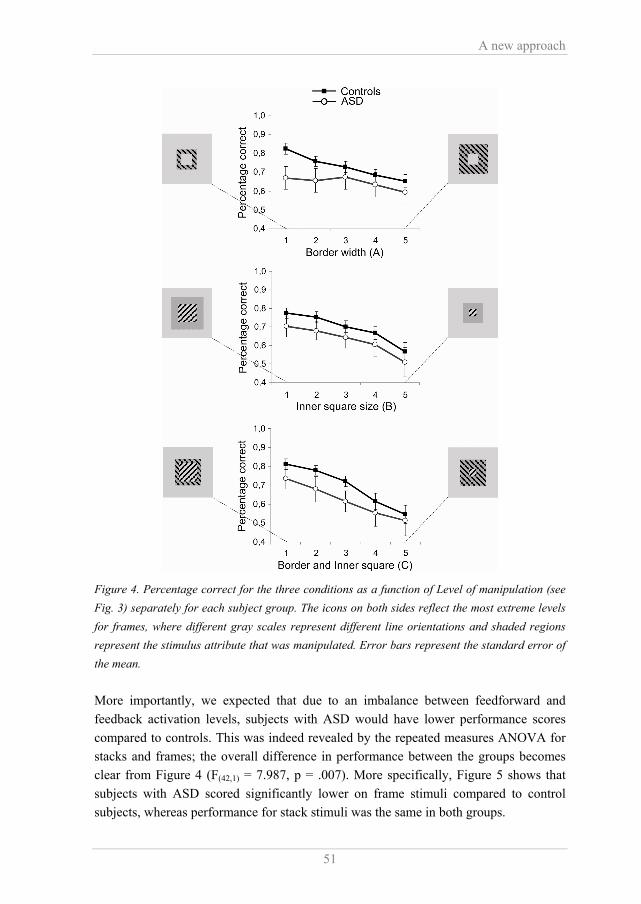
A new approach
51
Figure 4. Percentage correct for the three conditions as a function of Level of manipulation (see Fig. 3) separately for each subject group. The icons on both sides reflect the most extreme levels for frames, where different gray scales represent different line orientations and shaded regions represent the stimulus attribute that was manipulated. Error bars represent the standard error of the mean. More importantly, we expected that due to an imbalance between feedforward and feedback activation levels, subjects with ASD would have lower performance scores compared to controls. This was indeed revealed by the repeated measures ANOVA for stacks and frames; the overall difference in performance between the groups becomes clear from Figure 4 (F(42,1) = 7.987, p = .007). More specifically, Figure 5 shows that subjects with ASD scored significantly lower on frame stimuli compared to control subjects, whereas performance for stack stimuli was the same in both groups.

Chapter 3
52
Figure 5. Percentage correct plotted for the three conditions, separately for homogeneous (‘hom’, upper panel only), stack and frame stimuli for each subject group. Error bars represent the standard error of the mean. This was confirmed by a significant interaction between Group and Stimulus type in condition A (F(42,1) = 4.223, p = .046), tested post-hoc as a result of a three-way interaction between Group, Stimulus type and Condition (F(84,2) = 3.493, p = .035). In condition C, where both the border and the inner square size were manipulated, the difference between the groups in performance on frame stimuli almost reached significance (F(42,1) = 3.999, p = .052). Finally, subjects with ASD also scored lower on

A new approach
53
homogeneous stimuli compared to controls (F(42,1) = 25.172, p = .000; see Fig. 5, upper panel). As explained in the introduction, the balance between feedforward and feedback activity determines the interpretation of a visual scene, here homogeneous, frame and stack stimuli. The low performance scores in the ASD group therefore indeed indicate an imbalance between feedforward and feedback processing. The analyses of the incorrect response should reveal the origin and direction of this imbalance: is it in favor of feedforward or feedback processing? 3.3.1.2 Incorrect response analysis As mentioned above, subjects with ASD scored significantly lower than control subjects on frames in condition A, where only the border size was manipulated. Figure 6A shows the data of both subject groups for ‘stack classified as frame’ and ‘frame classified as stack’ plotted against level of border width (see Fig. 3). Figure 6. A) The percentage incorrect responses of ‘stack classified as frame’ and ‘frame classified as stack’ for the control and ASD group. B) The percentage incorrect responses of ‘stack classified as homogeneous’ and ‘frame classified as homogeneous’ for the control and ASD group. The separate data points represent the percentage of incorrect responses of homogeneous stimuli classified as frames (‘h as f’) and as stacks (‘h as s’) for both groups. Error bars represent the standard error of the mean, * p < .05, ** p < .01. Figure 6B shows the data of both groups for ‘stack classified as homogeneous’ and ‘frame classified as homogeneous’ plotted against level of border width. Also depicted in this same graph are the percentage of incorrect responses ‘homogeneous classified as frame’ and ‘homogeneous classified as stack’. The figures show that the lower performance scores in subjects with ASD on frames was most pronounced for the incorrect responses on frames with thin borders (level one). At this manipulation level subjects with ASD more often than controls incorrectly responded stack (F(42,1) = 8.488,

Chapter 3
54
p = .006, see Fig 6A) as well as homogeneous (F(42,1) = 4.538, p = .039, see Fig 6B) to frame stimuli. Since the former misinterpretation occurred more often, incorrectly classifying frames with thin borders as stacks was the main reason that subjects with ASD scored lower on frame stimuli compared to controls. Finally, as mentioned in the previous section, subjects with ASD also made more errors than controls in identifying homogeneous stimuli. This resulted in an overall higher rate of incorrect responses in the ASD group (see Fig. 6B). Both groups more often incorrectly judged homogeneous stimuli as stacks than as frames (F(42,1) = 5.755, p = .021, see Fig. 6B). This incorrect response pattern did not differ between the groups (F(42,1) = 1.309, p = .259) and it indicates a response bias for stacks (see discussion). 3.3.1.3 Post-hoc: Signal Detection Theory As performance was similar between the groups on stack stimuli, but lower for the ASD groups on frames, a bias for stack stimuli could have introduced this difference in performance. Therefore we have applied signal detection theory (SDT) to the stack/frame data. We used the perfect observer score, which is a measure for the ability to discriminate between two stimuli (i.e. d’), independent of a response bias. We should note that standard SDT is only applicable to a two alternative forced choice task, while in the current task subjects had to respond to three stimuli (Wickens, 2002). We did not include homogeneous stimuli in the analyses displayed below and the results, therefore, only serve as an indication of differences between the groups. In Figure 7 we show the perfect observer score for the ASD and control group, separately for the three conditions. The analysis confirmed that, overall, the ASD group scored lower than controls (in Table 2 the F- and p-values (left columns) from the repeated measures ANOVA are displayed for all effects described here). In addition, the decrease in performance with increasing stimulus difficulty was still strongly significant and there was a difference in performance between the three conditions: the manipulation of borders (condition A) resulted in higher scores compared to when only the inner square (condition B) or both stimulus attributes were manipulated (Condition C). Then, all three conditions separately also revealed a significant difference between the groups. In condition A this group difference was even larger for stack and frame stimuli with thin borders (level 1 and 2, as indicated by a significant interaction of group x level). Finally, we also calculated the bias, which turned out to be in favor of stack stimuli (bias = 0.20λ, t = 2.64, p = .012). Although the bias was slightly higher in the ASD group (0.21λ) compared to controls (0.19λ), this bias did not differ significantly between the groups (F(1,42) = 0.01, p = .914).

A new approach
55
Figure 7. Perfect observer score of stack vs. frame discrimination for the different levels of manipulation, separately for the ASD and control group. Yet, we should note that without taking into account the third alternative response, i.e. homogeneous, SDT would be a problem if there is much confusion between stack or frame stimuli and homogeneous stimuli. This was the case for frames with thin borders (level 1, see Figure 6B), specifically in the ASD group (6%). This type of incorrect classification could have contaminated the perfect observer scores at this level and therefore the significant differences between the groups. As it was considerably lower for the other four levels of border width (about 1%), we also tested the perfect observer
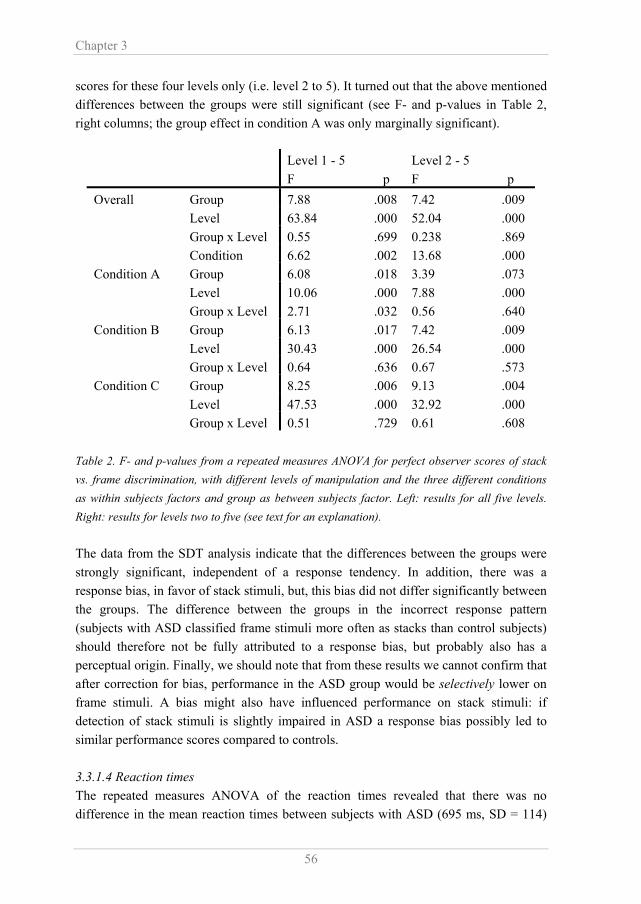
Chapter 3
56
scores for these four levels only (i.e. level 2 to 5). It turned out that the above mentioned differences between the groups were still significant (see F- and p-values in Table 2, right columns; the group effect in condition A was only marginally significant).
Level 1 - 5 F p
Level 2 - 5 F p
7.88 .008 7.42 .009 63.84 .000 52.04 .000 0.55 .699 0.238 .869
Overall Group Level Group x Level Condition 6.62 .002 13.68 .000
6.08 .018 3.39 .073 10.06 .000 7.88 .000
Condition A Group Level Group x Level 2.71 .032 0.56 .640
6.13 .017 7.42 .009 30.43 .000 26.54 .000
Condition B Group Level Group x Level 0.64 .636 0.67 .573
8.25 .006 9.13 .004 47.53 .000 32.92 .000
Condition C Group Level Group x Level 0.51 .729 0.61 .608
Table 2. F- and p-values from a repeated measures ANOVA for perfect observer scores of stack vs. frame discrimination, with different levels of manipulation and the three different conditions as within subjects factors and group as between subjects factor. Left: results for all five levels. Right: results for levels two to five (see text for an explanation). The data from the SDT analysis indicate that the differences between the groups were strongly significant, independent of a response tendency. In addition, there was a response bias, in favor of stack stimuli, but, this bias did not differ significantly between the groups. The difference between the groups in the incorrect response pattern (subjects with ASD classified frame stimuli more often as stacks than control subjects) should therefore not be fully attributed to a response bias, but probably also has a perceptual origin. Finally, we should note that from these results we cannot confirm that after correction for bias, performance in the ASD group would be selectively lower on frame stimuli. A bias might also have influenced performance on stack stimuli: if detection of stack stimuli is slightly impaired in ASD a response bias possibly led to similar performance scores compared to controls. 3.3.1.4 Reaction times The repeated measures ANOVA of the reaction times revealed that there was no difference in the mean reaction times between subjects with ASD (695 ms, SD = 114)

A new approach
57
and controls (725 ms, SD = 87, F(42,1) = .973, p = .330) on stack or frame stimuli, nor on the homogeneous stimuli (ASD 707 ms, SD = 72; controls: 700 ms, SD = 98; F(42,1) = .055, p = .816). 3.3.2 Second and third measurement 3.3.2.1 Performance on Stacks, Frames and homogeneous stimuli Figure 8 shows the data of all three measurements in three separate graphs to make a direct comparison possible. In each graph percentage correct for both groups on stack and frame stimuli are plotted against the three levels of border width (level one, three and five, see Fig. 3) together with percentage correct on homogeneous stimuli. Overall, subjects were again better in identifying stacks than in identifying frames (second measurement: F(39,1) = 23.564, p = .000; third measurement: F(35,1) = 9.018, p = .005, see Fig. 8). Also, performance decreased more for frame than for stack stimuli with increasing border width, indicated by the interaction between Level of manipulation x Stimulus type (second measurement: F(78,2) = 10.931, p = .000; third measurement: F(70,2)
= 3.407, p = .039, see Fig.7). Figure 8. Percentage correct for the different measurements, plotted for homogeneous stimuli (‘hom’), and stack and frame stimuli with different border sizes, separately for each subject group. Error bars represent the standard error of the mean. During the second measurement, the ASD subjects still had lower performance scores on the discrimination task compared to controls (F(39,1) = 4.419, p = .042), which was again due to lower scores on frames but not on stacks (the interaction Stimulus type x Group was significant, F(39,1) = 8.350, p = .006, see Fig. 8). Performance on homogeneous stimuli was also lower for the ASD group (F(39,1) = 11.898, p = .001, see Fig. 8). Interestingly, during the third measurement subjects with ASD had reached the same overall performance levels as controls (F(35,1) = 1.136, p = .294, see Fig. 8) and accordingly differences between the groups on frame stimuli had disappeared (F(35,1) = .771, p = .386). The patient group still scored lower on homogeneous stimuli (F(35,1) =

Chapter 3
58
11.437, p = .002, see Fig. 8). Apparently subjects with ASD were able to discriminate between frames and stacks, but it took them longer to learn this than control subjects. 3.3.2.2 Incorrect response analysis During the second measurement subjects with ASD scored lower than controls on frame stimuli and their incorrect response patterns ‘frame classified as stack’, ‘stack classified as frame’, ‘frame classified as homogeneous’ and ‘stack classified as homogeneous’, were similar to the first measurement; hence, these data are not shown here. However, we noticed that for subjects with ASD the response pattern of incorrectly judging homogeneous stimuli had changed during the three measurements (see Fig. 9). Whereas during the first measurement, homogeneous stimuli were more often incorrectly judged as stacks, during the third measurement subjects with ASD more often incorrectly judged homogeneous stimuli as frames (as revealed by an interaction of Group x Incorrect response (F(35,1) = 5.290, p = .028). This shift can be ascribed to the improvement in performance of ASD subjects which was mainly due to a lowering of the percentage ‘homogenous classified as stack’. Note that the incorrect judgment of homogeneous stimuli as frames did not change over the three measurements in the control or in the ASD subjects (see Fig. 9). Figure 9. The percentage incorrect responses on ‘homogeneous classified as frame’ and ‘homogeneous classified as stack’ for the control and ASD group plotted against measurement. Error bars represent the standard error of the mean. 3.3.2.3 Reaction times There was no difference in mean reaction times between the groups during the second (ASD: 798 ms, SD = 108; controls: 766 ms, SD = 111; F(39,1) = .720, p = .401) and third

A new approach
59
(ASD: 767 ms, SD = 125; controls: 742 ms, SD = 95; F(35,1) = .501, p = .484) measurement on stack or frame stimuli, nor on homogeneous stimuli (second measurement - ASD: 772 ms, SD = 103; controls: 724, SD = 82; F(39,1) = 2.596, p = .115; third measurement - ASD: 734 ms, SD = 105; controls: 682, SD = 74; F(35,1) = 3.053, p = .089). 3.4 Discussion In this study we performed a psychophysical experiment to test if there was an imbalance between visual feedforward and feedback processing in ASD. We used a forced-choice texture segregation task with three kinds of stimuli, stack, frame and homogeneous, which could be discriminated on the basis of boundary detection (frames versus homogeneous; established by feedforward and horizontal processing) and on the amount of surface present (stacks versus frames; established by feedback processing). We did three measurements at different moments in time and we explored if there was a change in performance. First of all, our psychophysical results showed that the first and the second time the subjects performed the task, subjects with ASD overall scored lower on frame stimuli than controls. SDT showed that the lower performance scores in the ASD group were apparent independent of response bias. These results indeed confirmed our hypothesis that there is an imbalance between feedforward and feedback activity in subjects with ASD. In addition, the incorrect response analyses revealed that the lower performance scores on frame stimuli was mainly due to the incorrect judgment of frame stimuli as stacks. SDT also revealed that this incorrect response pattern was probably not due to a response bias, as a bias – indeed in favor of stack stimuli – did not significantly differ between groups (although slightly higher in the ASD group). Based on the model of Roelfsema et al. (Roelfsema et al., 2002), we conjectured that the incorrect perceptual interpretation is due to relatively high levels of feedback activity (see Introduction). Interestingly, at the third measurement subjects with ASD had reached a similar performance level as controls. The data indicate that the subjects with ASD indeed have aberrancies in the balance between feedforward and feedback processing, but, after considerable practice, they were able to compensate for this imbalance. Taking into account the reverse hierarchy theory of Hochstein and Ahissar (2002), we conjecture that an imbalance between feedforward and feedback processing leads to an imbalance between the representation of respectively global aspects and details in a visual scene. Accordingly, we suggest that enhanced detail perception as commonly found in ASD (Happé & Frith, 2006) could be due to enhanced feedback, as shown here. However, we should note that the relation between the stimuli we used (stack/frame) and global or detail perception is only implicit.

Chapter 3
60
A remarkable finding was that, besides the incorrect judgment of frames, subjects with ASD also had lower performance scores on homogeneous stimuli, incorrectly judging these as stacks or as frames. Explaining this finding by means of the model is more difficult. According to the model, it indicates that subjects with ASD perceptually filled in edges and figures in a homogeneous background stimulus, i.e. that they have stronger feedforward, horizontal and feedback connections. This is in contrast with the finding of relatively stronger feedback activity only. Alternatively, it could be suggested that the subjects with ASD paid less attention to the task or they could be slower to reorient attention from the fixation point to the image which was flashed unpredictably within one of the four quadrants. However, this should result in overall lower performance scores and in differences in reaction times between the groups, which was not the case: performance on stack stimuli and reaction times were similar. Another alternative explanation is that a bias for stack stimuli, as shown by the post-hoc signal detection analysis, could have influenced performance on homogeneous stimuli during the first measurement. A bias is generally related to task uncertainty and it is directed towards the stimulus that is the most likely to occur, either in terms of the actual rate of appearance or in terms of the perceptual rate of appearance (see signal detection theory, Wickens, 2002). The latter explanation of a bias is applicable to our experiment since perceptually stack stimuli occur more often than frame stimuli: in the difficult condition (level five, see Fig. 3) frames perceptually resemble stacks as is evident from the high incorrect response pattern ‘frame classified as stack’, depicted in Fig. 6A. Although we show that a bias for stack stimuli did not differ significantly between both groups, we can not exclude the possibility that this bias underlies the differences in incorrect responses on homogeneous stimuli: SDT was only applied to stack and frame stimuli and the bias was slightly higher in the ASD group. Possibly, the bias diminished over sessions which led to a similarly diminished incorrect classification of homogeneous stimuli as stacks. Altogether, we can not, unfortunately, provide a standing explanation for this aspect of our data. For clarification, it would be most interesting to develop a neural network model capable of analyzing our stimuli, in which the strength of feedforward and feedback processing could be manipulated. We would like to stress that by comparing the perfect observer score, a bias-free measure, between the groups we could exclude the possibility that overall lower performance scores in the ASD group are due to a response bias. Still, as indicated in the results section, the SDT cannot reveal if the difference between the groups is exclusively related to incorrect judgment of frames, as fits with our feedback hypothesis. We should not ignore a different conclusion, namely that subjects with ASD score lower in general, but they are relatively better at detecting stacks. This conclusion, does not allow us to make definitive inferences about enhanced feedback processing in ASD.

A new approach
61
Another alternative explanation for the present findings is that subjects with ASD were simply counting the number of orientations that were present, instead of relying on boundary detection and surface segregation. This explanation fits with enhanced detail perception in these patients. If ASD subjects counted more than one orientation, they might have guessed that there were at least two orientations (since the homogeneous stimuli were less frequent), and the stimulus was a frame or a stack. Then, this guessing strategy could have improved over sessions: when only one orientation was perceived, this means that there were one or two orientations in the stimuli (in the third session homogeneous stimuli were more often classified as frames), but three orientations were unlikely. One result arguing against the hypothesis of this 'overestimation' strategy is that ASD subjects classified frame as homogenous more than controls (Fig. 6B) for the smaller border width (level 1). Another argument against a counting strategy is that one would expect to find differences in reaction times between the groups, specifically on stack and frame stimuli. There were no such differences between the groups (see methods). In addition, subjects with ASD were not slower in responding to stack/frame stimuli than to homogeneous stimuli as might be expected if they were counting the number of orientations (t = .79, p = .443; if anything, they were faster on stack and frame stimuli, see results section). Performance in the ASD group was significantly lower compared to controls on frame stimuli during the first measurement (about 10 to 15 %), as we suggest due to enhanced feedback activity. Interestingly, this difference diminished over measurements and in the third measurement subjects with ASD had apparently learned the task as performance scores were similar to the control group. We should note that some learning can also been seen in the control subjects as performance increased slightly over measurements, however, this was much more apparent in the ASD group (possibly due to a ceiling effect in the control group). To our knowledge, it is the first time that learning of a visual task has been demonstrated in ASD. This is a remarkable finding and the question arises what the nature of this learning could be. A possible explanation is so-called perceptual learning. That perceptual learning can occur after relatively limited training, and can last for prolonged periods of time after learning is well supported by earlier findings (Karni & Sagi, 1991). The plasticity of neural interactions has been shown in occipital areas when subjects learn a visual task, e.g. to detect the orientation of textured stimuli (Schwartz, Maquet, & Frith, 2003). Perceptual learning is already apparent 24 hours after a single training session and it can last for months (Fahle, 2005). Interestingly, perceptual learning is probably established through lateral and feedback interactions (Schwartz et al., 2003). Although our experimental setup was not designed to test this, the (fast) increase in performance in the ASD group could well be related to perceptual learning. Speculating, perceptual learning may be different in these patients as a result of stronger feedback interactions.

Chapter 3
62
Interestingly, previous research on ASD does also give (more indirect) evidence of an imbalance between feedforward and feedback mechanisms. We would like to illustrate this with some examples from earlier studies on visual perception in ASD – more examples will exist. A first example of an imbalance between feedforward and feedback activity comes from studies using (some form of) the Navon hierarchical letter task. These studies revealed that subjects with ASD show atypical global precedence compared to controls (Plaisted et al., 1999; Rinehart et al., 2000; but see Mottron, Burack, Iarocci, Belleville, & Enns, 2003). Indeed, there is also evidence of local-to-global interference in a Navon task, suggesting enhanced feedback levels (see Behrmann et al., 2006). A second example comes from a recent study of Kemner et al. (Kemner, Lamme, Kovacs, & van Engeland, 2007). The authors also investigated feedback processing in ASD by presenting homogeneous and textured checkerboard stimuli to patients and healthy controls. The authors looked at the subtraction ERP from these stimuli, which can be related to feedback activity. The data showed a difference in the latency of the ERP peak related to feedback and although the difference was not significant, probably due to the low number of subjects, the data could be interpreted as supportive of our finding of aberrant feedback mechanisms. Finally, atypical lateral and feedback connectivity has been suggested in a recent study of Bertone et al. (Bertone, Mottron, Jelenic, & Faubert, 2005), in which they showed a deficit for people with ASD in identifying the orientation of a texture defined stimulus. Although the authors relate these findings mainly to abnormal lateral connectivity (mediating detection of orientation edges), they discuss the role of feedback in processing texture defined stimuli, which could therefore also be affected in ASD. To resume, our data give evidence for an imbalance between feedforward and feedback processing in ASD. This imbalance is probably in favor of feedback processing, caused by enhanced feedback from higher to lower visual areas, as compared to control subjects. According to the models of Roelfsema et al. (Roelfsema et al., 2002) and Hochstein and Ahissar (2002), we suggest that stronger feedback activity in ASD is related to increased detail processing in this patient group. Still, there are some aspects of the data which we cannot fully explain. First of all, what is the nature of the incorrect classification of homogeneous stimuli as stacks in subjects with ASD? And why did this incorrect response pattern disappear over measurements, whereas the (high) incorrect judgment of homogeneous stimuli as frames remained the same? Another question is the nature of the performance improvement seen in the third measurement. Could perceptual learning be altered in these patients, possibly due to enhanced feedback interactions? In addition, we should take into account that alternative strategies had been employed by the ASD subjects, such as counting the number of orientations. We suggest that imaging data can provide

A new approach
63
more insight into the nature of abnormalities in visual processing that are related to recurrent processes.

Chapter 3
64
3.5 References Altmann, C. F., Bulthoff, H. H., & Kourtzi, Z. (2003). Perceptual organization of local
elements into global shapes in the human visual cortex. Current Biology, 13(4), 342-349.
Angelucci, A., Levitt, J. B., Walton, E. J. S., Hupe, J. M., Bullier, J., & Lund, J. S. (2002). Circuits for local and global signal integration in primary visual cortex. Journal of Neuroscience, 22(19), 8633-8646.
Behrmann, M., Thomas, C., & Humphreys, K. (2006). Seeing it differently: visual processing in autism. Trends in Cognitive Sciences, 10(6), 258-264.
Bertone, A., Mottron, L., Jelenic, P., & Faubert, J. (2005). Enhanced and diminished visuo-spatial information processing in autism depends on stimulus complexity. Brain, 128, 2430-2441.
Bullier, J. (2001). Integrated model of visual processing. Brain Research Reviews, 36(2-3), 96-107.
Dakin, S., & Frith, U. (2005). Vagaries of visual perception in autism. Neuron, 48(3), 497-507.
Deco, G., & Zihl, J. (2001). A neurodynamical model of visual attention: Feedback enhancement of spatial resolution in a hierarchical system. Journal of Computational Neuroscience, 10(3), 231-253.
Fahle, M. (2005). Perceptual learning: specificity versus generalization. Current Opinion in Neurobiology, 15(2), 154-160.
Happé, F., & Frith, U. (2006). The weak coherence account: Detail-focused cognitive style in autism spectrum disorders. Journal of Autism and Developmental Disorders, 36(1), 5-25.
Hochstein, S., & Ahissar, M. (2002). View from the top: Hierarchies and reverse hierarchies in the visual system. Neuron, 36(5), 791-804.
Hupe, J. M., James, A. C., Payne, B. R., Lomber, S. G., Girard, P., & Bullier, J. (1998). Cortical feedback improves discrimination between figure and background by V1, V2 and V3 neurons. Nature, 394(6695), 784-787.
Karni, A., & Sagi, D. (1991). Where Practice Makes Perfect in Texture-Discrimination - Evidence for Primary Visual-Cortex Plasticity. Proceedings of the National Academy of Sciences of the United States of America, 88(11), 4966-4970.
Kemner, C., Lamme, V. A. F., Kovacs, I., & van Engeland, H. (2007). Integrity of lateral and feedbackward connections in visual connections in visual processing in children with pervasive developmental disorder. Neuropsychologia, 45(6), 1293-1298.
Knierim, J. J., & Vanessen, D. C. (1992). Neuronal Responses to Static Texture Patterns in Area-V1 of the Alert Macaque Monkey. Journal of Neurophysiology, 67(4), 961-980.

A new approach
65
Lamme, V. A. F. (1995). The Neurophysiology of Figure Ground Segregation in Primary Visual-Cortex. Journal of Neuroscience, 15(2), 1605-1615.
Lamme, V. A. F., Rodriguez-Rodriguez, V., & Spekreijse, H. (1999). Separate processing dynamics for texture elements, boundaries and surfaces in primary visual cortex of the macaque monkey. Cerebral Cortex, 9(4), 406-413.
Lamme, V. A. F., & Roelfsema, P. R. (2000). The distinct modes of vision offered by feedforward and recurrent processing. Trends in Neurosciences, 23(11), 571-579.
Lord, C., Rutter, M., Goode, S., Heemsbergen, J., Jordan, H., Mawhood, L., et al. (1989). Autism diagnostic observation schedule: a standardized observation of communicative and social behavior. Journal of Autism and Developmental Disorders, 19(2), 185-212.
Lord, C., Rutter, M., & Le Couteur, A. (1994). Autism Diagnostic Interview-Revised: a revised version of a diagnostic interview for caregivers of individuals with possible pervasive developmental disorders. Journal of Autism and Developmental Disorders, 24(5), 659-685.
Mottron, L., Burack, J. A., Iarocci, G., Belleville, S., & Enns, J. T. (2003). Locally oriented perception with intact global processing among adolescents with high-functioning autism: evidence from multiple paradigms. Journal of Child Psychology and Psychiatry and Allied Disciplines, 44(6), 904-913.
Navon, D. (1981). The Forest Revisited: More on Global Precedence. Psychological research, 43, 1-32.
Plaisted, K., Swettenham, J., & Rees, L. (1999). Children with autism show local precedence in a divided attention task and global precedence in a selective attention task. Journal of Child Psychology and Psychiatry and Allied Disciplines, 40(5), 733-742.
Rinehart, N. J., Bradshaw, J. L., Moss, S. A., Brereton, A. V., & Tonge, B. J. (2000). Atypical interference of local detail on global processing in high-functioning autism and Asperger's disorder. Journal of Child Psychology and Psychiatry and Allied Disciplines, 41(6), 769-778.
Roelfsema, P. R., Lamme, V. A. F., Spekreijse, H., & Bosch, H. (2002). Figure-ground segregation in a recurrent network architecture. Journal of Cognitive Neuroscience, 14(4), 525-537.
Scholte, H. S. (2003). Scene segmentation: Unpublished doctoral dissertation. University of Amsterdam, the Netherlands; Online available at: http://dare.uva.nl/record/141824.
Scholte, H. S., Jolij, J., & Lamme, V. A. F. (2006). The cortical processing dynamics of edge detection and scene segmentation. In B. Breitmeyer & H. Ogmen (Eds.), The First Half Second: The Microgenesis and Temporal Dynamics of
Chapter 3
66
Unconscious and Conscious Visual Processes, (pp. 73 – 89). Cambridge (MA): MIT Press.
Scholte, H. S., Jolij, J., Spekreijse, H., & Lamme, V. A. F. (2003). Neural correlates of texture boundary detection and surface segregation are present in human V1. Journal of Vision, 3(9), 243a.
Schwartz, S., Maquet, P., & Frith, C. (2003). Neural correlates of perceptual learning: A functional MRI study of visual texture discrimination (vol 99, pg 17137, 2002). Proceedings of the National Academy of Sciences of the United States of America, 100(9), 5573-5573.
Super, H., Spekreijse, H., & Lamme, V. A. F. (2001). Two distinct modes of sensory processing observed in monkey primary visual cortex (V1). Nature Neuroscience, 4(3), 304-310.
Vandenbroucke, M. W. G., Scholte, H. S., Engeland, H., Lamme, V. A. F., & Kemner, C. (in press). A neural substrate for atypical low-level visual processing in Autism Spectrum Disorder. Brain.
Vanessen, D. C., Anderson, C. H., & Felleman, D. J. (1992). Information-Processing in the Primate Visual-System - an Integrated Systems Perspective. Science, 255(5043), 419-423.
Wickens, T. (2002). Elementary Signal Detection Theory. New York: Oxford University Press. Inc.
Zipser, K., Lamme, V. A. F., & Schiller, P. H. (1996). Contextual modulation in primary visual cortex. Journal of Neuroscience, 16(22), 7376-7389.
Atypical low-level visual processing
67
Chapter 4
A neural substrate for atypical low-level visual processing in Autism Spectrum Disorder An important characteristic of Autism Spectrum Disorder (ASD) is increased visual detail perception. Yet, there is no standing neurobiological explanation for this aspect of ASD. We show evidence from electro-encephalography data for a specific impairment in object boundary detection in ASD, which is present as soon as 120 ms after stimulus presentation. In line with a neural network model explicating the role of feedforward, horizontal and recurrent processing in visual perception, we can attribute this deficit to a dysfunction of horizontal connections within early visual areas. Interestingly, ASD subjects showed an increase in subsequent activity at lateral occipital sites (225 ms), which might reflect a compensational mechanism. In contrast, recurrent processing between higher and lower visual areas (around 260 ms), associated with the segregation between figure and background, was normal. Our results show specific neural abnormalities in ASD related to low-level visual processing. In addition, given the reconciliation between our findings and previous neuropathology and neurochemistry research in ASD, we suggest that atypical horizontal interactions might reflect a more general neural abnormality in this disorder. Vandenbroucke, M.W.G., Scholte, H.S., van Engeland, H., Lamme, V.A.F., Kemner, C. (2008). A neural substrate for atypical low-level visual processing in Autism Spectrum Disorder. Brain, Epub ahead of print, January 11th

Chapter 4
68
4.1 Introduction Autism Spectrum Disorder (ASD) is a neurodevelopmental disorder characterized by impairments in social interaction and communication, and restricted and repetitive behaviors and interests. Another important characteristic of ASD is a strong tendency for visual detail processing. In laboratory settings, this is reflected in superior performance in several tasks, such as the Embedded Figures Test, the block design test, and visual search tasks (for a review and discussion see Dakin & Frith, 2005). However, as yet, there is no standing neurobiological explanation for this aspect of ASD. A model on visual perception, called reverse hierarchy theory (Hochstein & Ahissar, 2002), relates detail perception to feedback or recurrent activity in the visual cortex, while the processing of global stimulus aspects is associated with feedforward processing. When a visual stimulus enters the occipital cortex, initially a general, categorical interpretation is provided, called ‘vision at a glance’ by these authors. Thereafter, through feedback from higher visual areas, details are incorporated, called ‘vision with scrutiny’. Since people with ASD show enhanced detail perception, the balance between visual feedforward and feedback processing in these patients is of specific interest. Findings from monkey research have provided direct evidence for the selective contributions of feedforward, feedback and also horizontal interactions in visual perception, especially in relation to figure-ground segregation, i.e. the segmentation of a scene into figure and background (Lamme, 1995; Lamme, Rodriguez-Rodriguez, & Spekreijse, 1999; Lamme, Super, & Spekreijse, 1998). In short, there are three essential neural processing steps in segregating a figure from its background: 1. Texture elements (such as the lines in Figure 1A) are detected by neurons that are selectively tuned to features such as orientation (Hubel & Wiesel, 1959). Information on the texture elements is mediated by feedforward processing. 2. The detection of orientation boundaries (where two different orientations meet, see Figure 1A) is mediated by lateral inhibition between neurons with similar orientation preference (Knierim & Vanessen, 1992). Such inhibition will lead to an enhanced response at locations where different orientations meet. Horizontal connections between cells with similar orientation tuning play an important role in such effects (Gilbert & Wiesel, 1989; Malach, Amir, Harel, & Grinvald, 1993; Stettler, Das, Bennett, & Gilbert, 2002). 3. The segregation of a surface from its background has been related to feedback processing (Angelucci & Bullier, 2003; Lamme, 1995; Lamme, Super et al., 1998; Zipser, Lamme, & Schiller, 1996), i.e. recurrent interactions between higher and lower visual areas. Feedback loops lead to enhanced activity of neurons responding to the information inside the boundaries compared to neurons responding to the background (Lamme et al., 1999). This leads to so-called “filling-in” of the surface region. The role of feedback in surface segregation has been directly demonstrated with lesion studies (Hupe et al., 1998; Lamme, Zipser,
Atypical low-level visual processing
69
& Spekreijse, 1998): when extrastriate areas in the monkey brain were eliminated, the signal related to surface filling-in was no longer apparent. The specific roles of feedforward, horizontal, and feedback processing in texture segregation are thus supported by neurophysiological studies and a recent model of Roelfsema et al. (Roelfsema, Lamme, Spekreijse, & Bosch, 2002) makes their relative contributions explicit. Indeed, the involvement of abnormal feedforward or recurrent mechanisms in ASD has been suggested. For instance Gustafsson (Gustafsson, 1997) proposed that excessive inhibitory lateral feedback is a prominent feature of the disorder, causing high sensory discrimination. Also, it has been put forward that a failure of neuronal pruning (which is possibly the underlying cause of abnormally large brain size often found in subjects with ASD, see Happé & Frith, 2006; Frith, 2004), results in aberrancies in feedback processing in ASD, while feedforward systems are intact. Additionally, Happé and Frith suggest that a lack of the modulatory influence of feedback might result in perceptual abnormalities as found in ASD. Bertone and colleagues argue in a recent study, based on the finding of impaired orientation detection for second order, texture defined stimuli, that both lateral and feedback activity might be atypical in ASD (Bertone, Mottron, Jelenic, & Faubert, 2005). In addition, lateral or horizontal connections not only play an important role in processing texture stimuli as used by Bertone et al, but also in grouping or binding (Polat, 1999; Roelfsema, 2006). Specifically, monkey research has shown the selectivity of certain horizontal connections for neurons with similar orientation tuning (Malach et al., 1993) and these connections most likely play a role in perception by Gestalt laws, such as grouping by similarity (Roelfsema, 2006). A recent behavioral study demonstrated that grouping by Gestalt principles, amongst others grouping by similarity, is less strong in people with ASD compared to controls (Brosnan, Scott, Fox, & Pye, 2004). Also, using the Embedded Figures Test (EFT), where the stimulus configuration has to be suppressed to find the embedded figure in a complex pattern of line elements, it has repeatedly been shown that people with ASD perform better on the EFT than healthy control subjects, demonstrating that this kind of grouping is weaker in ASD (De Jonge, Kemner, & van Engeland, 2006; Jolliffe & Baron-Cohen, 1997; Ropar & Mitchell, 2001). These theoretical accounts and experimental findings implicate the involvement of abnormal functioning of horizontal and feedback connections in visual perception in ASD.
Altogether, we hypothesize that an imbalance between feedforward, horizontal and feedback processing is a core feature of ASD, associated with aberrant detail perception. The functioning of these different types of connections was, to our knowledge, never systematically or explicitly studied in ASD. Since the specific roles of feedforward, horizontal and recurrent or feedback processing have been demonstrated in figure-ground segregation of textured figures (see Figure 1A), we considered the use of such stimuli appropriate for examining our hypothesis. With

Chapter 4
70
electrophysiological recordings (Event Related Potentials, ERPs) we studied texture segregation in a group of ASD subjects and compared them to healthy controls. We used stimuli composed of oriented line segments, which contained different amounts of figure surfaces and boundaries (see Figure 1A and the results section for a thorough explanation of the stimuli). By employing specific stimulus contrasts, we could single out ERP activity related to boundary detection and surface segregation, while selectively discounting activity related to local feature detection. This enabled us to draw inferences about the balance between feedforward, horizontal and feedback processing in subjects with ASD and age and IQ matched healthy controls. 4.2 Methods 4.2.1 Subjects Thirty-one control subjects (3 females) and 13 subjects (2 females) with Autism Spectrum Disorder (ASD) participated in this study (five with a diagnosis of Autistic syndrome, eight with a diagnosis of Asperger Syndrome), aged between 16 years and 4 months and 28 years and 10 months. There were no significant age or IQ differences between the groups (see Table 1) and all subjects had normal or corrected to normal vision. The diagnostic evaluation included a psychiatric observation and a review of prior records (developmental history, child psychiatric and psychological observations and tests). ASD was diagnosed by a child psychiatrist, using the DSM-IV criteria. The parents of the subjects with ASD were administered the Autism Diagnostic Interview Revised (ADI-R, Lord, Rutter, & Le Couteur, 1994) and subjects with ASD were administered the Autism Diagnostic Observation Schedule - Generic (ADOS-G, Lord et al., 1989), both by a trained rater. Twelve subjects met ADI-R criteria for autism or autism spectrum disorder; one subject did not meet criteria for Stereotyped Behavior (this subject did meet ADOS-G criteria). All subjects, but one (who did meet ADI-R criteria), met the full ADOS-G criteria for autism or autism spectrum disorder. The subjects were medication free except for one (who used 20 mg Seroxat and 3 mg Risperdal per day) and had no significant neurological history. Both the subjects with ASD and the control subjects received a money reward for their participation. The study was approved by the medical ethics committee of the University Medical Centre Utrecht and subjects gave written informed consent prior to participation.

Atypical low-level visual processing
71
Age in years TIQ (SD)
Control (N = 31) 21,6 (2,1) 117,3 (7,9)
ASD (N = 13) 20,8 (4,1) 120,5 (11,1)
Table 1. IQ was measured using the full WAIS-III for subjects with ASD. A short version of the WAIS-III was used to determine IQ for the control subjects. 4.2.2 Stimuli, conditions and procedure Subjects performed a discrimination task, during which EEG activity was measured, with randomly presented stack, frame and homogenous stimuli (see Figure 1A). The stimuli were made of black line segments (0.9 cd/m2), with a length of 0.36°, a width of 0.02° and an average density of 4.2 line segments per degree, projected randomly on a white background (103 cd/m2). Four orientations (22.5, 67.5, 112.5, 157.5 degrees) of the line segments were used in a balanced way to create the stimuli. The line orientation at each edge of the texture border of frame and stack stimuli was always at 45° with that of the background and at 45° with that of the region enclosed by the border. In frame stimuli, the line orientation of the enclosed region was the same as that of the background, whereas in stack stimuli the line orientation of the enclosed region was at 90° with that of the background. The inner square size of the stack and frame stimuli was always 1.93°. To establish a parametric design the difficulty level of the discrimination task was manipulated by varying the thickness of the borders of frame and stack stimuli (see Figure 2A), i.e. 0.32, 0.81 or 1.29 degrees, resulting in a total stimulus size of 2.57, 3.55 or 4.51 degrees. We conjectured that thicker borders would make the distinction between stack and frame stimuli less visible (it would be more difficult to see the inside of the frame as continuous with the background). Concerning the ERP data, we hypothesized that the manipulation of border width would primarily affect surface segregation, reflected in the activity in the stack - frame contrast (see results section for an explanation on the relation between the stack - frame contrast and surface segregation). During the experiment subjects fixated a red dot (24 cd/m2, 0.24°) in the centre of the computer screen which was present during the whole trial. A trial started with the presentation of a stack, frame or homogeneous stimulus for 267 ms at an unpredictable location in one of the quadrants of the screen (eccentricity between the fixation dot and the closest stimulus corner was always 1.7°). The stimulus was immediately followed by a mask (jittered presentation duration of 1817 to 2017 ms resulting in a total trial duration of 2084 to 2284 ms), consisting of the same line elements, but now in random orientations. When subjects pressed a response button the fixation dot changed from red

Chapter 4
72
to green. To announce the next trial the color changed back to red 267 ms before the start of the trial. Responses had to be as fast as possible and before the color of the fixation dot changed back to red. Buttons for stack and homogeneous stimuli were always pressed by the index and middle finger of one hand (left or right, counterbalanced over subjects) and the button for frame stimuli was pressed by the index finger of the other hand. Since stack and homogeneous stimuli resemble each other least, this pattern of button responses would make confusion between button responses least likely. Three experimental settings made sure subjects had to rely on their initial percept and a direct ‘cognitive’ comparison of the inner square with the background was impossible: 1) the short presentation duration of the stimuli (267 ms), 2) the unpredictable appearance of the stimuli in one of the quadrants of the screen, 3) the appearance of the mask. Subjects practiced a discrimination task beforehand with three different practice blocks. Then, six experimental blocks of trials with 32 stimuli per level of border width of each frame and stack stimulus, and 32 homogeneous stimuli were presented to the subjects. 4.2.3 Psychophysics - data analysis Percentage correct and reaction times were separately analyzed for stack and frame stimuli using a repeated measures ANOVA with Border Width (3 levels) as within subject factor and Group (patient/control) as a between subjects factor. Since the homogenous stimuli could not be parametrically manipulated, percentage correct and reaction time data for this stimulus were compared between groups using a one-way ANOVA. 4.2.4 EEG - recording and data analysis Electro-encephalographic activity was recorded by means of a Biosemi 48-channel Active Two EEG system (Biosemi Instrumentation BV, Amsterdam, the Netherlands), and data were sampled at a rate of 256 Hz. Two electrodes in the cap, the CMS (= common mode sense) and DRL (= driven right leg), provided an ‘active ground’ in this system. To monitor eye movements, vertical and horizontal EOG was recorded with electrodes attached above, below, and next to each eye. Data were referenced to Fz and filtered offline with a high-pass filter at .5 Hz, a low-pass filter at 20 Hz and a 60 Hz notch filter. In order to compute event-related potentials, segments from 250 ms pre-stimulus until 700 ms post-stimulus were extracted offline. Before ocular correction, automatic raw artifact rejection was applied by removing segments containing voltage steps of more than 50 μV, removing any segments outside the -200 μV to 200 μV range as well as segments containing larger than 200 μV differences. EOG artifacts were removed from the EEG using an algorithm

Atypical low-level visual processing
73
where correction factors are calculated on the basis of linear regression (Gratton, Coles, & Donchin, 1983). After ocular correction, artifact rejection was applied again by removing all segments outside the -75 μV to 75 μV. Artifact rejection resulted in 9 % rejected segments in the control group and 14 % rejected segments in the ASD group. Linear local DC de-trending was applied to remove current drift (by subtracting a linear function from each segment). Segments were corrected for baseline, using the data from the 150 ms prior to stimulus onset. All pre-processing steps were done using Brain Vision Analyzer (Brain Products GmbH, Munich, Germany). To establish if the scalp distributions of the subtraction ERPs were at occipital sites, comparable to previous electrophysiology studies on figure-ground segregation (Caputo & Casco, 1999; Knierim & Vanessen, 1992; Lamme, 1995), spline Laplacian distribution maps were calculated. This was done by interpolating ERP waves using spherical splines and approximating current source densities (Perrin, Pernier, Bertrand, & Echallier, 1989). The resulting maps are spatial second order derivatives of the scalp potentials lending greater weight to local contributions of cortical generators, filtering out deep sources, as well as being reference free (Nunez & Srinivasan, 2006).
For each subject, the data were averaged for each stimulus and for each quadrant separately. We first averaged the data within quadrants across subjects since stimulation of the different spatial locations led to a retinotopic organization of the ERP signals, which was similar in both groups. Then, individual subject data were averaged for each group, followed by averaging the quadrant data, leaving group averages for homogeneous stimuli, and stack and frame stimuli with different border widths.
Before doing the analyses, we pooled some electrodes to increase the signal to noise ratio. Stack and frame stimuli were averaged over border width and, as well as homogeneous stimuli, averaged over groups. The subtraction ‘(stack + frame) – homogeneous’ was used to determine pooling of electrodes by visually inspecting the data. Consistent with earlier electrophysiology findings (Caputo & Casco, 1999; Knierim & Vanessen, 1992; Lamme, 1995), this figure-ground contrast elicited the largest differential activity at occipital sites, i.e. at Oz, O1 and O2; this pool of electrodes was used for further analyses.
Next, we wanted to outline in the control group the time windows related to boundary detection and surface segregation, to subsequently compare these between the groups. Therefore, subtraction potentials were calculated for frame and stack stimuli with thin borders: ‘frame - homogeneous’ and ‘stack - frame’ (see results section for an explanation and see Figure 1C). To validly define the time windows in the control group, the first moment of significant deflection was determined with a random effects analysis, performed on the difference waves by employing a one-sample t-test at each time point. The average of each subject at that time point was treated as an observation. Correction for multiple comparisons with respect to the number of time points being tested was done using the False Discovery Rate (FDR, p <.01, Benjamini & Hochberg,

Chapter 4
74
1995) in MATLAB (The MathWorks, Inc., Natick, MA, USA). Then, from the first moment of significant deflection, one sample t-tests were done in SPSS (SPSS Inc., Chicago, IL, USA) on both difference waves over pooled time segments of 20 ms, to determine the total time window of the deflection (p < .005). For the resulting time windows of the subtraction potentials ‘frame - homogeneous’ and ‘stack - frame’ a comparison between groups was done on segments of 20 ms, using a repeated measures ANOVA with Border Width (3 levels) as within subjects factor and Group (patient/control) as between subjects factor. P-values of less than .005 were considered significant. The occipito-parietal effect studied post hoc (see results section) was found by continuing the analysis of the 20 ms segments after the time window related to boundary detection. 4.3 Results 4.3.1 Contrasting stack, frame and homogeneous stimuli to separate surface segregation from boundary detection Figure 1A shows the stimuli used in our experiment. In a homogeneous stimulus no figure is present. A frame stimulus consists of an ‘empty’ frame (border) on a homogeneous background whereas in case of the stack stimulus the inside of the border is filled with lines of a third orientation. These three stimuli contain the same elementary features, i.e. local line elements with specific orientations (see methods). By using, in different exemplars of each stimulus, all orientations for background, frame, or the region within the frame, these low level features can be fully balanced over trials. In this way all three stimuli will, on average, elicit identical responses from orientation selective mechanisms, i.e. neurons in early visual areas in the feedforward sweep (Hubel & Wiesel, 1959). In addition, the experimental setup allows for selectively discounting activity that is caused by the orientation discontinuity, arising from horizontal interactions (Gilbert & Wiesel, 1989; Malach et al., 1993; Stettler et al., 2002): stacks and frames contain the same amount and strength of orientation boundaries. The only difference between these stimuli is that stacks contain an extra texture defined surface, which results in the percept of the stacking of two squares. This extra surface will elicit a relatively enhanced texture segregation signal in lower occipital areas, arising from feedback from higher cortical areas (Angelucci & Bullier, 2003; Lamme, 1995; Lamme, Zipser et al., 1998; Zipser et al., 1996). In Figure 1B we show ERP responses to stack, frame and homogeneous texture stimuli, obtained from both control and ASD subjects. After the subtraction procedure, outlined in detail in Figure 1C, we obtain more selective responses. As explained above, the remaining signal from the subtraction ‘stack – frame’ is due to the difference in surface organization between stack and frame stimuli. This signal (from

Atypical low-level visual processing
75
control subjects), is shown in Figure 1D. A significant positive deflection related to surface segregation is found between 215 and 320 ms after stimulus presentation. The contrasts ‘frame – homogeneous’ and ‘stack – homogeneous’ isolate activity due to both surface segregation and boundary detection. The contribution of surface segregation mechanisms will be lowest in the ‘frame – homogeneous’ contrast, as the frame has only a minimal amount of surface. In addition, we know from earlier work in both human subjects and monkeys that boundary detection precedes surface segregation in time (Caputo & Casco, 1999; Lamme et al., 1999; Roelfsema et al., 2002). In the control subjects, our stack-frame contrast reveals surface segregation mechanisms to emanate from 215 ms onwards (see above). Therefore, it is logically warranted to attribute any activity found in the frame-homogeneous contrast prior to 215 ms to boundary detection mechanisms. This activity is indeed present, from 121 ms onwards, as shown in Figure 1E. Having identified, in control subjects, the ERP signals that relate to either boundary detection or surface segregation, we can now proceed towards investigating whether there are differences between the control (N = 31) and ASD (N = 13) subjects with respect to these two elementary visual processes. First, however, we show the psychophysical data of the behavioral task.

Chapter 4
76
Figure 1. A) The stimuli used in the discrimination task while EEG activity was measured. B) The EEG responses (converted to spline laplacian’s) to the stimuli for controls and subjects with ASD, before any subtraction. C) The subtractions that were made to isolate activity related to boundary detection and surface segregation. Different gray levels represent different line orientations. D) The stack - frame subtraction wave (for control subjects) to determine the time window, indicated

Atypical low-level visual processing
77
by the gray panel, related to surface segregation. E) The frame - homogeneous subtraction wave (for control subjects) to determine the time window, indicated by the gray panel, related to boundary detection. 4.3.2 Stack, frame and homogeneous stimuli: performance data from a parametric design During the EEG measurement behavioral data were obtained, of which group averages are shown in Figure 2B. Performance decreased with increasing border width (see Figure 2A) both for frames (F(84,2) = 62.616, p = .000) and for stacks (F(84,2) = 15.729, p = .000). In addition, subjects with ASD scored lower than controls on homogeneous stimuli (F(42,1) = 11.578, p = .001) and on frame stimuli (F(42,1) = 5.363, p = .026), but performance was the same in both groups for stack stimuli (F(42,1) = .137, p = .713). There were no interactions between group and border width for either stacks or frames. Figure 2. A) The manipulation of the stack and frame stimuli, i.e. increasing the border width. B) Performance data of the three-way alternative forced choice task between homogeneous (‘hom’), stack and frame stimuli. Subjects with ASD scored lower on frame and homogenous stimuli, whereas performance for stacks was the same compared to controls. These data suggest that subjects with ASD are able to detect a stimulus that has a highly salient surface (stacks), whereas detection of a stimulus on the basis of mostly boundaries (frames) is impaired. This impairment could also have led to confusion between homogeneous and frame stimuli, explaining lower performance scores on homogeneous stimuli in the ASD subjects. Finally, it should be noted that there were no differences between the groups on RT for either frame (F(42,1) = .552, p = .462), stack (F(42,1) = 1.156, p = .288) or homogeneous stimuli (F(42,1) = .872, p = .356). 4.3.3 Impaired boundary detection in subjects with ASD As explained before, we investigated the specific stimulus subtractions and time windows related to boundary detection and surface segregation to reveal differences between subjects with ASD and controls in the underlying visual processing mechanisms. We should note that when looking at the ERP data, prior to subtraction, in

Chapter 4
78
Figure 1B, one will see additional differences between the groups, at various latencies, both before and after the intervals discussed here. These differences could very well reflect other fundamental distinctions between controls and ASD in the processing of visual stimuli. However, the current stimuli and paradigm only allow stimulus subtractions that reveal the underlying neural mechanisms specifically related to boundary detection and surface segregation. (For example the detection of line elements was subtracted out and could not be compared between the groups). We do therefore not feel free to speculate about the origin of other differences between the groups. We first compared the ASD subjects with controls on the early part of the frame - homogeneous contrast, which is specific for boundary detection. This contrast was made for all three border widths of the frame stimuli (Figure 3A). Figure 3C shows the subtraction waves for the three levels of border width. Figure 3B and 3D depict the activation maps of the control and ASD subjects respectively, during the temporal interval that is specific for boundary detection (roughly 100 - 200 ms). In these maps, activity related to the frame - homogeneous contrast is pooled for all three frame stimuli, for reasons outlined below. As already revealed, the control group showed a negative deflection related to boundary detection from 121 ms after stimulus presentation at central occipital electrodes (Figure 3B). Remarkably, this negativity was strongly diminished in the ASD group (compare the maps of Figure 3D with those of Figure 3B, and the ERP traces in Figure 3C). A repeated measures ANOVA confirmed this: from 121 to 203 ms the subtraction waves (Figure 3C) differed significantly between the groups (F(42,1) > 9, p < .005) over all three levels of border width. Note that the ERP data include trials for both correct and incorrect responses. The accuracy of the behavioral response might have confounded the ERP difference in boundary detection between the groups. However, excluding the incorrect trials (about 35%) would strongly reduce the statistical power and it would undo counterbalancing of the line orientations that we carefully applied when designing the stimuli (see methods). In addition, we found that activity increased with thicker borders on the boundary related signal from 121 to 141 ms (F(42,1) > 5 , p < .005). This is probably due to the fact that when the width of the border increases, the length of the orientation boundary also enlarges, resulting in enhanced boundary related signal. However, the effect of border width was very small and not distinguishable at the level of the activation maps. Therefore we pooled the activity of all three border widths before computing the maps of Figures 3B and 3D.

Atypical low-level visual processing
79
Figure 3. A) The subtractions for the three different border widths of frame stimuli that were made to isolate activity related to boundary detection. Legend for C. Different gray levels represent different line orientations (not all line orientations are shown). B) Activation maps of the frame – homogeneous contrast for the control group, pooled over the three levels of border width. C) The graphs represent the subtraction waves frame – homogeneous for the three conditions at central occipital sites (O1, O2, Oz; controls left; ASD right). During the time window related to boundary detection, indicated by the gray panels, activity was strongly diminished for subjects with ASD compared to controls. D) Activation maps of the frame – homogeneous contrast for the ASD group, pooled over the three levels of border width. Note: for a color version of this figure, see Appendix

Chapter 4
80
We should also note that the boundary-related signal was weaker for a stimulus presented in the upper visual field compared to a stimulus in the lower visual field, which was evident in both groups. Therefore we reanalyzed the data for the upper and the lower visual fields separately. For stimulation of the lower visual field, the difference between the groups for the boundary-related ERP was of the same magnitude and strength as displayed in Figure 3, while stimulation of the upper visual field led to a similar, but less significant trend. There were no differences between stimulation of the left or right hemifield. Our finding that ASD subjects show a diminished boundary-related negativity is consistent with the psychophysical results as the subjects with ASD scored lower on frame stimuli than controls. Correct detection of frames relies more heavily on processing of orientation boundaries, since there is little signal related to surface segregation. A deficit in the identification of frames could well be related to the diminished boundary related negativity in the patient group. To test this, we correlated the performance on frame stimuli, averaged over border width, to the boundary related ERP signal, also averaged over border width, separately for each subject group. Interestingly, we found that there was a negative correlation between the performance data and the subtraction ERP for the ASD subjects on the first 20 ms time bin (i.e. 121 – 141 ms, Pearson’s r = -.55, p = .05, see Figure 4). This means that ASD subjects who scored higher on frame stimuli showed a more negative ERP deflection. A correlation between performance on frames and the boundary-related negativity was not evident for the control subjects (Pearson’s r = -.09, p = .65). This finding confirms that a deficit in the detection of frames in ASD subjects is probably related to the diminished boundary-related ERP signal, whereas when subjects with ASD performed similar to controls, their ERP signals also showed a comparable boundary-related negative deflection.

Atypical low-level visual processing
81
Figure 4. Correlation graph of the performance scores on frame stimuli and the boundary-related ERP (i.e. frame – homogeneous, averaged over border width) for the time window 121 to 141 ms, separately for each subject group (top: ASD, bottom: controls). The negative correlation for the ASD subjects (p = .05) indicates that with increasing performance the boundary-related ERP was more negative, i.e. more comparable to controls. There was no significant correlation in the control group between performance and the boundary related ERP (p = .65) 4.3.4 Normal surface segregation in subjects with ASD Surface segregation was singled out by the stack - frame contrast (see Figure 5). This contrast was made for all three levels of border width of the frame and stack stimuli (Figure 5A). Figure 5C shows the subtraction waves for the three levels of border width. Figure 5B and 5D depict the activation maps of the control and ASD subjects respectively, during the temporal interval that is specific for surface segregation (roughly 200 – 300 ms), and for stacks and frames with the thinnest borders (stack 1 – frame 1, see Figure 5A). This contrast was selected for presentation because it yielded the highest signal to noise ratio of the stack – frame activity.

Chapter 4
82
Figure 5. A) The subtractions for the three different border widths of stack and frame stimuli that were made to isolate activity related to surface segregation. Legend for C. Different gray levels represent different line orientations (not all line orientations are shown). B) Activation maps of the stack –frame contrast for the control group, only for the stack and frame stimuli with thin borders (level 1; see A). C) The graphs represent the subtraction waves stack – frame for the three conditions at central occipital sites (O1, O2, Oz; controls left; ASD right). During the time window related to surface segregation, indicated by the gray panels, activity was the same for subjects with ASD and controls. D) Activation maps of the frame – homogeneous contrast for the ASD group, only for the stack and frame stimuli with thin borders (level 1; see A). Note: for a color version of this figure, see Appendix As already revealed, the control group showed a positive deflection related to surface segregation from 215 to 320 ms after stimulus presentation at central occipital electrodes, indicated in red at the maps in Figure 5B. Figure 5D shows the activation maps for the ASD group. The subtraction waves (Figure 5C) and the maps show that
Atypical low-level visual processing
83
there were no differences between the groups during this time window. Although it appears as if the positive deflection continued in the ASD group after this time interval, i.e. after 320 ms, group effects were not significant. These data are again consistent with our psychophysical findings: the subjects with ASD had the same performance scores compared to controls on stack stimuli, for which the detection relies heavily on surface segregation. On the basis of our behavioral data showing that the discrimination between stacks and frames decreased with increasing border width (see Figure 2B), we expected that the stack - frame difference wave would also decrease (see also Methods). The graphs in Figure 5C show that this was indeed the case in both groups from 242 to 320 ms (F(84,2) > 7, p < .005). It should be noted that the decrease in the performance data and the decrease in the ERP activity for the stack - frame contrast were both linear (performance: F(42,1) > 18, p < .005; ERP: F(42,1) > 10, p < .005). Since the ERP activity at central occipital sites probably reflects processing in striate and extrastriate areas, the results provide additional evidence for the role of these visual areas in the perceptual interpretation of a visual scene, as has been suggested previously (Guo, Benson, & Blakemore, 2004; Lee, Mumford, Romero, & Lamme, 1998; Super, Spekreijse, & Lamme, 2001). 4.3.5 Compensation in higher cortical areas? Thus far, we found that boundary detection mechanisms are aberrant in ASD, while surface segregation mechanisms are not. How can this be, given that boundary detection is considered to be an essential prerequisite for surface segregation? We further investigated the frame – homogeneous contrast; that is, we looked at the activity after the time window that was specific to boundary detection. Surprisingly, it turned out that from 223-243 ms the signal at occipito-parietal electrodes (PO7, PO8, P7 and P8) was more positive in the ASD group compared to controls (see Figure 6A). This enhanced positivity was dependent on the border width of the frame stimuli: the positive deflection increased with increasing border width in the ASD group but not in the control group (F(84,2) > 6, p < .005, see Figure 6B). This effect at lateral occipital sites in the ASD group could cautiously be interpreted as enhanced processing and may reflect a compensatory mechanism for the earlier atypical processing, around 120 ms, at lower level - central occipital - sites. See the discussion for a more extensive debate on this issue.

Chapter 4
84
Figure 6. A) Activation maps of the frame – homogeneous contrast for the control group and ASD group, pooled over the three levels of border width. B) The graphs represent the subtraction waves frame – homogeneous for the three conditions at lateral occipital sites (PO7, PO8, P7, P8). Activity increased with increasing border width for subjects with ASD but not for control subjects from 223 to 243 ms. Note: for a color version of this figure, see Appendix 4.4 Discussion In the current research the neural basis of atypical visual detail perception in ASD was investigated with ERPs. We conjectured that this aspect of ASD is due to an imbalance between feedforward, horizontal and feedback activity. By using a texture segregation task, where surface segregation could be varied independently of orientation based boundary detection, feedforward, horizontal and recurrent processing could be explicitly tested. The results showed that from 121 ms after stimulus presentation, subjects with ASD had strongly diminished activity at central occipital electrodes compared to controls in response to orientation boundaries. Interestingly, when contrasting activity of stack and frame stimuli, we found activity associated with surface segregation from 215 to 320 ms at occipital electrodes, which did not differ between the groups. The ERP data parallel the results of the behavioral data since subjects with ASD scored lower on frame stimuli (for which correct identification relied mainly on boundary detection), but not on stack stimuli (for which the correct identification relied mainly on surface segregation). A significant correlation for the ASD subjects between performance on frame stimuli and the boundary-related negativity, i.e. a more negative deflection for subjects with higher performance scores, confirmed the association between the

Atypical low-level visual processing
85
behavioral and electrophysiological results. Specifically, ASD subjects who were better in detecting frame stimuli, also showed a more ‘normal’ boundary-related ERP signal, i.e. more comparable to that of controls. As explained in the introduction, there is evidence from neurophysiological, neuroanatomical, and modeling studies that horizontal connections, mainly those between cells with similar orientation tuning (Malach et al., 1993), are vital to the process of boundary detection through lateral inhibition (Knierim & Vanessen, 1992; Lamme et al., 1999). Surface segregation on the other hand is associated with recurrent or feedback processing from higher to lower visual areas (Lamme & Roelfsema, 2000; Lamme, Super et al., 1998). Therefore, these data give strong evidence for aberrant inhibition through horizontal connections in low-level visual areas in ASD, whereas feedback mechanisms are intact in these patients. We would like to note that this inference is in agreement with the notion of Bertone and colleagues (Bertone et al., 2005) that lateral connectivity is atypical in ASD, which they based on the findings of impaired orientation discrimination of textured stimuli. It is the first time that direct evidence for a neural mechanism related to atypical visual perception has been found in ASD. Below we will indicate how the findings on lateral inhibition relate to neuropathology and neurochemistry research, and how malfunctioning of horizontal connections might be related to aberrant visual perception in ASD. 4.4.1 Horizontal connections in ASD An impairment in lateral inhibition. Interestingly, an imbalance between excitation and inhibition in neural circuits in ASD has been suggested as a consequence of an imbalance between the amount of excitatory and inhibitory neurotransmitters. Hussman (Hussman, 2001) proposed that the imbalance could be due to either increased glutamergic signaling, leading to enhanced excitation, or to malfunctioning of the inhibitory neurotransmitter gamma-aminobutyric acid (GABA), leading to a reduction in inhibition. There are two arguments for this idea. First, pathology relating to GABA receptors emerges as a common factor in several suspected etiologies of autism. Second, both disinhibition of the GABAergic influence and excessive stimulation of non-NMDA glutamate receptors, generate pathology which mirrors that observed in autism (Hussman, 2001). This idea of an enhanced excitation to inhibition ratio is supported by others (Cline, 2005; Rubenstein & Merzenich, 2003) and Collins et al. (Collins et al., 2006) showed, by studying GABA receptor subunit genes, that indeed the GABAergic system is involved in the etiology of autism. A second line of evidence for disturbed lateral inhibition through horizontal connections comes from studies on the neuropathology of ASD. Casanova et al. have shown that the minicolumn organization in several areas of the cerebral cortex (including Brodmann areas 3, 4, 9, 17, 21, 22) of patients with ASD is altered (Casanova, Buxhoeveden, & Gomez, 2003; Casanova, Buxhoeveden, Switala, & Roy,

Chapter 4
86
2002; Casanova, van Kooten, Switala, van Engeland, Heinsen, Steinbusch, Hof, & Schmitz, 2006; Casanova, van Kooten, Switala, van Engeland, Heinsen, Steinbusch, Hof, Trippe et al., 2006). Minicolumns are functional units of the brain that organize about 80 to 100 neurons with a common set of functional properties in cortical space. Several minicolumns (60 to 80) in turn combine into a hypercolumn, as defined by Hubel and Wiesel (Hubel & Wiesel, 1977). The minicolumnar aberrancies in ASD include that neurons inside a minicolumn are more widely spaced, minicolumns are smaller and, given that the cerebral cortex is not smaller in ASD patients, the authors inferred that there must be a larger total number of minicolumns filling the cortical space. In addition, in Brodmann areas 9, 17, 21 and 22, they showed that the minicolumns contained less neuropil space. Neuropil consists of unmyelinated fibers, in part from inhibitory projections of double-bouquet interneurons. Casanova et al. (Casanova et al., 2002; Casanova et al., 2003) hypothesize that the altered structural organization of minicolumns will lead to the disturbance of the flow of information between minicolumns, diminished lateral inhibition, as well as an enhanced rate of epilepsy-seizures. Around puberty one third of the people with ASD will have suffered at least two unprovoked seizures (depending on the strictness of the diagnosis and on the level of mental retardation, Ballaban-Gil & Tuchman, 2000). Both lines of research indicate that inhibition through horizontal connections is impaired in ASD, in line with our own findings. While we imply that impaired lateral inhibition is related to atypical visual perception in ASD, altered organization of minicolumns has been found in several different brain areas, including the prefrontal cortex, and GABAergic inhibition plays a role throughout the brain. Therefore we suggest that aberrant lateral inhibition could be a more general neurobiological deficit in ASD (see also Hussman, 2001), not only specific to visual perception. It would be a promising direction for future research to study the functional integrity of these inhibitory interactions more thoroughly to see how they are related to other behavioral symptoms of ASD. Malfunctioning of horizontal connections. As already indicated in the introduction, besides the role of horizontal connections in the detection of figure boundaries through lateral inhibition, horizontal interactions also play an important role in a different aspect of perception, namely grouping or binding (Polat, 1999; Roelfsema, 2006). Accordingly, malfunctioning of horizontal connections could also provide an explanation for other features of atypical visual perception in ASD, namely impaired Gestalt processing and grouping (Brosnan et al., 2004), as well as superior performance on the EFT (see introduction, De Jonge et al., 2006; Jolliffe & Baron-Cohen, 1997; Ropar & Mitchell, 2001).

Atypical low-level visual processing
87
4.4.2 Enhanced processing at occipito-parietal sites: a compensation mechanism? When we investigated the frame – homogeneous signal after the time window related to boundary detection only, we found an enhanced positivity in the patient group compared to controls, around 225 ms at occipito-parietal sides. This suggests that, probably due to diminished lateral inhibition through horizontal connections at early stages, the brain puts more effort in the correct identification of a stimulus at subsequent analysis stages, eventually resulting in normal recurrent activity back to early visual areas. At higher level areas the orientation discontinuity that is present in the scene is probably detected by neurons with larger receptive fields (Roelfsema et al., 2002). In the ASD subjects processing by these neurons apparently is enhanced compared to controls, which is supported by the observation that the difference between ASD and control subjects depends on border width: it is strongest for larger borders. We interpret this finding as a compensation mechanism. Interestingly, Belmonte and colleagues showed with fMRI compensatory processing in the posterior intraparietal sulcus in people with ASD during a visual selective attention task (Belmonte & Yurgelun-Todd, 2003). The combination of disrupted early processing with compensation at higher levels may be a general feature of the physiology of perception in ASD. 4.4.3 Conclusion We have shown a fundamental visual processing aberrancy in ASD, which is probably caused by impaired interactions through horizontal connections in lower visual areas. This aberrancy can be compensated later in time in higher cortical areas, but the exact mechanism or implication of this compensation is not entirely clear. Interestingly, a deficit in neuronal interactions within cortical areas in ASD has been suggested before, stemming from different lines of research such as neuropathology and neurochemistry research, and is apparent in different brain areas besides the occipital cortex. Possibly, malfunctioning of horizontal connections is a more general neurobiological deficit underlying several symptoms of ASD.

Chapter 4
88
4.5 References Angelucci, A., & Bullier, J. (2003). Reaching beyond the classical receptive field of VI
neurons: horizontal or feedback axons? Journal of Physiology-Paris, 97(2-3), 141-154.
Ballaban-Gil, K., & Tuchman, R. (2000). Epilepsy and epileptiform EEG: Association with autism and language disorders. Mental Retardation and Developmental Disabilities Research Reviews, 6(4), 300-308.
Belmonte, M. K., & Yurgelun-Todd, D. A. (2003). Functional anatomy of impaired selective attention and compensatory processing in autism. Cognitive Brain Research, 17(3), 651-664.
Benjamini, Y., & Hochberg, Y. (1995). Controlling the False Discovery Rate - a Practical and Powerful Approach to Multiple Testing. Journal of the Royal Statistical Society Series B-Methodological, 57(1), 289-300.
Bertone, A., Mottron, L., Jelenic, P., & Faubert, J. (2005). Enhanced and diminished visuo-spatial information processing in autism depends on stimulus complexity. Brain, 128, 2430-2441.
Brosnan, M. J., Scott, F. J., Fox, S., & Pye, J. (2004). Gestalt processing in autism: failure to process perceptual relationships and the implications for contextual understanding. Journal of child psychology and psychiatry, and allied disciplines, 45(3), 459-469.
Caputo, G., & Casco, C. (1999). A visual evoked potential correlate of global figure-ground segmentation. Vision Research, 39(9), 1597-1610.
Casanova, M. F., Buxhoeveden, D., & Gomez, J. (2003). Disruption in the inhibitory architecture of the cell minicolumn: Implications for autisim. Neuroscientist, 9(6), 496-507.
Casanova, M. F., Buxhoeveden, D. P., Switala, A. E., & Roy, E. (2002). Minicolumnar pathology in autism. Neurology, 58(3), 428-432.
Casanova, M. F., van Kooten, I., Switala, A. E., van Engeland, H., Heinsen, H., Steinbusch, H. W. M., et al. (2006). Abnormalities of cortical minicolumnar organization in the prefrontal lobes of autistic patients. Clinical Neuroscience Research, 6(3-4), 127-133.
Casanova, M. F., van Kooten, I. A. J., Switala, A. E., van Engeland, H., Heinsen, H., Steinbusch, H. W. M., et al. (2006). Minicolumnar abnormalities in autism. Acta Neuropathologica, 112(3), 287-303.
Cline, H. (2005). Synaptogenesis: A balancing act between excitation and inhibition. Current Biology, 15(6), R203-R205.
Collins, A. L., Ma, D. Q., Whitehead, P. L., Martin, E. R., Wright, H. H., Abramson, R. K., et al. (2006). Investigation of autism and GABA receptor subunit genes in multiple ethnic groups. Neurogenetics, 7(3), 167-174.

Atypical low-level visual processing
89
Dakin, S., & Frith, U. (2005). Vagaries of visual perception in autism. Neuron, 48(3), 497-507.
De Jonge, M. V., Kemner, C., & van Engeland, H. (2006). Superior disembedding performance of high-functioning individuals with autism spectrum disorders and their parents: The need for subtle measures. Journal of Autism and Developmental Disorders, 36(5), 677-683.
Frith, C. (2004). Is autism a disconnection disorder? Lancet Neurology, 3(10), 577-577. Gilbert, C. D., & Wiesel, T. N. (1989). Columnar Specificity of Intrinsic Horizontal and
Corticocortical Connections in Cat Visual-Cortex. Journal of Neuroscience, 9(7), 2432-2442.
Gratton, G., Coles, M. G. H., & Donchin, E. (1983). A new method for off-line removal of ocular artifact. Electroencephalography and Clinical Neurophysiology, 55, 468-484.
Guo, K., Benson, P. J., & Blakemore, C. (2004). Pattern motion is present in V1 of awake but not anaesthetized monkeys. European Journal of Neuroscience, 19(4), 1055-1066.
Gustafsson, L. (1997). Inadequate cortical feature maps: A neural circuit theory of autism. Biological Psychiatry, 42(12), 1138-1147.
Happé, F., & Frith, U. (2006). The weak coherence account: Detail-focused cognitive style in autism spectrum disorders. Journal of Autism and Developmental Disorders, 36(1), 5-25.
Hochstein, S., & Ahissar, M. (2002). View from the top: Hierarchies and reverse hierarchies in the visual system. Neuron, 36(5), 791-804.
Hubel, D. H., & Wiesel, T. N. (1959). Receptive fields of single neurons in cat's striate cortex. Journal of Physiology, London, 148, 574-591.
Hubel, D. H., & Wiesel, T. N. (1977). Functional architecture of macaque monkey visual cortex. Proceedings of the Royal Society of London, 198, 1-59.
Hupe, J. M., James, A. C., Payne, B. R., Lomber, S. G., Girard, P., & Bullier, J. (1998). Cortical feedback improves discrimination between figure and background by V1, V2 and V3 neurons. Nature, 394(6695), 784-787.
Hussman, J. P. (2001). Suppressed GABAergic inhibition as a common factor in suspected etiologies of autism. Journal of Autism and Developmental Disorders, 31(2), 247-248.
Jolliffe, T., & Baron-Cohen, S. (1997). Are people with autism and Asperger syndrome faster than normal on the embedded figures test? Journal of Child Psychology and Psychiatry, and Allied Disciplines, 38(5), 527-534.
Knierim, J. J., & Vanessen, D. C. (1992). Neuronal Responses to Static Texture Patterns in Area-V1 of the Alert Macaque Monkey. Journal of Neurophysiology, 67(4), 961-980.
Chapter 4
90
Lamme, V. A. F. (1995). The Neurophysiology of Figure Ground Segregation in Primary Visual-Cortex. Journal of Neuroscience, 15(2), 1605-1615.
Lamme, V. A. F., Rodriguez-Rodriguez, V., & Spekreijse, H. (1999). Separate processing dynamics for texture elements, boundaries and surfaces in primary visual cortex of the macaque monkey. Cerebral Cortex, 9(4), 406-413.
Lamme, V. A. F., & Roelfsema, P. R. (2000). The distinct modes of vision offered by feedforward and recurrent processing. Trends in Neurosciences, 23(11), 571-579.
Lamme, V. A. F., Super, H., & Spekreijse, H. (1998). Feedforward, horizontal, and feedback processing in the visual cortex. Current Opinion in Neurobiology, 8(4), 529-535.
Lamme, V. A. F., Zipser, K., & Spekreijse, H. (1998). Figure-ground activity in primary visual cortex is suppressed by anesthesia. Proceedings of the National Academy of Sciences of the United States of America, 95(6), 3263-3268.
Lee, T. S., Mumford, D., Romero, R., & Lamme, V. A. F. (1998). The role of the primary visual cortex in higher level vision. Vision Research, 38(15-16), 2429-2454.
Lord, C., Rutter, M., Goode, S., Heemsbergen, J., Jordan, H., Mawhood, L., et al. (1989). Autism diagnostic observation schedule: a standardized observation of communicative and social behavior. Journal of Autism and Developmental Disorders, 19(2), 185-212.
Lord, C., Rutter, M., & Le Couteur, A. (1994). Autism Diagnostic Interview-Revised: a revised version of a diagnostic interview for caregivers of individuals with possible pervasive developmental disorders. Journal of Autism and Developmental Disorders, 24(5), 659-685.
Malach, R., Amir, Y., Harel, M., & Grinvald, A. (1993). Relationship between Intrinsic Connections and Functional Architecture Revealed by Optical Imaging and in-Vivo Targeted Biocytin Injections in Primate Striate Cortex. Proceedings of the National Academy of Sciences of the United States of America, 90(22), 10469-10473.
Nunez, P., & Srinivasan, R. (2006). Electric Fields of the Brain. Oxford: Oxford University Press.
Perrin, F., Pernier, J., Bertrand, O., & Echallier, J. F. (1989). Spherical Splines for Scalp Potential and Current-Density Mapping. Electroencephalography and Clinical Neurophysiology, 72(2), 184-187.
Polat, U. (1999). Functional architecture of long-range perceptual interactions. Spatial Vision, 12(2), 143-162.
Roelfsema, P. R. (2006). Cortical algorithms for perceptual grouping. Annual Review of Neuroscience, 29, 203-227.

Atypical low-level visual processing
91
Roelfsema, P. R., Lamme, V. A. F., Spekreijse, H., & Bosch, H. (2002). Figure-ground segregation in a recurrent network architecture. Journal of Cognitive Neuroscience, 14(4), 525-537.
Ropar, D., & Mitchell, P. (2001). Susceptibility to illusions and performance on visuospatial tasks in individuals with autism. Journal of Child Psychology and Psychiatry, and Allied Disciplines, 42(4), 539-549.
Rubenstein, J. L. R., & Merzenich, M. M. (2003). Model of autism: increased ratio of excitation/inhibition in key neural systems. Genes Brain and Behavior, 2(5), 255-267.
Stettler, D. D., Das, A., Bennett, J., & Gilbert, C. D. (2002). Lateral connectivity and contextual interactions in macaque primary visual cortex. Neuron, 36(4), 739-750.
Super, H., Spekreijse, H., & Lamme, V. A. F. (2001). Two distinct modes of sensory processing observed in monkey primary visual cortex (V1). Nature Neuroscience, 4(3), 304-310.
Zipser, K., Lamme, V. A. F., & Schiller, P. H. (1996). Contextual modulation in primary visual cortex. Journal of Neuroscience, 16(22), 7376-7389.

Chapter 4
92

Enhanced local attention
93
Chapter 5
Enhanced local attention compensates atypical low-level visual perception in Autism Spectrum Disorder (ASD) In the current fMRI study we tried to provide support for earlier electro-encephalography (ERP) findings on an aberrant low-level visual mechanism in ASD and to localize the origin of atypical brain processes in ASD (Vandenbroucke, Scholte, Engeland, Lamme, & Kemner, in press). ASD and control subjects were compared on a texture segregation task. By using specific stimulus contrast, BOLD signals related to figure boundary detection and the segregation of a texture surface from the background could be investigated. Besides an aberrancy in boundary detection in ASD, we could localize enhanced activation in the angular gyrus. The activation pattern in this region was clearly different in both groups: it increased with increasing stimulus difficulty in the ASD group while it decreased in the control group. Based on the literature we suggest this difference reflects respectively local vs. global attention. The location and pattern of activation is comparable to findings of our previous ERP study and we conjecture that the combination of disrupted early processing with compensation at higher levels may be a general feature of the physiology of perception in ASD. In addition, the fMRI data showed that the groups activated distinct frontal brain areas, possibly reflecting a difference in strategy between the groups on the texture discrimination task. Since the latter results were not found within the 400 ms time interval as investigated in the previous ERP study, we cautiously suggest that differences in strategy are a result of aberrant lower level visual processing, and not a cause. Vandenbroucke, M.W.G., Scholte, H.S., van Engeland, H., Lamme, V.A.F., Kemner, C. (in preparation). Enhanced local attention compensates atypical low-level visual perception in Autism Spectrum Disorder (ASD).

Chapter 5
94
5.1 Introduction Autism Spectrum Disorder is a neurodevelopmental disorder characterized by impairments in communication and social interaction, and stereotyped and repetitive behavior. There is a growing body of evidence that besides these higher-level, cognitive impairments, ASD also encompasses pure perceptual aberrancies such as enhanced visual detail perception and possibly also aberrant grouping (Happé & Frith, 2006). The question arises whether this perceptual aberrancy is due to higher-level deficits that influence low-level functioning or is due to a fundamental functional aberration in the visual cortex? More and more researchers argue for the latter hypothesis. For instance, Plaisted and colleagues discuss that due to atypical perceptual processes the salience of visual features is enhanced in ASD, which has been demonstrated by superior performance in visual search tasks (O'Riordan & Plaisted, 2001; Plaisted, O'Riordan, & Baron-Cohen, 1998; see also Kemner, van Ewijk, van Engeland, & Hooge, 2007). Mottron and colleagues have argued for enhanced low-level visual processing in their ‘Enhanced Perceptual Functioning’ theory on ASD (Mottron, Dawson, Soulieres, Hubert, & Burack, 2006). The authors suggest that there is a “skewing” of brain functioning towards posterior regions of the (visual) brain. In a recent electro-encephalography (EEG) study we investigated visual feedforward, horizontal and feedback processing as a possible neural cause for atypical visual perception in ASD (Vandenbroucke et al., in press). It is known from monkey research that these visual mechanisms are fundamental to visual perception (Bullier, 2001), e.g. object categorization and detail perception (Hochstein & Ahissar, 2002), as well as the correct interpretation of a visual scene when segregating objects from each other and the background (Lee, Mumford, Romero, & Lamme, 1998; Super, Spekreijse, & Lamme, 2001). In our previous study, we used carefully designed textured stimuli composed of line elements with specific orientations (see Fig. 1A). By employing particular stimulus contrasts we could selectively single out EEG activity related to visual horizontal and feedback processing (for an extensive explanation of the stimuli see Vandenbroucke et al., in press). Interestingly, we found evidence for a diminished early occipital event related response (ERP) in ASD around 120 ms after stimulus presentation. Based on a neural network model (Roelfsema et al., 2002) and the stimulus contrasts employed, we associated these findings with malfunctioning of horizontal connections in early visual areas. Following in time (225 ms), the ASD group showed enhanced activity at occipital-parietal sites that increased with increasing stimulus difficulty. We interpreted this finding as a compensation for the earlier deficiency, specifically because subsequent ERP responses around 300 ms, again at central occipital sites, were normal compared to controls. This latter finding was associated with intact recurrent processing in ASD.

Enhanced local attention
95
As ERP data do not allow precise localization, the present fMRI study was done to determine the origin of atypical brain processes in ASD. The same group of high functioning young adults with ASD and age- and IQ-matched controls were studied as in the ERP study. We should note that the order of EEG and fMRI measurements was counterbalanced over subjects with 50% of the subjects first participating in the fMRI study. While BOLD fMRI was measured subjects performed a discrimination task with stack, frame and homogeneous stimuli, composed of short black line segments on a white background (see Fig. 1A). In Vandenbroucke et al. (Vandenbroucke et al., in press) we thoroughly explain the theoretical background for using these stimuli in the study of horizontal and feedback processing. Here, we would like to refer to the methods section. Based on our previous ERP findings we expected to find 1) diminished brain activity in early visual areas in ASD, associated with processing through horizontal connections, 2) enhanced processing at occipital-parietal sites that was related to stimulus difficulty in ASD compared to controls (possibly a compensation mechanism) and 3) normal recurrent brain activity in early visual areas. Hypothesis 1 and 3 will be examined using separate stimulus contrasts making both hypotheses testable with fMRI. In addition, a whole brain analysis comparing ASD and control subjects should reveal if there are other differences in higher-level brain functioning between ASD and control subjects that might explain atypical visual perception. 5.2 Methods 5.2.1 Subjects Eighteen control subjects (3 females) and 12 subjects (2 females) with Autism Spectrum Disorder (ASD) participated in this study (five with a diagnosis of Autistic syndrome, seven with a diagnosis of Asperger Syndrome), aged between 16 years and 4 months and 28 years and 10 months. There were no age or IQ differences between the groups (see Table 1) and all subjects had normal or corrected to normal vision. The diagnostic evaluation included a psychiatric observation and a review of prior records (developmental history, child psychiatric and psychological observations and tests). ASD was diagnosed by a child psychiatrist, using the DSM-IV criteria. The parents of the subjects with ASD were administered the Autism Diagnostic Interview Revised (ADI-R, Lord et al., 1994) and the subjects with ASD were administered the Autism Diagnostic Observation Schedule General (ADOS-G, Lord et al., 1989), both by a trained rater. Eleven subjects met ADI-R criteria for autism or autism spectrum disorder; one subject did not meet criteria for Stereotyped Behavior (although this subject did meet ADOS-G criteria). All subjects, but one (who did meet ADI-R criteria), met the full ADOS-G criteria for autism or autism spectrum disorder. The subjects were medication free except for one (who used 20 mg Seroxat and 3 mg Risperdal per day)

Chapter 5
96
and had no significant neurological history. All subjects received a money reward for their participation. The study was approved by the medical ethics committee of the University Medical Centre Utrecht and subjects gave written informed consent prior to participation. Table 1. IQ was measured using the full WAIS-III for subjects with ASD. A short version of the WAIS-III was used to determine IQ for the control subjects. 5.2.2 Stimuli, conditions and procedure Subjects performed a discrimination task, during which the BOLD signal was measured, with randomly presented ‘stack’, ‘frame’ and ‘homogenous’ stimuli (see Fig. 1A) using Presentation (Neurobehavioral Systems Inc., San Francisco). The frame stimulus consists of an ‘empty’ frame (border) on a homogeneous background. In case of the stack stimulus the inside of the frame is filled with lines of a third orientation. These three stimuli contain the same elementary features, i.e. black line segments (0.9 cd/m2, length = 0.36°, width = 0.02°, average density = 4.2 line segments per degree) with specific orientations (22.5, 67.5, 112.5, 157.5 degrees), projected randomly on a white background (103 cd/m2). The line orientation at each edge of the texture border of frame and stack stimuli was always at 45° with that of the background and at 45° with that of the region enclosed by the border. In frame stimuli, the line orientation of the enclosed region was the same as that of the background. In stack stimuli the line orientation of the enclosed region was at 90° with that of the background, leading to the percept of stacking of two squares on a background. By using, in different exemplars of each stimulus, all orientations for background, frame, or the region within the frame, these low level features can be fully balanced over trials. In this way all three stimuli will, on average, elicit identical responses from orientation selective mechanisms, i.e. neurons in early visual areas in the feedforward sweep (Hubel and Wiesel, 1959). Accordingly, when contrasting the BOLD signal of the frame and homogeneous (see Fig. 1B) stimulus the resulting signal is mainly related to the detection of orientation discontinuities, i.e. boundaries (and some surface segregation; the detection of line elements is subtracted out). Boundary detection is established through horizontal interactions between neurons within the same visual area (Gilbert & Wiesel, 1989; Malach, Amir, Harel, & Grinvald, 1993; Stettler, Das, Bennett, & Gilbert, 2002). Stacks and frames contain the same amount and strength of orientation boundaries. The only difference between these stimuli is that stacks contain an extra texture defined surface,
Age in years (SD) TIQ (SD)
Controls (N = 18) 22.5 (2.5) 117.5 (9.6)
ASD (N = 12) 21.5 (4.1) 119.8 (11.2)

Enhanced local attention
97
which results in the percept of the stacking of two squares. When contrasting the BOLD signal of the stack and frame stimulus (see Fig. 1B) the resulting signal is related to surface segregation (the detection of line elements and orientation boundaries is subtracted out). If in accordance with previous single unit and EEG studies, this extra surface can be expected to elicit a relatively enhanced texture segregation signal in lower occipital areas, arising from feedback from higher cortical areas (Angelucci & Bullier, 2003; Caputo & Casco, 1999; Lamme, 1995; Zipser, Lamme, & Schiller, 1996). To establish a parametric design, the difficulty level of the discrimination task was manipulated by varying the thickness of the borders of frame and stack stimuli (see Figure 1B), i.e. 0.32, 0.81 or 1.29 degrees. The inner square size of the stack and frame stimuli was always 1.93°, resulting in a total stimulus size of 2.57, 3.55 or 4.51 degrees, depending on the border width. The specific expectations in the current fMRI study are based on the previous ERP findings (Vandenbroucke et al., in press). We had found that 1) boundary detection (established through horizontal connections) was impaired in the ASD group as reflected by lower performance on frame stimuli and a diminished brain response for the ‘frame – homogeneous’ contrast, 2) the frame - homogeneous contrast elicited an enhanced response at occipital-parietal sites in the ASD group, which increased with increasing border width of frame stimuli (i.e. the compensation mechanism), 3) increasing the border width led to a decrease in the brain response to surface segregation (i.e. feedback, revealed by the ‘stack – frame’ contrast) and it led to a decrease in performance, in both groups. The latter effect reflects an increase in the task difficulty (it was probably more difficult to see the inside of the frame as continuous with the background). With the current fMRI data we will establish the anatomical origin of these visual mechanisms as well as the origin of perceptual aberrancies in ASD. We should note that as the ‘frame – homogenous’ contrast includes signals related to texture boundary detection as well as surface segregation signals (see Fig. 1C), the relative contribution of the latter will be larger with larger border width. In our ERP study and in earlier single unit studies, boundary detection and surface segregation could be separated in time. In contrast, in the current fMRI data these signals will probably overlap in space. For this reason we will only consider the ‘frame – homogeneous’ contrast for frames with thin borders to draw conclusions about boundary detection, as in this case the amount of figure surface is smallest. During the experiment subjects fixated a red dot (0.24°) in the centre of the screen which was present throughout the whole trial. A trial started with the presentation of a stack or frame stimulus, at an unpredictable location in one of the quadrants of the screen (eccentricity = 1.7°), or a homogeneous stimulus, for 267 ms. The stimulus was immediately followed by a mask (1475 ms), consisting of the same line elements but now in random orientations. Subjects had to indicate with a response button whether they had seen a stack, a frame or a homogeneous background. When

Chapter 5
98
subjects pressed a response button the fixation dot changed from red to green. The next trial was announced 267 ms beforehand by a change in color of the fixation dot back to red. Responses had to be as fast as possible and before the fixation dot changed back to red. Blank trials were introduced to prevent the BOLD signal from saturating and enabling a more efficient estimate of the BOLD response. In a blank trial the mask with the random line orientations and the red fixation dot appeared on the screen for the duration of a trial (2009 ms). Buttons for stack and homogeneous stimuli were always pressed by the index and middle finger of one hand (left or right, counterbalanced over subjects) and the button for frame stimuli was pressed by the index finger of the other hand. Then, four runs of trials with 16 stimuli per level of border width for frame and stack stimuli, and 16 homogeneous stimuli were presented to the subjects. Each run lasted about 8 minutes. 5.2.3 Behavioral data analysis Percentage correct and reaction times were separately analyzed for stack and frame stimuli using a repeated measures ANOVA with Border Width (3 levels, see Figure 1B) as within subject factor and Group (patient/control) as a between subjects factor. Since the homogenous stimuli could not be parametrically manipulated, percentage correct and reaction time data for this stimulus were compared between groups using a one-way ANOVA. 5.2.4 MRI acquisition A three dimensional T1 anatomical scan was acquired in a single scanning session (T1 turbo field echo, 182 coronal slices, flip angle = 8°, TE = 4.6 ms, TR = 9.7 ms, slice thickness = 1.2 mm, FOV = 256 x 256 mm, matrix = 256 x 256 mm), together with the fMRI measurement, on a 3 T scanner (Phillips) using a standard head coil. The BOLD signal was measured with a T2* gradient Echo Planar Imaging sequence (TR = 2.3 s, TE = 28 ms, 35 slices, slice thickness = 3.3 mm, FOV = 220 x 220 mm, in place resolution = 96 x 96, duration = 480 s). We immobilized the subject’s head using foam pads to reduce motion artifacts and used earplugs to moderate scanner noise. 5.2.5 fMRI data analysis and stimulus contrasts All calculations and image manipulations were performed with FSL (FMRIB’s Software Library, www.fmrib.ox.ac.uk/fsl) and Matlab (The Mathworks Inc., Natick, MA, USA). Using FEAT (fMRI Expert Analysis Tool, Version 5.63) the functional images were motion corrected using MCFLIRT (Jenkinson, Bannister, Brady, & Smith, 2002; Lee et al., 2007), slice-time aligned, non-brain was removed using BET, the data were spatially smoothed using a Gaussian kernel (FWHM 5 mm) and high-pass temporally filtered with a Gaussian filter (sigma = 25 s). Time-series statistical analysis

Enhanced local attention
99
was carried out using FILM with local autocorrelation correction (Woolrich, Ripley, Brady, & Smith, 2001). Model parameters were estimated for all stack and frame stimuli with different border widths (3 levels, see Figure 1B), presented in the separate quadrants, as well as for the homogeneous stimuli. The functional images were aligned to the structural image acquired at the start of the session and transformed, on the basis of this structural image, to MNI space, using FLIRT (Jenkinson et al., 2002; Jenkinson & Smith, 2001). Next, a higher-level analysis was carried out using a fixed effects model (Beckmann, Jenkinson, & Smith, 2003; Woolrich, Behrens, Beckmann, Jenkinson, & Smith, 2004) to pool the four runs per subject and to determine specific stimulus contrasts. Due to technical reasons and motion artifacts some individual subject runs were excluded from further analyses, resulting in an average of 3.7 runs per subject. Contrasts between stack, frame and homogeneous stimuli were made separately for each quadrant since stimulation of different parts of the visual field will result in different brain activation patterns and contributes to the variance in the data. Finally, a higher-level analysis was carried out using FLAME stage 1 (FMRIB’s Local Analysis of Mixed Effects, Beckmann et al., 2003; Woolrich et al., 2004). Z statistic images were thresholded using clusters determined by z > 3.1 and a (corrected) cluster significance threshold of p = .05. In this final step we calculated within and between group effects, both separately and collapsed over quadrants, on the stimulus contrasts determined at the previous level. First, we defined occipital regions of interest (ROIs) based on the ‘(stack + frame) – homogeneous’ contrast according to the clusters of activation falling within Brodmann areas 17 18 or 19, in response to the four different quadrants where the stack and frame stimuli had been presented. The ‘(stack + frame) – homogeneous’ contrast will be referred to as the figure-ground contrast; it should reveal brain activation related to figure-ground segregation, independent of the detection of line segments (see above). Figure-ground segregation here refers to both boundary detection and surface segregation (Caputo & Casco, 1999; Lamme, Rodriguez-Rodriguez, & Spekreijse, 1999). For definition of the ROIs we collapsed the data of both groups and weighted the control group data for an equal contribution of each group. These ROIs, based on data of both groups for the figure-ground contrast, allowed us to validly analyze boundary detection and surface segregation in occipital regions and to compare these mechanisms between the groups. We extracted from the occipital ROIs the individual subject data for the ‘frame – homogeneous’ and ‘stack – frame’ contrasts and we did the following analyses in SPSS (SPSS Inc., Chicago, IL, USA): 1) We tested if the ‘frame – homogeneous’ signal indeed increased with increasing border width as would be expected if this contrast reflects surface segregation in addition to boundary detection (see above). To this end we did a repeated measures ANOVA with quadrant and level of border width as within subjects factors and group as between subjects factor. 2) We compared the brain response to boundary detection, revealed by the ‘frame –

Chapter 5
100
homogeneous’ contrast for thin borders, between the ASD and control group. This was done using a one-way ANOVA with group as between subjects factor. 3) We tested if the manipulation of surface segregation, revealed by the ‘stack – frame’ contrast for all levels of border width, had succeeded: does the corresponding brain signal decrease with increasing border width? This, and any differences in this respect between the groups, was tested with a repeated measures ANOVA with level of border width and quadrant as within subjects factor and group as between subjects factor. We also compared the two groups on the ‘(stack + frame) – homogeneous’ contrast in a whole brain analysis to see if there might be higher-order differences between the groups (besides differences in occipital regions). This whole brain analysis will reveal the brain regions where the control group demonstrated more activity than the ASD group and vice versa, specifically for the detection of a figure (stack or frame) in comparison to a homogeneous background. This figure-ground contrast allows us to define ROIs based on the clusters of activation falling within one or more Brodmann areas, without pre-selecting the data according to our expectations. We expected to find an increase in activation with increasing border width in the ASD group compared to controls specifically for the ´frame – homogeneous´ contrast in occipital-parietal regions, reflecting the same compensation mechanism as in our ERP study. Accordingly, from the whole brain ROIs we extracted the individual subject data for the ‘frame – homogeneous’ contrast and analyze these in SPSS to test if (and where) we would find an interaction between group and level of border width. We used a repeated measures ANOVA, with border width as within subjects factor and group as between subjects factor.
5.3 Results 5.3.1 Behavioral data The behavioral results obtained during the fMRI measurement are shown in Figure 1D. Performance decreased with increasing border width both for frames (F(2,56) = 20.18, p = .000) and for stacks (F(2,56) = 5.15, p = .009). Subjects with ASD scored lower than controls on homogeneous stimuli (F(1,28) = 7.74, p = .010) and marginally lower on frame stimuli (F(1,28) = 3.06, p = .091), but performance was the same in both groups for stack stimuli (F(1,28) = .12, p = .734). There were no interactions between group and border width for either stacks or frames.
The decrease in performance with increasing border width indicates that the manipulation of the stimuli had succeeded and that the stimuli were more difficult to identify (it was probably more difficult to see the inside of the frame as continuous with the background).

Enhanced local attention
101
Figure 1. A) Example stimuli. The figure stimuli (stack/frame) were presented in one of the quadrants of the computer screen. B) The subtractions that were made to isolate activity related to boundary detection and surface segregation. Different gray levels represent different line orientations. C) Manipulation of the stack and frame stimuli, i.e. increasing the border width. Different grey levels represent different line orientations. D) Performance data of the three-alternative forced choice task between homogeneous (‘Hom’) and stack and frame stimuli with different border widths. Error bars represent the standard error of the mean.

Chapter 5
102
Although we did not find large differences between the groups in the data presented in this study, it is conceivable that brain signals will differ, as we saw in our previous ERP study. In addition, the data presented here are from either a second or third measurement (counterbalanced over subjects) while during the first measurement performance scores were considerably lower for ASD subjects compared to controls (Vandenbroucke, Scholte, Engeland, Lamme, & Kemner, 2007). There were no overall differences between the groups for either frames (F(1,28) = 1.30, p = .264) or stacks (F(1,28) = .30, p = .590). However, there was an interaction between group and level of border width for frame stimuli (F(2,56) = 3.22, p = .048) which indicated that in the control group reaction times increased with increasing border width, while there was no such increase in the ASD group (reaction times remained the same, see Fig. 1E). Reaction times also increased for stack stimuli with increasing border width which was similar in both groups (F(2,56) = .137, p = .872, see Fig. 1E). Finally, subjects with ASD were slower on homogeneous stimuli (ASD: 769, Controls: 681, F(1,28) = 9.41, p = .005, not shown). 5.3.2 fMRI results – occipital ROIs Occipital ROIs were defined based on the figure-ground contrast, separately for the four visual quadrants where the stack and frame stimuli were presented. In these ROIs the ‘frame – homogeneous’ contrast revealed an effect of quadrant (F(3,168) = 3.52, p = .019): the upper occipital quadrants (i.e. stimulus presented in the lower visual quadrants) gave a stronger response than the lower occipital quadrants (confirmed by a post-hoc analysis, t = 3.62, p = .001). There were no differences between stimulation of the left or right hemifield. Interestingly, similar effects were present in our previous ERP data. The effect of quadrant did not differ between the groups (i.e. there was no interaction of quadrant x group, F(3,168) = .38, p = .767). The analyses also revealed that with increasing border width, activity on the ‘frame – homogeneous’ contrast increased (F(2,56) = 7.97, p = .001). This finding confirms the influence of surface segregation in this stimulus contrast (see methods). For a comparison between the groups on boundary detection, we will therefore only consider the thin borders, where the influence of surface is least pronounced. The ‘frame - homogeneous’ contrast for border width one, i.e. thin borders (see Fig. 1C), did not elicit a significant difference between the groups (F(1,28) = 1.00, p = .326). However, we noticed that while this contrast elicited a brain response well above zero in the control group (t = 3.06, p = .007), this was not so in the ASD group (t = .94, p = .368, see Fig. 2). We would like to note in addition that the difference between the groups was larger for the upper quadrants (F(1,28) = 2.08, p = .160), which gave a stronger response in general (see above).

Enhanced local attention
103
Figure 2. A) To compare the groups on processing of texture boundaries, the contrast ‘frame – homogeneous’ was calculated for frames with thin borders (level 1, see Fig. 1C). Legend for B) Percent BOLD signal change in the occipital ROIs for the ‘frame – homogeneous’ contrast, border width one (see Figure 1C), separately for the control and ASD group. * BOLD signal change different from zero, p < .05. Error bars represent the standard error of the mean. Where the frame-homogenous contrast primarily signals brain mechanisms related to texture boundary detection, the stack – frame contrast is exclusively coming from mechanisms that signal the difference in surface layout between the two stimuli (as texture elements and boundaries are identical, see methods). For the ‘stack – frame’ contrast, increasing border width led to a decreasing BOLD signal, although not significantly (F(2,56) = 1.166, p = .319). In Figure 3 the percent BOLD change is shown, separately for the two groups. Notably, the contrast was negative for border width two and three, indicating that frames elicited a larger brain response than stacks. Although the effect of border width was most pronounced in the ASD group, differences between the groups were not significant (F(1,28) = .33, p = .571), nor was there an interaction between group and border width (F(2,56) = .93, p = .402). We saw in the behavioral data that the manipulation of border width had succeeded: with increasing border width the ability to discriminate between stacks and frames decreased (Fig. 1D). Although not significant, a decrease in the subtraction signal between stack and frame stimuli with increasing border width, i.e. a decrease in the difference in surface segregation, supports these behavioral data and is in agreement with our expectations.

Chapter 5
104
Figure 3. A) To compare the groups on processing of figure surfaces, the contrast ‘stack – frame’ was calculated for all three levels of border width (see Fig. 1C). Legend for B) Percent BOLD signal change in the occipital ROIs for the ‘stack –frame’ contrast with increasing border width (see Figure 1C), separately for the control and ASD group. As expected, the BOLD signal decreased with increasing border width, although not significantly (see text). There were no differences between the groups. Error bars represent the standard error of the mean. 5.3.3 Whole brain comparison between ASD and control group activations Using a whole brain analysis we assessed whether there were other brain regions for which processing of figure-ground segregation was different between the groups. Areas that were significantly more active in the ASD group than in the control group, and vice versa, on the figure-ground contrast [(stack + frame) - homogeneous], are displayed in Table 2 and Figure 4. The control group demonstrated more activity in visual areas compared to the ASD group, namely in the lingual gyrus (BA 18), in the superior lateral occipital cortex (BA 19 and 7) and in the temporal occipital fusiform gyrus (BA 37). Also in posterior brain regions, the control group showed enhanced activation of the superior parietal lobe (BA 7). Interestingly, in the anterior brain the control subjects addressed the paracingulate cortex (BA 32) more than ASD subjects as well as the inferior and middle frontal gyri (BA 45).
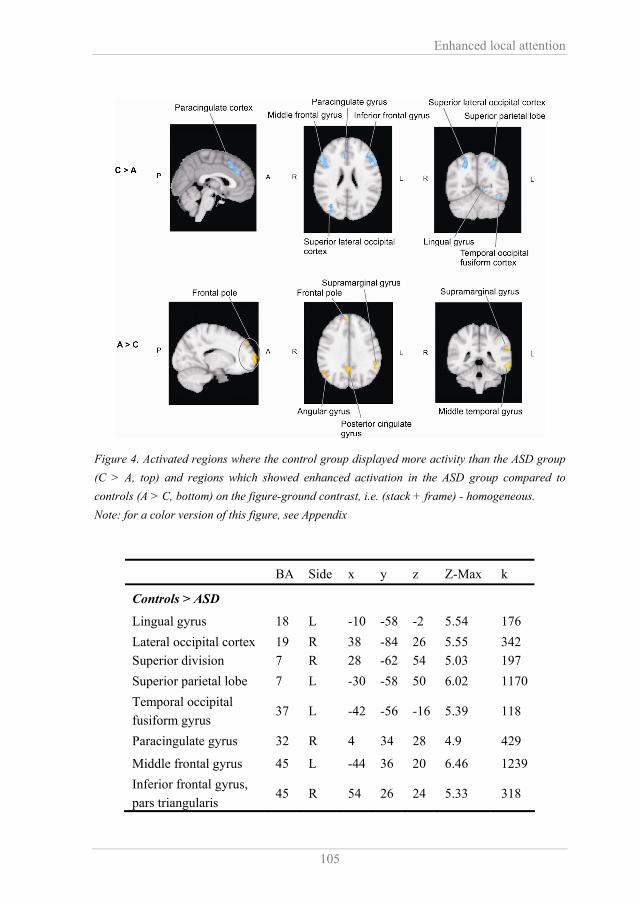
Enhanced local attention
105
Figure 4. Activated regions where the control group displayed more activity than the ASD group (C > A, top) and regions which showed enhanced activation in the ASD group compared to controls (A > C, bottom) on the figure-ground contrast, i.e. (stack + frame) - homogeneous. Note: for a color version of this figure, see Appendix
BA Side x y z Z-Max k
Controls > ASD
Lingual gyrus 18 L -10 -58 -2 5.54 176 Lateral occipital cortex Superior division
19 7
R R
38 28
-84 -62
26 54
5.55 5.03
342 197
Superior parietal lobe 7 L -30 -58 50 6.02 1170 Temporal occipital fusiform gyrus
37 L -42 -56 -16 5.39 118
Paracingulate gyrus 32 R 4 34 28 4.9 429
Middle frontal gyrus 45 L -44 36 20 6.46 1239 Inferior frontal gyrus, pars triangularis
45 R 54 26 24 5.33 318
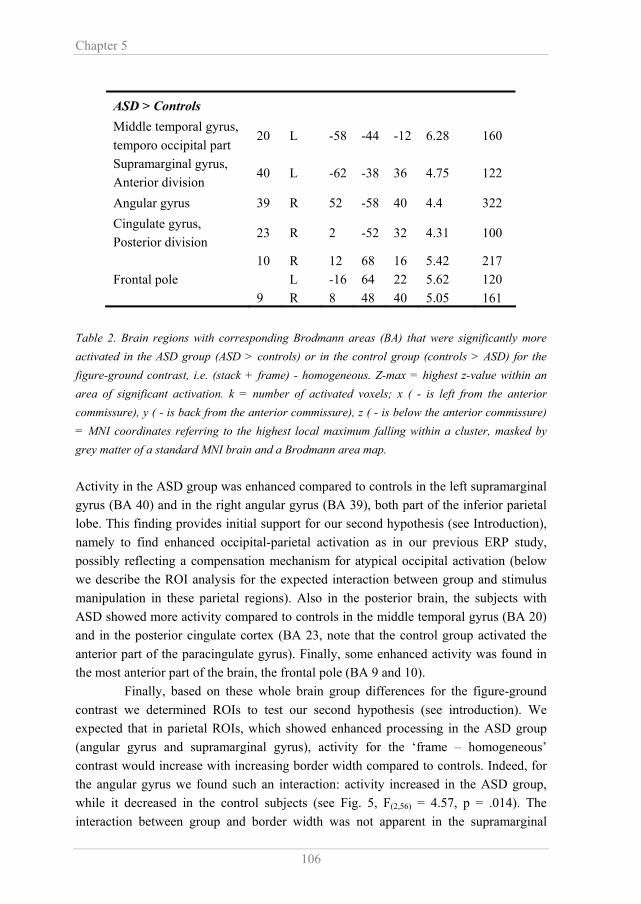
Chapter 5
106
ASD > Controls Middle temporal gyrus, temporo occipital part
20 L -58 -44 -12 6.28 160
Supramarginal gyrus, Anterior division
40 L -62 -38 36 4.75 122
Angular gyrus 39 R 52 -58 40 4.4 322 Cingulate gyrus, Posterior division
23 R 2 -52 32 4.31 100
Frontal pole 10 9
R L R
12 -16 8
68 64 48
16 22 40
5.42 5.62 5.05
217 120 161
Table 2. Brain regions with corresponding Brodmann areas (BA) that were significantly more activated in the ASD group (ASD > controls) or in the control group (controls > ASD) for the figure-ground contrast, i.e. (stack + frame) - homogeneous. Z-max = highest z-value within an area of significant activation. k = number of activated voxels; x ( - is left from the anterior commissure), y ( - is back from the anterior commissure), z ( - is below the anterior commissure) = MNI coordinates referring to the highest local maximum falling within a cluster, masked by grey matter of a standard MNI brain and a Brodmann area map. Activity in the ASD group was enhanced compared to controls in the left supramarginal gyrus (BA 40) and in the right angular gyrus (BA 39), both part of the inferior parietal lobe. This finding provides initial support for our second hypothesis (see Introduction), namely to find enhanced occipital-parietal activation as in our previous ERP study, possibly reflecting a compensation mechanism for atypical occipital activation (below we describe the ROI analysis for the expected interaction between group and stimulus manipulation in these parietal regions). Also in the posterior brain, the subjects with ASD showed more activity compared to controls in the middle temporal gyrus (BA 20) and in the posterior cingulate cortex (BA 23, note that the control group activated the anterior part of the paracingulate gyrus). Finally, some enhanced activity was found in the most anterior part of the brain, the frontal pole (BA 9 and 10). Finally, based on these whole brain group differences for the figure-ground contrast we determined ROIs to test our second hypothesis (see introduction). We expected that in parietal ROIs, which showed enhanced processing in the ASD group (angular gyrus and supramarginal gyrus), activity for the ‘frame – homogeneous’ contrast would increase with increasing border width compared to controls. Indeed, for the angular gyrus we found such an interaction: activity increased in the ASD group, while it decreased in the control subjects (see Fig. 5, F(2,56) = 4.57, p = .014). The interaction between group and border width was not apparent in the supramarginal

Enhanced local attention
107
gyrus (F(2,56) = .93, p = .403), nor in any other region that showed enhanced activation in the ASD group compared to controls. Figure 5. A) Legend for B) Percent BOLD signal change in the angular gyrus for the different border widths on ‘frame – homogeneous’ contrast, separately for the control and the ASD group. There was an interaction between border width and group. Error bars represent the standard error of the mean. 5.4 Discussion In an earlier ERP study we had provided evidence for aberrant boundary detection in people with ASD, probably as a result of malfunctioning horizontal connections. In addition, we identified increased activity in the ASD group at inferior parietal sites. We suggested this activity might comprise a compensation mechanism that could be the origin of normal feedback processing in the ASD group (Vandenbroucke et al., in press). As ERP data do not allow precise localization, the present fMRI study was done to determine the origin of atypical brain processes in ASD. The same group of subjects performed the same visual discrimination task (the order of fMRI and EEG measurements were counterbalanced over subjects). Here, we show slightly lower performance scores on frame stimuli in the ASD group, and a difference between the groups in activation for the ‘frame – homogeneous’ contrast: in controls a significant

Chapter 5
108
difference from zero in early visual areas (BA 17, 18, 19) was found, but this effect was not seen in the ASD group. As boundary detection is established through horizontal connections (see methods), combined with impaired identification of frame stimuli, we again provide evidence for atypical horizontal interactions in early visual areas in people with ASD. Then, we demonstrate enhanced inferior parietal functioning in the ASD group, specifically in the right angular and left supramarginal gyri. In the angular gyrus this enhancement was related to the stimulus manipulation (increasing the border width of the frame stimuli). The location and pattern of activation are in agreement with the compensation mechanism that we found in our previous ERP data. Below we discuss the specific function of the angular gyrus and the implications of this finding for our knowledge on visual perception in people with ASD. Then, we did not find any differences between the groups on the ‘stack – frame’ contrast, associated with surface segregation established through feedback. This is again consistent with our previous findings. However, in contrast to our expectation and the previous ERP data, the ‘stack – frame’ contrast was not significantly influenced by border width. This is probably due to the subtle difference between the stimuli and the relatively low signal-to-noise ratio of these fMRI data. Finally, we should note that performance on homogeneous stimuli was lower in the ASD group compared to controls. This is similar to previous measurements (Vandenbroucke et al., 2007; Vandenbroucke et al., in press), but thus far we have not been able to provide a standing explanation for this part of our data. We suggest that with the current fMRI data we have been able to localize a compensation mechanism for abnormal boundary detection in ASD in the right angular gyrus. Research has indicated that the right angular gyrus is involved in spatial attention in a network of ventral frontoparietal areas that mediates automatic shifts of attention to salient stimuli and it serves an attentional alerting function (Chambers, Payne, Stokes, & Mattingley, 2004; Hillis et al., 2005). Then, in the control group the activation to frame stimuli decreased with increasing border thickness (these induced the most negative brain response for the ‘frame – homogeneous’ contrast at border width level 3, see Fig. 5), while in the ASD subjects activation to frame stimuli increased with increasing border thickness (i.e. the ‘frame – homogeneous’ contrast became less negative, see Fig. 5). Speculating, this differential modulation of activation could be explained by the difference between paying attention to global versus local stimulus parts: research has shown that attention to local aspects (e.g. the letter at the local level in hierarchically organized Navon stimuli) leads to enhanced inferior parietal activation compared to when attention is drawn to global aspects of a stimulus (although the effect was strongest in the left inferior parietal cortex, see Weissman & Woldorff, 2005). This finding has recently been replicated by Peters and Goebel (Peters & Goebel, 2007) for the intraparietal sulcus (close to the angular gyrus) and they explained that this modulation of activation is related to the ‘zoom lens’ of attention: the size of the attentional focus can be adjusted to match the spatial scale of a relevant region (see

Enhanced local attention
109
Eriksen & St James, 1986 for the "zoom lens" theory of attention). The decrease in activation in response to increasing border thickness in controls could therefore be due to an increasing (more global) focus of the attention spotlight, which became broader for larger frame stimuli with thick borders (i.e. ´zooming out´). On the contrary, subjects with ASD possibly focused more on spatially local parts of the frame stimuli and this local focus became more pronounced with increasing stimulus difficulty (i.e. ´zooming in´). Then, it has also been shown that reaction times increase when attention is directed to a larger region in space (Muller, Bartelt, Donner, Villringer, & Brandt, 2003). Interestingly, we found that while reaction times increased in controls for frame stimuli with increasing borders (i.e. the stimuli became larger), reaction times remained the same in the ASD group (see Fig. 1E). We infer from the combination of findings - in controls activity in the angular gyrus decreased and reaction times increased while in the ASD group activity increased and reaction times did not - that there was a difference in the zoom lens of attention in both groups: in the control group attention was to the global stimulus aspects while in the ASD group attention was locally oriented. The deviating focus of attention in the patients possibly reflects a compensation mechanism for earlier visual processing aberrancies, i.e. impaired boundary detection. Interestingly, indications for enhanced processing in inferior parietal areas in ASD have been found before (Belmonte & Yurgelun-Todd, 2003). However, we present for the first time evidence that this activity probably reflects increased local processing, and might be a compensation mechanism. As we already suggested in our previous study (Vandenbroucke et al., in press), the combination of disrupted early processing with compensation at higher levels may be a general feature of the physiology of perception in ASD. We demonstrated additional differences between the groups on figure-ground segregation using a whole brain analysis. The control subjects activated occipital regions as well as inferior and middle frontal gyri more compared to ASD subjects. Also remarkable was the large cluster of enhanced activation in the anterior paracingulate gyrus in the control group. We suggest that this pattern of activation reflects that the control subjects relied more on a visual analysis of the stimuli and that a decision was influenced by verbal working memory (the involvement of the inferior and middle frontal gyri for a decision ‘stack’ or ‘frame’) and response monitoring through the anterior paracingulate cortex (Ridderinkhof, Ullsperger, Crone, & Nieuwenhuiss, 2004), compared to ASD subjects. The latter group, on the other hand, addressed the posterior part of the cingulated cortex that is involved in spatial attention (Vogt, Finch, & Olson, 1992), just like the supramarginal and angular gyrus (Chambers et al., 2004; Hillis et al., 2005). In addition, several studies have shown that the supramarginal gyrus and the posterior cingulate gyrus are involved in oddball detection tasks (Ardekani et al., 2002; Linden et al., 1999). Apparently did the subjects with ASD group use a different approach to discriminate the stimuli compared to controls. While they could

Chapter 5
110
not correctly perceive the figure boundaries of frame stimuli, stack stimuli were relatively salient. Speculating, the ASD subjects relied on an oddball strategy to correctly detect frames when these could not be identified as stacks: frames that were difficult to identify might be classified as “oddballs” and required a specific cognitive response to correctly discriminate them from stacks, the “standards”. Finally, we would like to emphasize that we compared ASD and control subjects after stimulus subtraction. As a result, general strategy differences are filtered out and the effects described here reflect cognitive strategies for evoked responses. For a comparison between the previous ERP and current fMRI data it is important to keep in mind that the temporal resolution is very low in fMRI: here we collapsed temporal data over 2.3 s while in our ERP study we looked at brain processing within 400 ms after stimulus presentation. Some issues should be considered for a reconciliation. In our ERP data we possibly missed processing in frontal areas and the cingulate cortex, operating more spread out and possibly later time in time (we should note that mean reaction times were about 800 ms so response monitoring probably continued after the first 400 ms). Accordingly, we suggest that with the current fMRI data we show higher-order effects that follow in time the lower-order differences between the groups revealed in both the ERP and fMRI studies. Also, with our ERP data we could segregate in time boundary detection from surface segregation, while it was not possible to do this in space for the fMRI data (see also the Methods section). Therefore we cannot interpret the BOLD signal for ‘frame – homogeneous’ as exclusively related to boundary detection and these fMRI data can only provide partial support for impaired boundary detection as shown in the ERP study. Not many studies addressed fMRI to study visual perception in ASD. Only recently, the embedded figures test (EFT) has been used in an fMRI setting to investigate configural and detail processing in these patients (Lee et al., 2007; Manjaly et al., 2007; Ring et al., 1999). These studies found enhanced occipital and temporal processing in ASD compared to controls, which seems in contrast to the findings of visual processing in ASD displayed here. However, it is important to note the difference between our experiment and the EFT. As indicated in these studies, the EFT involves a complex cognitive task on the basis of visual input: first a geometrical shape is analysed and registered, this shape is kept in working memory and then a local target has to be found by mentally rotating and matching of the geometrical shape to a complex pattern of lines and colours (see also Manjaly et al., 2003). It is possible that the higher cognitive load resulted in relatively greater reliance on lower visual mechanisms in people with ASD. In contrast, our experiment encompassed a relatively simple visual discrimination task, specifically testing for subtle differences in visual processing between ASD and control subjects. Accordingly, here we could demonstrate an impairment in a particular part of the visual processing stream, while previous studies

Enhanced local attention
111
showed a stronger reliance on visual perception relative to higher order cognitive processing in ASD. To resume, we carefully conclude that we have provided evidence with fMRI for a low-level visual processing aberrancy in ASD, which can be associated with malfunctioning of horizontal interactions. These findings are in strong agreement with our previous ERP study (Vandenbroucke et al., in press). In addition, we demonstrate higher-order differences between the groups, indicating a difference in strategy for performance on the visual task. More precisely, we found that processing in the angular gyrus was enhanced for the ASD subjects compared to controls, possibly reflecting a higher load on local spatial attention as a compensatory mechanism in the patient group. Although no conclusions can be drawn about the temporal order of the visual and higher-order, cognitive processes in the current fMRI data, combined with the knowledge from our previous ERP study, we conjecture that the occipital impairments preceded the parietal enhancement. In addition, since the ERP data did not show higher order differences up to 400 ms after stimulus presentation, we suggest the ´strategy´ differences found here probably occur later in time. These are therefore cautiously considered a result of the initial visual impairments, and not a cause. Coming back to the primary question if aberrant visual perception is due to high-order, cognitive impairments or is due to a fundamental functional aberration in the visual cortex, we argue for the latter.

Chapter 5
112
5.5 References Angelucci, A., & Bullier, J. (2003). Reaching beyond the classical receptive field of VI
neurons: horizontal or feedback axons? Journal of Physiology-Paris, 97(2-3), 141-154.
Ardekani, B. A., Choi, S. J., Hossein-Zadeh, G. A., Porjesz, B., Tanabe, J. L., Lim, K. O., et al. (2002). Functional magnetic resonance imaging of brain activity in the visual oddball task. Cognitive Brain Research, 14(3), 347-356.
Beckmann, C. F., Jenkinson, M., & Smith, S. M. (2003). General multilevel linear modeling for group analysis in FMRI. Neuroimage, 20(2), 1052-1063.
Belmonte, M. K., & Yurgelun-Todd, D. A. (2003). Functional anatomy of impaired selective attention and compensatory processing in autism. Cognitive Brain Research, 17(3), 651-664.
Bullier, J. (2001). Integrated model of visual processing. Brain Research Reviews, 36(2-3), 96-107.
Caputo, G., & Casco, C. (1999). A visual evoked potential correlate of global figure-ground segmentation. Vision Research, 39(9), 1597-1610.
Chambers, C. D., Payne, J. M., Stokes, M. G., & Mattingley, J. B. (2004). Fast and slow parietal pathways mediate spatial attention. Nature Neuroscience, 7(3), 217-218.
Eriksen, C. W., & St James, J. D. (1986). Visual attention within and around the field of focal attention: a zoom lens model. Percept Psychophys, 40(4), 225-240.
Gilbert, C. D., & Wiesel, T. N. (1989). Columnar Specificity of Intrinsic Horizontal and Corticocortical Connections in Cat Visual-Cortex. Journal of Neuroscience, 9(7), 2432-2442.
Happé, F., & Frith, U. (2006). The weak coherence account: Detail-focused cognitive style in autism spectrum disorders. Journal of Autism and Developmental Disorders, 36(1), 5-25.
Hillis, A. E., Newhart, M., Heidler, J., Barker, P. B., Herskovits, E. H., & Degaonkar, M. (2005). Anatomy of spatial attention: Insights from perfusion imaging and hemispatial neglect in acute stroke. Journal of Neuroscience, 25(12), 3161-3167.
Hochstein, S., & Ahissar, M. (2002). View from the top: Hierarchies and reverse hierarchies in the visual system. Neuron, 36(5), 791-804.
Jenkinson, M., Bannister, P., Brady, M., & Smith, S. (2002). Improved optimization for the robust and accurate linear registration and motion correction of brain images. Neuroimage, 17(2), 825-841.
Jenkinson, M., & Smith, S. (2001). A global optimisation method for robust affine registration of brain images. Medical Image Analysis, 5(2), 143-156.

Enhanced local attention
113
Kemner, C., van Ewijk, L., van Engeland, H., & Hooge, I. (2007). Brief Report: Eye Movements During Visual Search Tasks Indicate Enhanced Stimulus Discriminability in Subjects with PDD. Journal of Autism and Developmental Disorders.
Lamme, V. A. F. (1995). The Neurophysiology of Figure Ground Segregation in Primary Visual-Cortex. Journal of Neuroscience, 15(2), 1605-1615.
Lamme, V. A. F., Rodriguez-Rodriguez, V., & Spekreijse, H. (1999). Separate processing dynamics for texture elements, boundaries and surfaces in primary visual cortex of the macaque monkey. Cerebral Cortex, 9(4), 406-413.
Lee, P. S., Foss-Feig, J., Henderson, J. G., Kenworthy, L. E., Gilotty, L., Gaillard, W. D., et al. (2007). Atypical neural substrates of Embedded Figures Task performance in children with Autism Spectrum Disorders. NeuroImage, doi: 10.1016/j.neuroimage.2007.1007.1013.
Lee, T. S., Mumford, D., Romero, R., & Lamme, V. A. F. (1998). The role of the primary visual cortex in higher level vision. Vision Research, 38(15-16), 2429-2454.
Linden, D. E. J., Prvulovic, D., Formisano, E., Vollinger, M., Zanella, F. E., Goebel, R., et al. (1999). The functional neuroanatomy of target detection: An fMRI study of visual and auditory oddball tasks. Cerebral Cortex, 9(8), 815-823.
Malach, R., Amir, Y., Harel, M., & Grinvald, A. (1993). Relationship between Intrinsic Connections and Functional Architecture Revealed by Optical Imaging and in-Vivo Targeted Biocytin Injections in Primate Striate Cortex. Proceedings of the National Academy of Sciences of the United States of America, 90(22), 10469-10473.
Manjaly, Z. M., Bruning, N., Neufang, S., Stephan, K. E., Brieber, S., Marshall, J. C., et al. (2007). Neurophysiological correlates of relatively enhanced local visual search in autistic adolescents. Neuroimage, 35(1), 283-291.
Manjaly, Z. M., Marshall, J. C., Stephan, K. E., Gurd, J. M., Zilles, K., & Fink, G. R. (2003). In search of the hidden: an fMRI study with implications for the study of patients with autism and with acquired brain injury. Neuroimage, 19(3), 674-683.
Mottron, L., Dawson, M., Soulieres, I., Hubert, B., & Burack, J. (2006). Enhanced perceptual functioning in autism: An update, and eight principles of autistic perception. Journal of Autism and Developmental Disorders, 36(1), 27-43.
Muller, N. G., Bartelt, O. A., Donner, T. H., Villringer, A., & Brandt, S. A. (2003). A physiological correlate of the "zoom lens" of visual attention. Journal of Neuroscience, 23(9), 3561-3565.
O'Riordan, M., & Plaisted, K. (2001). Enhanced discrimination in autism. Quarterly Journal of Experimental Psychology Section a-Human Experimental Psychology, 54(4), 961-979.

Chapter 5
114
Peters, J. C., & Goebel, R. (2007). The neural control mechanisms of scaling the "zoom-lens" of attention. In Top-down control of visual attention and its reflection in human visual cortex, (pp. 101-121 ): Unpublished doctoral dissertation. Maastricht University, the Netherlands.
Plaisted, K., O'Riordan, M., & Baron-Cohen, S. (1998). Enhanced visual search for a conjunctive target in autism: A research note. Journal of Child Psychology and Psychiatry and Allied Disciplines, 39(5), 777-783.
Ridderinkhof, K. R., Ullsperger, M., Crone, E. A., & Nieuwenhuiss, S. (2004). The role of the medial frontal cortex in cognitive control. Science, 306(5695), 443-447.
Ring, H. A., Baron-Cohen, S., Wheelwright, S., Williams, S. C. R., Brammer, M., Andrew, C., et al. (1999). Cerebral correlates of preserved cognitive skills in autism - A functional MRI study of Embedded Figures Task performance. Brain, 122, 1305-1315.
Stettler, D. D., Das, A., Bennett, J., & Gilbert, C. D. (2002). Lateral connectivity and contextual interactions in macaque primary visual cortex. Neuron, 36(4), 739-750.
Super, H., Spekreijse, H., & Lamme, V. A. F. (2001). Two distinct modes of sensory processing observed in monkey primary visual cortex (V1). Nature Neuroscience, 4(3), 304-310.
Vandenbroucke, M. W. G., Scholte, H. S., Engeland, H., Lamme, V. A. F., & Kemner, C. (2007). A new approach to the study of detail perception in Autism Spectrum Disorder (ASD): investigating visual feedforward, horizontal and feedback processing. Manuscript submitted for publication.
Vandenbroucke, M. W. G., Scholte, H. S., Engeland, H., Lamme, V. A. F., & Kemner, C. (in press). A neural substrate for atypical low-level visual processing in Autism Spectrum Disorder. Brain.
Vogt, B. A., Finch, D. M., & Olson, C. R. (1992). Functional heterogeneity in cingulate cortex: the anterior executive and posterior evaluative regions. Cerebral Cortex, 2(6), 435-443.
Weissman, D. H., & Woldorff, M. G. (2005). Hemispheric asymmetries for different components of global/local attention occur in distinct temporo-parietal loci. Cerebral Cortex, 15(6), 870-876.
Woolrich, M. W., Behrens, T. E. J., Beckmann, C. F., Jenkinson, M., & Smith, S. M. (2004). Multilevel linear modelling for FMRI group analysis using Bayesian inference. Neuroimage, 21(4), 1732-1747.
Woolrich, M. W., Ripley, B. D., Brady, M., & Smith, S. M. (2001). Temporal autocorrelation in univariate linear modeling of FMRI data. Neuroimage, 14(6), 1370-1386.
Zipser, K., Lamme, V. A. F., & Schiller, P. H. (1996). Contextual modulation in primary visual cortex. Journal of Neuroscience, 16(22), 7376-7389.

General Discussion
115
Chapter 6
General Discussion Autism spectrum disorder (ASD) is characterized by impairments in social interaction and communication, and repetitive behavior and interests. There is a growing body of evidence that besides these cognitive aspects the disorder also encompasses low-level perceptual aberrancies, such as enhanced detail perception and possibly also atypical grouping. Since ASD is a neurobiological and genetically determined disorder, the aim of the present thesis was to establish the neural basis of atypical visual perception. This was done by investigating several types of neural connections that are involved in detail and global processing, in the visual system of ASD patients. The results from this thesis show a low-level visual processing aberrancy in ASD, reflected in atypical scene segmentation of textured stimuli. Initially, on the basis of behavioral data we thought the neural cause would be enhanced cortico-cortical feedback (Chapter 3), but the ERP study (Chapter 4) provided evidence for a specific impairment in intra-areal horizontal connections in early visual areas. With fMRI data (Chapter 5) we were able to localize this impairment in Brodmann areas 17, 18, 19. Interestingly, neuropathology and neurochemistry research (Casanova, Buxhoeveden, & Gomez, 2003; Cline, 2005; Collins et al., 2006) on ASD has also provided evidence for aberrant inhibitory mechanisms through horizontal connections in other regions of the brain (Chapter 4). Possibly, malfunctioning of these neural interactions could be a general neurobiological marker of ASD. The ERP study revealed in addition that the visual impairment could be compensated for by brain processes operating in occipital-parietal areas. Whereas ERP data do not allow precise localization, with the fMRI study we were able to localize a similar compensation mechanism in the angular gyrus: the subjects with ASD showed an increase in activation in this part of the inferior parietal lobe, while activation decreased in the control group. Based on the literature we suggest the difference between the groups reflects respectively local vs. global attention. We conjecture that the combination of disrupted early processing with compensation at higher levels may be a general feature of the physiology of perception in ASD. A compensation mechanism probably resulted in normal feedback activity in ASD (Chapters 4 and 5). The first study of this thesis on plaid motion perception (Chapter 2) did not reveal abnormal global processing and accordingly no evidence for aberrant pooling of features over space in ASD was provided. Before elaborating on the relation between our findings and previous research on visual perception in ASD, the implications for the broader spectrum of ASD symptoms and directions for future research, I would like to discuss the strengths and limitations of our studies.

Chapter 6
116
6.1 Strengths and limitations Starting off with the limitations, I should mainly refer to the link between detail perception and figure-ground segregation as referred to in Chapters 3 to 5. The relation between these two is merely implicit (see Chapter 3). The model of Hochstein and Ahissar (Hochstein & Ahissar, 2002) on the reverse visual hierarchy strongly implicates that global perception is established during the feedforward sweep while feedback processing leads to the incorporation of details in a visual scene. Therefore we were interested in studying these mechanisms in ASD. Since the model of Roelfsema et al. (Roelfsema, Lamme, Spekreijse, & Bosch, 2002) is explicit about how feedforward, feedback and also horizontal processing each contribute to figure-ground segregation, using a paradigm that relies on this perceptual phenomenon was considered appropriate. Indeed, we found evidence for impaired boundary detection which was associated with aberrant lateral inhibition through horizontal connections (Chapter 4). Yet, the relation between impaired boundary detection or lateral inhibition and detail perception is not straightforward. For instance, Gustafsson (Gustafsson, 1997) proposed that enhanced inhibition between neurons would lead to enhanced discrimination of details. We should note that lateral inhibition is related to fundamental aspects of visual perception, namely inhibition between neurons responding to orientations, luminance, contrast, motion features etc. In autism research the term ‘details’ probably refers to higher order aspects of visual perception. In paragraph 6.4 we elaborate on the different accounts of detail perception that have been used in the ASD literature. Still, it is difficult to relate impaired lateral inhibition to earlier findings on visual perception in ASD. A contradiction in our findings was that we initially concluded that feedback processing was relatively enhanced in people with ASD, while brain imaging showed evidence for malfunctioning of horizontal interactions. The latter finding is most compelling as it was revealed by ERP data and (partly) confirmed in the fMRI study. In both studies we used specific stimulus contrasts, based on accurate predictions, and a strong theoretical background to test brain functioning. However, it is important to keep in mind that these imaging data were from a second and third measurement, while our conclusion of enhanced feedback was based on a first measurement. Learning effects influenced these results and different brain imaging data would be expected for the initial measurement: learning a visual task can modulate neural interactions already after a single training session and this modulation can last for months (this is also referred to as perceptual learning, see paragraph 6.5 for a more extensive debate). Then, it is also possible that during the first measurement the compensation mechanism, i.e. enhanced local attention through the angular gyrus, led to enhanced feedback. For these reasons I think stronger feedback should not be disregarded as a possible explanation of increased detail perception in ASD (see also paragraph 6.2.3)

General Discussion
117
A limitation related to the experimental design, as already briefly touched in Chapter 5, is that we probably introduced too many conditions in our experiments. Using many conditions requires gathering more data points to reliably fit all parameters in a model. Stack and frame stimuli with three levels of border width were presented at four different locations. Including the homogeneous stimuli, 25 parameters had to be fit. Probably the main reason that we did not find strongly significant results in the fMRI study is too little power and a low signal-to noise ratio. Having that said, a point of strength also lies in the creation of a parametric design, as we did in the studies presented in this thesis. A parametric design was implemented to investigate a range of stimulus values, allowing one to draw more valid conclusions on whether there truly are differences between the groups under study (see also Dakin & Frith, 2005). Also, the validity of the outcome with respect to the paradigm and stimuli used is considered higher in a parametric set-up (Judd, Smith, & Kidder, 1991). In the plaid motion task (Chapter 2) we manipulated the stimuli in such a way that they provoked different percepts, i.e. different predominance of coherency, both in the ASD and the control group. In Chapters 3 to 5 the border width of the frame and stack stimuli was varied, which influenced the ability to discriminate between the stimuli in a similar way in both groups. A successful stimulus manipulation could refute several confounds such as differences between the groups in attention, strategy (Chapters 3 and 4) and eye movements (Chapter 2). A related point of strength is that the fundamentals of figure-ground segregation are well established, which allowed us to make relatively accurate predictions about the outcomes of our studies as well as to draw to-the-point conclusions according to the results. Finally, we would like to note that in this thesis a relatively homogeneous group of ASD subjects was studied. Patients had received a clinical diagnosis based on the DSM-IV and in addition standardized diagnostic instruments were administered: the Autism Diagnostic Interview (ADI-R, Lord, Rutter, & Le Couteur, 1994) and the Autism Diagnostic Observation Schedule (ADOS, Lord et al., 1989). Medication use was limited (only one ASD subject was on medication, see methods section of Chapter 2) and no subjects with PDD-NOS were included. Also, all ASD subjects were high functioning with an average IQ of on average 120 which probably prevented that experimental differences between the groups were due to limited understanding of the tasks. The control group was matched on age, IQ and gender to the ASD group. Altogether, our homogeneous sample lets us draw reliable conclusions based on our findings and it partly compensates for the limitation that we used only a small number (13) of ASD patients. Obviously, it could also be stated that the sample we studied was not representative of the ASD population and other outcomes might be expected when studying for instance low-functioning ASD subjects.

Chapter 6
118
6.2 Previous evidence for aberrant horizontal and/or feedback processing in ASD To our knowledge, it is the first time that the balance between feedforward, horizontal and feedback processing has been explicitly studied in ASD. Interestingly, from previous research it can be and has been suggested that there might be aberrancies in one or more of these neural interactions. Below I review some accounts based on speculations, theories and experimental findings in the literature and compare them to the results from this thesis. 6.2.1. Theoretical accounts for atypical lateral connections or atypical feedback The supposition of aberrant feedback has actually been raised before by several different authors. Francesa Happé and Uta Frith (Happé & Frith, 2006) refer to a paper by Lee et al. (Lee, 2002), to explain how top-down processes, or feedback interactions, induce contextual modulation that influences processing in low-level visual neurons (see also the Introduction for a more thorough discussion on contextual modulation and feedback). With respect to their Weak Central Coherence theory of ASD, i.e. a weaker tendency to process incoming information in its context, Happé and Frith speculate that aberrancies in feedback connections could lead to the perceptual abnormalities as found in ASD. Then, Chris Frith (Frith, 2004) suggested that atypical feedback could be due to a failure of neuronal pruning (which is possibly the underlying cause of abnormally large brain sizes often found in subjects with ASD (Courchesne, 2004)). In addition, Gustafsson (Gustafsson, 1997) proposed in his neural circuit theory of ASD that excessive inhibitory lateral feedback is a prominent feature of ASD, causing high sensory discrimination. 6.2.2. Speculations based on experimental findings and more indirect experimental evidence As already indicated in the Introduction, the balance between feedforward and feedback activity is probably essential for the balance between details and global aspects in visual perception (Hochstein & Ahissar, 2002). If feedforward activation is stronger than feedback, there will be a relatively large impact of global features on the resulting percept, leading to for instance global precedence in a Navon task as is the case in healthy people (Navon, 1981). On the other hand, if feedback activity is stronger compared to feedforward, this will lead to an overrepresentation of details in a visual scene. Previous research on ASD has indicated impaired global precedence (Plaisted, Swettenham, & Rees, 1999; Rinehart, Bradshaw, Moss, Brereton, & Tonge, 2000) as well as enhanced detail perception (Behrmann, Thomas, & Humphreys, 2006; Happé & Frith, 2006), indicating that an imbalance could be due to weaker feedforward or stronger feedback processing.

General Discussion
119
Bertone and colleagues have provided evidence for impaired orientation detection for second order, texture defined stimuli, and the authors accordingly argued that both lateral and feedback activity is atypical in ASD (Bertone, Mottron, Jelenic, & Faubert, 2005). Besides their role in processing texture stimuli, lateral or horizontal connections are also involved in perceptual grouping or binding (Polat, 1999; Roelfsema, 2006). Specifically, monkey research has shown the selectivity of horizontal connections for neurons with similar orientation tuning (Malach, Amir, Harel, & Grinvald, 1993), which most likely plays a role in perception by Gestalt laws, such as grouping by similarity (Roelfsema, 2006). Recent behavioral studies demonstrated that in people with ASD grouping by Gestalt principles, amongst others grouping by similarity, is less strong compared to controls (Brosnan, Scott, Fox, & Pye, 2004; Bolte, Holtmann, Poustka, Scheurich, & Schmidt, 2007). Also, using the Embedded Figures Test (EFT), where the stimulus configuration has to be suppressed to find the embedded figure in a complex pattern of line elements, it has repeatedly been shown that people with ASD perform better on the EFT than healthy control subjects, again demonstrating that this kind of grouping is weaker in ASD (De Jonge, Kemner, & van Engeland, 2006; Jolliffe & Baron-Cohen, 1997; Ropar & Mitchell, 2001). 6.2.3. A reconciliation The above described theoretical accounts and experimental findings implicate the involvement of abnormal functioning of horizontal and feedback connections in visual perception in ASD. Indeed in Chapters 4 and 5 we found evidence for malfunctioning of horizontal connections and investigating these low-level visual mechanisms seems promising in the study on atypical visual perception in ASD. As indicated above, malfunctioning of horizontal connections could lead to both impaired lateral inhibition and aberrant grouping (see Chapter 4). Future research should try to dissociate these two functions of horizontal connections to identify which is specifically impaired in ASD (see paragraph 6.5). Finally, although we conjectured in Chapter 3 that feedback processing in ASD is enhanced and this would be the reason for increased detail perception, we did not find evidence from neuroimaging data for this account. Still, it is possible that the compensation mechanism operating from the angular gyrus (Chapter 5) actually induced relatively enhanced recurrent processing during the first measurement (see also paragraph 6.1) and might lead to increased attention to and incorporation of details in other visual tasks. This possibility should not be disregarded in future research.

Chapter 6
120
6.3 Speculations on the relation between the current findings and social impairments in ASD
ASD is primarily known for its impairments in social functioning which has merely been studied apart from atypical visual perception in these patients. However, more and more researchers focus on the relation between aberrancies in visual perception and face processing or emotion recognition in faces, as a possible explanation for social malfunctioning (Behrmann, Avidan et al., 2006; Boeschoten, Kenemans, van Engeland, & Kemner, 2007; Bertone, Mottron, Jelenic, & Faubert, 2003; Dawson, Webb, & McPartland, 2005). Experimental findings have shown that people with ASD perform lower on face identification tasks and they do not show typical activation of the fusiform face area and the superior temporal sulcus (STS, see Dakin & Frith, 2005 for a discussion on the STS). Also, the “face inversion effect”, i.e. recognition difficulty of inverted faces and a diminished face-related ERP (the N170), seems less profound in these patients. The typical inversion effect is an indication of holistic or configurationally processing (i.e. the extraction of the spatial relation between features) of faces in normal individuals. Apparently, people with ASD do not process faces in a holistic manner; they rather rely on a part-based analysis in both upright and inverted faces. Moreover, eye movement data have shown that ASD patients look more to details in a face compared to controls (for a review on face processing in ASD see Dawson et al., 2005). Apparently, atypical detail and global perception is also found in face processing and I would like to speculate on the relation between this aspect of ASD and the hypothesized imbalance between feedforward, horizontal and feedback processing. In the reverse hierarchy theory of Hochstein and Ahissar (Hochstein & Ahissar, 2002) feedforward processing leads to categorization of objects, e.g. faces, while within category specialization is established through feedback, e.g. the identity of a face. Indeed, impaired within category identification for both faces as well as non-face stimuli due to interference of details has been shown in ASD (Behrmann, Avidan et al., 2006). This finding from Behrmann and colleagues provides indirect evidence for the role of enhanced feedback, i.e enhanced processing of details, in atypical face processing in the disorder. An EEG experiment by Grice et al. (Grice et al., 2001) showed that gamma oscillations (frequencies from 30 – 70 Hz) in response to inverted faces were similar to gamma oscillations for upright faces in ASD, while these were clearly differentiated in controls. As gamma oscillations have been associated with binding or feature integration, this finding (again) implicates that configural processing of faces is aberrant in ASD (Grice et al., 2001). Atypical gamma power early after stimulus onset in ASD has been demonstrated for detection of Kanisza stimuli (Brown, Gruber, Boucher, Rippon, & Brock, 2005). The authors suggest that these early oscillations reflect

General Discussion
121
binding of perceptual information through neurons within the same cortical area (i.e. intra-areal), which appear to function abnormally in ASD. Apparently aberrant oscillations through intra-areal connections could play a role in atypical processing of face (and non-face) stimuli and one can speculate that this is related to our finding of malfunctioning horizontal connections. 6.4 Vagaries in visual perception research in ASD Atypical visual perception in ASD has been extensively studied the past ten to fifteen years (for a review see Happé & Frith, 2006; Dakin & Frith, 2005). Recurring themes in terms of perception of static visual stimuli are enhanced detail or feature perception, enhanced local processing, atypical grouping, aberrant global perception, impaired configural or Gestalt processing. But what do these notions actually mean and, more importantly, do they refer to the same or different underlying neural mechanisms? An important caveat lies in confusion between the terms global, grouping and configural. Global processing has been described as requiring extensive pooling of features over space and is established by the coordinated activity of several neurons (Dakin & Frith, 2005). Configural refers to the perception of relations among features of a stimulus divided into first-order and second-order relation. First order relations refer to the presence of stimulus features, for instance two eyes above a nose, while second order relations refer to processing the relation between features, e.g. the distance between mouth and nose (Behrmann, Avidan et al., 2006). Then, configural could also refer to holistic processing, i.e. stimulus features are glued into a gestalt (Behrmann, Avidan et al., 2006; Bolte et al., 2007). The latter explanation of configural processing probably touches another concept, namely grouping. Grouping of elementary features is based on low-level Gestalt rules like similarity (similar elements are bound as an object, see Roelfsema, 2006). Yet, high-level grouping cues require familiarity with the shape of an object (Roelfsema, 2006) and a distinction should be made to appropriately test underlying mechanisms, i.e. horizontal interactions or feedback. Remarkably, one of the most influential theories in visual perception research in ASD, the Weak Central Coherence theory (WCC), is based on the idea that the disorder encompasses an inability to integrate information into a global percept (Happé & Frith, 2006). However, as comes about from the different accounts on global processing briefly described here, the meaning of global processing is not clear. Which of the descriptions was meant in the WCC theory? It is well possible that the debate on the impairment of global processing or grouping in ASD (Happé & Frith, 2006) (e.g. see Mottron, Burack, Iarocci, Belleville, & Enns, 2003) is not yet resolved as the multiple interpretations of ‘global’ or ‘grouping’ introduced a substantial amount of error in the literature on the WCC theory and visual perception in ASD.

Chapter 6
122
Local, detail or feature processing have also been intermingled in the ASD literature on perception. Local processing has been defined as the detection of local structures which can be encompassed by the receptive fields of single neurons (Dakin & Frith, 2005). However, as Dakin and Frith indicate in their review (Dakin & Frith, 2005) global aspects of certain stimuli, such as Navon stimuli (see Figure 1), can be detected by neurons with large receptive fields sensitive to low spatial frequencies (Figure 1C) ‘without recourse to dedicated global grouping mechanisms that link multiple receptive fields across space’. As a consequence, using these stimuli revealed a local processing bias (i.e. within receptive fields) but a problem in processing global stimulus aspects (pooling of features over space) was not tested (Dakin & Frith, 2005). Indeed, to investigate local (and global) processing the sensitivity to both high and low spatial frequencies has been studied in ASD (Boeschoten, Kenemans, Engeland, & Kemner, 2007): while high spatial frequencies in a visual scene represent details (see for example Figure 1B), low spatial frequencies reflect global contours. In the study of Boeschoten et al. ASD and control subjects were required to passively look at gratings of high and low spatial frequencies (6 cycles per degree and 0.5 cycles per degree respectively) while EEG was measured. The results showed that while in controls the visual evoked potentials (VEPs) and the underlying neural generators (i.e. dipole sources) to gratings of high and low spatial frequencies were clearly distinct in amplitude and location, this differentiation was diminished in subjects with ASD. The authors conclude that atypical spatial frequency processing is related to abnormalities in local and global perception in the disorder (see also Boeschoten, Kenemans, van Engeland et al., 2007). A rather contrasting view of local processing is that superior performance on the EFT requires enhanced local perception: subjects have to search for a local geometrical shape in a complex pattern of lines (see Figure 1A in Chapter 1, Jolliffe & Baron-Cohen, 1997). Yet, it is important to notice that the EFT is a relatively complex, cognitive task based on visual input: a geometrical shape is analysed and registered, this shape is kept in working memory and then a local target has to be found by mentally rotating and matching of the geometrical shape to a complex pattern of lines and colours (Manjaly et al., 2007; Manjaly et al., 2003). It is difficult to make a statement on perceptual processes when cognitive requirements are high. Also, besides the search for a local target, the configuration of the complex line pattern has to be actively suppressed. Accordingly, performance is not based on detail perception alone. The same applies to the block design test, tapping into so-called locally oriented processing as the task requires mentally segmenting a visual pattern into smaller parts (see Figure 1C in Chapter 1, Caron, Mottron, Berthiaume, & Dawson, 2006). I do not want to argue that local processing is not required in these tasks, but it is difficult to draw conclusions on pure perceptual processes and the relation to other notions of detail or feature perception is not evident.

General Discussion
123
Figure 1. Example of a full spectrum Navon stimulus (A) and a Navon stimulus filtered for high spatial frequencies (B) and low spatial frequencies (C). It is conceivable that the neural cause for atypical visual perception in ASD has not yet been found because the subject of study, global/local processing, in the used paradigms was not clearly defined. Instead of using relatively complex visual stimuli and tasks such as the Navon task, the embedded figures test or the block design test, I suggest addressing paradigms relying more on low-level perception. In the studies presented in this thesis fundamental aspects of visual perception were investigated by employing basic visual stimuli, with accurate predictions about the underlying neural interactions within the visual cortex. In terms of perceptual aberrancies, one should first clearly define the problem on an early sensory level before expanding to higher-level, cognitive aspects of ASD. In the next paragraph I provide some suggestions for future research. 6.5 Directions for future research As happens when testing a hypothesis, more questions have arisen than what we started off with. In this paragraph I will discuss some of these questions and I will indicate the way these could be addressed in future research. 6.5.1 Perceptual learning In Chapter 3 we found that during the first measurement subjects with ASD performed about 15 % lower compared to controls on the texture discrimination task. However, during a second and third measurement performance increased and finally the ASD subjects showed performance scores comparable to controls (who also showed some improvement in performance). To our knowledge, it is the first time that learning of low-level perceptual discrimination tasks has been demonstrated for people with ASD and we wondered what could be the origin. That perceptual learning can occur after relatively limited training is well supported by earlier findings (Karni & Sagi, 1991). Perceptual learning is defined as a change of performance, usually an improvement, as a
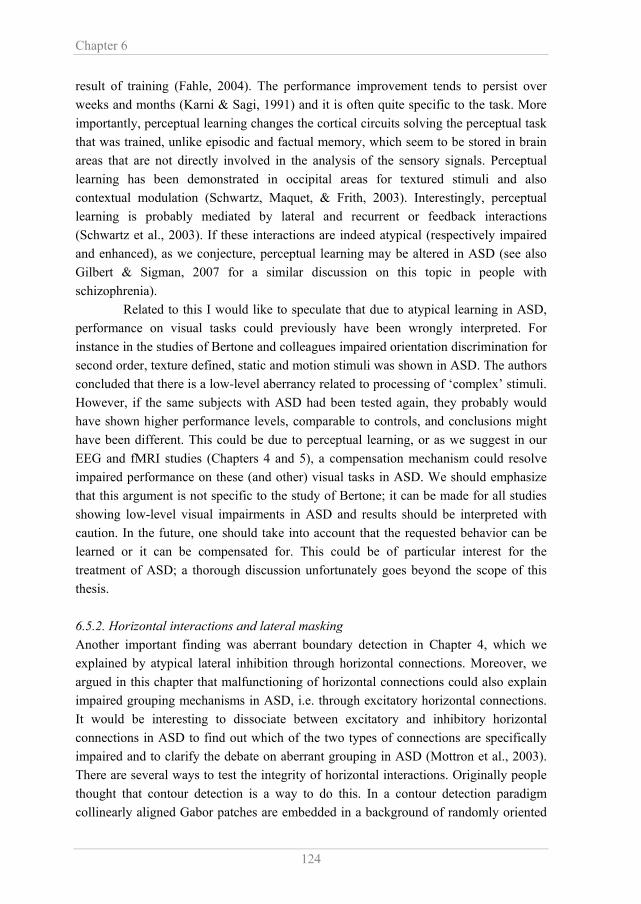
Chapter 6
124
result of training (Fahle, 2004). The performance improvement tends to persist over weeks and months (Karni & Sagi, 1991) and it is often quite specific to the task. More importantly, perceptual learning changes the cortical circuits solving the perceptual task that was trained, unlike episodic and factual memory, which seem to be stored in brain areas that are not directly involved in the analysis of the sensory signals. Perceptual learning has been demonstrated in occipital areas for textured stimuli and also contextual modulation (Schwartz, Maquet, & Frith, 2003). Interestingly, perceptual learning is probably mediated by lateral and recurrent or feedback interactions (Schwartz et al., 2003). If these interactions are indeed atypical (respectively impaired and enhanced), as we conjecture, perceptual learning may be altered in ASD (see also Gilbert & Sigman, 2007 for a similar discussion on this topic in people with schizophrenia). Related to this I would like to speculate that due to atypical learning in ASD, performance on visual tasks could previously have been wrongly interpreted. For instance in the studies of Bertone and colleagues impaired orientation discrimination for second order, texture defined, static and motion stimuli was shown in ASD. The authors concluded that there is a low-level aberrancy related to processing of ‘complex’ stimuli. However, if the same subjects with ASD had been tested again, they probably would have shown higher performance levels, comparable to controls, and conclusions might have been different. This could be due to perceptual learning, or as we suggest in our EEG and fMRI studies (Chapters 4 and 5), a compensation mechanism could resolve impaired performance on these (and other) visual tasks in ASD. We should emphasize that this argument is not specific to the study of Bertone; it can be made for all studies showing low-level visual impairments in ASD and results should be interpreted with caution. In the future, one should take into account that the requested behavior can be learned or it can be compensated for. This could be of particular interest for the treatment of ASD; a thorough discussion unfortunately goes beyond the scope of this thesis. 6.5.2. Horizontal interactions and lateral masking Another important finding was aberrant boundary detection in Chapter 4, which we explained by atypical lateral inhibition through horizontal connections. Moreover, we argued in this chapter that malfunctioning of horizontal connections could also explain impaired grouping mechanisms in ASD, i.e. through excitatory horizontal connections. It would be interesting to dissociate between excitatory and inhibitory horizontal connections in ASD to find out which of the two types of connections are specifically impaired and to clarify the debate on aberrant grouping in ASD (Mottron et al., 2003). There are several ways to test the integrity of horizontal interactions. Originally people thought that contour detection is a way to do this. In a contour detection paradigm collinearly aligned Gabor patches are embedded in a background of randomly oriented

General Discussion
125
and positioned Gabor patches and subjects have to do a simple detection task (Field, Hayes, & Hess, 1993). Contour integration would be the result of local interactions through lateral connections between cells in neighbouring cortical hypercolumns (see Chapter 4) with a similar orientation preference. Kemner et al. (Kemner, Lamme, Kovacs, & van Engeland, 2007) studied contour detection in ASD to test the integrity of horizontal connections, but did not find any differences in correct detection of contours between ASD and control subjects. Yet, there is a growing body of evidence that besides horizontal interactions, feedback from higher cortical areas also plays a role in contour detection (Hess, Hayes, & Field, 2003). Accordingly, if feedback is intact this might overcome malfunctioning of horizontal interactions in contour detection, as we found for detection of stack stimuli in Chapters 3, 4 and 5 (while the identification of frames, relying more heavily on detection of orientation discontinuities, was impaired). A way to isolate horizontal interactions is lateral masking: an oriented, low-contrast target line is flanked by two other line elements, one above and one below the target line. Depending on the distance of the flanking lines, the orientation discrimination of the target line in the center will either be facilitated (larger distance) or impaired (smaller distance), established through excitatory and inhibitory horizontal interactions respectively (for an extensive overview of these effects see Polat, 1999). Using this paradigm one can distinguish between the two types of horizontal interactions and possibly reveal which are specifically impaired in ASD. Visual phenomena relying on similar principles are crowding and clutter. Testing these perceptual mechanisms could provide more insight into fundamental aspects of visual perception in patients with ASD. 6.6 Conclusion In the current thesis we tried to establish the neural basis of atypical visual perception in ASD. We tested a homogeneous group of subjects with ASD on two different paradigms, each with a clear theoretical background on the underlying neural mechanisms. Indeed, we have provided evidence for an aberrancy in low-level visual processing in ASD, which we related to atypical lateral inhibition through horizontal interactions. Interestingly, this impairment could be compensated later in time through enhanced processing in the angular gyrus, possibly reflecting increased local attention. We conjecture that the combination of disrupted early processing with compensation at higher levels may be a general feature of the physiology of perception in ASD. Although the relation between these findings and enhanced detail perception is merely implicit, malfunctioning of horizontal interactions can explain aberrant perceptual grouping in people with ASD. Earlier lines of perception research already implied that aberrancies in these interactions may be an underlying cause of atypical visual perception in ASD. In addition, from neurochemistry and neuropathology research

Chapter 6
126
aberrant lateral inhibition in other brain areas besides the occipital cortex has been inferred. Altogether, we speculate that aberrant horizontal interactions reflect a more general neural abnormality in this disorder. Studying these neural interactions more thoroughly in the future could be a promising direction for research on visual perception in particular and possibly for ASD in general.

General Discussion
127
References Behrmann, M., Avidan, G., Leonard, G. L., Kimchi, R., Luna, B., Humphreys, K., et al.
(2006). Configural processing in autism and its relationship to face processing. Neuropsychologia, 44(1), 110-129.
Behrmann, M., Thomas, C., & Humphreys, K. (2006). Seeing it differently: visual processing in autism. Trends in Cognitive Sciences, 10(6), 258-264.
Bertone, A., Mottron, L., Jelenic, P., & Faubert, J. (2003). Motion perception in autism: a "complex" issue. Journal of Cognitive Neuroscience, 15(2), 218-225.
Bertone, A., Mottron, L., Jelenic, P., & Faubert, J. (2005). Enhanced and diminished visuo-spatial information processing in autism depends on stimulus complexity. Brain, 128, 2430-2441.
Boeschoten, M. A., Kenemans, J. L., Engeland, H., & Kemner, C. (2007). Abnormal spatial frequency processing in high-functioning children with pervasive developmental disorder (PDD). Clinical Neurophysiology, 118(9), 2076-2088.
Boeschoten, M. A., Kenemans, J. L., van Engeland, H., & Kemner, C. (2007). Face processing in Pervasive Developmental Disorder (PDD): the roles of expertise and spatial frequency. Journal of Neural Transmission.
Bolte, S., Holtmann, M., Poustka, F., Scheurich, A., & Schmidt, L. (2007). Gestalt perception and local-global processing in high-functioning autism. Journal of Autism and Developmental Disorders, 37(8), 1493-1504.
Brosnan, M. J., Scott, F. J., Fox, S., & Pye, J. (2004). Gestalt processing in autism: failure to process perceptual relationships and the implications for contextual understanding. Journal of Child Psychology and Psychiatry, 45(3), 459-469.
Brown, C., Gruber, T., Boucher, J., Rippon, G., & Brock, J. (2005). Gamma abnormalities during perception of illusory figures in autism. Cortex, 41(3), 364-376.
Caron, M. J., Mottron, L., Berthiaume, C., & Dawson, M. (2006). Cognitive mechanisms, specificity and neural underpinnings of visuospatial peaks in autism. Brain, 129, 1789-1802.
Casanova, M. F., Buxhoeveden, D., & Gomez, J. (2003). Disruption in the inhibitory architecture of the cell minicolumn: Implications for autisim. Neuroscientist, 9(6), 496-507.
Cline, H. (2005). Synaptogenesis: A balancing act between excitation and inhibition. Current Biology, 15(6), R203-R205.
Collins, A. L., Ma, D. Q., Whitehead, P. L., Martin, E. R., Wright, H. H., Abramson, R. K., et al. (2006). Investigation of autism and GABA receptor subunit genes in multiple ethnic groups. Neurogenetics, 7(3), 167-174.

Chapter 6
128
Courchesne, E. (2004). Brain development in autism: Early overgrowth followed by premature arrest of growth. Mental Retardation and Developmental Disabilities Research Reviews, 10(2), 106-111.
Dakin, S., & Frith, U. (2005). Vagaries of visual perception in autism. Neuron, 48(3), 497-507.
Dawson, G., Webb, S. J., & McPartland, J. (2005). Understanding the nature of face processing impairment in autism: Insights from behavioral and electrophysiological studies. Developmental Neuropsychology, 27(3), 403-424.
De Jonge, M. V., Kemner, C., & van Engeland, H. (2006). Superior disembedding performance of high-functioning individuals with autism spectrum disorders and their parents: The need for subtle measures. Journal of Autism and Developmental Disorders, 36(5), 677-683.
Fahle, M. (2004). Perceptual learning: A case for early selection. Journal of Vision, 4(10), 879-890.
Field, D. J., Hayes, A., & Hess, R. F. (1993). Contour Integration by the Human Visual-System - Evidence for a Local Association Field. Vision Research, 33(2), 173-193.
Frith, C. (2004). Is autism a disconnection disorder? Lancet Neurology, 3(10), 577-577. Gilbert, C. D., & Sigman, M. (2007). Brain states: top-down influences in sensory
processing. Neuron, 54(5), 677-696. Grice, S. J., Spratling, M. W., Karmiloff-Smith, A., Halit, H., Csibra, G., de Haan, M.,
et al. (2001). Disordered visual processing and oscillatory brain activity in autism and Williams Syndrome. Neuroreport, 12(12), 2697-2700.
Gustafsson, L. (1997). Inadequate cortical feature maps: A neural circuit theory of autism. Biological Psychiatry, 42(12), 1138-1147.
Happé, F., & Frith, U. (2006). The weak coherence account: Detail-focused cognitive style in autism spectrum disorders. Journal of Autism and Developmental Disorders, 36(1), 5-25.
Hess, R. F., Hayes, A., & Field, D. J. (2003). Contour integration and cortical processing. Journal of Physiology-Paris, 97(2-3), 105-119.
Hochstein, S., & Ahissar, M. (2002). View from the top: Hierarchies and reverse hierarchies in the visual system. Neuron, 36(5), 791-804.
Jolliffe, T., & Baron-Cohen, S. (1997). Are people with autism and Asperger syndrome faster than normal on the embedded figures test? Journal of Child Psychology and Psychiatry and Allied Disciplines, 38(5), 527-534.
Judd, C. M., Smith, E. R., & Kidder, L. H. (1991). Research Methods in Social Sciences (6 ed.). Orlando: Ted Buchholz.
Karni, A., & Sagi, D. (1991). Where Practice Makes Perfect in Texture-Discrimination - Evidence for Primary Visual-Cortex Plasticity. Proceedings of the National Academy of Sciences of the United States of America, 88(11), 4966-4970.

General Discussion
129
Kemner, C., Lamme, V. A. F., Kovacs, I., & van Engeland, H. (2007). Integrity of lateral and feedbackward connections in visual connections in visual processing in children with pervasive developmental disorder. Neuropsychologia, 45(6), 1293-1298.
Lee, T. S. (2002). Top-down influence in early visual processing: a Bayesian perspective. Physiology & Behavior, 77(4-5), 645-650.
Lord, C., Rutter, M., Goode, S., Heemsbergen, J., Jordan, H., Mawhood, L., et al. (1989). Autism diagnostic observation schedule: a standardized observation of communicative and social behavior. Journal of Autism and Developmental Disorders, 19(2), 185-212.
Lord, C., Rutter, M., & Le Couteur, A. (1994). Autism Diagnostic Interview-Revised: a revised version of a diagnostic interview for caregivers of individuals with possible pervasive developmental disorders. Journal of Autism and Developmental Disorders, 24(5), 659-685.
Malach, R., Amir, Y., Harel, M., & Grinvald, A. (1993). Relationship between Intrinsic Connections and Functional Architecture Revealed by Optical Imaging and in-Vivo Targeted Biocytin Injections in Primate Striate Cortex. Proceedings of the National Academy of Sciences of the United States of America, 90(22), 10469-10473.
Manjaly, Z. M., Bruning, N., Neufang, S., Stephan, K. E., Brieber, S., Marshall, J. C., et al. (2007). Neurophysiological correlates of relatively enhanced local visual search in autistic adolescents. Neuroimage, 35(1), 283-291.
Manjaly, Z. M., Marshall, J. C., Stephan, K. E., Gurd, J. M., Zilles, K., & Fink, G. R. (2003). In search of the hidden: an fMRI study with implications for the study of patients with autism and with acquired brain injury. Neuroimage, 19(3), 674-683.
Mottron, L., Burack, J. A., Iarocci, G., Belleville, S., & Enns, J. T. (2003). Locally oriented perception with intact global processing among adolescents with high-functioning autism: evidence from multiple paradigms. Journal of Child Psychology and Psychiatry and Allied Disciplines, 44(6), 904-913.
Navon, D. (1981). The Forest Revisited: More on Global Precedence. Psychological research, 43, 1-32.
Plaisted, K., Swettenham, J., & Rees, L. (1999). Children with autism show local precedence in a divided attention task and global precedence in a selective attention task. Journal of Child Psychology and Psychiatry and Allied Disciplines, 40(5), 733-742.
Polat, U. (1999). Functional architecture of long-range perceptual interactions. Spatial Vision, 12(2), 143-162.
Rinehart, N. J., Bradshaw, J. L., Moss, S. A., Brereton, A. V., & Tonge, B. J. (2000). Atypical interference of local detail on global processing in high-functioning

Chapter 6
130
autism and Asperger's disorder. Journal of Child Psychology and Psychiatry and Allied Disciplines, 41(6), 769-778.
Roelfsema, P. R. (2006). Cortical algorithms for perceptual grouping. Annual Review of Neuroscience, 29, 203-227.
Roelfsema, P. R., Lamme, V. A. F., Spekreijse, H., & Bosch, H. (2002). Figure-ground segregation in a recurrent network architecture. Journal of Cognitive Neuroscience, 14(4), 525-537.
Ropar, D., & Mitchell, P. (2001). Susceptibility to illusions and performance on visuospatial tasks in individuals with autism. Journal of Child Psychology and Psychiatry and Allied Disciplines, 42(4), 539-549.
Schwartz, S., Maquet, P., & Frith, C. (2003). Neural correlates of perceptual learning: A functional MRI study of visual texture discrimination (vol 99, pg 17137, 2002). Proceedings of the National Academy of Sciences of the United States of America, 100(9), 5573-5573.

Nederlandse samenvatting
131
Nederlandse samenvatting (Summary in Dutch) Autisme Spectrum Stoornis (ASS) is een sterk genetisch bepaalde, neurobiologische ontwikkelingsstoornis, die wordt gekenmerkt door verschillende afwijkingen in het gedrag. Deze gedragskenmerken zijn onder te verdelen in drie categorieën: atypische sociale interactie, beperkte communicatieve vaardigheden en stereotype gedragingen. Het besef groeit dat, naast deze afwijkende cognitieve karakteristieken, mensen met een ASS ook atypische perceptuele vaardigheden hebben, zoals het versterkt waarnemen van details en, daarmee samenhangend, het minder goed waarnemen van globale gehelen. Ondanks dat ASS een biologische oorsprong heeft, is er nog geen vaststaande neurobiologische verklaring gevonden voor de afwijkende visuele waarneming in ASS. In mijn proefschrift heb ik getracht een duidelijk te omschrijven, neurale oorzaak te vinden voor dit aspect van ASS. We hebben 13 proefpersonen met ASS en 31 controle proefpersonen gemeten op twee visuele taken (zie hieronder). De proefpersonen met ASS waren geselecteerd op basis van een diagnose gesteld door een psychiater (aan de hand van de DSM-IV criteria voor ASS, vijf proefpersonen kregen de diagnose autisme en acht proefpersonen kregen de diagnose Asperger), een gestandaardiseerde en internationaal erkende gedragsobservatie en een ouderinterview. De controle proefpersonen waren op groepsniveau gematched met de ASS proefpersonen op basis van IQ (gemiddeld 120), leeftijd (gemiddeld 21) en geslacht (2 vrouwen in de ASS groep en 3 vrouwen in de controle groep). Aan de hand van twee verschillende paradigma’s hebben we in ons onderzoek specifieke hypotheses getoetst die atypische visuele perceptie kunnen verklaren. In een eerste experiment (Hoofdstuk 2) hebben we globale informatie verwerking getoetst, wat hier gedefinieerd was als het integreren van bewegende elementen over de ruimte. We hebben gebruik gemaakt van bewegende stimuli bestaande uit twee apart van elkaar bewegende rasters. De stimuli konden op twee manieren worden geïnterpreteerd: de elementen bewogen los van elkaar of de stimulus kon gezien worden als een coherent bewegend patroon. Voor deze laatste perceptuele interpretatie is het integreren van de bewegende elementen over de ruimte van belang. Aangezien er eerder evidentie was gevonden voor een probleem met het integreren van bewegende stimulus onderdelen, werd verwacht dat mensen met een ASS minder vaak dan controles de stimuli als een coherent bewegend geheel zouden zien. Echter, in onze studie vonden wij dat er geen verschillen waren tussen mensen met een ASS en controle proefpersonen. Aangezien het bewegingssignaal in onze studie bestond uit laag spatiele frequenties (van belang voor globale stimulus kenmerken) en in vorige studies de bewegende stimuli opgebouwd waren uit hoog spatiele frequenties (van belang voor het waarnemen van details) vermoedden wij dat het uitblijven van een verschil tussen de twee groepen te maken heeft met het verwerken van spatiele frequenties. Daarbij is er inderdaad

Summary in Dutch
132
evidentie voor atypische verwerking van spatiele frequenties in mensen met ASS. Verder onderzoek is nodig om na te gaan of het correct detecteren van coherente beweging inderdaad afhankelijk is van de spatiele frequentie inhoudt van een stimulus. Met het tweede paradigma zijn we in Hoofdstuk 3 tot 5 nagegaan of de balans tussen verschillende neurale interacties, van belang voor detail en globale waarneming, verstoord is in ASS. De neurale interacties waar het om gaat zijn zogenaamde feedforward, horizontale en feedback interacties tussen neuronen in de visuele schors. Feedforward verbindingen lopen van lage (V1) naar hoge (V2, V4 en verder) visuele gebieden en feedback verbindingen transporteren neural signalen van de hoge visuele gebieden terug naar de lage visuele gebieden; horizontale verbindingen lopen tussen neuronen binnen een bepaald gebied. In een model van Hochstein en Ahissar (2002) wordt beschreven dat door middel van feedforward interacties globale, categoriale aspecten (bv. een gezicht) van een visuele scène in kaart worden gebracht, terwijl feedback interacties juist zorgen voor het implementeren van details en het maken van onderscheid tusen objecten binnen een categorie (welk gezicht). Gezien het belang van feedforward en feedback interacties in globale en detail waarneming respectievelijk, wilden wij deze interacties onderzoeken in mensen met ASS. We verwachtten dat er een disbalans zou zijn in de relatieve sterkte van de interacties met als gevolg versterkte detail waarneming bij deze patiënten. We hebben gebruik gemaakt van een model dat specifieke voorspellingen doet over de relatieve bijdrage van feedforward, feedback en ook horizontale interacties in het onderscheiden van figuren van elkaar en hun achtergrond, i.e. figuur-grond scheiding. Aangezien dit model is gebaseerd op neurofysiologische bevindingen bij apen en het een nauwkeurige omschrijving geeft van de relatieve bijdrage van de verschillende corticale interacties in visuele waarneming, werd het model geschikt geacht voor het bepalen van de balans tussen feedforward, horizontale en feedback verwerking in mensen met ASS. Proefpersonen deden een textuur segregatie taak met drie verschillende stimuli (zie Figuur 1) die gemaakt waren van korte zwarte lijnelementen, met een specifieke oriëntatie, op een witte achtergrond: een homogene stimulus (alle lijnelementen hadden dezelfde oriëntatie), een ‘kader’ stimulus en een ‘stapel’ stimulus. In een kader stimulus was een lijst te zien van lijnelementen met een andere oriëntatie dan de lijnen op de achtergrond. Bij een stapel stimulus was eenzelfde lijst geprojecteerd op een achtergrond, maar nu hadden de lijnelementen aan de binnenkant van de lijst een andere, derde oriëntatie in vergelijking met de lijnen op de achtergrond. Hierdoor leek de stimulus op een stapel van twee vierkanten, gemaakt van verschillende lijnoriëntaties op een achtergrond met lijnelementen van een derde oriëntatie. In totaal zijn vier verschillende oriëntaties gebruikt, die gebalanceerd over de drie stimuli werden toegepast. Met behulp van verschillende stimulus contrasten konden twee onderdelen van figuur-grond scheiding uit elkaar worden gehaald, namelijk het detecteren van randen en het detecteren van oppervlaktes.

Nederlandse samenvatting
133
Figuur 1. Voorbeelden van de drie textuur stimuli die gebruikt zijn in de experimenten van hoofdstuk 3, 4 en 5. De stimuli verschillen in het aantal randovergangen en in de mate waarin een oppervlakte waargenomen wordt. De twee sets van kader en homogene stimuli zijn beiden gemiddeld opgebouwd uit de dezelfde lijnelementen, het enige verschil is dat in de kader stimuli ook nog een discontinuïteit te zien is, namelijk daar waar twee verschillende oriëntaties elkaar ontmoeten bij de randen. Wanneer hersensignalen voor deze stimuli met elkaar vergeleken worden, zullen de kader stimuli een extra response opwekken, gerelateerd aan het verwerken van randen. Eerder onderzoek heeft aangetoond dat het detecteren van zulke randen tot stand komt door horizontale interacties tussen neuronen. Deze informatie wordt via feedforward verbindingen doorgegeven van lage naar hoge visuele gebieden. Stapel stimuli bevatten evenveel randovergangen als kader stimuli; het enige verschil tussen deze stimuli is dat de stapel stimulus een extra oppervlak bevat, namelijk de lijnelementen met een derde oriëntatie aan de binnenkant van het kader. Wanneer hersensignalen van stapel en kader stimuli met elkaar worden vergeleken zal de verschilrespons gerelateerd zijn aan het detecteren van het extra oppervlak (aangezien beide stimuli dezelfde lijnelementen bevatten en dezelfde hoeveelheid randovergangen).

Summary in Dutch
134
Eerder onderzoek toonde aan dat het detecteren van figuuroppervlaktes tot stand komt door feedback van hogere naar lagere visuele gebieden. We hebben nog een extra manipulatie toegevoegd om een parametrisch design te creëren: de dikte van de kaders in kader en stapel stimuli hebben we in drie stappen vergroot (het kader is in Figuur 1 aangegeven met een cirkel). We verwachtten dat het moeilijker zou worden om kader van stapel stimuli te onderscheiden naarmate de kaders dikker werden aangezien het moeilijker zou worden de binnenkant van het kader te vergelijken met de achtergrond. We hebben gebruik gemaakt van gedragsdata (Hoofdstuk 3, 4, 5), een elektrofysiologische meting (EEG, Hoofdstuk 4) en functionele MRI (fMRI, Hoofdstuk 5) om een goed beeld te krijgen van de prestatie, de timing van de neurale interacties en de gebieden die betrokken zijn bij figuur-grond scheiding, en hoe dit verschilt tussen controle proefpersonen en de patiënt populatie. Uit de drie verschillende gedragsmetingen is gebleken dat er inderdaad een afwijking is in de balans tussen feedforward, horizontale en feedback interacties in mensen met ASS. Op basis van deze gedragsdata (Hoofdstuk 3) concludeerden we dat feedback interacties te sterk zouden zijn in mensen met ASS: zij konden kader stimuli minder goed identificeren dan controle proefpersonen en de foute responsies lieten zien dat de ASS proefpersonen kader stimuli verwarden met stapel stimuli. Versterkte feedback zou een goede verklaring kunnen zijn voor deze verwarring tussen kader en stapel stimuli en zou tegelijk ook de onderliggende oorzaak van versterkte detail waarneming kunnen zijn. Interessant was dat de proefpersonen bij een tweede en derde meting steeds beter werden en uiteindelijke het zelfde prestatie niveau haalden voor kader stimuli als de controle proefpersonen. Dit is een belangrijke bevinding omdat het implicaties kan hebben voor gedragstherapie voor mensen met ASS. Onderzoek heeft bijvoorbeeld laten zien dat deze patiënten meer moeite hebben met het correct waarnemen van gezichten en emoties in gezichten. Mogelijk kunnen bepaalde perceptuele vaardigheden aangeleerd worden wat het probleem in gezichtsverwerking zou kunnen verhelpen. De EEG (Hoofdstuk 4) data lieten zien dat de subtractie kader vs. homogene stimuli verminderde hersenactiviteit opwekte bij mensen met ASS. Aangezien dit stimulus contrast gerelateerd is aan randdetectie wat tot stand komt door horizontale verbindingen tussen neuronen in vroege visuele gebieden, concludeerden wij dat horizontale interacties niet goed functioneren in mensen met ASS. Een extra interessante bevinding was dat later in de tijd, in hoger gelegen gebieden, verwerking van de kader stimuli versterkt was bij mensen met ASS in vergelijking met de controle proefpersonen. De feedback activiteit, gemeten met het stapel vs. kader contrast, bleek normaal te zijn in de ASS groep. Met behulp van de fMRI data (Hoofdstuk 5) konden we aantonen dat de afwijking in horizontale verbindingen zijn oorsprong had in Brodmann areas 17, 18 en 19. Daarbij vonden we dat versterkte hersenactiviteit voor kader stimuli in hoger gelegen gebieden voort kwam uit de gyrus angularis. Interessant was dat het patroon van activatie sterk verschilde tussen de ASD en de controle groep:

Nederlandse samenvatting
135
in de ASD groep nam de activiteit toe naarmate de stimuli moeilijker de identificeren waren terwijl in de controle groep de activiteit juist af nam. Op basis van de literatuur kan dit verschil in activiteit toegeschreven worden aan het richten van de aandacht op respectievelijk lokale vs. globale stimulus kenmerken. We vermoeden dat het patroon een compensatie mechanisme voor de eerdere problemen in horizontale interacties weergeeft. Het patroon en de locatie van activiteit kwam sterk overeen met de EEG bevindingen en ook al in een eerder onderzoek was er evidentie gevonden voor een compensatie mechanisme. We concludeerden daarom dat de combinatie tussen verstoorde vroege visuele informatie verwerking en een compensatie mechanisme typisch zou kunnen zijn voor de fysiologie van visuele waarneming bij mensen met ASS. Een afwijking in horizontale verbindingen komt goed overeen met eerdere theorieën en voorspellingen uit de literatuur over de neurale oorzaak van afwijkende visuele waarneming bij mensen met ASS. Bovendien is uit genetica en neuropathologie onderzoek gebleken dat inhibitie tussen neuronen door middel van horizontale verbindingen ook verstoord zou kunnen zijn in andere, hoger gelegen gebieden in de hersenen van mensen met ASS. Wij vermoeden daarom dat het deficiet wat wij hebben gevonden een algemeen neurobiologische oorzaak zou kunnen zijn voor ASS. Het zou interessant zijn deze verbindingen verder te onderzoeken, zowel met betrekking tot visuele waarneming als ook met betrekking tot hogere, cognitieve aspecten van ASS. Bij het interpreteren van de resultaten en conclusies uit dit proefschrift is het belangrijk om een aantal zaken in gedachten te houden, met name enkele tekortkomingen in het onderzoek wat is uitgevoerd. Ten eerste is de relatie tussen figuur-grond scheiding en detail/globale waarneming niet direct te leggen. Zoals hierboven vermeld hebben we een figuur-grond scheidingstaak gekozen omdat feedforward, horizontale en feedback interacties hiermee goed konden worden getoetst. Echter, de belangrijkste bevinding, namelijk afwijkingen in randdetectie door horizontale verbindingen, is niet direct te relateren aan versterkte detail waarneming. Wel is uit eerder onderzoek gebleken dat horizontale interacties een belangrijke rol spelen bij het groeperen van stimulus kenmerken. Afwijkingen in horizontale verbindingen geven dus een verklaring voor dit aspect van afwijkende perceptie bij mensen met ASS. Een ander probleem van de huidige studies is dat we aan de hand van de gedragsdata concludeerden dat feedback interacties te sterk zijn, terwijl de EEG en fMRI data juist duidden op afwijkende horizontale verbindingen. Het is belangrijk te benadrukken dat bij geen van beiden conclusies de ander uitsluit. Ten eerste werd de conclusie uit de gedragsdata getrokken op basis van de eerste meetsessie, terwijl de EEG en fMRI metingen op deze sessie volgden. Door leren van visuele taken kunnen neurale interacties veranderen: dit heet ‘perceptueel leren’ en effecten van perceptueel leren werden in andere studies al gevonden 24 uur na een eerste uitgebreide oefensessie. Bovendien kunnen de veranderingen in verbindingen gedurende maanden blijven

Summary in Dutch
136
bestaan. We weten niet hoe de hersenactiviteit voor horizontale en feedback verwerking tijdens de eerste meting eruit heeft gezien. Daarbij zou het zo kunnen zijn dat het compensatie mechanisme, sterke lokaal spatiele aandacht vanuit de gyrus angularis, voor sterke feedback zorgde in de eerste meting. De mogelijkheid dat een compensatie mechanisme (voor disfunctioneren van horizontale verbindingen) door middel van feedback tot de focus op details leidt bij mensen met ASS moet in ogenschouw genomen worden. We kunnen concluderen uit het onderzoek in dit proefschrift dat vroeg in de tijd (120 ms) en in lage occipitale gebieden (BA 17, 18, 19) verwerking van visuele informatie bij mensen met ASS verstoord is in vergelijking met gezonde proefpersonen. Specifieker schrijven we deze afwijking toe aan disfunctioneren van horizontale verbindingen. Echter, dit kan gecompenseerd worden door het richten van de aandacht op spatiele details vanuit de gyrus angularis. Verder onderzoek naar perceptueel leren, horizontale verbindingen en een compensatie mechanisme bij visuele waarneming lijkt aangewezen om onze kennis over ASS te verdiepen.

Dankwoord
137
Dankwoord All in! In de afgelopen jaren heb ik geleerd dat dit een belangrijk motto is voor zowel pokeren als promoveren. Ik ben blij dat ik dit motto tijdens beide activiteiten heb kunnen toepassen (af en toe, anders ga je failliet). Dat was mogelijk dankzij de mensen in mijn directe omgeving. Allereerst gaat mijn dank uit naar mijn promotoren en co-promotor: Prof. Dr. H. van Engeland, Prof. Dr. C. Kemner, Prof. Dr. V..A.F. Lamme en Dr. H.S. Scholte. Herman, dank je wel voor je belangstelling in mij en voor mijn onderzoek. Met vragen over de planning van de laatste paar maanden kon ik bij jou terecht, zelfs bij je thuis in Montfoort. Mijn fiets is nog steeds niet gestolen! Chantal, dank je wel voor je enthousiasme. Een overleg met jou leidde vaak tot interessante inzichten in de relatie tussen onze resultaten en eerder onderzoek. Ik ben heel blij geweest met jouw begeleiding. Ongelooflijk hoe snel je nuttig commentaar op mijn stukken terug mailde. Dank je wel dat je mij zo goed stimuleerde. Victor, dank je wel voor je vertrouwen in mij. Ik moest altijd erg lachen om uitspraken van jou zoals: “Als zelfs ik snap hoe die analyse moet, dan moet jij het al helemaal kunnen”. Ze gaven steeds weer moed om door te gaan: All in! Je had alleen niet verteld dat dit bij poker een financieel risico met zich mee brengt... Ik bewonder je heel erg om je snelle inzicht en brede kennis. Ik heb dan ook veel van je geleerd. Steven, dank je wel voor je eindeloze optimisme. Wanneer ik wel eens dacht nu toch echt een hele dataset of analyse verknoeid te hebben, wist jij zo’n draai te geven aan de interpretatie van de resultaten dat ik binnen 5 minuten al weer vrolijk op mijn stoel zat. Dank je wel dat ik altijd bij je aan kon kloppen. De leden van de beoordelingscommissie, Dr. P. de Weerd, Prof. Dr. M.N. Verbaten, Prof. Dr. J.L. Kenemans, Prof. Dr. O. van Nieuwenhuizen en Prof. Dr. N.F. Ramsey, wil ik graag bedanken voor het lezen en beoordelen van mijn proefschrift en natuurlijk voor het opponeren op 22 mei. Mijn proefpersonen dank ik hartelijk voor hun inzet en toewijding. Iedereen is minstens drie keer naar Amsterdam gekomen voor metingen die vaak enkele uren in beslag namen. Ook van jullie heb ik veel geleerd, bedankt! Collega’s van het UMC, ik wil jullie graag bedanken voor jullie interesse, de gezelligheid en vooral de lol tijdens de uitjes, dansend op rollerskates, een kookcursus of gewoon in de kroeg. Maurice, ik keek altijd uit naar even bijkletsen met jou, over ons onderzoek of hele andere zaken. Ik hoop dat we af en toe nog gaan salsa dansen! Liefste collega’s van psychonomie, ik had me geen betere collega’s kunnen wensen. Hilde, wat fijn om met jou over autisme onderzoek en heel veel andere dingen te kunnen praten. Romke, dank je wel voor de gesprekken over een toekomst al dan niet in de wetenschap. Lucia, ik kijk uit naar volgende salsa avondjes! De ‘andere

Dankwoord
138
hoekkamer’, Mante, Marte, Petra, Titia en Andries, wil ik graag bedanken voor de onuitputtelijke hoeveelheid oergezellige lunches, borrels, feestjes en etentjes. Ellen en Hubert, bedankt dat jullie altijd voor mij klaar stonden. TOP’ers, Marcus, Nico, Bert en GJ, bedankt voor de onontbeerlijke ondersteuning. Mijn mede-Lammetjes, wat heb ik een goede tijd gehad met jullie! Johannes, heel erg bedankt voor je hulp ‘met computers’ en natuurlijk programmeren. Maar, nog belangrijker, dank je wel voor de goede gesprekken waar ik veel aan had en van geleerd heb (ook over alle ‘Willem Wever Weetjes’!). Ik wens je veel plezier en succes voor de toekomst. Ilja, het was gezellig met jou als bureau-genootje en ik ben blij af en toe als ‘praatbaak’ gefunctioneerd te hebben. Met veel bewondering luisterde ik naar je wetenschappelijke uiteenzettingen. Ik hoop dat je bij je droombaan terecht zult komen. Simon, ik was altijd blij met een telefoontje van jou van beneden voor een kop koffie. Dank je wel voor je hartelijkheid en gezelschap. Jouw tips over data analyse, correlaties en grafieken volgde ik graag op; je bent een top-collega! Martijn, wat super dat we zelfs ook nog heel even samen AiO zijn geweest aan de UvA. Ik ben heel blij dat ik jou zeven jaar geleden onder het genot van een broccoli heb leren kennen. Ik hoop in een volgende baan net zulke fijne collega’s te krijgen... Lieve ‘VU meiden’, dank je wel voor jullie eeuwige interesse voor mijn promotieonderzoek. Een avondje met jullie gaf altijd de welkome afleiding. Ik kijk uit naar alle etentjes, feestjes en vakanties die nog zullen komen! Liefste vriendinnen, Marthe Lot, twee jaar van mijn promotietijd woonde ik bij jou. Promoveren en samenwonen heeft ons nóg dichterbij elkaar gebracht en ik heb het gevoel dat er nog heel veel goeds zal komen. Je zit ook heel diep in mijn hart! Marit, weet je nog hoe neuronen signalen aan elkaar doorgeven?! Ik ben zo blij met jou als vriendin. Dank je wel voor je steun, je lieve woorden en je gekkigheid! Goedele, mijn liefste ‘lichtje’, we kwamen samen als 18-jarigen in Amsterdam, nu zijn we allebei bijna gepromoveerd. Ik kijk uit naar de volgende stap die we ‘samen’ zullen maken. Bellis, dank je wel voor de uren en uren gezellig kletsen in de kroeg, over promoveren, een toekomstige baan en... over eigenlijk alles. Ik hoop dat we dat nog vaak zullen doen! Lieve Lisette en Wiesje, op afstand heb ik ook aan jullie veel gehad de afgelopen vier jaar. Bedankt voor al jullie belangstellende telefoontjes en steunende woorden! Mijn Paranimfen, Simon en Marthe Lot, heel erg bedankt voor jullie hulp in deze spannende tijd. Ik kijk uit naar een biertje met jullie in Wilhelmina Dok! Lieve Karianne en Annelinde, jullie zijn zulke bijzondere en lieve zussen, ik ben super trots op jullie. Ik ben heel blij dat we elkaar nu zoveel kunnen zien. Kari, dank je wel voor je fijne hulp met de kaft. Anne, bedankt voor de gezellige uurtjes op de UvA toen de loodjes het zwaarst waren.

Nederlandse samenvatting
139
Lieve papa en mama, wat fijn dat jullie mijn ouders zijn. Ik heb zo ontzettend veel aan jullie gehad de afgelopen vier jaar. Jullie steun, vertrouwen en liefde hebben mij gemaakt tot wie ik nu ben en daar ben ik jullie heel dankbaar voor. Lieve Daan, je had gelijk, jouw levensmotto geldt ook voor mijn promotie: alles komt altijd goed. Maar, daar wil ik nog graag aan toevoegen: dankzij jou als mijn eigen wereldkampioen!

Dankwoord
140
Curriculum Vitae
141
Curriculum Vitae Myriam Waldina Giovanna Vandenbroucke werd geboren op 10 februari 1980 in Den Haag. Zij groeide op in Utrecht waar ze in 1998 eindexamen deed op het Christelijk Gymnasium Utrecht. Daarna begon zij met de opleiding Psychologie aan de Universiteit van Amsterdam. Tijdens haar studie was zij werkzaam als onderzoeksassistent op het Instituut voor de Lerarenopleiding (ILO) te Amsterdam. In 2001 liep zij enkele maanden stage op het Institute of Cognitive Neuroscience in Londen. Daarna deed zij haar afstudeeronderzoek op het VU Medisch Centrum naar interindividuele verschillen in functionele MRI activiteit bij oudere mensen. In juni 2003 behaalde zij haar doctoraalgetuigschrift Psychologie in de afstudeerrichting Psychonomie. Aansluitend startte zij haar promotieonderzoek naar de neurale basis van afwijkende visuele perceptie bij mensen met een Autisme Spectrum Stoornis op de afdeling Kinder- en Jeugdpsychiatrie van het UMC Utrecht, in samenwerking met de afdeling Psychologie van de Universiteit van Amsterdam. Myriam Waldina Giovanna Vandenbroucke was born on February 10th 1980 in The Hague. She grew up in Utrecht where she graduated at the Christelijk Gymnasium Utrecht. Thereafter she started studying Psychology at the University of Amsterdam. During her studies she worked as a research assistant at the Graduate School of Teaching and Learning (ILO) in Amsterdam. In 2001 she went to London for a traineeship at the Institute of Cognitive Neuroscience. Thereafter, she did an internship at the VU Medical Centre on interindividual differences in functional MRI activity in elderly people. In June 2003 she graduated in Psychology with a major in Psychonomics. Following, she started her PhD project on the neural basis of atypical visual perception in people with Autism Spectrum Disorder at the department of Child and Adolescent Psychiatry of the UMC Utrecht, in collaboration with the department of Psychology of the University of Amsterdam.

Curriculum Vitae
142

Publications
143
Publications - Vandenbroucke, M.W.G., Scholte, H.S., van Engeland, H., Lamme, V.A.F.,
Kemner, C. (in press). A new approach to the study of atypical visual perception in Autism Spectrum Disorder: inverstigating visual feedforward, horizontal and feedback processing. Vision Research, Doi: 10.1016/ j.visres.2007.12.017.
- Vandenbroucke, M.W.G., Scholte, H.S., van Engeland, H., Lamme, V.A.F.,
Kemner, C. (2008). A neural substrate for atypical low-level visual processing in Autism Spectrum Disorder. Brain , Epub ahead of print, January 11th.
- Vandenbroucke, M.W.G., Scholte, H.S., van Engeland, H., Lamme, V.A.F.,
Kemner, C. (2007). Coherent versus Component Motion Processing in Autism Spectrum Disorder, Journal of Autism and Developmental Disorders, Epub ahead of print, October 19th.
- Vandenbroucke, M.W.G., Goekoop, R., Duschek, J.J., Netelenbos, J.C., Kuijer,
J.P.A., Barkhof, F., Scheltens Ph, Rombouts, S.A.R.B. (2004). Interindividual differences of medial temporal lobe activation during encoding in an elderly population studied by fMRI, NeuroImage, 21(1), p. 173 – 180.
- Kristjansson, A., Vandenbroucke, M.W.G., Driver, J. (2004). When pro’s
become cons for anti- versus prosaccades: factors with opposite or common effects on different saccade types, Experimental Brain Research, 155(2), p. 231-244.

Publications
144
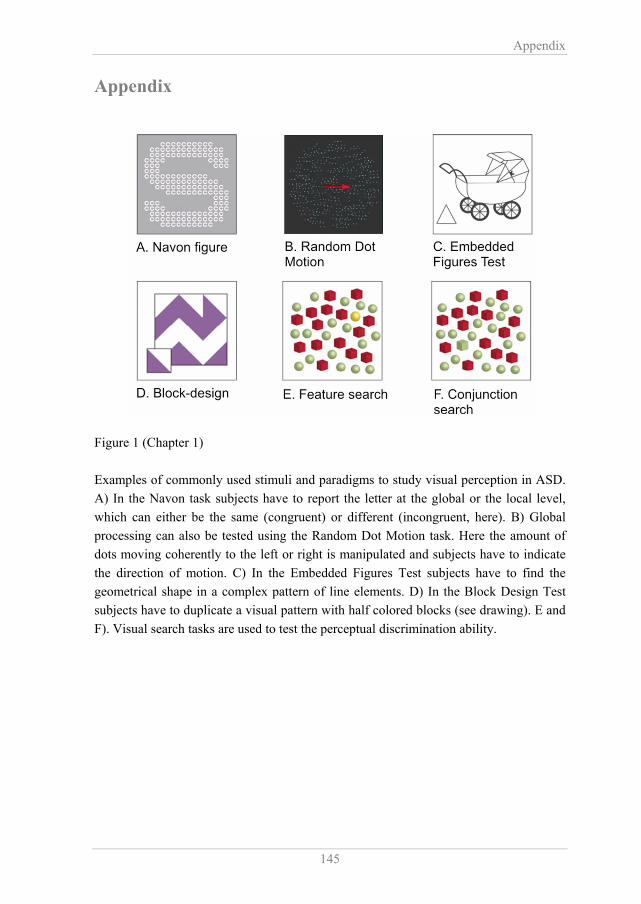
Appendix
145
Appendix Figure 1 (Chapter 1) Examples of commonly used stimuli and paradigms to study visual perception in ASD. A) In the Navon task subjects have to report the letter at the global or the local level, which can either be the same (congruent) or different (incongruent, here). B) Global processing can also be tested using the Random Dot Motion task. Here the amount of dots moving coherently to the left or right is manipulated and subjects have to indicate the direction of motion. C) In the Embedded Figures Test subjects have to find the geometrical shape in a complex pattern of line elements. D) In the Block Design Test subjects have to duplicate a visual pattern with half colored blocks (see drawing). E and F). Visual search tasks are used to test the perceptual discrimination ability.

Appendix
146
Figure 3 (Chapter 1) Contextual modulation (shaded region): the response of a V1 neuron is relatively enhanced when it has its receptive field on a figure (left), compared to when compared to when it is stimulated by identical background elements (right). (This figure is modified from Roelfsema et al., 2002).

Appendix
147
Figure 1 (Chapter 3) A) Example of a texture defined stimulus. B) In the model of Roelfsema et al. (2002) activity in feedforward, horizontal and feedback connections is essential for the perception of a figure on a background (‘Input’, schematic representation of A). Different grey levels represent different line orientations.

Appendix
148
Figure 3 (Chapter 4) A) The subtractions for the three different border widths of frame stimuli that were made to isolate activity related to boundary detection. Legend for C. Different gray levels represent different line orientations (not all line orientations are shown). B) Activation maps of the frame – homogeneous contrast for the control group, pooled over the three levels of border width. C) The graphs represent the subtraction waves frame – homogeneous for the three conditions at central occipital sites (O1, O2, Oz; controls left; ASD right). During the time window related to boundary detection, indicated by the gray panels, activity was strongly diminished for subjects with ASD compared to controls. D) Activation maps of the frame – homogeneous contrast for the ASD group, pooled over the three levels of border width.
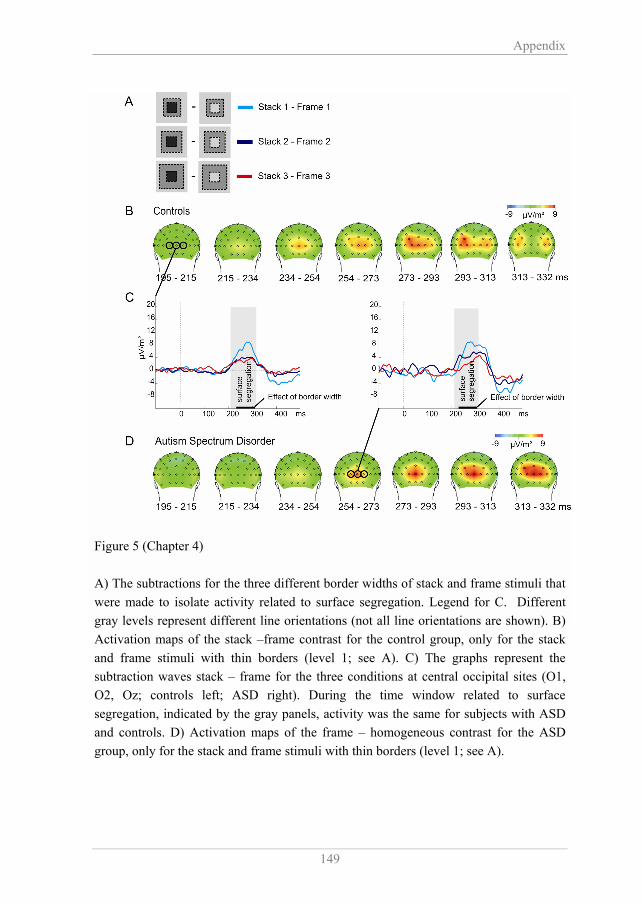
Appendix
149
Figure 5 (Chapter 4) A) The subtractions for the three different border widths of stack and frame stimuli that were made to isolate activity related to surface segregation. Legend for C. Different gray levels represent different line orientations (not all line orientations are shown). B) Activation maps of the stack –frame contrast for the control group, only for the stack and frame stimuli with thin borders (level 1; see A). C) The graphs represent the subtraction waves stack – frame for the three conditions at central occipital sites (O1, O2, Oz; controls left; ASD right). During the time window related to surface segregation, indicated by the gray panels, activity was the same for subjects with ASD and controls. D) Activation maps of the frame – homogeneous contrast for the ASD group, only for the stack and frame stimuli with thin borders (level 1; see A).
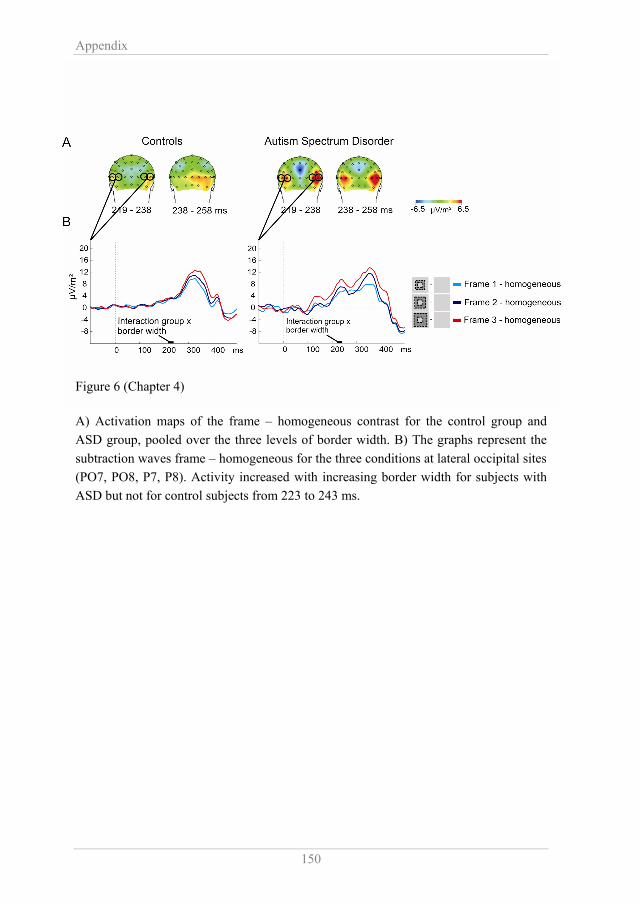
Appendix
150
Figure 6 (Chapter 4) A) Activation maps of the frame – homogeneous contrast for the control group and ASD group, pooled over the three levels of border width. B) The graphs represent the subtraction waves frame – homogeneous for the three conditions at lateral occipital sites (PO7, PO8, P7, P8). Activity increased with increasing border width for subjects with ASD but not for control subjects from 223 to 243 ms.

Appendix
151
Figure 4 (Chapter 5) Activated regions where the control group displayed more activity than the ASD group (C > A, top) and regions which showed enhanced activation in the ASD group compared to controls (A > C, bottom) on the figure-ground contrast, i.e. (stack + frame) - homogeneous.