On the need for a better test method dry or ... - TenCate Geo
14
GSI White Paper #31 “On the Need for a Better Test Method Than Dry or Wet Sieving to Obtain the Characteristic Opening Size for Geotextile Filter Design Purposes” by Robert M. Koerner, Ph.D., P.E., NAE George R. Koerner, Ph.D., P.E., CQA Director Emeritus – Geosynthetic Institute Director – Geosynthetic Institute [email protected] [email protected] September 18, 2014 Geosynthetic Institute 475 Kedron Avenue Folsom, PA 19033-1208 USA TEL (610) 522-8440 FAX (610) 522-8441 GSI GRI GII GAI GEI EI GCI
Transcript of On the need for a better test method dry or ... - TenCate Geo

GSI White Paper #31
“On the Need for a Better Test Method Than Dry or Wet Sieving to Obtain
the Characteristic Opening Size for Geotextile Filter Design Purposes”
by
Robert M. Koerner, Ph.D., P.E., NAE George R. Koerner, Ph.D., P.E., CQA
Director Emeritus – Geosynthetic Institute Director – Geosynthetic Institute
[email protected] [email protected]
September 18, 2014
Geosynthetic Institute 475 Kedron Avenue
Folsom, PA 19033-1208 USA
TEL (610) 522-8440
FAX (610) 522-8441
GSI
GRI
GII
GAI
GEI
EI
GCI

On the Need for a Better Test Method Than Dry or Wet Sieving to Obtain the
Characteristic Opening Size for Geotextile Filter Design Purposes
Background
The need for retaining the upstream soil particles on the openings of a geotextile filter
(but not excessively clogging it) was first observed by Bob Barrett of Carthage Mills Co. in the
1960’s. Using intuitive knowledge he co-opted Charles Calhoun of the U.S. Army Corps of
Engineers to devise a test method for geotextile design purposes. As the test evolved over time,
and is now embodied as ASTM D4751, the method successively exposes a specimen to
sequentially larger uniform-sized glass beads using a Ro-Tap sieve shaker searching for the bead
size at which less than 5% passes through the test specimen. This is called the O95 of the
geotextile being evaluated in units of millimeters. It is customarily converted to the nearest U.S.
sieve size value, e.g., #40, #70, #100, etc. and is then called the apparent opening size, or AOS.
Figure 1 shows the general laboratory setup. The test and its resulting value of O95 is used in
design in the USA and some other countries.
Figure 1 - Laboratory setup for dry glass bead sieving for the characteristic opening size of
geotextile filter per ASTM D4751.
The AOS test just described is considered by the authors to be quite inaccurate, but simplicity of
the test and its inertia seems to sustain its use in the United States. Some of the problems associated with
the test are as follows:
Sieves
Being
Shaken
Bottom Pan With
Beads That Passed Fabric
Fabric Being Evaluated
The test is conducted dry, whereas filtration and drainage always involve liquids.
The glass beads can easily get trapped in the geotextile itself (particularly in thick
nonwovens) and not pass through at all.
Electrostatic charges often result with the finer glass beads clinging to the inside of the
sieve (even with the application of an anti-static spray on the geotextile) and not
participating in the test at all.
The test allows glass beads to pass through larger size openings that may or may not
correspond to the opening size traveled through.
Yarns in some geotextiles easily move with respect to one another (as they tend to do in
woven slit-film geotextiles), thereby allowing the beads to pass through an enlarged void
not representative of the complete geotextile test specimen.
The test is directed only at the 5% size (equivalent to the 95% passing size), which allows
for determination of the O95 size. The remainder of the pore sizes are not defined.
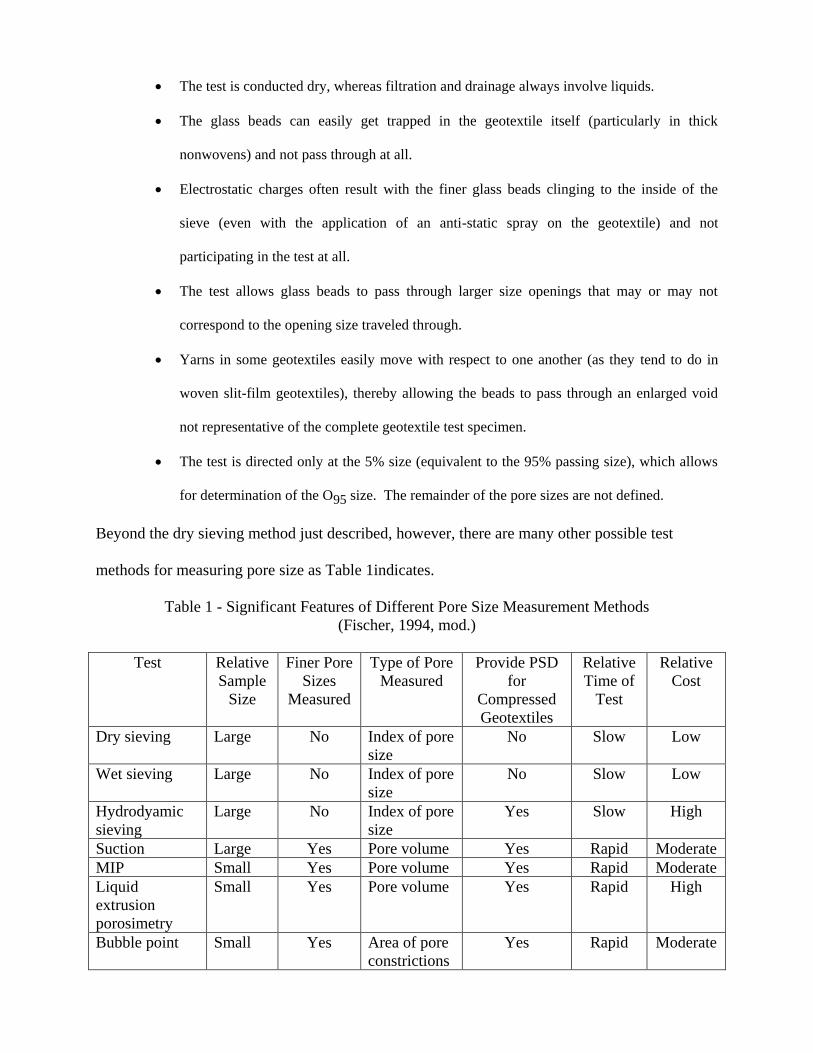
Beyond the dry sieving method just described, however, there are many other possible test
methods for measuring pore size as Table 1indicates.
Table 1 - Significant Features of Different Pore Size Measurement Methods
(Fischer, 1994, mod.)
Test Relative
Sample
Size
Finer Pore
Sizes
Measured
Type of Pore
Measured
Provide PSD
for
Compressed
Geotextiles
Relative
Time of
Test
Relative
Cost
Dry sieving Large No Index of pore
size
No Slow Low
Wet sieving Large No Index of pore
size
No Slow Low
Hydrodyamic
sieving
Large No Index of pore
size
Yes Slow High
Suction Large Yes Pore volume Yes Rapid Moderate
MIP Small Yes Pore volume Yes Rapid Moderate
Liquid
extrusion
porosimetry
Small Yes Pore volume Yes Rapid High
Bubble point Small Yes Area of pore
constrictions
Yes Rapid Moderate

Minimum
bubble pressure
technique
Small No Number of
pore
constructions
No Slow High
Image Analysis Small Yes Pore
dimension
Yes Slow High
Capillary flow
porometry
Small Yes Pore surface
tension
Yes Moderate High
The second and third listed methods in Table 1 are wet sieving methods. Some associated
comments in regard to these tests follow:
In Canada (CGSB-148.1) and France, a frame containing the geotextile specimen
has well-graded glass beads placed on it and is repeatedly submerged in water. The
bead fraction that passes is calculated and a O95 equivalent particle size is obtained.
In Germany, the setup is similar but a water spray is used. The soil fraction that
passes as well as an effective opening diameter is calculated.
The ISO 12956 test is also a wet sieving test and (being an ISO test method) is a
major factor in its worldwide implementation.
In addition to above mentioned sieving methods there are also more sophisticated measurement
techniques emerging, including capillary flow, mercury intrusion, and image analysis. Figure 2
illustrates that the differences in pore size measurement of eight of these methods are quite
pronounced. This divergence has significant design implications.
Figure 2 - Pore size distribution using various testing methods (after Bhatia and Smith, 1996).

Geotextile Filter Design Methods
The simplest of the many geotextile filter design procedures determines the percentage of
site-specific soil passing the No. 200 sieve, whose openings are 0.074 mm, and compares it to
the laboratory measured 095 of the candidate filter. According to AASHTO the following is
recommended:
For soil with 50% passing the No. 200 sieve: 095 < 0.60 mm—i.e., a required AOS
of the geotextile No. 30 sieve.
For soil > 50% passing the No. 200 sieve: 095 < 0.30 mm—i.e., a required AOS of the
geotextile No. 50 sieve
To extend this concept further, a number of direct comparisons of different geotextile-opening
sizes (095, 050 or 015) has been made in ratio form to various soil particle sizes to be retained (d90,
d85, d50 or d15); see Christopher and Fischer, 1992. The numeric value of the ratio depends upon
the geotextile type, the soil type, the flow regime, etc. For example, Carroll (1983) recommends
the following:
( )
where d85 is the soil particle size in mm, for which 85% of the total soil is finer.
In contrast to the above mentioned simplified methods, a more comprehensive approach
toward soil retention criteria is given for both steady-state and dynamic flow conditions
(Luettich, et al., 1992). To utilize their graphs one must first characterize the upstream soil, e.g.,
perform a grain-size distribution, along with Atterberg limits and dispersivity properties for the
fine fraction. Numeric examples using the method are given in Koerner (2012), among others.
In all of these methods, and many more as given in Table 2, the resulting design-required
opening size is heavily dependent on a properly simulated laboratory measured value of the same
opening size.
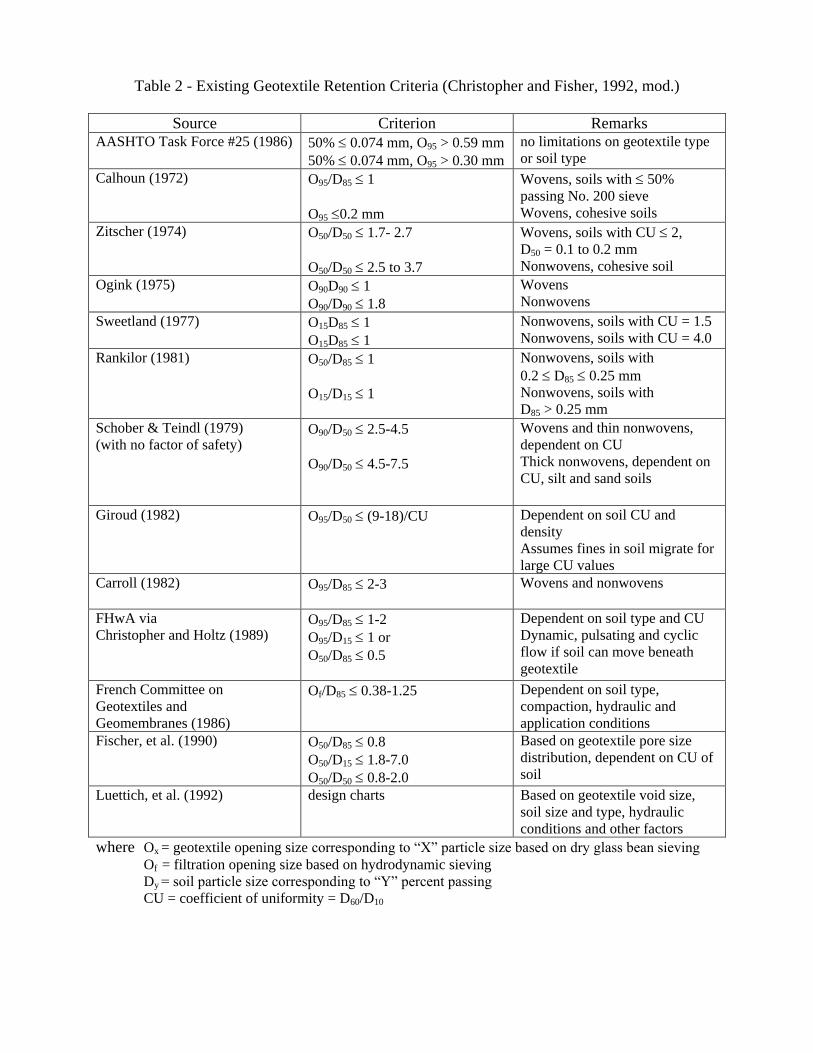
Table 2 - Existing Geotextile Retention Criteria (Christopher and Fisher, 1992, mod.)
Source Criterion Remarks AASHTO Task Force #25 (1986) 50% 0.074 mm, O95 > 0.59 mm
50% 0.074 mm, O95 > 0.30 mm
no limitations on geotextile type
or soil type
Calhoun (1972) O95/D85 1
O95 0.2 mm
Wovens, soils with 50%
passing No. 200 sieve
Wovens, cohesive soils
Zitscher (1974) O50/D50 1.7- 2.7
O50/D50 2.5 to 3.7
Wovens, soils with CU 2,
D50 = 0.1 to 0.2 mm
Nonwovens, cohesive soil
Ogink (1975) O90D90 1
O90/D90 1.8
Wovens
Nonwovens
Sweetland (1977) O15D85 1
O15D85 1
Nonwovens, soils with CU = 1.5
Nonwovens, soils with CU = 4.0
Rankilor (1981) O50/D85 1
O15/D15 1
Nonwovens, soils with
0.2 D85 0.25 mm
Nonwovens, soils with
D85 > 0.25 mm
Schober & Teindl (1979)
(with no factor of safety) O90/D50 2.5-4.5
O90/D50 4.5-7.5
Wovens and thin nonwovens,
dependent on CU
Thick nonwovens, dependent on
CU, silt and sand soils
Giroud (1982) O95/D50 (9-18)/CU
Dependent on soil CU and
density
Assumes fines in soil migrate for
large CU values
Carroll (1982) O95/D85 2-3
Wovens and nonwovens
FHwA via
Christopher and Holtz (1989) O95/D85 1-2
O95/D15 1 or
O50/D85 0.5
Dependent on soil type and CU
Dynamic, pulsating and cyclic
flow if soil can move beneath
geotextile
French Committee on
Geotextiles and
Geomembranes (1986)
Of/D85 0.38-1.25
Dependent on soil type,
compaction, hydraulic and
application conditions
Fischer, et al. (1990) O50/D85 0.8
O50/D15 1.8-7.0
O50/D50 0.8-2.0
Based on geotextile pore size
distribution, dependent on CU of
soil
Luettich, et al. (1992) design charts Based on geotextile void size,
soil size and type, hydraulic
conditions and other factors
where Ox = geotextile opening size corresponding to “X” particle size based on dry glass bean sieving
Of = filtration opening size based on hydrodynamic sieving
Dy = soil particle size corresponding to “Y” percent passing
CU = coefficient of uniformity = D60/D10

Statistical Variations of Opening Size for Bead Sieving Methods
Dierickx and Myles (1996) provided the first insight into the statistical variation of the
three sieving-related opening size test methods. The test methods are shown diagramically in
Figure 3. They used five different materials (see Table 3) and involved numerous worldwide
laboratories to perform comparative testing.
For dry sieving - 5 laboratories participated.
For wet sieving - 8 laboratories participated.
For hydrodynamic sieving - 10 laboratories participated.
(a) Dry sieving (b) Wet sieving
(c) Hydrodynamic sieving
Figure 3. Major test methods based on sieving used to obtain opening sizes of geotextile filters
(ref. Dierickx and Myles, 1996).

Table 3 - Measured Mass and Thickness of the Geotextiles Used by Dierickx and Myles, 1996
Geotextile Mass/Unit Area
(g/m2)
Thickness
(mm)
1. Woven tape PP 130 g/m2
2. Woven monofilament PE/PP 250 g/m2
3. Heat bonded PP 140 g/m2
4. Needle punched PE 150 g/m2
5. Needle punched PE 300 g/m2
118
229
139
142
292
0.50
0.74
0.46
1.30
2.30
Their conclusion was that “the most reliable results of the characteristic opening size are
obtained with the wet sieving procedure”. As a result of their findings this method was used in
Europe and has been adopted as ISO 12956. However, their advice did not sway the ongoing use
of dry sieving in the USA and to this day ASTM D4751 is used exclusively.
Regarding the statistical variation of ASTM D4751, a interlaboratory study of the test
method was performed in 1999. Three sets (five test specimens each) were randomly drawn
from four materials, two woven and two nonwovens. They were tested for apparent opening size
in each of five laboratories. The design of the experiment and an analysis of the data are given in
an ASTM Research Report. It is not generally available (for unknown reasons) and the test
method does not have an accompanying precision and bias statement.
The above said, a more recent perspective on dry sieving can be gained via proficiency
test data generated by the Geosynthetic Accreditation Institute’s-Laboratory Accreditation
Program, or GAI-LAP. As with other standardized tests, geotextile samples were sent to
participating laboratories and statistical data is currently available. The samples sent for
evaluation via ASTM D4751 had properties listed in Table 4.
Table 4 - Measured Mass and Thickness of the Geotextiles Evaluated
Geotextiles Mass/unit area
(g/m2)
Thickness
(mm)
1. Woven PP type (silt film)
2. Woven PP monofilament
3. Nonwoven PP needlepunched
4. Nonwoven PP heat bonded
124
210
101
181
0.51
0.72
1.31
0.47

Samples were sent to twenty-two laboratories with the statistical results for the 095 values shown
in Table 5.
Table 5 - Statistical Results for Characteristic Opening Size (O95) from GAI-LAP Proficiency
Test Program for Various Geotextiles
Geotextile Mean Value
(mm)
Standard Deviation
(mm)
Coef. of Variation
(%)
1. Woven silt film tape
2. Woven monofilament
3. Nonwoven needlepunched
4. Nonwoven heat bonded
0.289
0.317
0.257
0.129
0.039
0.025
0.027
0.09
14
8
10
69
Note: Past GAI-LAP proficiency test results have given different trends in Cv-values but
invariably they are large in the context of their use and applicability in filter design.
Clearly seen is that the woven monofilament fabric has the lowest Cv-value but even its variation
has significant implications when used in design. For example, if a designer uses plus or minus
two standard deviations around the mean value, the resulting opening size varies within a rather
large range; i.e.,
0.317 0.050 = 0.267 to 0.367 mm
Also note that the other geotextiles evaluated in Table 5 have even higher values as the
coefficient of variation data indicates, e.g., at 69% the results from the above type of calculation
are well beyond utilization.
The above status regarding dry sieving is somewhat improved using wet sieving. Data
from Dierickz and Myles (1996) indicates the relative situation insofar as a comparison of 090-
values. For example, wet sieving indicates quite large scatter in evaluating woven slit film and
lightweight nonwoven geotextiles. This scatter is increased using hydrodynamic sieving with
even woven monofilament geotextiles showing large variations. Again, the implications of using
even wet sieving methods leaves a design required value with a relatively large spread of
choices.

Capillary Flow Testing per ASTM D6767
A very different test from the three sieving methods discussed so far is the capillary flow
test for determining pore size distributions of geotextile filters. It is covered in the recently
approved ASTM D6767 test method. The test has the distinct advantage of determining the
entire pore size distribution of the geotextile filter and not just a single value. Thus it can be
used in conjunction with any of the design methods listed in Table 2.
The test procedure is based on the principle that a wetting liquid (e.g., mineral oil) is held
in the continuous pores of the geotextile test specimen by capillary attraction and surface tension.
Furthermore, the minimum pressure required to force liquid from these pores is a function of the
pore diameter. By comparing the gas flow rates of both a wet and dry geotextile at the same
pressures, the percentage of fluid passing through the pores larger than or equal to a specific size
may be calculated from the pressure-versus-size relationship. By increasing pressure in small
steps, it is possible to determine the flow contribution of very small pore size increments by
comparing differences. Two such devices are shown in Figure 4.
Figure 5 illustrates some results of capillary flow test evaluation of 67 geotextile test
specimens. The repeatability is fairly consistent and the authors (Bhatia and Smith, 1996) highly
recommend this particular method. More recent information on the test and its behavior is
available in Kiffle, et al. (2014).
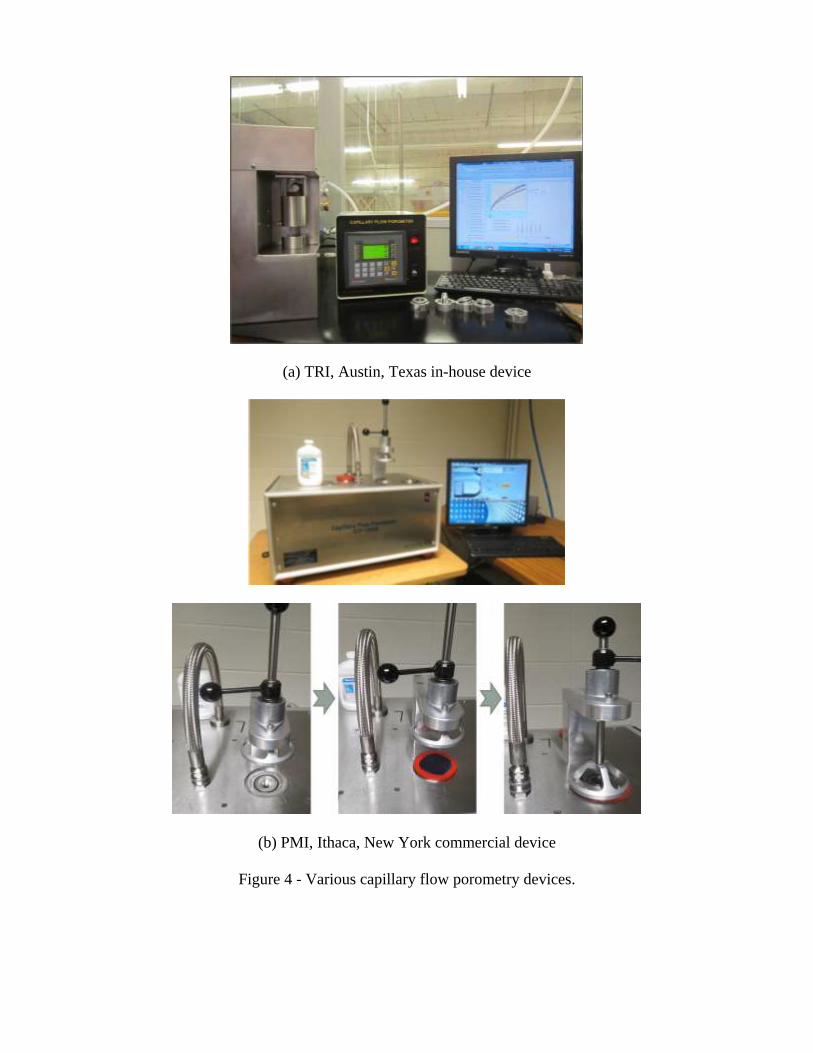
(a) TRI, Austin, Texas in-house device
(b) PMI, Ithaca, New York commercial device
Figure 4 - Various capillary flow porometry devices.
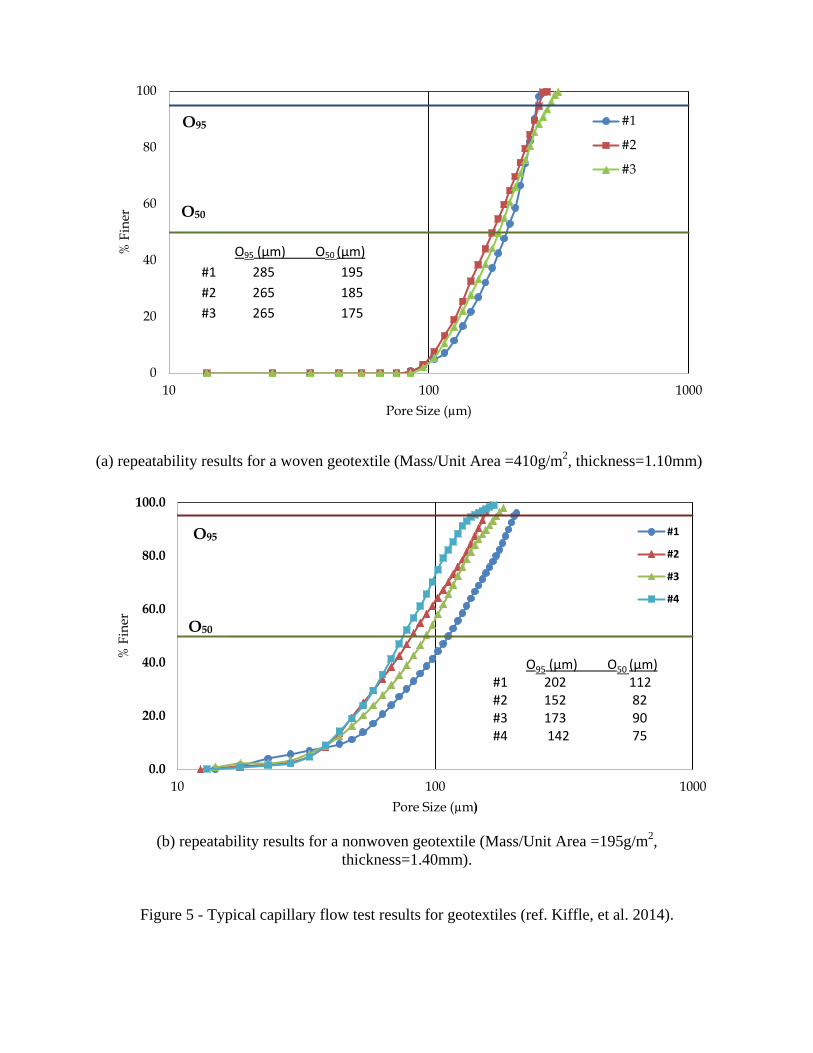
(a) repeatability results for a woven geotextile (Mass/Unit Area =410g/m2, thickness=1.10mm)
(b) repeatability results for a nonwoven geotextile (Mass/Unit Area =195g/m
2,
thickness=1.40mm).
Figure 5 - Typical capillary flow test results for geotextiles (ref. Kiffle, et al. 2014).
0
20
40
60
80
100
10 100 1000
% F
iner
Pore Size (µm)
#1
#2
#3
0.0
20.0
40.0
60.0
80.0
100.0
10 100 1000
% F
iner
Pore Size (µm)
#1
#2
#3
#4
O95 (µm) O50 (µm) #1 202 112 #2 152 82 #3 173 90 #4 142 75
O95
O50
O95 (µm) O50 (µm)
#1 285 195
#2 265 185
#3 265 175
O95
O50
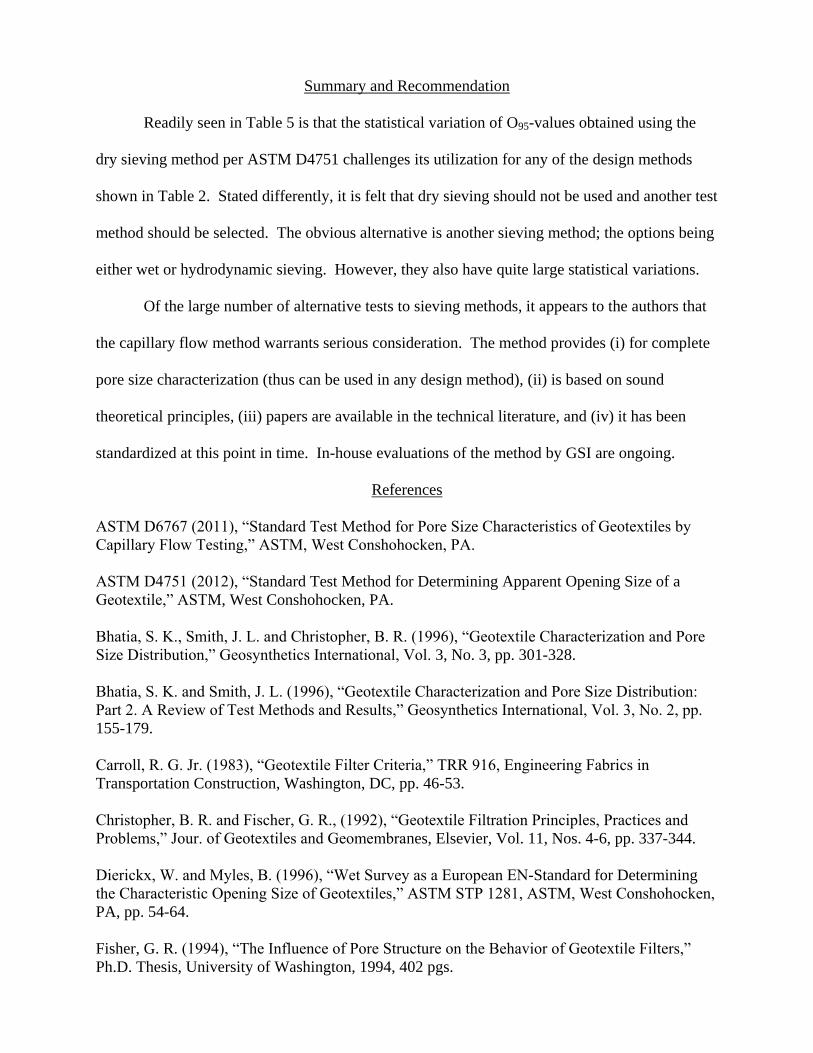
Summary and Recommendation
Readily seen in Table 5 is that the statistical variation of O95-values obtained using the
dry sieving method per ASTM D4751 challenges its utilization for any of the design methods
shown in Table 2. Stated differently, it is felt that dry sieving should not be used and another test
method should be selected. The obvious alternative is another sieving method; the options being
either wet or hydrodynamic sieving. However, they also have quite large statistical variations.
Of the large number of alternative tests to sieving methods, it appears to the authors that
the capillary flow method warrants serious consideration. The method provides (i) for complete
pore size characterization (thus can be used in any design method), (ii) is based on sound
theoretical principles, (iii) papers are available in the technical literature, and (iv) it has been
standardized at this point in time. In-house evaluations of the method by GSI are ongoing.
References
ASTM D6767 (2011), “Standard Test Method for Pore Size Characteristics of Geotextiles by
Capillary Flow Testing,” ASTM, West Conshohocken, PA.
ASTM D4751 (2012), “Standard Test Method for Determining Apparent Opening Size of a
Geotextile,” ASTM, West Conshohocken, PA.
Bhatia, S. K., Smith, J. L. and Christopher, B. R. (1996), “Geotextile Characterization and Pore
Size Distribution,” Geosynthetics International, Vol. 3, No. 3, pp. 301-328.
Bhatia, S. K. and Smith, J. L. (1996), “Geotextile Characterization and Pore Size Distribution:
Part 2. A Review of Test Methods and Results,” Geosynthetics International, Vol. 3, No. 2, pp.
155-179.
Carroll, R. G. Jr. (1983), “Geotextile Filter Criteria,” TRR 916, Engineering Fabrics in
Transportation Construction, Washington, DC, pp. 46-53.
Christopher, B. R. and Fischer, G. R., (1992), “Geotextile Filtration Principles, Practices and
Problems,” Jour. of Geotextiles and Geomembranes, Elsevier, Vol. 11, Nos. 4-6, pp. 337-344.
Dierickx, W. and Myles, B. (1996), “Wet Survey as a European EN-Standard for Determining
the Characteristic Opening Size of Geotextiles,” ASTM STP 1281, ASTM, West Conshohocken,
PA, pp. 54-64.
Fisher, G. R. (1994), “The Influence of Pore Structure on the Behavior of Geotextile Filters,”
Ph.D. Thesis, University of Washington, 1994, 402 pgs.
Fisher, G. R., Holtz, R. D. and Christopher, B. R. (1996), “Evaluating Geotextile Pore
Structure,” ASTM STP 1281, ASTM, West Conshohocken, PA, pp. 3-18.
Kiffle, Z. B., Bhatia, S. K., Khachan, M. M. and Jackson, E. K. (2014), “Effect of Pore Size
Distribution on Sediment Retention and Passing,” Proc. 10th
IGS Conference, Berlin, Germany
(on CD).
Koerner, R. M. (2012), Designing With Geosynthetics, Sixth Edition, Xlibris Publishing, 914
pgs.
Luettich, S. M., Giroud, J. P. and Bachus, R. C. (1992), “Geotextile Filter Design Guide,” Jour.
of Geotextiles and Geomembranes, Vol. 11, No. 4-6, pp. 19-34.
Report on Task Force 25, Joint Committee Report of AASHTO-AGC-ARTBA, American
Association of State Highway and Transportation Officials, Washington, DC, January, 1991.