On the mechanism of the electrochemical conversion of ...
21
1 On the mechanism of the electrochemical conversion of ammonia to dinitrogen on Pt(100) in alkaline environment Ioannis Katsounaros,* ,a,b,c,† Marta C. Figueiredo, c Federico Calle-Vallejo, c,d Hongjiao Li, c,‡ Andrew A. Gewirth, a Nenad M. Markovic, b and Marc T. M. Koper* ,c a. University of Illinois at Urbana–Champaign, Department of Chemistry, 600 South Mathews Avenue, Urbana, Illinois 61801, United States b. Argonne National Laboratory, Materials Science Division, 9700 South Cass Avenue, Lemont, Illinois 60439, United States c. Leiden University, Leiden Institute of Chemistry, Einsteinweg 55, 2333CC Leiden, The Netherlands d. Departament de Ciència de Materials i Química Fisica & Institut de Química Teòrica i Computacional (IQTCUB), Universitat de Barcelona, Martí i Franqués 1, 08028 Barcelona, Spain † Present address: Forschungszentrum Jülich GmbH, Helmholtz Institute Erlangen-Nürnberg for Renewable Energy (IEK-11), Egerlandstraße 3, 91058 Erlangen, Germany Abstract The electrochemical oxidation of ammonia to dinitrogen is a model reaction for the electrocatalysis of the nitrogen cycle, as it can contribute to the understanding of the making/breaking of N-N, N-O, or N-H bonds. Moreover, it can be used as the anode reaction in ammonia electrolyzers for H2 production or in ammonia fuel cells. We study here the reaction on the N2-forming Pt(100) electrode using a combination of electrochemical methods, product characterization and computational methods, and suggest a mechanism that is compatible with the experimental and theoretical findings. We propose that N2 is formed via an *NH + *NH coupling step, in accordance with the Gerischer-Mauerer mechanism. Other N-N bond-forming steps are considered less likely based on either their unfavourable energetics or the low coverage of the necessary monomers. The N- N coupling is inhibited by strongly adsorbed *N and *NO species, which are formed by further oxidation of *NH. Introduction Although dinitrogen and ammonia are the most stable forms of nitrogen under standard conditions, implying that these should thermodynamically be the preferred end-products in electrochemical reactions within the nitrogen cycle, in fact there are a few electrodes that are able to reduce nitrate to nitrogen, to reduce nitrogen to ammonia, or to oxidize ammonia back to nitrogen [1- 3]. The difficulty in making the electrocatalysis of the nitrogen cycle selective and efficient is related
Transcript of On the mechanism of the electrochemical conversion of ...

1
On the mechanism of the electrochemical conversion of ammonia to
dinitrogen on Pt(100) in alkaline environment
Ioannis Katsounaros,*,a,b,c,† Marta C. Figueiredo,c Federico Calle-Vallejo,c,d Hongjiao Li,c,‡ Andrew A.
Gewirth,a Nenad M. Markovic,b and Marc T. M. Koper*,c
a. University of Illinois at Urbana–Champaign, Department of Chemistry, 600 South Mathews
Avenue, Urbana, Illinois 61801, United States
b. Argonne National Laboratory, Materials Science Division, 9700 South Cass Avenue, Lemont,
Illinois 60439, United States
c. Leiden University, Leiden Institute of Chemistry, Einsteinweg 55, 2333CC Leiden, The Netherlands
d. Departament de Ciència de Materials i Química Fisica & Institut de Química Teòrica i
Computacional (IQTCUB), Universitat de Barcelona, Martí i Franqués 1, 08028 Barcelona, Spain
† Present address: Forschungszentrum Jülich GmbH, Helmholtz Institute Erlangen-Nürnberg for
Renewable Energy (IEK-11), Egerlandstraße 3, 91058 Erlangen, Germany
Abstract
The electrochemical oxidation of ammonia to dinitrogen is a model reaction for the
electrocatalysis of the nitrogen cycle, as it can contribute to the understanding of the making/breaking
of N-N, N-O, or N-H bonds. Moreover, it can be used as the anode reaction in ammonia electrolyzers
for H2 production or in ammonia fuel cells. We study here the reaction on the N2-forming Pt(100)
electrode using a combination of electrochemical methods, product characterization and
computational methods, and suggest a mechanism that is compatible with the experimental and
theoretical findings. We propose that N2 is formed via an *NH + *NH coupling step, in accordance
with the Gerischer-Mauerer mechanism. Other N-N bond-forming steps are considered less likely
based on either their unfavourable energetics or the low coverage of the necessary monomers. The N-
N coupling is inhibited by strongly adsorbed *N and *NO species, which are formed by further
oxidation of *NH.
Introduction
Although dinitrogen and ammonia are the most stable forms of nitrogen under standard
conditions, implying that these should thermodynamically be the preferred end-products in
electrochemical reactions within the nitrogen cycle, in fact there are a few electrodes that are able to
reduce nitrate to nitrogen, to reduce nitrogen to ammonia, or to oxidize ammonia back to nitrogen [1-
3]. The difficulty in making the electrocatalysis of the nitrogen cycle selective and efficient is related

2
to kinetic limitations, emphasizing the importance of understanding how the fundamental
structure/nature of catalysts and the double layer affect the activity and selectivity of nitrogen-based
electrocatalytic processes. Therefore, advances in understanding, at atomic and molecular levels,
complexities of processes involved in ammonia oxidation to nitrogen and, in the reverse reaction,
nitrogen reduction back to ammonia, will provide the necessary building blocks for improving the
efficiency of the overall nitrogen cycle in aqueous systems [4].
The splitting of ammonia to N2 and H2, which comprises the reversal of the Haber-Bosch
process, can have a great impact if it is utilized for hydrogen production in an electrolyser. In such an
ammonia electrolysis process, NH3 is oxidized on the anode to N2, while H2O is reduced on the
cathode to H2 [5-8]. This carbon-free process can turn ammonia into a convenient hydrogen carrier, if
the energy required to operate the electrolyser is provided by renewables. However, as most of the
reactions between N-containing compounds, the selective conversion of NH3 to N2 is difficult, even
though N2 is thermodynamically the only possible product in a relatively broad potential region from
ca. +0.1 V to +0.5 VRHE (see the thermodynamics of possible reactions in the section S1 of the
Supporting Information). In fact, the ammonia oxidation occurs at more positive potentials due to
kinetic limitations, i.e. above +0.5 VRHE, where other products can be additionally formed.
Platinum is the most active polycrystalline surface for N2 formation at such potentials [9-11].
Studies with Pt single-crystal electrodes [12-15] and with preferentially (100)-oriented Pt
nanoparticles [3, 16-18] have shown that the N2 formation on Pt takes place exclusively on the (100)
surface.
The two traditional mechanisms for the electrochemical ammonia oxidation reaction (AOR)
include the progressive formation of *NH2, *NH and *N, but they differ in the elementary step for N-
N bond formation, which can be either an *N + *N (Oswin-Salomon) or an *NHx + *NHy with x, y =
1-3 (Gerischer-Mauerer) bond-forming step [19, 20]. In the Gerischer-Mauerer mechanism, the *N
species is considered a poison. The dominant mechanism for N-N coupling on Pt(100) or
polycrystalline Pt remains unclear. Experimental studies support the Gerischer-Mauerer mechanism
[10, 11, 15, 21-23], but computational findings indicate that the *N dimerization is the most
favourable N-N coupling step on Pt(100) [24-26]. Beyond this disagreement, the two traditional
mechanisms must be extended to include nitrogen oxides which form in parallel, such as NO [22, 23].
The formation of NO is not considered in the traditional mechanisms but it may influence the reaction
rate and selectivity, e.g. by blocking active sites or by participating in bond-forming steps [27].
Moreover, from the strong pH dependence of the ammonia oxidation rate we recently concluded that
a deprotonation step should take place before the N-N bond formation, decoupled from the electron
transfer [28].
The discussion above indicates that more efforts are required to understand the mechanism of
the electrochemical AOR. Here, we study the reaction on Pt(100) with focus on the characterization of
adsorbed and desorbed AOR products as a function of the potential. We utilize standard

3
electrochemical methods in combination with online electrochemical mass spectrometry (OLEMS),
ion chromatography (IC), and Fourier transform infrared (FTIR) spectroscopy. In addition, we study
the ammonia dehydrogenation steps with density functional theory (DFT) calculations. Based on the
new data, we propose a scheme for the ammonia oxidation reaction that consistently explains the
experimental observations.
Experimental methods
Electrochemical cells
For standard electrochemical measurements, a Teflon FEP cell was used with a Pt counter
electrode and a saturated Ag/AgCl reference electrode, which was located in a separate vial to prevent
contamination by chloride ions and was connected with the main compartment via a salt bridge. For
OLEMS, IC and FTIR measurements, a glass cell with a Pt counter electrode and a reversible
hydrogen reference electrode (RHE) was used.
Electrode preparation
The Pt(100) single-crystals were disks from Mateck GmbH, with 6 mm diameter x 4 mm
thickness for standard electrochemistry or 10 mm diameter x 2 mm thickness for OLEMS and FTIR.
The crystals were annealed before each measurement either with (i) induction heating (10 minutes at
1,100 oC) followed by cooling (10 min), both in a H2:Ar (3:97 volume ratio) flow for standard
electrochemistry, or with (ii) flame-annealing followed by cooling in a H2:Ar (1:3 volume ratio)
atmosphere for FTIR and OLEMS. After cooling to room temperature, the crystal was immediately
covered with a drop of ultrapure water, assembled into the appropriate configuration (RDE, OLEMS
or FTIR) and transferred to the (spectro)electrochemical cell. Even in the experiments where no
rotation of the electrode was applied, the electrode was still assembled into the same (RDE)
configuration.
Experimental details
The potential was controlled with an Autolab PGSTAT302N potentiostat. The rotation was
controlled with a Pine AFMSRCE electrode rotator. Compensation for the electrolyte resistance was
carried out using positive feedback and the remaining uncompensated resistance was < 5 Ω. The
potential is always expressed on the RHE scale. For the conversion of the potential from the Ag/AgCl
to the RHE scale, we experimentally determined the equilibrium potential of the H+/H2 couple versus
the Ag/AgCl, using a hydrogen-saturated electrolyte (free of ammonia) and a platinum wire, which
then comprises a true RHE. The current was normalized to the geometric area of the working
electrode. The measurements were performed in an Ar-saturated electrolyte and at room temperature.
The immersion of the clean, well-ordered Pt(100) electrode was always done at +0.05 VRHE, except
for the experiments with adsorbed NH3 (described below). The voltammograms represent always the

4
first cycle after annealing, starting from +0.05 VRHE to the positive direction unless otherwise stated.
The solutions were freshly prepared using ultrapure water (Merck Millipore, 18.2 ΜΩ, TOC < 3 ppb)
and chemicals of the highest purity available from Sigma-Aldrich. Ammonium perchlorate was added
to the KOH solution always just before the measurement to minimize the decrease in NH3
concentration due to evaporation at pH 13. The gases used were 6N quality (Airgas Inc.).
Online electrochemical mass spectrometry (OLEMS)
The volatile products of the AOR were separated from the liquid phase using a porous Teflon
tip (380 μm diameter, 1-3 μm pore size), transferred to the mass spectrometer through a polyether
ether ketone (PEEK) capillary, and analyzed online during the voltammetry with a quadrupole mass
spectrometer (European Spectrometry Systems Ltd) using electron ionization and a secondary
electron multiplier detector (1500 V). The tip was placed ca. 10 μm close to the electrode. Prior to the
measurement, the tip was immersed into a 0.2 M K2Cr2O7 + 2.0 M H2SO4 solution for 15 min and
afterwards rinsed thoroughly with ultrapure water. More details on the online electrochemical mass
spectrometry using an inlet tip close to the electrode can be found in Wonders et al [29].
The contribution of the N2O to the signal for m/z: 30 which originates from the NO fragment
of N2O was determined experimentally by generating N2O in situ in a 0.1 M HClO4 solution of
Na2N2O2 and by monitoring the m/z: 30 and 44 with the same conditions as in the OLEMS
experiments. The ratio of NO:N2O from this experiment was 0.20 and was used for subtracting
thereafter the contribution of N2O to the NO signal in OLEMS measurements during ammonia
oxidation.
Ιon chromatography
Sampling of the liquid electrolyte was performed during the voltammetry using a PEEK tip
(380 μm inner diameter) near the electrode (ca. 10 μm) and transferred to a microwell plate with the
aid of a fraction collector (Shimadzu FRC-10A). The volume of each electrolyte fraction was 60 μL
and the flow rate was 60 μL min-1. The collected samples were afterwards transferred to an ion
chromatography system (Shimadzu, CDD-10Avp) and analyzed offline. The separation of anions was
done with a Shodex NI-424 column and that of cations with a Shodex Y-521 column using the
conditions recommended by the column manufacturer. More details on the combination of
voltammetry with “online” ion chromatography can be found in Yang et al [30].
Adsorbed ammonia oxidation experiments
To adsorb ammonia on Pt(100), the freshly annealed electrode was first transferred to a
deaerated 0.1 M KOH + 1 mM NH4ClO4 solution and a potential of +0.45 VRHE was applied. After 30
s, the electrode was rinsed thoroughly with ultrapure water and then immersed in a deaerated 0.1 M
KOH solution at +0.47 VRHE. To prove that NH3 remains adsorbed on Pt(100) after this procedure, a

5
scan was recorded from +0.47 VRHE in the negative direction and the characteristic ammonia
desorption peak “Red2” (see below for notation) was observed. The voltammograms with adsorbed
ammonia shown in this paper were recorded by scanning from +0.47 VRHE in the positive direction.
Fourier transform infrared spectroscopy
We used a Bruker Vertex 80v vacuum spectrometer in the external reflection mode, using an
MCT detector and p-polarized light. The experiments were performed in the thin layer configuration
using a spectroelectrochemical cell similar to the one described previously by Iwasita and Nart [31],
using a CaF2 optical window.
The annealed Pt(100) electrode was first immersed in a deaerated 0.1 M KOH + 1 mM
NH4ClO4 solution at a constant potential in the AOR region. After 300 s, the electrode was rinsed
thoroughly with ultrapure H2O and with D2O and then transferred to the spectroelectrochemical cell,
in a 0.1 M HClO4 solution at +0.85 VRHE. Afterwards, the spectra were recorded successively at +0.85
VRHE, +0.50 VRHE and +0.20 VRHE. Each spectrum represents the average of 100 interferograms
collected with a resolution of 4 cm-1. The spectra are shown as (R-R0) / R0, where R and R0 is the
reflectance at the sample and reference potential, respectively. We used the spectrum at +0.20 VRHE as
the reference spectrum. Therefore, for the spectra presented in this work, positive bands correspond to
species in excess at the sample potential with respect to +0.2 VRHE. As a control experiment, a
complete NO adlayer was formed by immersing the annealed Pt(100) electrode into an acidic nitrite
solution for 60 seconds, in accordance to the procedure described in ref. [32].
Computational details
The DFT simulations were carried out with VASP [33] using the projector augmented-wave
method [34] to describe ion-electron interactions and the PBE formalism to evaluate the exchange-
correlation energy [35]. The 2×2 (100) slabs had five metal layers: the three topmost and the
adsorbates were allowed to relax completely, while the other two were fixed at the bulk interatomic
distances. The geometry optimizations were made with using the conjugate-gradient scheme and a
plane-wave cut-off of 450 eV and kBT = 0.2 eV until the maximum force on any atom was less than
0.05 eV Å-1, and the total energies were extrapolated to 0 K. We used Monkhorst-Pack meshes [36] of
6×6×1 for the slabs, which guarantee convergence of the adsorption energies below 0.05 eV. The
vertical distance between periodic images was > 14 Å and dipole corrections were also applied. We
modelled proton-electron transfers with the computational hydrogen electrode [37]. Isolated NH3 and
H2 were simulated in cubic boxes of 15 Å × 15 Å × 15 Å using the Γ-point and kBT = 0.001 eV. The
free energies of adsorption were calculated as: ΔG = ΔΕDFT + ΔZPE – TΔS + ΔΕsolvation, where ZPE is
the zero-point energy calculated with DFT within the harmonic-oscillator approximation. Our EDFT
and ZPE values are commensurate with those of other studies in the literature [38]. TΔS is the entropy
correction at 298.15 K, which accounts for all types of entropy for NO and H2, and considers only

6
vibrational entropy for the adsorbates. In order to account for solvent effects, solvation corrections to
the adsorption energies in vacuum were taken from the work of Clayborne et al [39], who assessed
them by means of ab initio molecular dynamics. Note that solvation corrections to the adsorption
energies might also be obtained by explicit calculations of water bilayers [40] or with the aid of
implicit solvent methods [41, 42]. The kinetic barriers in Figure 7 were determined using the nudged
elastic band method [43] and in each case we ensured that there was a sole imaginary frequency along
the reaction coordinate at the saddle point.
Results
Voltammetric characterization of ammonia solutions
We start with describing the voltammograms acquired on Pt(100) in ammonia-free 0.1 M
KOH and in a solution containing 10-3 M ammonia, as summarized in Figure 1. The blank
voltammogram in the ammonia-free solution (solid grey curve) exhibits four pairs of peaks, which are
typical for Pt(100) in alkaline solution and are related to hydrogen and hydroxide
adsorption/desorption from different types of sites [44-46].
In the ammonia-containing solution (solid black curve), the current coincides with the blank
voltammogram between +0.05 and +0.25 VRHE in the positive-going scan, indicating that the
adsorption of ammonia is inhibited by the hydrogen present on the surface in this region.
From +0.28 VRHE to +0.46 VRHE, the multiple peaks of the blank voltammetry are replaced by
a single oxidative peak when ammonia is present (Ox1 peak in Figure 1). The current of the peak
scales with the scan rate, so the current is controlled by a surface-confined process (see Figure S1a in
the Supporting Information). This is also supported by the fact that neither the position nor the height
of the Ox1 peak is influenced by the rotation of the electrode (red curve in Figure 1). The charge
density for the Ox1 peak is ca. 200 μC cm-2, which is practically equal to the charge for the desorption
of atomic hydrogen from Pt(100) (208 μC cm-2) [47]. Therefore, we assign the Ox1 peak to the
replacement of *H by *NH3 on the resulting free sites, without any NH3 dehydrogenation. The peak
position shifts by 30 mV for a 10-fold increase in the NH3 concentration (see Figure S1b in the
Supporting Information), so Nernst equation suggests that the adsorption of one ammonia molecule
requires the desorption of two hydrogen atoms (section S2 in the Supporting Information) [28].
Eventually, the Ox1 peak can be described by the equation:
2 *H + NH3 ⇄ *NH3 + 2H+ + 2e– (1)
At potentials higher than +0.5 VRHE, the current density increases and reaches a maximum of
ca. +0.8 mA cm-2 at +0.62 VRHE (Ox2 peak in Figure 1). The oxidation process is rather complex and
may include the (partial) dehydrogenation of *NH3, recombination of *NHx intermediates, hydroxide-
controlled oxidative removal of intermediates and the concomitant re-adsorption of ammonia. This
leads to continuous oxidation of ammonia, as it is also supported by the increase of the current if the
electrode is rotated (see red curve in Figure 1) and by the increase of the current at higher

7
concentrations of NH3 in solution (see Figure S2 in the Supporting Information). However, the fact
that the current maximum is present also under hydrodynamic conditions, where continuous supply of
NH3 to the surface is ensured, suggests that the decrease of the current above +0.62 VRHE in stagnant
solutions is primarily related to deactivation of the surface due to the adsorption of inhibiting
spectator species. The blocking species can be a product of ammonia oxidation (namely *NHx or
*NO) or hydroxide/oxide species such as *OH/*O. In fact, *O/*OH is present on the surface in this
potential region in NH3-free solution, but considering the relatively weak adsorption of ammonia on
Pt(100) [26] we anticipate that the *OH/*O adsorption is not affected if ammonia is present in
solution.
Figure 1. Cyclic voltammetry in a stagnant solution on Pt(100) in 0.1 M KOH with (black curves) or
without (grey curves) the addition of 1 mM NH4ClO4. The solid vs dashed curves represent the
corresponding voltammograms for different upper potential limits. The red curve corresponds to the
hydrodynamic voltammogram in 1 mM NH3 with 400 rpm. The scan rate was 0.05 V s-1 in all
measurements.
When the sweep is reversed at +0.8 VRHE (black solid curve in Figure 1) the current decreases
until the oxidation reaction ceases at around +0.5 VRHE, while a small reductive peak (Red1 peak in
Figure 1) overlays the ammonia oxidation current at around +0.62 VRHE. This feature can be related to
the reduction of an adsorbed AOR intermediate formed in the positive-going scan, as it will be shown
later. The strong hysteresis between the positive- and the negative-going scan in the region +0.5 to
+0.8 VRHE is more pronounced when a more positive upper vertex potential is applied (see Figure S3a
in the Supporting Information). We attribute the hysteresis primarily to the decrease in the local
concentration of ammonia at the interface, based on the following findings: (i) the hysteresis is much
less pronounced under hydrodynamic conditions (red curve in Figure 1), (ii) the oxidation current

8
decreases in consecutive cycles in this region only, i.e. if the low vertex potential is restricted to +0.47
VRHE (Figure S3b in the Supporting Information), but (iii) the oxidation current is restored if the
electrode is rotated instantaneously at +0.47 VRHE, in between two consecutive cycles (see section S4
in the Supporting Information).
Upon decreasing the potential below +0.5 VRHE, a reductive process takes place with a peak at
ca. +0.3 VRHE (Red2 peak in Figure 1). Following the same analysis as for the Ox1 peak (section S2 in
the Supporting Information) we conclude that the Red2 peak in the negative-going scan is the
counterpart of the oxidative peak Ox1 in the positive-going scan, namely it corresponds to desorption
of one *NH3 molecule combined with the adsorption of two *H atoms. At potentials lower than
+0.25 VRHE the measured current coincides with the one in the blank solution (as also in the positive-
going scan), indicating the complete replacement of *NH3 by *H after the Red2 peak.
When the positive-going sweep in Figure 1 is extended above +0.8 VRHE (dashed black
curve), an additional oxidative process occurs (Ox3 peak in Figure 1) with an onset at +0.9 VRHE and a
peak at ca. +1.0 VRHE. It is known that under these conditions *NO is oxidized to NO2−, probably
facilitated by oxide formation at this potential (see Figure S4 in the Supporting Information) [48].
Therefore, we assign Ox3 to the oxidation of nitric oxide that is formed from ammonia oxidation. We
do not aim to interpret the current response in the reverse scan after the exposure to potentials as high
as +1.3 VRHE, because of the significant surface disordering that occurs under these conditions.
Chronoamperometry
To further explore the competitive adsorption and oxidative processes under “steady-state”
conditions, we performed chronoamperometry measurements under the same experimental conditions
as described in Figure 1. A rotation rate of 400 rpm was applied to ensure a constant rate of ammonia
transport from the solution to the surface. Before applying the Estep potential and recording the
chronoamperometric transients in the AOR region, a potential of +0.05 VRHE was applied. Therefore,
t=0 corresponds to the time that the Estep was applied and the recorded transient includes the current
for the desorption of hydrogen.
As depicted in Figure 2, the current signal decreases with time and eventually reaches a
steady state, for any Estep potential in the region between +0.6 and +0.9 VRHE. Based on this finding,
we conclude that the currents recorded in polarization curves in Figure 1 are, in fact, of transient
nature, e.g. they do not correspond to a steady state. Such a transient behaviour despite the constant
supply of reactant is common in chronoamperometry for poisoning processes and reflects the
progressive adsorption of blocking species in parallel to the electrochemical reaction. The time
interval until the steady-state current is reached is significant (depending on the potential) and
indicates that the accumulation of the blocking species is slow. Because the reversible adsorption of
*OH observed in the base CV is very fast process, it is reasonable to propose that rather than *OH, the

9
blocking adsorbate is a nitrogen-containing intermediate of the ammonia oxidation, such as *NHx
(x=0-2) or *NO.
Figure 2. Chronoamperometric transients for the oxidation of 1 mM NH3 in 0.1 M KOH with step
potentials in the region between +0.6 and +0.9 VRHE. Prior to applying the step potential, a constant
potential of +0.05 VRHE was applied. Rotation rate: 400 rpm.
Identification of desorbed products of the AOR
Thermodynamics suggest that only N2 and N2O can be the bulk (desorbed) products of the
ammonia oxidation at potentials at the onset of the reaction, while the formation of other products
such as nitrite, nitrate or nitric oxide becomes possible at 0.65-0.70 V (see section S1 in the
Supporting Information). In what follows, we explore the potential-dependent formation of desorbed
ammonia oxidation products.
As shown in figure 3 from OLEMS measurements, we find that the only volatile product
formed between +0.5 and +0.8 VRHE is N2, in agreement with a previous study [14]. Above +0.8 VRHE,
however, the formation of desorbed NO and N2O starts, as shown by the increase of the mass signal
for the two gases. Since electron ionization is accompanied with N2O fragmentation to NO, we
determined the fragmentation ratio of NO:N2O = 0.20 by a separate experiment for the same
conditions (see experimental section for details) and the signal for m/z: 30 shown in Figure 3 can be
attributed to NO formation only, after subtracting the contribution of N2O fragmentation to the signal
of m/z: 30. The mass signal for the two gases reaches a maximum at ca. +0.95 VRHE and then
decreases (Figure 3); this coincides with the onset for NO oxidation to nitrite in the voltammetry
(Figure 1). The shapes of the mass signals for NO and N2O are very similar (see also inset in Figure
3), indicating that the two species are probably formed from the same precursor.
The concentration of any other dissolved product such as anions (nitrite or nitrate) or
hydrogenated species (NH2OH or N2H4) was below our detection limit (ca. 1 ppm) in ion
chromatography at any potential up to +1.3 VRHE. The fact that nitrite is not detected at +1.0 VRHE is

10
probably related to the potential resolution during our measurements (60 mV). In addition, note that
the liquid samples were analysed offline after collection with a fraction collector, which means that
unstable products may decompose during the time between collection and analysis.
Figure 3. Online electrochemical mass spectrometry during a positive-going scan (0.001 V s-1) in a
0.1 M KOH + 1 mM NH3 solution. The inset shows a magnification of the ion current for N2O and
NO. As the contribution of N2O fragmentation to m/z: 30 was subtracted from the measured m/z: 30
signal, the red curve in the figure corresponds to the signal due to NO only.
Formation of *NO from the AOR
It was not possible to perform in situ FTIR spectroscopy in the external reflection
mode during the AOR, because of the excessive gas formation and the consequent thin-layer
instability. To circumvent this problem and obtain information on the presence of *NO during
the AOR, we employed the following two-step methodology: we first applied a constant
potential in the AOR region in an NH3-containing KOH solution for 300 s to accumulate any
adsorbates on the surface (Step 1) and, then, we transferred the electrode to a
spectroelectrochemical cell with 0.1 M HClO4 in D2O to record spectra sequentially at +0.85
VRHE, +0.50 VRHE and +0.20 VRHE (Step 2). We used the spectrum at the latter potential as the
reference because the reduction of *NO is complete at +0.20 VRHE. D2O was chosen to avoid
the interference from H2O bands at frequencies relevant to the N-O vibration. An acid solution
was preferred to record the spectra, because the N-O stretching bands are clearly observed on
Pt(100) in that medium [32, 48]. The NO adlayer is stable on Pt(100) during transfer, as
11
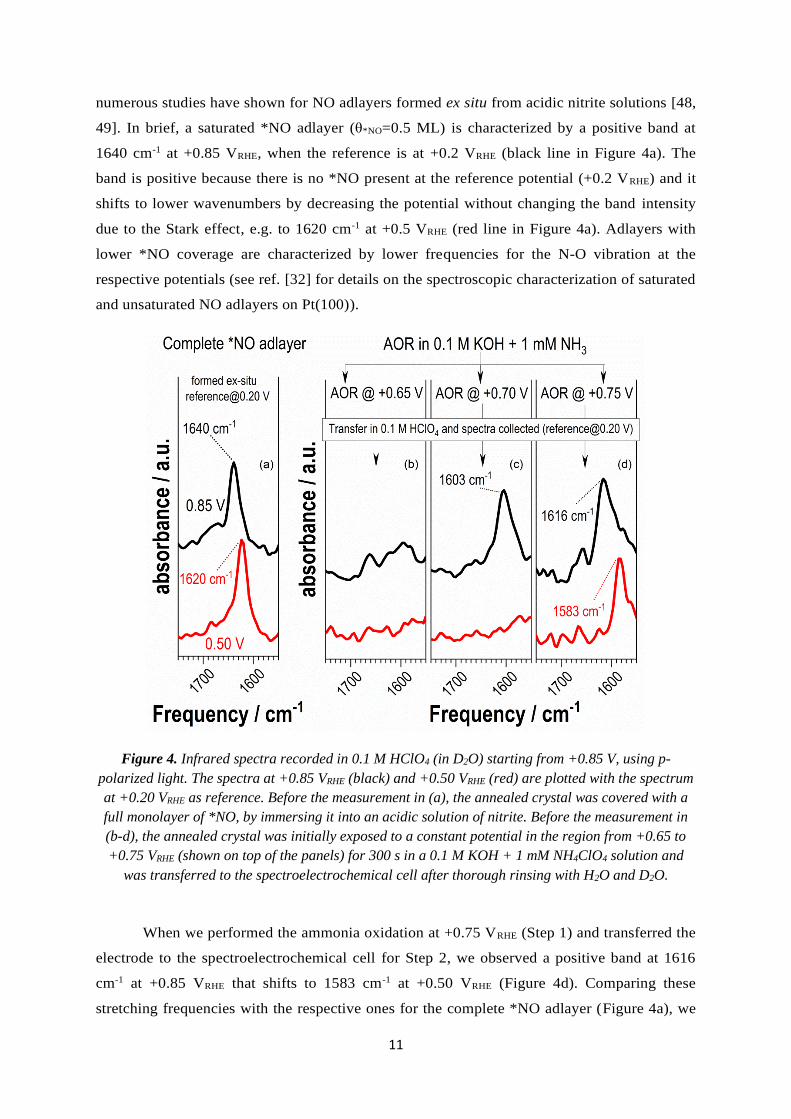
numerous studies have shown for NO adlayers formed ex situ from acidic nitrite solutions [48,
49]. In brief, a saturated *NO adlayer (θ*NO=0.5 ML) is characterized by a positive band at
1640 cm-1 at +0.85 VRHE, when the reference is at +0.2 VRHE (black line in Figure 4a). The
band is positive because there is no *NO present at the reference potential (+0.2 VRHE) and it
shifts to lower wavenumbers by decreasing the potential without changing the band intensity
due to the Stark effect, e.g. to 1620 cm-1 at +0.5 VRHE (red line in Figure 4a). Adlayers with
lower *NO coverage are characterized by lower frequencies for the N-O vibration at the
respective potentials (see ref. [32] for details on the spectroscopic characterization of saturated
and unsaturated NO adlayers on Pt(100)).
Figure 4. Infrared spectra recorded in 0.1 M HClO4 (in D2O) starting from +0.85 V, using p-
polarized light. The spectra at +0.85 VRHE (black) and +0.50 VRHE (red) are plotted with the spectrum
at +0.20 VRHE as reference. Before the measurement in (a), the annealed crystal was covered with a
full monolayer of *NO, by immersing it into an acidic solution of nitrite. Before the measurement in
(b-d), the annealed crystal was initially exposed to a constant potential in the region from +0.65 to
+0.75 VRHE (shown on top of the panels) for 300 s in a 0.1 M KOH + 1 mM NH4ClO4 solution and
was transferred to the spectroelectrochemical cell after thorough rinsing with H2O and D2O.
When we performed the ammonia oxidation at +0.75 VRHE (Step 1) and transferred the
electrode to the spectroelectrochemical cell for Step 2, we observed a positive band at 1616
cm-1 at +0.85 VRHE that shifts to 1583 cm-1 at +0.50 VRHE (Figure 4d). Comparing these
stretching frequencies with the respective ones for the complete *NO adlayer (Figure 4a), we

12
conclude that the ammonia oxidation at +0.75 VRHE during Step 1, which preceded the spectra
collection, led to *NO formation at a moderate coverage.
The resulting coverage of *NO is lower if the AOR is performed at less positive
potentials in Step 1. For example, after the AOR at +0.70 V and the transfer to HClO4, a low-
frequency (1603 cm-1) positive band is observed at +0.85 VRHE (Figure 4c), which is
characteristic of *NO at low coverage (compared to 1640 cm-1 for the high coverage in Figure
4a). Moreover, the spectrum at +0.50 VRHE does not show any NO characteristic bands, which
implies that the *NO has been already reduced. The reactivity of *NO at this potential in
HClO4 is characteristic of an adlayer of low coverage, while complete *NO layers are reduced
ca. 200 mV more negative [32]. Furthermore, after the oxidation of ammonia at +0.65 VRHE,
there is no significant accumulation of *NO at the surface, as no NO-characteristic bands are
observed in the spectra recorded in HClO4 (Figure 4b).
From the above, we conclude that N2 formation in the region between +0.5 and
+0.8 VRHE, as evidenced by the OLEMS data, is accompanied with concomitant formation of
*NO starting at around 0.65-0.70 VRHE. The presence of *NO during the AOR on poly-
oriented platinum film electrodes above ca. +0.5 VRHE was recently shown by in situ
attenuated total reflection infrared spectroscopy [23], but our measurement is the first evidence
for *NO formation on the N2-selective Pt(100) electrode.
Oxidation of adsorbed ammonia
In separate experiments, NH3 was first adsorbed on Pt(100) by immersion in an NH3-
containing solution at +0.45 VRHE and the electrode was then transferred to an NH3-free 0.1 M KOH
solution at +0.47 VRHE where cycles were recorded in the potential region from +0.47 VRHE to +0.80
VRHE. This allows to focus on the behaviour of ammonia adsorbed on Pt(100), without any
contribution from NH3 present in solution. The presence of ammonia on the surface after the transfer
experiment was verified by voltammetry as described in the experimental section.
From the first cycle, a pair of redox peaks was observed (Figure 5). The position of the
oxidative peak in Figure 5 (ca. +0.67 VRHE) coincides with that of the Ox2 in Figure 1, suggesting that
adsorbed ammonia is oxidized to N2. Moreover, the reductive peak at +0.62 VRHE coincides with the
Red1 in Figure 1. To explain the appearance of the reductive peak at +0.62 VRHE one needs to
consider the formation of another intermediate of NH3 oxidation, which is reduced back to NH3 in the
reverse scan and remains adsorbed as long as the electrode potential is more negative than the
potential for the desorption of ammonia. The evolution of the voltammograms if more cycles are
recorded is consistent with the aforementioned consideration. In particular, the two peaks diminish
with cycling due to the decrease of the NH3 coverage caused by N2 formation, and the evolution of the
voltammograms is independent of the mass transport conditions, i.e. with or without electrode

13
rotation. The latter additionally suggests that the AOR intermediate which is reduced at +0.62 VRHE, is
an adsorbed species.
Therefore, the *NH3 oxidation experiment in Figure 5 shows that under the conditions of N2
formation, an *NHx adsorbate is present on the surface and reduced in the negative-going scan unless
it forms N2. It is unlikely that such an adsorbate be *NO, because (i) the reduction potential in Figure
5 is high even for layers of low *NO coverage and (ii) the onset potential for *NO reduction should be
dependent on the *NO coverage [32].
Figure 5. Oxidation of a pre-adsorbed NH3 adlayer on Pt(100) in 0.1 M KOH (free from ammonia).
The arrows indicate the diminution of the redox peaks with consecutive cycling. The NH3-modified
electrode was immersed at +0.47 VRHE to protect the NH3 adlayer, and the first cycle was recorded by
scanning to the positive direction with 50 mV s-1. The blank voltammogram for the clean Pt(100)
electrode is also shown for comparison.
DFT calculations
Figure 6 shows the main results obtained with DFT calculations of the oxidation of ammonia
to dinitrogen on Pt(100) electrodes. The main panel contains the adsorption and dehydrogenation of
NH3 up to *N, while the inset contains the dimerization of *NH to form *N2H2 and its
dehydrogenation and desorption as N2(g). The free energy profiles for the analysed pathway are
provided at three different potentials: 1) 0.057 VRHE (in red), namely the standard equilibrium
potential of 2NH3 → N2 + 6H+ + 6e– (note, however, that the DFT-calculated equilibrium potential on
Pt(100) for 2NH3 + 2*H → N2 + 2* + 8H+ + 8e– is 0.191 VRHE). 2) 0.62 VRHE (in orange) which is
within the range of potentials of the Ox2 peak in Figure 1. 3) 0.91 VRHE (in green) which is within the
range of potentials of the Ox3 peak in Figure 1. In the following, we will explain the choice of those
three potentials: at 0.057 VRHE, although the 6e– oxidation of ammonia to dinitrogen is possible in
thermodynamic terms, the large uphill reaction energies of the electrochemical steps prevent the

14
reaction onset, making it necessary to apply a sizeable overpotential. The two largest energy
differences are found between *NH and *N (~0.86 eV) and *NH2 and *NH (~0.57 eV).
At a potential of 0.62 VRHE the complete pathway for ammonia oxidation to N2 is fully open
thermodynamically, as all reaction steps are downhill. At such potential, the reaction proceeds via the
adsorption of NH3 and its successive surface dehydrogenation to *NH, two moieties of which couple
to produce *N2H2, which is subsequently dehydrogenated to N2. This pathway is preferred over other
possibilities for *NH because: (i) its dehydrogenation to *N is blocked, as it requires a potential of
~0.91 VRHE (see the green pathway in Figure 1); (ii) *NHOH might as well be a reaction intermediate
after *NH, but it is less stable than *N by 0.36 eV; (iii) the chemical step *NH + *OH → *NHOH is
endothermic by 0.73 eV; (iv) the chemical step *NH + *OH → *N + H2O is endothermic by 0.36 eV.
Therefore, at the potentials corresponding to the Ox2 peak in Figure 1, the reaction likely proceeds via
NH-NH coupling rather than by N-N coupling.
Figure 6. Energetics of the ammonia oxidation reaction on Pt(100) at selected potentials. Red:
equilibrium potential of 0.057 VRHE. Orange: 0.62 VRHE, which is the potential for which ammonia
oxidation is possible via NH-NH coupling. Green: 0.91 V, the potential at which *N formation and N-
N coupling are enabled.

15
We additionally considered the thermodynamics and kinetics of various NHx coupling steps
during the AOR, as shown in Figure 7. The free energy for the coupling of NH2-NH2 is 1.50 eV and
the kinetic barrier is ~2 eV; NH2-NH coupling is endothermic by 0.41 eV and the barrier is over 1 eV;
the free energy is -0.27 eV for NH-NH coupling and the barrier height is below 0.5 eV; finally, N-NH
and N-N couplings are highly exothermic and the barriers are close to zero. In general lines, Figure 7
shows a linear correlation between the H content in NHx-NHy and the free energy of coupling for
these moieties, while the kinetic barrier grows nearly exponentially. Note that the barriers reported
here were calculated in vacuum, so that they represent an upper-bound of the actual barriers in
solution, where solvation effects might be important. In conclusion, NH2-NH2 and NH-NH2 couplings
are kinetically prohibitive (barriers over 1 eV), whereas N-N and N-NH couplings are rather
advantageous thermodynamically and kinetically speaking but a potential of 0.91 VRHE is required to
form the monomer *N. An intermediate case is NH-NH coupling, which is exothermic, exhibits a
surmountable barrier at room temperature (< 0.5 eV), and is present at the surface at potentials around
0.62 VRHE. Thus, we conclude that *NH dimerization is the most likely coupling step for N-containing
moieties at the potentials of the Ox2 peak in Figure 1.
Moreover, the coupling energy of 0.36 eV required for the *NH + *OH → *N + H2O step is
not prohibitive and we anticipate that some *N may be formed with a low rate via this reaction, below
0.91 VRHE. Due to low coverage, it is unlikely that such “underpotential” *N will dimerize to form N2,
but it can chemically couple with coadsorbed *OH or react electrochemically with H2O to form
*NOH. The dehydrogenation of the latter is rather exothermic at these potentials [32] and generates
*NO.

16
Figure 7. Energetics of the surface coupling of N- and H-containing moieties on Pt(100) as a function
of their hydrogen content. Orange: reaction free energies (G). Green: kinetic barriers (G#).
We note that the literature is richer in computational works on ammonia oxidation in gas-
phase catalysis compared to electrocatalysis. For instance, Perez-Ramirez and co-workers [26, 38]
studied this reaction in gas phase catalysed by platinum-group metals. In electrocatalysis, Mavrikakis
and co-workers [50] studied electrochemical ammonia oxidation on (111) transition metals. They
concluded for Pt(111) that N-N bond formation occurs between *NH2 monomers, which differs from
our results on Pt(100), which hint toward *NH dimerization. They discarded *N dimerization on
Pt(111) based on prohibitive kinetic barriers, while we do it based on the high potential for *N
generation. Furthermore, Ishikawa and co-workers [24] studied electrochemical ammonia oxidation
on Pt(100), Pt(111) and Pt(110). On Pt(100) at potentials over 0.5 V, they found that *NH2
dimerization is a rare event, in line with our results in Figure 7. However, they argued that *N
dimerization is the N-N bond-making step. Although Figure 7 shows that *N dimerization is
kinetically and thermodynamically more favourable than *NH dimerization, Figure 6 indicates that at
~0.62 V *NH dehydrogenation to *N is uphill by ~0.3 eV. Thus, *N will hardly be present at the
surface at such potential. Ishikawa and co-workers also suggested that *N poisons (111) and (110)
surfaces, in line with Li et al’s results [25], who observed strong *N adsorption energies on Pt(111)
and large kinetic barriers for its dimerization.
Finally, it is worth mentioning that based on our previous experimental results, we
hypothesized about the existence of a decoupled proton-electron transfer during the AOR [28]. The
data in Figures 6 and 7 were obtained using the computational hydrogen electrode, which assumes
that all proton-electron transfers are coupled [37]. In practice, this is typically equivalent to saying
that all adsorbed intermediates are neutral. Although currently the computational hydrogen electrode
is the most widely used model in computational electrochemistry, future studies making use of more
advanced approaches [51, 52] could be used to improve the modelling in Figures 6 and 7 and involve
charged adsorbates as intermediates of the ammonia oxidation, as the experimental results have
pointed out.
Discussion and Conclusion
We propose below a reaction scheme that condenses our experimental and computational
findings (Scheme 1). According to that scheme, adsorbed ammonia is progressively dehydrogenated
to *NH2 and *NH. Afterwards, the dominant pathway for *NH is its dimerization to *N2H2, which is
dehydrogenated to N2 gas. This fast process competes with the slow recombination of *NH with *OH
to form *N and H2O. The formed *N is the precursor for the formation of *NO via *NOH. The
coverage with *N is not sufficient to allow the N-N bond formation via *N dimerization. Other

17
possibilities for N-N bond formation are also considered unimportant, based on the thermodynamics
and kinetics of the *NH2 + *NH2 or *NH2 + *NH recombination or the high potential required to form
high-coverage *N via *NH dehydrogenation.
The adsorbates *N and *NO act as surface poisons that block the ammonia oxidation to
nitrogen. Such adsorbates form slowly from surface reactions that involve coupling between nitrogen-
containing and oxide/hydroxide species. Interestingly, the oxidation of ammonia is not inhibited on
platinum if the reaction takes place in liquid, water-free ammonia produced by distillation, which
points to the important role of oxide/hydroxide species in the formation of the blocking adsorbates
[53]. We do not include N2O in this mechanism, because it is a final product of ammonia oxidation
which does not get involved in either N2 formation or reaction inhibition. A previous study on the
interaction of N2O with polycrystalline platinum in alkaline solution showed that N2O can only
undergo reduction at potentials more negative to those of the ammonia oxidation reaction [54].
However, the interesting studies by Greeley et al. on N2O formation during NO reduction are
available in the literature [55].
Scheme 1. Proposed scheme for the most feasible steps during the electrochemical oxidation of
ammonia on Pt(100). The star denotes adsorbed species.
The experiments with NH3 present only on the surface (as in Figure 5), i.e. when there is no
additional supply of NH3 from the solution and thus of *NH on the surface, highlight the decisive role
of the coverage with *NH for the N-N coupling reaction and eventually the formation of N2. When
NH3 is present only on the surface, the coverage of *NH and the probability for dimerization is low.
The *NH which does not dimerize is reduced back to *NH3 in the reverse scan at +0.62 VRHE (Red1
peak). After the completion of each cycle in Figure 5, the coverage of *NH3 and the probability for
*NH dimerization becomes lower. In line with this scheme, the Red1 peak should be visible also
when ammonia is present in solution in low concentrations (see section S3 in the Supporting
Information), which is again expected from the decreased surface abundance of *NH species and the
lower probability for its dimerization to *N2H2. When NH3 is present in solution at sufficient

18
concentrations, the coverage with *NH and thus the probability for dimerization is high which in turn
leads to an elimination of the Red1 peak associated to the reduction of non-dimerized *NH.
Acknowledgements
This research was supported by a Marie Curie International Outgoing Fellowship within the seventh
European Community Framework Programme to I.K. under Award IOF-327650, and by the U.S.
Department of Energy, Office of Science, Materials Sciences and Engineering Division (contract DE-
AC02-06CH11357). H. L. acknowledges support from the China Scholarship Council through a CSC
scholarship. F.C.-V. acknowledges funding from The Netherlands Organization for Scientific
Research (NWO), Veni project number 722.014.009. F.C.V. also thanks Spanish MEC for a Ramon y
Cajal research contract RYC-2015-18996. The use of supercomputing facilities at SURFsara was
sponsored by NWO Physical Sciences, with financial support by NWO.
TOC figure
References
[1] C. Milhano, D. Pletcher, The Electrochemistry and Electrochemical Technology of Nitrate, in: R.E. White (Ed.) Modern Aspects of Electrochemistry, No. 45, Springer New York, New York, NY, 2009, pp. 1-61. [2] C.J.M. van der Ham, M.T.M. Koper, D.G.H. Hetterscheid, Challenges in reduction of dinitrogen by proton and electron transfer, Chem. Soc. Rev., 43 (2014) 5183-5191. [3] F.J. Vidal-Iglesias, J. Solla-Gullón, V. Montiel, J.M. Feliu, A. Aldaz, Screening of electrocatalysts for direct ammonia fuel cell: Ammonia oxidation on PtMe (Me: Ir, Rh, Pd, Ru) and preferentially oriented Pt(100) nanoparticles, J. Power Sources, 171 (2007) 448-456. [4] V. Rosca, M. Duca, M.T. de Groot, M.T.M. Koper, Nitrogen Cycle Electrocatalysis, Chem. Rev., 109 (2009) 2209-2244. [5] L.A. Diaz, A. Valenzuela-Muñiz, M. Muthuvel, G.G. Botte, Analysis of ammonia electro-oxidation kinetics using a rotating disk electrode, Electrochim. Acta, 89 (2013) 413-421. [6] W.I.F. David, J.W. Makepeace, S.K. Callear, H.M.A. Hunter, J.D. Taylor, T.J. Wood, M.O. Jones, Hydrogen Production from Ammonia Using Sodium Amide, J. Am. Chem. Soc., 136 (2014) 13082-13085. [7] F. Vitse, M. Cooper, G.G. Botte, On the use of ammonia electrolysis for hydrogen production, J. Power Sources, 142 (2005) 18-26. [8] B.K. Boggs, G.G. Botte, On-board hydrogen storage and production: An application of ammonia electrolysis, J. Power Sources, 192 (2009) 573-581. [9] S. Wasmus, E.J. Vasini, M. Krausa, H.T. Mishima, W. Vielstich, DEMS-cyclic voltammetry investigation of the electrochemistry of nitrogen compounds in 0.5 M potassium hydroxide, Electrochim. Acta, 39 (1994) 23-31.

19
[10] J.F.E. Gootzen, A.H. Wonders, W. Visscher, R.A. van Santen, J.A.R. van Veen, A DEMS and cyclic voltammetry study of NH3 oxidation on platinized platinum, Electrochim. Acta, 43 (1998) 1851-1861. [11] A.C.A. de Vooys, M.T.M. Koper, R.A. van Santen, J.A.R. van Veen, The role of adsorbates in the electrochemical oxidation of ammonia on noble and transition metal electrodes, J. Electroanal. Chem., 506 (2001) 127-137. [12] F.J. Vidal-Iglesias, N. Garcıa-Aráez, V. Montiel, J.M. Feliu, A. Aldaz, Selective electrocatalysis of ammonia oxidation on Pt(100) sites in alkaline medium, Electrochem. Commun., 5 (2003) 22-26. [13] F.J. Vidal-Iglesias, J. Solla-Gullón, V. Montiel, J.M. Feliu, A. Aldaz, Ammonia Selective Oxidation on Pt(100) Sites in an Alkaline Medium, J. Phys. Chem. B, 109 (2005) 12914-12919. [14] F.J. Vidal-Iglesias, J. Solla-Gullón, J.M. Feliu, H. Baltruschat, A. Aldaz, DEMS study of ammonia oxidation on platinum basal planes, J. Electroanal. Chem., 588 (2006) 331-338. [15] V. Rosca, M.T.M. Koper, Electrocatalytic oxidation of ammonia on Pt(111) and Pt(100) surfaces, Phys. Chem. Chem. Phys., 8 (2006) 2513-2524. [16] J. Solla-Gullón, F.J. Vidal-Iglesias, P. Rodríguez, E. Herrero, J.M. Feliu, J. Clavilier, A. Aldaz, In Situ Surface Characterization of Preferentially Oriented Platinum Nanoparticles by Using Electrochemical Structure Sensitive Adsorption Reactions, J. Phys. Chem. B, 108 (2004) 13573-13575. [17] F.J. Vidal-Iglesias, J. Solla-Gullón, P. Rodrıguez, E. Herrero, V. Montiel, J.M. Feliu, A. Aldaz, Shape-dependent electrocatalysis: ammonia oxidation on platinum nanoparticles with preferential (100) surfaces, Electrochem. Commun., 6 (2004) 1080-1084. [18] E. Bertin, C. Roy, S. Garbarino, D. Guay, J. Solla-Gullón, F.J. Vidal-Iglesias, J.M. Feliu, Effect of the nature of (100) surface sites on the electroactivity of macroscopic Pt electrodes for the electrooxidation of ammonia, Electrochem. Commun., 22 (2012) 197-199. [19] H.G. Oswin, M. Salomon, The anodic oxidation of ammonia at platinum black electrodes in aqueous KOH electrolyte, Can. J. Chem., 41 (1963) 1686-1694. [20] H. Gerischer, A. Mauerer, Untersuchungen Zur anodischen Oxidation von Ammoniak an Platin-Elektroden, J. Electroanal. Chem., 25 (1970) 421-433. [21] F.J. Vidal-Iglesias, J. Solla-Gullón, J.M. Pérez, A. Aldaz, Evidence by SERS of azide anion participation in ammonia electrooxidation in alkaline medium on nanostructured Pt electrodes, Electrochem. Commun., 8 (2006) 102-106. [22] N.J. Bunce, D. Bejan, Mechanism of electrochemical oxidation of ammonia, Electrochim. Acta, 56 (2011) 8085-8093. [23] T. Matsui, S. Suzuki, Y. Katayama, K. Yamauchi, T. Okanishi, H. Muroyama, K. Eguchi, In Situ Attenuated Total Reflection Infrared Spectroscopy on Electrochemical Ammonia Oxidation over Pt Electrode in Alkaline Aqueous Solutions, Langmuir, 31 (2015) 11717-11723. [24] D. Skachkov, C. Venkateswara Rao, Y. Ishikawa, Combined First-Principles Molecular Dynamics/Density Functional Theory Study of Ammonia Electrooxidation on Pt(100) Electrode, J. Phys. Chem. C, 117 (2013) 25451-25466. [25] H. Li, Y. Li, M.T.M. Koper, F. Calle-Vallejo, Bond-Making and Breaking between Carbon, Nitrogen, and Oxygen in Electrocatalysis, J. Am. Chem. Soc., 136 (2014) 15694-15701. [26] G. Novell-Leruth, J.M. Ricart, J. Pérez-Ramírez, Pt(100)-Catalyzed Ammonia Oxidation Studied by DFT: Mechanism and Microkinetics, J. Phys. Chem. C, 112 (2008) 13554-13562. [27] D.A. Finkelstein, E. Bertin, S. Garbarino, D. Guay, Mechanistic Similarity in Catalytic N2 Production from NH3 and NO2
– at Pt(100) Thin Films: Toward a Universal Catalytic Pathway for Simple N-Containing Species, and Its Application to in Situ Removal of NH3 Poisons, J. Phys. Chem. C, 119 (2015) 9860-9878. [28] I. Katsounaros, T. Chen, A.A. Gewirth, N.M. Markovic, M.T.M. Koper, Evidence for Decoupled Electron and Proton Transfer in the Electrochemical Oxidation of Ammonia on Pt(100), J. Phys. Chem. Lett., 7 (2016) 387-392. [29] A.H. Wonders, T.H.M. Housmans, V. Rosca, M.T.M. Koper, On-line mass spectrometry system for measurements at single-crystal electrodes in hanging meniscus configuration, J. Appl. Electrochem., 36 (2006) 1215-1221.

20
[30] J. Yang, Y. Kwon, M. Duca, M.T.M. Koper, Combining Voltammetry and Ion Chromatography: Application to the Selective Reduction of Nitrate on Pt and PtSn Electrodes, Anal. Chem., 85 (2013) 7645-7649. [31] T. Iwasita, F.C. Nart, In situ infrared spectroscopy at electrochemical interfaces, Prog. Surf. Sci., 55 (1997) 271-340. [32] I. Katsounaros, M.C. Figueiredo, X. Chen, F. Calle-Vallejo, M.T.M. Koper, Structure- and coverage-sensitive mechanism of the NO reduction on platinum, ACS Catal., 7 (2017) 4660-4667. [33] G. Kresse, J. Furthmüller, Efficient iterative schemes for ab initio total-energy calculations using a plane-wave basis set, Phys. Rev. B, 54 (1996) 11169-11186. [34] G. Kresse, D. Joubert, From ultrasoft pseudopotentials to the projector augmented-wave method, Phys. Rev. B, 59 (1999) 1758-1775. [35] J.P. Perdew, K. Burke, M. Ernzerhof, Generalized Gradient Approximation Made Simple, Phys. Rev. Lett., 77 (1996) 3865-3868. [36] H.J. Monkhorst, J.D. Pack, Special points for Brillouin-zone integrations, Phys. Rev. B, 13 (1976) 5188-5192. [37] J.K. Nørskov, J. Rossmeisl, A. Logadottir, L. Lindqvist, J.R. Kitchin, T. Bligaard, H. Jónsson, Origin of the Overpotential for Oxygen Reduction at a Fuel-Cell Cathode, J. Phys. Chem. B, 108 (2004) 17886-17892. [38] G. Novell-Leruth, A. Valcárcel, J. Pérez-Ramírez, J.M. Ricart, Ammonia Dehydrogenation over Platinum-Group Metal Surfaces. Structure, Stability, and Reactivity of Adsorbed NHx Species, J. Phys. Chem. C, 111 (2007) 860-868. [39] A. Clayborne, H.-J. Chun, R.B. Rankin, J. Greeley, Elucidation of Pathways for NO Electroreduction on Pt(111) from First Principles, Angew. Chem. Int. Ed., 54 (2015) 8255-8258. [40] Z.-D. He, S. Hanselman, Y.-X. Chen, M.T.M. Koper, F. Calle-Vallejo, Importance of Solvation for the Accurate Prediction of Oxygen Reduction Activities of Pt-Based Electrocatalysts, J. Phys. Chem. Lett., 8 (2017) 2243-2246. [41] S. Sakong, A. Groß, The Importance of the Electrochemical Environment in the Electro-Oxidation of Methanol on Pt(111), ACS Catal., 6 (2016) 5575-5586. [42] F. Calle-Vallejo, A. Krabbe, J.M. García-Lastra, How covalence breaks adsorption-energy scaling relations and solvation restores them, Chem. Sci., 8 (2017) 124-130. [43] G. Henkelman, H. Jónsson, Improved tangent estimate in the nudged elastic band method for finding minimum energy paths and saddle points, J. Chem. Phys., 113 (2000) 9978-9985. [44] N.M. Markovic, H.A. Gasteiger, P.N. Ross, Oxygen Reduction on Platinum Low-Index Single-Crystal Surfaces in Alkaline Solution: Rotating Ring DiskPt(hkl) Studies, J. Phys. Chem., 100 (1996) 6715-6721. [45] R.M. Arán-Ais, M.C. Figueiredo, F.J. Vidal-Iglesias, V. Climent, E. Herrero, J.M. Feliu, On the behavior of the Pt(100) and vicinal surfaces in alkaline media, Electrochim. Acta, 58 (2011) 184-192. [46] D.F. van der Vliet, M.T.M. Koper, Electrochemistry of Pt (100) in alkaline media: A voltammetric study, Surf Sci., 604 (2010) 1912-1918. [47] C.L. Scortichini, C.N. Reilley, Surface characterization of Pt electrodes using underpotential deposition of H and Cu, J. Electroanal. Chem., 139 (1982) 233-245. [48] A. Rodes, V. Climent, J.M. Orts, J.M. Pérez, A. Aldaz, Nitric oxide adsorption at Pt(100) electrode surfaces, Electrochim. Acta, 44 (1998) 1077-1090. [49] V. Rosca, M.T.M. Koper, Mechanism of Electrocatalytic Reduction of Nitric Oxide on Pt(100), J. Phys. Chem. B, 109 (2005) 16750-16759. [50] J.A. Herron, P. Ferrin, M. Mavrikakis, Electrocatalytic Oxidation of Ammonia on Transition-Metal Surfaces: A First-Principles Study, J. Phys. Chem. C, 119 (2015) 14692-14701. [51] A.J. Göttle, M.T.M. Koper, Proton-coupled electron transfer in the electrocatalysis of CO 2 reduction: prediction of sequential vs. concerted pathways using DFT, Chem. Sci., 8 (2017) 458-465. [52] J. Rossmeisl, K. Chan, R. Ahmed, V. Tripković, M.E. Björketun, pH in atomic scale simulations of electrochemical interfaces, Phys. Chem. Chem. Phys., 15 (2013) 10321-10325.

21
[53] D.J. Little, D.O. Edwards, M.R. Smith, T.W. Hamann, As Precious as Platinum: Iron Nitride for Electrocatalytic Oxidation of Liquid Ammonia, ACS Appl. Mater. Interfaces, 9 (2017) 16228-16235. [54] K.E. Johnson, D.T. Sawyer, The electrochemical reduction of nitrous oxide in alkaline solution, J. Electroanal. Chem., 49 (1974) 95-103. [55] H.-J. Chun, V. Apaja, A. Clayborne, K. Honkala, J. Greeley, Atomistic Insights into Nitrogen-Cycle Electrochemistry: A Combined DFT and Kinetic Monte Carlo Analysis of NO Electrochemical Reduction on Pt(100), ACS Catal., 7 (2017) 3869-3882.