On the meaning of cross-cultural differences in simple cognitive measures
21
On the meaning of cross-cultural differences in simple cognitive measures Fons J.R. van de Vijver* Tilburg University, Tilburg, The Netherlands (Received 7 January 2007; final version received 27 January 2008) A set of 5 reaction time tests of increasing cognitive complexity were administered to 35 secondary school pupils in Zimbabwe and The Netherlands at 4 consecutive school days in order to explore the existence and nature of cross-cultural differences on reaction time tests measuring basic cognitive operations. No cross-cultural differences were observed on the simple tests, while the Dutch pupils were faster than Zimbabwean pupils on the more complex tests. Zimbabwean pupils showed larger performance increments at retesting. Two Wechsler Intelligence Scale for Children (WISC) subtests (Vocabulary and Digit Span Forward and Backward), a tapping test, and parental socioeconomic status were used to predict the cross-cultural performance differences. Socioeconomic status and digit span could explain all these differences. It is argued that the cross- cultural performance differences on elementary cognitive tests cannot be interpreted at face value because of their susceptibility to non-target factors, such as test under- standing and previous test exposure. Keywords: cross-cultural differences; elementary cognitive tests; cognitive complexity; Netherlands; Zimbabwe Introduction The literature on cross-cultural studies of cognitive tests shows a persistent stalemate. On the one hand, there is a remarkable consistency in empirical findings in that the structure of the cognitive system is found to be stable across cultures (e.g., Irvine, 1979; Jensen, 1998; Van de Vijver, 1997). Carroll’s (1993) model of cognitive abilities may well claim universality, despite the culturally restricted, Western research on which it is based. The consistency also applies to cross-cultural differences in score levels. Groups of East-Asian and European descent tend to score higher than groups of African descent (cf. Berry, Poortinga, Segall, & Dasen, 2002; Jensen, 1980, 1998; Van de Vijver, 1997, 2002). On the other hand, interpreting these differences has turned out to be controversial, as exemplified in the old IQ debate recently invigorated by the publication of Herrnstein and Murray’s (1994) book (cf. Neisser et al., 1996). Cross-cultural performance differences on intelligence tests may be due to construct-relevant factors, such as reasoning and memory, and to factors other than the target construct, such as motivation, test-wiseness (Sarnacki, 1979), and previous test exposure. Van de Vijver and Leung (1997) have coined the term *Email: [email protected] Educational Research and Evaluation Vol. 14, No. 3, June 2008, 215–234 ISSN 1380-3611 print/ISSN 1744-4187 online Ó 2008 Taylor & Francis DOI: 10.1080/13803610802048833 http://www.informaworld.com
Transcript of On the meaning of cross-cultural differences in simple cognitive measures

On the meaning of cross-cultural differences in simple cognitive measures
Fons J.R. van de Vijver*
Tilburg University, Tilburg, The Netherlands
(Received 7 January 2007; final version received 27 January 2008)
A set of 5 reaction time tests of increasing cognitive complexity were administered to 35secondary school pupils in Zimbabwe and The Netherlands at 4 consecutive school daysin order to explore the existence and nature of cross-cultural differences on reaction timetests measuring basic cognitive operations. No cross-cultural differences were observedon the simple tests, while the Dutch pupils were faster than Zimbabwean pupils on themore complex tests. Zimbabwean pupils showed larger performance increments atretesting. Two Wechsler Intelligence Scale for Children (WISC) subtests (Vocabularyand Digit Span Forward and Backward), a tapping test, and parental socioeconomicstatus were used to predict the cross-cultural performance differences. Socioeconomicstatus and digit span could explain all these differences. It is argued that the cross-cultural performance differences on elementary cognitive tests cannot be interpreted atface value because of their susceptibility to non-target factors, such as test under-standing and previous test exposure.
Keywords: cross-cultural differences; elementary cognitive tests; cognitive complexity;Netherlands; Zimbabwe
Introduction
The literature on cross-cultural studies of cognitive tests shows a persistent stalemate. Onthe one hand, there is a remarkable consistency in empirical findings in that the structureof the cognitive system is found to be stable across cultures (e.g., Irvine, 1979; Jensen,1998; Van de Vijver, 1997). Carroll’s (1993) model of cognitive abilities may well claimuniversality, despite the culturally restricted, Western research on which it is based. Theconsistency also applies to cross-cultural differences in score levels. Groups of East-Asianand European descent tend to score higher than groups of African descent (cf. Berry,Poortinga, Segall, & Dasen, 2002; Jensen, 1980, 1998; Van de Vijver, 1997, 2002). On theother hand, interpreting these differences has turned out to be controversial, as exemplifiedin the old IQ debate recently invigorated by the publication of Herrnstein and Murray’s(1994) book (cf. Neisser et al., 1996). Cross-cultural performance differences onintelligence tests may be due to construct-relevant factors, such as reasoning and memory,and to factors other than the target construct, such as motivation, test-wiseness (Sarnacki,1979), and previous test exposure. Van de Vijver and Leung (1997) have coined the term
*Email: [email protected]
Educational Research and Evaluation
Vol. 14, No. 3, June 2008, 215–234
ISSN 1380-3611 print/ISSN 1744-4187 online
� 2008 Taylor & Francis
DOI: 10.1080/13803610802048833
http://www.informaworld.com

‘‘method bias’’ to refer to all method-related factors that give rise to cross-cultural scoredifferences that are not essential to the target construct.
The current study addressed the nature of cross-cultural differences in cognitive tasks.As explained below, the current study attempted to minimize interpretation problems by(a) choosing particular cognitive tasks, namely elementary cognitive tests (ECTs); (b)including measures in the study that are expected to statistically explain observed cross-cultural differences in cognitive test performance; (c) administering the same tests in alongitudinal design and making a cross-cultural comparison of the score gains. Each ofthese factors which are aimed at maximizing the interpretability of observed performancedifferences across cultures is described below.
Elementary cognitive tests
The current study addressed elementary cognitive tests (ECTs) (Jensen, 1998; Posner &McLeod, 1982; Vernon, 1987), based on the reasoning that cross-cultural differences onthese tasks are easier to interpret than score differences on complex cognitive tests such asintelligence tests, which can be influenced by a myriad of factors. However, ECTs should notbe viewed as culture-free tests of cognitive functioning. Frijda and Jahoda (1966) argued thatculture-free and culture-fair intelligence tests do not exist, as all tests are based onperformance that always uses a cultural medium of expression. Still, some tests of cognitivefunctioning are more influenced by cultural factors than others. Jensen proposed the term‘‘culture-reduced tests’’ to refer to tests that are relatively little influenced by (unintended)cultural factors. ECTs could be seen as examples of such culture-reduced tests.
Four studies in our research group compared performance differences of Dutchmainstream and immigrant pupils in both ECTs and more complex cognitive tasks. Vande Vijver and Willemse (1991) administered five relatively simple cognitive reaction timemeasures to 59 mainstream and 47 immigrant children of Grade 6 in The Netherlands. Thelatter group was mainly of Turkish and Moroccan descent. The test battery (which isdescribed in more detail in the Method section, as it is also used in the present study) usesfigures as stimuli. The tests vary in cognitive complexity and range from a simple reactiontime task to a task in which geometric patterns have to be mentally added to each other. Inaddition, the pupils’ scores on the CITO test (a nationwide administered test of schoolachievement) were available. The test has three subtests: Reading (reading comprehen-sion), Arithmetic (mental arithmetic), and Information (school knowledge, mainly derivedfrom the Science and Social Studies curricula). The cross-cultural differences were smalland nonsignificant for the ECTs (average effect size, Cohen’s d ¼ 0.07), while themainstream pupils showed significantly higher scores on Reading (d ¼ 0.41) andInformation (d ¼ 0.62); the difference for Arithmetic was in the same direction(d ¼ 0.23) but failed to reach significance. The ECTs showed weak negative correlationswith the scholastic achievement scores; in the group of mainstreamers, the correlationwent from 0.00 for the simple reaction test to –0.22 for the most complex test (averagedacross the three scholastic measures). The correlations were stronger (particularly for themore complex tests) in the immigrant group and ranged from –0.09 to –0.54 (note thatnegative correlations are expected, because pupils with a better school performance will befaster and will have shorter reaction times). A similar pattern was found for average grademark. In the mainstream group, the latter variable was unrelated to ECT performance,while in the immigrant group all correlations were negative and three out of the five weresignificant (average of –0.30). The differences in performance on the ECTs were small andnot clearly patterned.
216 F.J.R. van de Vijver

Van de Vijver, Willemse, and Van de Rijt (1993) administered four of the five ECTs ofthe previous experiment, alongside the Wechsler Intelligence Scale for Children (WISC), tofour groups of primary school pupils in The Netherlands from 8 to 11 years of age: 49mainstream, 34 first-generation, 24 second-generation pupils, and 21 pupils fromintercultural marriages (with one Dutch parent). Using tables developed for Dutchmainstream children, the IQs of these four groups were found to be 100, 79, 90, and 97(effect sizes were –1.60, –0.79, and –0.21, respectively). In both generations, the verbal IQshowed larger differences than the performance IQ. The ECT differences were, again,relatively small and not clearly patterned.
Wagenmakers (1994) administered three tests of the same ECT battery (leaving out themost simple and difficult task) to 73 mainstream and 60 immigrant pupils (mainly ofTurkish, Moroccan, and Surinamese descent) of the third grade in The Netherlands. Inaddition, Raven’s Standard Progressive Matrices were administered. No ECT showed asignificant cross-cultural difference (average d ¼ 0.01), while the mainstream childrenshowed a significantly higher score on the Raven (d ¼ 0.63). The correlations of the ECTswith the Raven were negative and significant; for the two most difficult reaction time testshighly significant correlations of about –0.55 were found in both groups. Correlationsbetween ECTs and average report marks were negative and slightly stronger in theimmigrant group than in the mainstream group.
Finally, Helms-Lorenz, Van de Vijver, and Poortinga (2003) administered a simple anda complex ECT to 747 Dutch majority group members and 474 second-generationimmigrant pupils in The Netherlands (mainly of Moroccan, Turkish, Surinamese, andAntillean background), aged between 6 and 12 years. The instrument of this study differedsomewhat from the previous studies in that the present study employed a mouse asresponse device while a board with response buttons was used in the above studies. Inaddition, either of two omnibus intelligence tests was administered to the children.Mainstream pupils showed a higher performance than immigrant pupils; the differenceswere larger for the intelligence test (average d across subtests ¼ 0.54) than for ECTs(average d ¼ 0.38). The correlations between the ECTs and IQ (averaged across the twointelligence tests) were about –0.15 for the simple reaction time measure and about –0.25for the complex measure in both cultural groups.
The four studies showed convergent findings. First, the relationship between speed andintelligence was largely identical for mainstream and immigrant children; in a study amongprimary school pupils in Guatemala and Austria, Neubauer and Benischke (2002) alsofound that this relationship was stable across cultures. Second, cross-cultural differenceswere smaller on ECTs than on intelligence tests and scholastic achievement tests. Third,both in groups of Dutch mainstreamers and immigrants, the correlation between ECTsand both scholastic measures and intelligence test scores tended to become stronger forECTs of higher cognitive complexity. The upper limit of 0.30 of the (absolute) correlationbetween ECTs and intelligence or school performance, reported before (e.g., Vernon,1987), was replicated here.
Our findings are essentially in line with Jensen (e.g., 1985, 1993, 1998), who conductedmany studies of ECTs involving European and African Americans. He consistently foundperformance differences to increase with task complexity. No consistent cross-culturalperformance differences were found on the simple reaction time tests; however, morecomplex tests tended to show a higher performance of European Americans. Jensen hasproposed a theoretical framework to explain these findings. His so-called ‘‘SpearmanHypothesis’’ postulates that cross-cultural performance differences on cognitive tests arerelated to cognitive complexity; tasks with more cognitive complexity (operationalized as
Educational Research and Evaluation 217

tests with a higher loading on g) showed larger cross-cultural differences, which supportsthis theory: ‘‘Since Spearman’s hypothesis has been consistently borne out in manyindependent sets of appropriate data, and no contrary data have been found, it maylegitimately claim the status of empirical fact’’ (Jensen, 1993, p. 48).
Jensen’s claim has not remained undisputed. The study by Helms-Lorenz et al. (2003)may seem to support Spearman’s Hypothesis, as larger cross-cultural differences werereported for the various subtests of the intelligence tests than for the cognitively lesscomplex ECTs. However, these authors also got ratings (by independent experts) of thecultural entrenchment of the tests of the battery. They found that these ratings were betterpredictors of cross-cultural performance differences than were measures of cognitivecomplexity. Spearman’s Hypothesis has also been challenged on methodological grounds.Thus, Dolan, Roorda, and Wicherts (2004) reanalyzed data from two previously publishedstudies that reported support for Spearman’s Hypothesis (a South-African study by Lynn& Owen, 1994, and a Dutch study by Te Nijenhuis & Van der Flier, 2003), usingmultigroup confirmatory factor analysis. Their analyses focused on testing factorialinvariance, which amounts to a test of the equality of factor loadings, correlations, anderror variances across cultural groups. Factorial invariance, a prerequisite for a test ofSpearman’s Hypothesis, was not ‘‘remotely tenable’’ (p. 170). In conclusion, the evidenceregarding Spearman’s Hypothesis is inconclusive. Supportive evidence has been challengedon both substantive grounds (i.e., neglect of cultural bias in instruments) andmethodological grounds (i.e., neglect of psychometric bias in instruments). The previousdiscussion indicates that there are at least three explanations of the patterning of cross-cultural score differences at simple and cognitive tests, which are partly competing andpartly complementary: the increase of cognitive complexity (Spearman’s Hypothesis), theincrease of cultural complexity, and methodological artifacts (e.g., test-wiseness andprevious test exposure).
Statistical explanations of cross-cultural differences
A second way to maximize the interpretability of observed cross-cultural performancedifferences on cognitive tests against rival explanations involves the measurement ofvariables in the study that could have a bearing on the cross-cultural differences. The ideato include explanatory variables in cross-cultural designs has been called ‘‘unpackaging’’,because the researcher tries to ‘‘unpackage’’ observed cross-cultural score differences in atarget variable by measuring presumably relevant explanatory variables (Whiting, 1976;see also Bond & Van de Vijver, in press; Poortinga & Van de Vijver, 1987). Statisticaltechniques such as analysis of covariance and regression analysis are used to evaluate towhat extent cross-cultural differences in the explanatory variables can statistically accountfor the observed cross-cultural score differences in the target variable. Cross-culturaldifferences on simple tests (if present) may be more straightforward to interpret,particularly when alongside the target tests, measures of presumably relevant sources ofcross-cultural differences (e.g., a test of memory capacity) are administered.
Longitudinal designs
The third way to bolster the interpretability of cross-cultural score differencesimplemented in the current study involved the use of a longitudinal design. The patterningof cross-cultural performance differences at retesting could shed light on the nature ofthese differences. Invariance of these differences across cultures would underscore the
218 F.J.R. van de Vijver

similarity in psychological meaning of cognitive test scores, whereas cross-culturaldifferences in gain patterns point to differences in meaning. Jensen (1998) reports supportfor the invariance assumption; he did not find any change in cross-cultural scoredifferences between African Americans and European Americans in choice reaction timetasks with retesting. One of the earliest systematic cross-cultural studies of elementarycognitive processing was carried out by Poortinga (1971). He administered several series ofECTs, consisting of simple, two-, four-, and eight-choice reaction time measures involvingboth auditory and visual stimuli to 40 white and 40 black students in South Africa. Nocross-cultural differences were found for the first two tasks, while the white group showedshorter reaction times on both types of stimuli in the last two tasks; the effect size was verylarge (1.64 SD for the visual stimuli and 1.32 SD for the auditory stimuli). An analysis of thechange of the reaction times across the series of the last two tasks showed that the blackstudents had longer reaction times in the beginning, but their reaction times decreased morerapidly than those of the white students. In an analysis of variance, the interaction betweenseries and culture was significant, which was interpreted by the author as evidence that thetasks were not equivalent. It is interesting to note that Jensen (1998, p. 392) quotesPoortinga’s (1971) study as evidence in favor of the Spearman Hypothesis (i.e., larger cross-cultural differences in the more complex ECTs), whereas Poortinga uses the same data todemonstrate that more complex ECTs tend to be more biased than simpler measures. Thedifferences in results between the studies of Jensen and Poortinga are striking. Although thestudies did not use exactly the same kind of research methods and stimuli, both worked inthe so-called Hick paradigm (that compares reaction times to simple and choice-reactionstimuli; Hick, 1952), which has shown robust results across various different stimulusprocedures. As a consequence, differences in instrumentation are unlikely to explain thedifferences in results. It could be speculated that the contrasting results found in the studiesby Jensen and Poortinga are due to the cultural and socioeconomic distance between thegroups, which is larger in South Africa than in the USA.
Two related kinds of explanations can be envisaged for the decreasing cross-culturalperformance differences on complex tasks after retesting. The first draws on the literatureabout skill learning and practice effects in retesting (e.g., Ackerman, Kyllonen, & Roberts,1999; Logan, 1988). According to Ackerman (1986), cognitive tasks are either consistent(data limited) or inconsistent (resource limited). Performance on consistent tasks is limitedby the available knowledge, such as the performance on a test of vocabulary knowledge.Repeated test administration of such tests can be expected to quickly show an asymptoticresult, because performance is limited by knowledge available in long-term memory (whichcan be seen as fixed across the repeated administrations), whereas performance oninconsistent tasks is more dependent on available resources (e.g., effort). Simple ECTs canbe expected to be more data limited, while complex ECTs can be expected to be moreresource limited. The classical studies by Fleishman and Hempel (1954) indicated that inthe initial stages of learning of a psychomotor task, intellectual components show strongerrelationships with intelligence than motor performance, and this pattern reverses withprolonged training. In the initial stages, tasks could be assumed to be more complex forgroups with little previous experience on similar tasks, such as groups with lower levels ofeducation. In this line of reasoning, score gains depend on initial level and are unrelated tocultural factors; individuals from different cultural groups with the same score at the firsttest administration (or cultural groups with the same initial scores) are expected to showthe same gain pattern.
The second explanation of decreasing cross-cultural performance differences oncomplex tasks after retesting involves method bias. Van de Vijver and Leung (1997) have
Educational Research and Evaluation 219

coined the terms ‘‘instrument bias’’ and ‘‘administration bias’’ (which are examples ofmethod bias) to refer to all those aspects of an instrument or its administration that leadto cross-cultural score differences. There is cross-cultural evidence supporting thisexplanation. For example, Van de Vijver, Daal, and Van Zonneveld (1986) askedprimary school pupils in Surinam, The Netherlands, and Zambia to solve inductivereasoning items. Randomly selected groups in each country were trained to solve itemsquite similar to those in the pretest and posttest. Zambian pupils showed the lowestscores at the pretest and the largest increments at the posttest. Interestingly, theseincrements were found both in the trained (experimental) and untrained (control) group.The authors argued that this increase was caused by improved test-taking skills, learnedat the pretest. Nkaya, Huteau, and Bonnet (1994) administered Raven’s StandardMatrices three times to sixth graders in France and Congo. Under untimed conditions,score improvements were similar for both groups, but under timed conditions, theCongolese pupils progressed more from the second to the third session than did theFrench pupils. Similarly, Ombredane, Robaye, and Plumail (1956) have shown thatthe predictive validity of the Raven test increased after repeated administration in agroup of illiterate, Congolese mine workers. Working with primary school children inTanzania, Sternberg et al. (2002; see also Grigorenko & Sternberg, 1998) used a dynamictesting procedure to assess cognitive skills. Compared to pretest scores on the dynamictests, posttest scores generally were better predictors of reference ability and achievementmeasures, indicating that the retesting changed the psychological nature of the task andthat the performance at the retest was less influenced by fewer additional skills. Retesteffects due to method factors are not restricted to non-Western participants and alsoprevail among Westerners (e.g., Blieszner, Willis, & Baltes, 1981; Wing, 1980). It is clearthat repeated test administrations can yield valuable insights about the nature of cross-cultural score differences at the first occasion.
The present study
The present study examined the nature of cross-cultural differences in performance onECTs in Zimbabwe and The Netherlands. These countries were chosen because of theirdifferences in culture, affluence, and education. School life expectancy is 9 years inZimbabwe and 17 years in The Netherlands (United Nations Statistics Division, 2007).Educational expenditure for secondary education was US$ 6,403 in The Netherlands andUS$ 1,368 in Zimbabwe in 2001 (both amounts are converted from local currencies usingPower Purchasing Parity; Organisation for Economic Co-operation and Development,2004). A test battery consisting of ECTs of varying complexity was administered tosecondary school pupils in a repeated-measures design. In line with previous studies (e.g.,Helms-Lorenz et al., 2003; Jensen, 1998; Poortinga, 1971), cross-cultural differences inreaction times are expected to increase with ECT complexity (with the Dutch pupilsshowing a higher performance) (Hypothesis 1). In line with Poortinga’s (1971) study, it isexpected that the repeated test administration reduces the size of the cross-culturaldifferences on the ECTs (Hypothesis 2). Furthermore, additional instruments to measurecognitive skills that could be relevant for validating observed cross-cultural differences onECTs (crystallized intelligence, as measured by Vocabulary in the present study, andmemory), noncognitive skills (manual dexterity), and socioeconomic status are adminis-tered. These measures are used to provide a partial or complete explanation of theobserved cross-cultural performance differences. It is expected that these measures cansignificantly decrease the observed performance differences (Hypothesis 3).
220 F.J.R. van de Vijver

Method
Participants
All pupils (N ¼ 35 in each culture) attended the first grade of secondary school. TheZimbabwean (black) pupils attended a secondary school about 30 km from the capitalHarare. The school is state owned; all teachers were qualified. The classrooms hadconcrete floors; no classrooms had sufficient furniture for all pupils. In The Netherlands,pupils were recruited from a secondary school in a village close to Tilburg and a school inWageningen. Different types of secondary schools were sampled in The Netherlands so asto get a fair picture of the intellectual heterogeneity of the population. The average ageof the Dutch pupils was 12.57 (SD ¼ 0.66), while the average age of the Zimbabweanpupils was 14.80 (SD ¼ 0.80); the difference between the samples is highly significant,t(68) ¼ –12.78, p 5 .01, d ¼ –3.06. The age difference of about 2 years is due to acombination of two factors: the age of enrolment in primary school differs 1 year (6 yearsin The Netherlands and 7 years in Zimbabwe), and the Dutch primary school curriculumhas six grades and the Zimbabwean seven grades.
Instruments
Noncognitive measures
A biographical questionnaire was administered. Information about the following indicatorsof socioeconomic status was collected: parental education and profession, number of booksin the household (5-point scale: 0–10 books; 11–20 books; 21–50 books; 51–100 books; morethan 100 books), and availability of radio and television in the household (both scoreddichotomously, sum score of both was used). These indicators were all positively correlated(a first analysis revealed that the first factor explained 46.8% of the variance). The averagez score on these variables was used as SES score. The sample differences in SES werehighly significant (Zimbabwe: M ¼ –0.56, SD ¼ 0.33, range ¼ –1.07, 0.29; Netherlands:M ¼ 0.56, SD ¼ .39, range: –0.16, 1.36), t(68) ¼ –12.68, d ¼ –3.08).
Cognitive measures
Five ECTs were administered. The first task, Task A, was a simple reaction time measure.The pupils were seated behind a computer monitor and response panel; two buttons visiblewere visible on this panel (the solid squares on the response panel of Figure 1). The screenwas white at the beginning of the trial. After an auditory warning stimulus, the blackcontour lines of a square became visible. After this warning stimulus, the pupil was askedto press the home button of the response panel. After a fixed period of 2 s and a randomperiod between 0 and 2 s, the square became black. The pupil was instructed to lift his orher index finger from the home button and to press the button at the top of the responsepanel as soon as the square became black. Reaction time (measured in milliseconds) wasdefined as the time elapsed between the stimulus onset and the release of the home buttonof the response panel. Movement time was the time needed to release the home button andpress the response button. The intertrial interval was 5 s. The test consisted of two series of10 trials (same duration of foreperiod and intertrial intervals were used for all tasks).
Task B was a choice reaction time measure that used five stimuli. Six buttons werevisible on the response panel (see Figure 1). After an auditory warning signal, the contoursof five squares became visible on the monitor. One of the squares became black after the
Educational Research and Evaluation 221

foreperiod. The squares which became black varied across trials but were identical for allpupils; for example, the lower left square always became black in the first trial. The pupilhad to press the corresponding button of the response panel (i.e., the lower left button ofthe response panel). A similar spatial pattern (of two squares at the left side, one in theupper middle, and two at the right side) was used on the monitor and response device sothat pupils would find it easy to determine which button had to be pressed. In order toensure that pupils identified the target figure before lifting the home button, the squaresbecame gray, and only the borders remained visible, once the home button was lifted. Thetest consisted of two series of 10 trials. In Task C, the ninth figure of Figure 2 was alwaysused. The other four squares were randomly chosen from the remaining set of 15 figures ofFigure 2. The pupil was instructed to press the button corresponding to the position of theninth figure. In Task D, the stimulus set consisted of two pairs of identical figures and an‘‘odd one out’’. The pairs of identical figures and the target figure were chosen randomly;for example, two squares contained the 6th figure of Figure 2, two squares the 9th figure,while the 12th figure was the ‘‘odd one out’’, which had to be identified. The pupil had topress the button of this latter figure.
Task E used the concept of ‘‘complementary squares’’; these are squares that form oneblack square (without overlap) when combined. The eight rows of Figure 2 make up eightcomplementary sets of two figures. Two such sets, together with a randomly chosen otherfigure, were displayed in the five squares (e.g., the Figures 5 and 6 as the first pair, 11 and12 as the second pair, and 16 as the ‘‘odd one out’’). The pupil had to identify the ‘‘odd oneout’’ and press the corresponding button. The last three tasks consisted of two series of 12items.
Incorrect responses were treated as missing values in the data. In an analysis that is notfurther documented here, the proportion of errors was found to be small and similar forZimbabwean and Dutch pupils.
Figure 1. Schematic representation of experimental setup with monitor and response panel.
222 F.J.R. van de Vijver

The Dutch version of the Vocabulary subtest of the third version of the WechslerIntelligence Scale for Children was administered (Vander Steene et al., 1991). InZimbabwe, the English-language version was applied. The Digit Span Forward andBackward from the same test were also administered. This test is identical for the twolanguages, whereas the Vocabulary subtests use entirely different stimuli in the twolanguages, precluding a direct comparison.
Finally, a tapping task was used, in which the pupil had to press the button of a handcounter as often as possible in 30 s. After a brief break, the task was repeated.
Procedure
All instruments were administered by the (Dutch) author. The ECTs were administered on5 subsequent school days. The 1st day was used to get the pupils acquainted with the testsand the testing procedure; data presented here are based on the last 4 days. The order ofthe ECTs was fixed on the 1st day (from Task A to Task E in the order in which they weredescribed above); on the last day, the reverse order was used. The order was randomizedon the other days. The testing language in Zimbabwe was English (the language ofinstruction), which was the second language of the pupils; their first language was Shona.
Figure 2. Examples of figures used in the ECTs.
Educational Research and Evaluation 223
Results
The psychometric properties of the instruments are presented first, followed by a cross-cultural comparison of the gain patterns of the reaction time on the ECTs. The finalanalysis addressed the question to what extent tapping, memory, and Vocabulary scorescould explain the cross-cultural differences observed.
Reliabilities
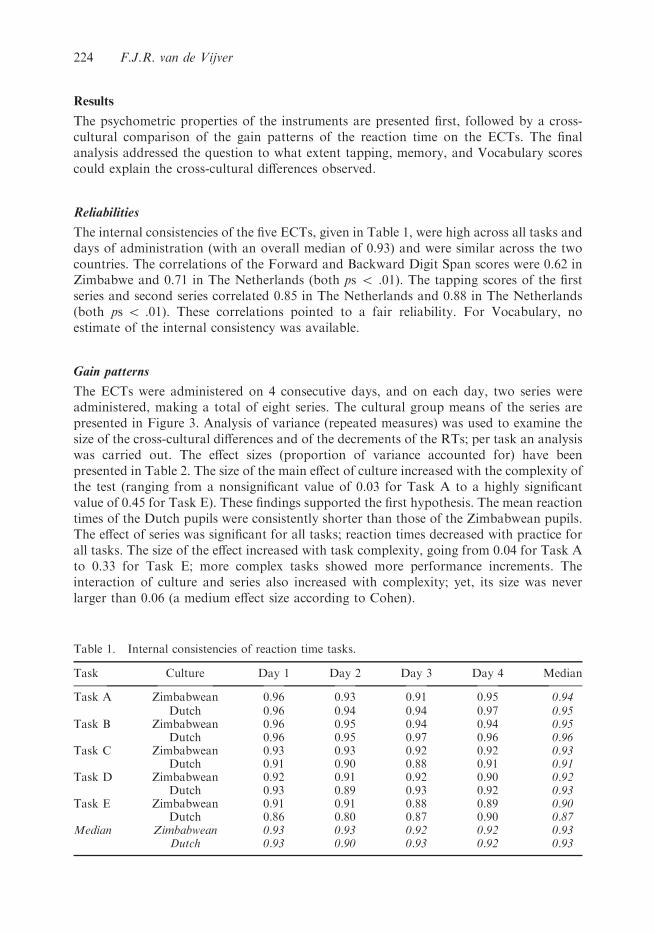
The internal consistencies of the five ECTs, given in Table 1, were high across all tasks anddays of administration (with an overall median of 0.93) and were similar across the twocountries. The correlations of the Forward and Backward Digit Span scores were 0.62 inZimbabwe and 0.71 in The Netherlands (both ps 5 .01). The tapping scores of the firstseries and second series correlated 0.85 in The Netherlands and 0.88 in The Netherlands(both ps 5 .01). These correlations pointed to a fair reliability. For Vocabulary, noestimate of the internal consistency was available.
Gain patterns
The ECTs were administered on 4 consecutive days, and on each day, two series wereadministered, making a total of eight series. The cultural group means of the series arepresented in Figure 3. Analysis of variance (repeated measures) was used to examine thesize of the cross-cultural differences and of the decrements of the RTs; per task an analysiswas carried out. The effect sizes (proportion of variance accounted for) have beenpresented in Table 2. The size of the main effect of culture increased with the complexity ofthe test (ranging from a nonsignificant value of 0.03 for Task A to a highly significantvalue of 0.45 for Task E). These findings supported the first hypothesis. The mean reactiontimes of the Dutch pupils were consistently shorter than those of the Zimbabwean pupils.The effect of series was significant for all tasks; reaction times decreased with practice forall tasks. The size of the effect increased with task complexity, going from 0.04 for Task Ato 0.33 for Task E; more complex tasks showed more performance increments. Theinteraction of culture and series also increased with complexity; yet, its size was neverlarger than 0.06 (a medium effect size according to Cohen).
Table 1. Internal consistencies of reaction time tasks.
Task Culture Day 1 Day 2 Day 3 Day 4 Median
Task A Zimbabwean 0.96 0.93 0.91 0.95 0.94Dutch 0.96 0.94 0.94 0.97 0.95
Task B Zimbabwean 0.96 0.95 0.94 0.94 0.95Dutch 0.96 0.95 0.97 0.96 0.96
Task C Zimbabwean 0.93 0.93 0.92 0.92 0.93Dutch 0.91 0.90 0.88 0.91 0.91
Task D Zimbabwean 0.92 0.91 0.92 0.90 0.92Dutch 0.93 0.89 0.93 0.92 0.93
Task E Zimbabwean 0.91 0.91 0.88 0.89 0.90Dutch 0.86 0.80 0.87 0.90 0.87
Median Zimbabwean 0.93 0.93 0.92 0.92 0.93Dutch 0.93 0.90 0.93 0.92 0.93
224 F.J.R. van de Vijver

Figure 3. Mean reaction times per task and series (in ms).
Educational Research and Evaluation 225

Table 2. Effect sizes (proportion of variance accounted for) of culture, series, and their interaction.
Task
Source
Culture Seriesa Culture6Seriesa
Task A 0.03 0.04* 0.01Task B 0.03 0.06** 0.03Task C 0.25** 0.29** 0.06**Task D 0.44** 0.26** 0.06**Task E 0.45** 0.33** 0.05**
aSignificance is based on the Greenhouse-Geisser corrected number of degrees of freedom. *p 5 .05. **p 5 .01.
Several mathematical models can be used to model RT decrements in a repeatedadministration paradigm, such as a power function (Anderson, 2001; Kirsner & Speelman,1996), differential equations (Smith, 2000), and logarithmic functions (Kail, 1988). Thecurrent study employed a power function, which postulates that an observed reaction time,RT, can be written as RT ¼ atb, in which a represents the reaction time at time 1, which isminimum or maximum value of the curve (as reaction times tend to decrease with practice,a will usually represent the highest value), t is the measurement occasion (here rangingfrom one to eight), and b indicates the degree of increase (in case b is positive) or decrease(if b is negative). A common representation of the power law is found by taking the naturallogarithm of the model equation, which gives: ln(RT) ¼ ln(a) þ b ln(t). This model statesthat the logarithm of the reaction time is a linear function of the logarithm of themeasurement occasion.
Data were analyzed both at individual and country level. The former amounts to fittingthe power law to the data of each participant separately, while in the latter a singlefunction is fitted through the country means of the reaction times. A graphical renderingof the country-level data is presented in Figure 4. As can be seen there, the more complextasks showed gain patterns that were more in line with the power law than did the lesscomplex tasks. This pattern can be confirmed in Table 3, in which the parameters of thepower function are given for both samples. Both the country- and individual-levelregression parameters are given; the former express the relationship between countrymeans and measurement occasion, while the latter represent the average of the 35regression functions per country, fitted on the individual-level data. The intercepts andregression coefficients were similar at both levels, the squared multiple correlations werehigher at country level (as could be expected on the basis of aggregation effects). The latterwere higher for the more complex tasks.
The cross-cultural differences in regression function showed an interesting pattern.The last column of Table 3 presents effect size differences in the individual-levelparameters of the regression function (Cohen’s d). The size of the intercept differencesincreased with task complexity. The intercept of the Dutch sample was smaller thanthe intercept of the Zimbabwean sample, and this effect became more pronounced withtask complexity. This pattern of increasing cross-cultural differences with cognitivecomplexity resembles Spearman’s hypothesis. However, the regression coefficients revealeda different picture. With the exception of Task A, all reaction time tasks were negative,indicating faster learning by the Zimbabwean pupils. The average effect size is –0.46,which is almost a medium effect size. So, although the difference was significant only forTask C (d ¼ –0.56, t(68) ¼ –2.23, p 5 .05), all choice reaction time tasks showed apattern of larger intercepts and faster learning for Zimbabwean pupils than for Dutchpupils.
226 F.J.R. van de Vijver

Figure 4. Observed (solid curve) and expected (dotted curve) country differences in reaction timeper task and series (in ms).Note: A power law is fitted to the differences, using series as predictor. The equation in the figurepresents the parameters of the regression function (RT represents the country mean of the reactiontime, t refers to the series). All regression parameters are significant (p 5 .01), with the exception ofthe parameters of Task A.
For each task, the size of the cross-cultural differences in mean RT is plotted againstthe series in Figure 4. The differences in mean RTs increased with task complexity anddecreased with session (the latter confirms the second hypothesis). Remarkably, the
Educational Research and Evaluation 227

observed differences fitted the power law well (see Figure 4). With the exception of data ofTask A which did not follow a power function, all tasks showed high and significantproportions of explained variance, ranging from 0.60 for Task C to 0.95 for Task D (allps 5 .01). It can be concluded that the size of the cross-cultural differences in the choicereaction time tasks were well patterned across the eight series, following a power function.
Explanation of cross-cultural performance differences
A final analysis determined to what extent individual differences in vocabulary, digit span,and tapping could explain the cross-cultural differences in the ECTs. An overview of thecross-cultural differences in the predictors is given in Table 4. No test of the cross-culturaldifferences in vocabulary is presented here, as scores were standardized per country. Ascan be seen in Table 4, tapping did not show a significant difference (d ¼ 0.25), while thedifferences for digit span and socioeconomic status were significant and large (d ¼ –1.42and –3.08, respectively). The Dutch pupils showed, on average, a longer digit span and ahigher socioeconomic status.
In the regression analyses used to explore the nature of the cross-cultural differences inthe reaction time measures, the independent variables were vocabulary, digit span,tapping, and socioeconomic status. The dependent variables were parameters of theregression function (regression coefficient, intercept, and proportion of explained variance)fitted to the eight series. The results are presented in Table 5. Effect sizes of the cross-cultural differences are also given there. The first number in the table (0.28) indicates thatthe regression coefficients of the individual-level regressions showed an average effect size
Table 3. Means, standard deviations, and effect sizes (Cohen’s d) of country- and individual-levelregression parameters (power law).
Individual level
Country level Zimbabwe The Netherlands
Zimbabwe The Netherlands M SD M SD Cohen’s d
InterceptTask A 325.14** 315.85** 326.04 73.35 316.10 63.69 0.14Task B 487.61** 436.96** 487.70 97.88 440.27 81.34 0.53*Task C 1116.64** 853.77** 1117.51 264.29 853.20 160.39 1.21**Task D 2871.36** 1965.30** 2896.80 1026.99 1966.57 364.41 1.21**Task E 3698.19** 2718.87** 3696.53 772.84 2716.86 411.02 1.58**
Regression coefficientTask A 70.00 70.02 0.00 0.09 70.02 0.08 0.28Task B 70.04** 70.00 70.04 0.08 70.01 0.06 70.43Task C 70.13** 70.07** 70.12 0.12 70.07 0.07 70.56*Task D 70.16** 70.08** 70.15 0.17 70.09 0.08 70.47Task E 70.13** 70.09** 70.12 0.11 70.09 0.07 70.39
Variance explainedTask A 0.02 0.33 0.29 0.27 0.32 0.30 70.11Task B 0.73** 0.03 0.36 0.24 0.28 0.22 0.34Task C 0.94** 0.66** 0.40 0.32 0.28 0.23 0.43Task D 0.98** 0.85** 0.44 0.32 0.40 0.27 0.13Task E 0.98** 0.85** 0.53 0.30 0.39 0.24 0.52*
Note: Significance of mean parameters is not indicated. *p 5 .05. **p 5 .01.
228 F.J.R. van de Vijver

of 0.28 (a positive sign indicates here that the Zimbabwean mean is higher), which was notsignificant. The number next to it (–0.02) gives the (nonsignificant) effect size whichremained after the four independent variables were regressed on the regression coefficientof Task A. Various conclusions can be drawn from Table 5. First, regression coefficientsand (squared) multiple regression coefficients of the power law were poorly predicted,while intercept differences were more strongly related to the predictors. Second, differencesin intercept were larger than differences in regression coefficients and multiple correlations.Third, no effect sizes remained significant after correcting for the predictors (whichsupports the third hypothesis). Even the relatively large effect sizes of the interceptsdisappeared altogether after correcting for the predictors. Socioeconomic status and digitspan were effective predictors of intercept differences. For the most complex tests (Task Dand E), both the digit span and socioeconomic status were significant predictors. Thenature of these findings is explored in the next section.
Table 4. Means and standard deviations of the predictors in Zimbabwe and The Netherlands andtest of significance of their differences.
Predictor
Zimbabwe The Netherlands
M SD M SD t (df ¼ 68) Cohen’s d
Digit Span 4.13 0.52 5.11 0.83 75.95** 71.42Tapping 157.44 13.82 152.97 21.45 1.04 0.25Socioeconomic status 70.56 0.33 0.56 0.39 712.87** 73.08
Table 5. Effect sizes (Cohen’s d) of cross-cultural differences in parameters of power regressionfunction before and after regressing background variables on these parameters and results of theregression analyses.
Cohen’s d Regression parameters
Effect sizebefore
Effect sizeafter Vocabulary
DigitSpan Tapping
Socioecon.status Adj. R2
Regression coefficientTask A 0.28 70.02 0.01 0.11 70.03 70.26 0.01Task B 70.43 70.12 70.01 0.14 70.14 0.06 70.01Task C 70.56* 0.02 70.21 70.08 0.02 0.39** 0.10*Task D 70.47 70.01 70.24* 0.40** 0.09 0.00 0.13**Task E 70.39 0.03 70.12 0.26 0.06 0.08 0.04
InterceptTask A 0.14 0.09 70.22 70.19 70.12 0.08 0.05Task B 0.53* 0.16 70.19 70.23 70.06 70.07 0.08Task C 1.21** 0.11 0.01 70.15 70.13 70.48** 0.28**Task D 1.21** 0.11 0.08 70.38** 70.10 70.32** 0.32**Task E 1.58** 0.24 70.11 70.27* 70.16 70.48** 0.44**
Explained varianceTask A 70.11 0.02 70.01 0.10 0.09 0.02 70.04Task B 0.34 0.00 0.01 70.12 0.03 70.12 70.02Task C 0.43 70.01 0.18 0.00 70.02 70.26 0.03Task D 0.13 70.03 0.14 70.36* 70.01 0.15 0.05Task E 0.52* 0.02 0.08 70.27 0.11 70.09 0.07
*p 5 0.05. **p 5 0.01.
Educational Research and Evaluation 229
Discussion and conclusions
In order to explore the poorly understood nature of cross-cultural differences on tests ofbasic cognitive functions, five reaction time tests of increasing complexity wereadministered to 35 secondary school pupils in Zimbabwe and The Netherlands on 5consecutive school days. The simple tests did not show cross-cultural differences, whereasDutch pupils outperformed Zimbabwean pupils on the more complex tests (effect sizes ofthe latter tests were large). Zimbabwean pupils showed larger performance increments atretesting. Two WISC subtests (Vocabulary and Digit Span Forward and Backward), atapping test, and parental socioeconomic status were used to explain the cross-culturaldifferences in ECT performance. It was found that these differences could be explained bydigit span and socioeconomic status.
The finding that socioeconomic status and digit span are good predictors of cross-cultural performance differences on simple reaction time measures requires furtherscrutiny. Let us first consider cross-cultural differences in digit span. The size of the cross-cultural differences in digit span might have been inflated by the use of English as testinglanguage in Zimbabwe; after all, it is uncommon to find large cross-cultural differences inshort-term memory (Wagner, 1981). The reported cross-cultural differences in short-termmemory appear to follow Baddeley’s (1997) phonological loop model. In this model,short-term memory span is operationally defined as the number of items (usually digits) anindividual can read aloud in 1.5 s. Speakers of languages with longer words for digits (suchas Welsh) tend to have a shorter span than speakers of languages with shorter words fordigits (cf. Shebani, Van de Vijver, & Poortinga, 2005, in press). However, words in Englishand Dutch, which are both Germanic languages, are of about the same length, whichmakes significant differences in span of native speakers of these languages unlikely.However, the Zimbabwean participants were not native speakers and could be assumed tohave more problems with the quick internal processing of English-language numerals.
Socioeconomic status is a proxy variable that should be ‘‘unpackaged’’. Thesubstantive interpretation of socioeconomic status is compromised by the huge differencesin scores across the two countries in its constituent variables. Socioeconomic statusshowed relatively little within-country and much cross-country variation. As aconsequence, any variable with a similar pattern of small within- and large cross-countryvariation can statistically explain observed cross-cultural differences in reaction times. Agood example of such a variable is testing language. Dutch pupils were assessed in theirfirst language, whereas Zimbabwean pupils were assessed in English, which usually is theirsecond or third language. Also, although extensive training preceded the actual testingsession, it is impossible to rule out the possibility that the performance of the Zimbabweanpupils would have been better if they were assessed by a Zimbabwean tester or had alonger training session. Finally, it was impossible to match the samples on botheducational and chronological age. It could well be that age difference also influenced thetest results. It can be concluded that the success of socioeconomic status in the explanationof cross-cultural performance differences is an important first step in their interpretation;however, more research is needed to obtain a better understanding of the psychologicalmeaning of socioeconomic status.
The importance of non-target performance moderators is confirmed in the analysis ofgain patterns. Compared to Dutch pupils, Zimbabwean pupils showed both longerreaction times in the beginning (in line with Spearman’s Hypothesis). However, theZimbabwean pupils also showed more gain at retesting (which is hard to reconcile withSpearman’s hypothesis). If the Zimbabwean pupils would have a lower mental speed, there
230 F.J.R. van de Vijver

would be no reason to expect that they are faster learners. The most likely andparsimonious explanation of our findings is that the cross-cultural differences observed areinfluenced by various unintended factors (such as test-wiseness and previous exposure tosimilar tasks). The question as to whether Dutch or Zimbabwean pupils show higher levelsof skill in elementary cognitive skills apparently requires a complex answer. At surfacelevel, there are no differences for simple tests, and as tests become more complex, theDutch increasingly outperform the Zimbabwean pupils (thereby confirming Spearman’sHypothesis). However, if elementary cognitive skills are defined in terms of learning, theZimbabwean pupils show a superior performance to the Dutch pupils, therebydisconfirming Spearman’s Hypothesis. Clearly, the question of which pupils show ahigher skill level defies a simple answer. ECTs measure more than elementary cognitiveskills; the influence of these supplementary skills increases with task complexity. TheZimbabwean pupils seem to pick up some of the latter skills during the first testadministrations. As a consequence, the ECTs are increasingly comparable across testoccasions. The size of the cross-cultural differences decreases with test administration. So,the more comparable tests are, the smaller the differences they show.
A straightforward mathematical extrapolation of the curves of the complex tasks ofFigure 4 suggests that the curves will eventually reach a value of zero; yet, no curve ofFigure 4 came close to its asymptotic value of zero. The question can be asked after howmany trials the performance differences would have become negligible. In theory, thepower law allows for its prediction. For example, for Task E, the difference is predicted tobecome zero after about 1,000 sessions. However, the extrapolation has to make thedubious assumption of the long-range applicability of the power law; yet, it is clear thatthe superiority of the performance of the Dutch pupils can be expected to remain for atleast some time with continued administration.
For the ECTs as studied here, the support of Spearman’s Hypothesis is more seemingthan real, as it is partly based on cross-cultural differences that are essentially unrelated tothe intellectual processes (general intelligence) which are supposed to underlie thedifferences. Our study replicated and extended findings by Poortinga (1971) on adults. Hereported larger cross-cultural differences and more gain on more complex tasks. Jensen(1998) interpreted Poortinga’s study as supporting Spearman’s Hypothesis, whereasPoortinga favored an interpretation in terms of biasing factors. The current study wouldbe more supportive of the latter position, because the cross-cultural differences could be‘‘explained away’’ by method-related (biasing) factors and the evidence that an increase oftest validity is accompanied by a decrease in cross-cultural performance differences. Thebias interpretation is also in line with the study by Helms-Lorenz et al. (2003), in whichknowledge with the Dutch language and culture was found to ‘‘explain away’’performance differences on ECTs of mainstream and immigrant Dutch children.
The current study has implications for cross-cultural cognitive assessment. It wasfound that even for tests which, in comparison with complex cognitive instruments, aresupposed to show less susceptibility to the influence of ambient cultural factors, cross-cultural performance differences cannot be interpreted in a straightforward manner.Assessment-related factors such as previous exposure are assumed to influence the cross-cultural differences observed. The influence of these factors will certainly not be less forculturally more entrenched tests. Caution is required in the interpretation of thesedifferences if no estimate is available of the size of impact of the performance-moderatingfactors. Repeated test administrations as applied here, the usage of measures of testexposure (Sarnacki, 1979), the estimation of the cultural entrenchment of tests (Helms-Lorenz et al., 2003), and dynamic testing procedures (e.g., Sternberg et al., 2002) are
Educational Research and Evaluation 231

examples of procedures which can be used to increase the validity of instruments and,hence, the validity of the cross-cultural inferences. All these procedures point to the needto be cautious in drawing inferences about single applications of cognitive tests inculturally heterogeneous contexts. It is only through a further exploration of the nature ofthe cross-cultural differences that we can deepen our insight in culture–cognitionrelationships. Cross-cultural assessment procedures employed to gain insight into cross-cultural performance differences introduce new sources of cross-cultural differences. Thisis in itself paradoxical.
Note on contributor
Fons J.R. van de Vijver is professor of Cross-Cultural Psychology at Tilburg University, Tilburg,The Netherlands, and North-West University, Potchefstroom, South Africa. He has over 250publications on cross-cultural topics such as research methods, acculturation, and intelligence.
References
Ackerman, P.L. (1986). Individual differences in information processing: An investigation ofintellectual abilities and task performance during practice. Intelligence, 10, 101–139.
Ackerman, P.L., Kyllonen, P.C., & Roberts, R.D. (Eds.). (1999). Learning and individualdifferences: Process, trait, and content determinants. Washington, DC: American PsychologicalAssociation.
Anderson, R.B. (2001). The power law as an emergent property. Memory and Cognition, 29, 1061–1068.
Baddeley, A. (1997). Human memory: Theory and practice (Rev. ed.). Mahwah, NJ: Erlbaum.Berry, J.W., Poortinga, Y.H., Segall, M.H., & Dasen, P.R. (2002). Cross-cultural psychology.
Research and applications (2nd ed.). Cambridge, UK: Cambridge University Press.Blieszner, R., Willis, S.L., & Baltes, P.B. (1981). Training research in aging on the fluid ability of
inductive reasoning. Journal of Applied Developmental Psychology, 2, 247–265.Bond, M.H., & Van de Vijver, F.J.R. (in press). Making scientific sense of cultural differences in
psychological outcomes: Unpackaging the magnum mysterium. In F.J.R. van de Vijver & D.Matsumoto (Eds.), Research methods in cross-cultural psychology. New York: Oxford UniversityPress. in press.
Carroll, J.B. (1993). Human cognitive abilities. A survey of factor-analytic studies. Cambridge, UK:Cambridge University Press.
Dolan, C.V., Roorda, W., & Wicherts, J.M. (2004). Two failures of Spearman’s hypothesis: TheGATB in Holland and the JAT in South Africa. Intelligence, 32, 155–173.
Fleishman, E.A., & Hempel, W.E. (1954). Change in factor structure of a complex psychomotor testas a function of practice. Psychometrika, 19, 239–252.
Frijda, N., & Jahoda, G. (1966). On the scope and methods of cross-cultural research. InternationalJournal of Psychology, 1, 109–127.
Grigorenko, E.L., & Sternberg, R.J. (1998). Dynamic testing. Psychological Bulletin, 124, 75–111.Helms-Lorenz, M., Van de Vijver, F.J.R., & Poortinga, Y.H. (2003). Cross-cultural differences in
cognitive performance and Spearman’s Hypothesis: G or C?. Intelligence, 31, 9–29.Herrnstein, R.J., & Murray, C. (1994). The bell curve. Intelligence and class structure in American life.
New York: Free Press.Hick, W.E. (1952). On the rate of gain of information. Quarterly Journal of Experimental
Psychology, 4, 11–26.Irvine, S.H. (1979). The place of factor analysis in cross-cultural methodology and its contribution to
cognitive theory. In L. Eckensberger, W. Lonner, & Y.H. Poortinga (Eds.), Cross-culturalcontributions to psychology (pp. 300–341). Lisse, The Netherlands: Swets & Zeitlinger.
Jensen, A.R. (1980). Bias in mental testing. New York: Free Press.Jensen, A.R. (1985). The nature of Black–White difference on various psychometric tests:
Spearman’s hypothesis. Behavioral and Brain Sciences, 8, 193–263.
232 F.J.R. van de Vijver

Jensen, A.R. (1993). Spearman’s Hypothesis tested with chronometric information processing tasks.Intelligence, 17, 47–77.
Jensen, A.R. (1998). The g factor. The science of mental ability. Westport, CT: Praeger.Kail, R. (1988). Developmental functions for speeds of cognitive processes. Journal of Experimental
Child Psychology, 45, 339–364.Kirsner, K., & Speelman, C. (1996). Skill acquisition and repetition priming: One principle, many
processes? Journal of Experimental Psychology: Learning, Memory, and Cognition, 22, 563–575.
Logan, G.D. (1988). Toward an instance theory of automatization. Psychological Review, 95, 492–527.
Lynn, R., & Owen, K. (1994). Spearman’s hypothesis and test score differences between Whites,Indians, and Blacks in South Africa. Journal of General Psychology, 121, 27–36.
Neisser, U., Boodoo, G., Bouchard, T.J., Jr., Boykin, A.W., Brody, N., Ceci, S.J., et al. (1996).Intelligence: Knowns and unknowns. American Psychologist, 51, 77–101.
Neubauer, A.C., & Benischke, C. (2002). Der Zusammenhang von Intelligenz und Informationsver-arbeitungsgeschwindigkeit im interkulturellen Vergleich [A cross-cultural comparison of therelationship between intelligence and speed of information processing in Austria vs. Guatemala].Psychologische Beitraege, 44, 521–534.
Nkaya, H.N., Huteau, M., & Bonnet, J. (1994). Retest effect on cognitive performance on theRaven–38 Matrices in France and in the Congo. Perceptual and Motor Skills, 78, 503–510.
Ombredane, A., Robaye, F., & Plumail, H. (1956). Resultats d’une application repetee du matrix-couleur a une population de Noirs Congolais [Results of a repeated application of the coloredmatrices to a population of Black Congolese]. Bulletin, Centre d’Etudes et RecherchesPsychotechniques, 6, 129–147.
Organisation for Economic Co-operation and Development. (2004). Table B1.1 Annual expenditureon educational institutions per student (2001) in equivalent US dollars converted using PPPs, bylevel of education, based on full-time equivalents. Retrieved September 1, 2007, from http://www.oecd.org/dataoecd/50/23/33670844.xls
Poortinga, Y.H. (1971). Cross-cultural comparison of maximum performance tests: Somemethodological aspects and some experiments with simple auditory and visual stimuli.Johannesburg, South Africa: National Institute for Personnel Research.
Poortinga, Y.H., & Van de Vijver, F.J.R. (1987). Explaining cross-cultural differences: Bias analysisand beyond. Journal of Cross-Cultural Psychology, 18, 259–282.
Posner, M.I., & McLeod, P. (1982). Information processing models – in search of elementaryoperations. Annual Review of Psychology, 33, 477–514.
Sarnacki, R.E. (1979). An examination of test-wiseness in the cognitive test domain. Review ofEducational Research, 49, 252–279.
Shebani, M.F.A., Van de Vijver, F.J.R., & Poortinga, Y.H. (2005). A cross-cultural test of thephonological loop hypothesis. Memory & Cognition, 33, 196–202.
Shebani, M.F.A., Van de Vijver, F.J.R., & Poortinga, Y.H. (in press). Memory development inLibyan and Dutch school children. European Journal of Developmental Psychology.
Smith, P.L. (2000). Stochastic dynamic models of response time and accuracy: A foundationalprimer. Journal of Mathematical Psychology, 44, 408–463.
Sternberg, R.J., Grigorenko, E.L., Ngorosho, D., Tantufuye, E., Mbise, A., Nokes, C., et al. (2002).Assessing intellectual potential in rural Tanzanian school children. Intelligence, 30, 141–162.
Te Nijenhuis, J., & Van der Flier, H. (2003). Immigrant-majority group differences in cognitiveperformance: Jensen effects, cultural effects, or both?. Intelligence, 31, 443–459.
United Nations Statistics Division. (2007). Social indicators. Retrieved September 1, 2007 fromhttp://unstats.un.org/unsd/demographic/products/socind/education.htm
Vander Steene, G., Van Haassen, P.P., De Bruyn, E.E.J., Coetsier, P., Pijl, Y.J., Poortinga, Y.H.,et al. (1991). WISC-R, Nederlandstalige uitgave: Verantwoording [WISC-R, Dutch languageedition: Research Report]. Lisse, The Netherlands: Swets & Zeitlinger.
Van de Vijver, F.J.R. (1997). Meta-analysis of cross-cultural comparisons of cognitive testperformance. Journal of Cross-Cultural Psychology, 28, 678–709.
Van de Vijver, F.J.R. (2002). Inductive reasoning in Zambia, Turkey, and The Netherlands:Establishing cross-cultural equivalence. Intelligence, 30, 313–351.
Van de Vijver, F.J.R., Daal, M., & Van Zonneveld, R. (1986). The trainability of abstract reasoning:A cross-cultural comparison. International Journal of Psychology, 21, 589–615.
Educational Research and Evaluation 233
Van de Vijver, F.J.R., & Leung, K. (1997). Methods and data analysis of comparative research. InJ.W. Berry, Y.H. Poortinga, & J. Pandey (Eds.), Handbook of cross-cultural psychology (2nd ed.,Vol. 1, pp. 257–300). Boston: Allyn & Bacon.
Van de Vijver, F.J.R., & Willemse, G.R. (1991). Are reaction time tasks better suited for ethnicminorities than paper-and-pencil tests? In N. Bleichrodt & P.J.D. Drenth (Eds.), Contemporaryissues in cross-cultural psychology (pp. 450–464). Lisse: Swets & Zeitlinger.
Van de Vijver, F.J.R., Willemse, G.R.C.M., & Van de Rijt, B.A.M. (1993). Het testen van cognitievevaardigheden van allochtone leerlingen [The assessment of cognitive skills of immigrant pupils].De Psycholoog, 28, 152–159.
Vernon, P.A. (1987). Speed of information-processing and intelligence. Norwood, NJ: Ablex.Wagenmakers, F. (1994). Reactiesnelheid en intelligentie: Een kwantitatief onderzoek naar de relatie
tussen reactietijdtaken en intelligentie bij allochtonen en autochtonen [Reaction speed andintelligence: A quantitative study of the relationship between reaction time measures andintelligence among mainstreamers and immigrants]. Unpublished master’s thesis, TilburgUniversity, The Netherlands.
Wagner, D.A. (1981). Culture and memory development. In H.C. Triandis & A. Heron (Eds.),Handbook of cross-cultural psychology. Developmental psychology (Vol. 4, pp. 178–232). Boston:Allyn & Bacon.
Whiting, B.B. (1976). The problem of the packaged variable. In K. Riegel & J. Meacham (Eds.), Thedeveloping individual in a changing world (Vol. 1, pp. 303–309). The Hague, The Netherlands:Mouton.
Wing, H. (1980). Practice effects with traditional mental test items. Applied PsychologicalMeasurement, 4, 141–155.
.
234 F.J.R. van de Vijver