
On the Marginal Utility of Network Topology Measurements · On the Marginal Utility of Network...
13
On the Marginal Utility of Network Topology Measurements Paul Barford, Azer Bestavros, John Byers, Mark Crovella Abstract— The cost and complexity of deploying measurement in- frastructure in the Internet for the purpose of analyzing its structure and behavior is considerable. Basic questions about the utility of increasing the number of measurements and measurement sites have not yet been addressed which has led to a “more is better” approach to wide-area measure- ment studies. In this paper, we step toward a more quan- tifiable understanding of the marginal utility of performing wide-area measurements in the context of Internet topology discovery. We characterize the observable topology in terms of nodes, links, node degree distribution, and distribution of end-to-end flows using statistical and information-theoretic techniques. We classify nodes discovered on the routes be- tween a set of 8 sources and 1277 destinations to differentiate nodes which make up the so called “backbone” from those which border the backbone and those on links between the border nodes and destination nodes. This process includes reducing nodes that advertise multiple interfaces to single IP addresses. We show that the utility of adding sources be- yond the second source quickly diminishes from the perspec- tive of interface, node, link and node degree discovery. We also show that the utility of adding destinations is constant for interfaces, nodes, links and node degree indicating that it is more important to add destinations than sources. Keywords— Network measurement, traceroute, topology discovery, Internet tomography I. I NTRODUCTION An emerging strategy to gain insight into the conditions and configuration inside the Internet is the use of end-to- end measurements from a set of distributed measurement points. A design goal of the Internet has been to emphasize This work was partially supported by NSF research grants CCR- 9706685 and ANIR-9986397. The data used in this research was col- lected as part of CAIDA’s skitter initiative,http://www.caida.org. Sup- port for skitter is provided by DARPA, NSF, and CAIDA membership. P. Barford is with the University of Wisconsin, Madison. A. Bestavros, J. Byers and M. Crovella are with the Computer Sci- ence Department at Boston University. E-mail: [email protected], best,byers,crovella @cs.bu.edu . simplicity in its internal components; for this reason, mea- surements made at network endpoints are especially attrac- tive. An example of this approach is the use of tracer- oute [17] for the discovery of network connectivity and routing. While traceroute is remarkably flexible and informative, it is an open question how useful traceroute is for uncov- ering topological information about the Internet. In this paper we study the use of traceroute as a tool for Inter- net topology discovery. We consider the common case, in which active measurement sites (traceroute sources) are relatively scarce, while passive measurement sites (tracer- oute targets) are plentiful. In such experiments, each traceroute source is able to discover a directed graph, in- duced by IP routing, from itself to all of the destinations. 1 We are interested in the properties of the graph that is formed by the union of these individual views. In order to find the union of these views it is necessary to identify routers that advertise multiple interfaces, and to associate each advertised interface with a router. Our first contribution is to discuss our experiences in solving this problem and assess the importance of this issue when merging multiple traceroutes into a single graph. Our main contribution is to show how studying this graph helps clarify how end-to-end paths pass through the Internet. A principal observation is that the marginal util- ity of adding additional active measurement sites declines rapidly after the second or third site. This motivates a rough model for the routing graph discovered by tracer- oute as a richly-connected “switching core” fed by ingress and egress paths (“feeders”). Our work indicates that the core consists of a relatively small fraction of nodes and we show that almost all paths in our data pass through this core. If the source-destination pairs in our data are representa- tive of typical endpoint pairs for IP flows, then the switch- ing core is common to most end-to-end paths taken in the Internet. Thus the properties of the core are especially We make the simplifying assumption that IP routing paths are stable over the timeframe of individual traceroute executions; while this as- sumption is sometimes incorrect, it frees us to focus on a different set of questions. Note that this assumption does not imply that the resulting directed graph from a source is a tree.
Transcript of On the Marginal Utility of Network Topology Measurements · On the Marginal Utility of Network...
OntheMarginalUtility of Network TopologyMeasurements
PaulBarford,AzerBestavros,JohnByers,Mark Crovella
Abstract—The cost and complexity of deploying measurement in-
frastructur e in the Inter net for the purpose of analyzingits structur e and behavior is considerable. Basic questionsabout the utility of increasingthe number of measurementsand measurement siteshave not yet beenaddressedwhichhasled to a “mor eis better” approachto wide-areameasure-ment studies. In this paper, we step toward a more quan-tifiable understanding of the marginal utility of performingwide-areameasurementsin the context of Inter net topologydiscovery. Wecharacterizethe observable topology in termsof nodes,links, nodedegreedistrib ution, and distrib ution ofend-to-endflows using statistical and information-theoretictechniques. We classify nodesdiscovered on the routesbe-tweena setof 8 sourcesand 1277destinationsto differ entiatenodeswhich make up the so called “backbone” fr om thosewhich border the backboneand thoseon links betweentheborder nodesand destination nodes. This processincludesreducing nodesthat advertise multiple interfaces to singleIP addresses.We show that the utility of adding sourcesbe-yond the secondsourcequickly diminishesfr om the perspec-tive of interface, node, link and node degreediscovery. Wealso show that the utility of adding destinationsis constantfor interfaces,nodes,links and node degreeindicating thatit is more important to add destinationsthan sources.
Keywords— Network measurement, traceroute, topologydiscovery, Inter net tomography
I . INTRODUCTION
An emergingstrategy to gain insightinto theconditionsandconfigurationinsidethe Internetis the useof end-to-endmeasurementsfrom a setof distributedmeasurementpoints.A designgoalof theInternethasbeento emphasize
This work was partially supportedby NSF researchgrantsCCR-9706685andANIR-9986397.Thedatausedin this researchwascol-lectedaspartof CAIDA’s skitter initiative,http://www.caida.org. Sup-port for skitteris providedby DARPA, NSF, andCAIDA membership.
P. Barford is with the University of Wisconsin, Madison. A.Bestavros, J. Byers and M. Crovella are with the ComputerSci-ence Departmentat Boston University. E-mail: [email protected],�best,byers,crovella� @cs.bu.edu.
simplicity in its internalcomponents;for this reason,mea-surementsmadeatnetwork endpointsareespeciallyattrac-tive. An exampleof this approachis theuseof tracer-oute [17] for thediscovery of network connectivity androuting.
While tracerouteis remarkablyflexible andinformative,it is anopenquestionhow usefultracerouteis for uncov-ering topologicalinformation aboutthe Internet. In thispaperwe study the useof tracerouteas a tool for Inter-net topology discovery. We considerthe commoncase,in whichactivemeasurementsites(traceroutesources)arerelatively scarce,while passive measurementsites(tracer-oute targets) are plentiful. In such experiments,eachtraceroutesourceis ableto discover a directedgraph,in-ducedby IP routing,from itself to all of thedestinations.1
We are interestedin the propertiesof the graph that isformedby theunionof theseindividual views.
In orderto find theunionof theseviews it is necessaryto identify routersthat advertisemultiple interfaces,andto associateeachadvertisedinterfacewith a router. Ourfirst contribution is to discussour experiencesin solvingthis problemandassesstheimportanceof this issuewhenmergingmultiple traceroutesinto asinglegraph.
Our main contribution is to show how studying thisgraphhelpsclarify how end-to-endpathspassthroughtheInternet.A principalobservation is that themarginal util-ity of addingadditionalactive measurementsitesdeclinesrapidly after the secondor third site. This motivatesarough model for the routing graphdiscoveredby tracer-outeasarichly-connected“switchingcore” fedby ingressandegresspaths(“feeders”). Our work indicatesthat thecoreconsistsof arelatively smallfractionof nodesandweshow that almostall pathsin our datapassthroughthiscore.
If thesource-destinationpairsin ourdataarerepresenta-tiveof typicalendpointpairsfor IP flows, thentheswitch-ing coreis commonto mostend-to-endpathstakenin theInternet. Thus the propertiesof the core are especially�
Wemakethesimplifying assumptionthatIP routingpathsarestableover the timeframeof individual tracerouteexecutions;while this as-sumptionis sometimesincorrect,it freesus to focuson a differentsetof questions.Notethatthisassumptiondoesnotimply thattheresultingdirectedgraphfrom a sourceis a tree.

Leaf StubBorder Backbone
Fig. 1. Classificationof Internetnodes
interestingfor understandingInternetperformance. Wenotethat,comparedto thesetof all switchingcorenodespresentin ourdataset,themajority arevisible from only asinglemeasurementsource.Thatis, setsof IP flows origi-natingfrom differentlocationstendto passthroughsimilarsetsof switchingnodeson their way to commondestina-tions. This makesit relatively lessproductive to discovernew switchingnodesby addingsources,evenwhenthesetof measurementdestinationsis large.
To assistusin ourtask,wehaveleverageddetailedrout-ing tracesgatheredby CAIDA (Cooperative Associationfor Internet Data Analysis) for the Skitter project [11].Thesetracesspanthousandsof routesbetween8 sourcesand1277destinationstakenrepeatedlyover thecourseofseveral months. While we canprovide no guaranteethattheCAIDA measurementsiteswerechosenin a represen-tative way, the locationof thesitesaregeographicallydi-verse,spanningNorth America,EuropeandAsia. Com-piling togetherall nodesandedgesof thegraphvisitedbyroutesin thesetraces,we built up a partial pictureof theway the Internetbackboneappearedin May 2000. Then,usingthis pictureasourbaseline,we go backto thetracesto observewhich paths,or collectionsof paths,weremostproductive in generatingtheoverallmap.
To understandthetopologydiscoveryprocessin greaterdetail, we employ a nodeclassificationtechniquewhichorganizesnodesinto oneof four types:leafs,stubs,borderandbackboneillustratedin Figure1. For the graphthatwe evaluate(after resolvingroutersthat advertisemulti-ple interfacesto a singlenode)over half of thenodesdis-coveredareclassifiedasbackbonenodeswhile lessthan10%arebordernodes,giving a pictureof thecollectedIProutesas consistingof a large backbonewith somewhatlimited ingressandegress.Much of our analysisfocuseson marginal utility with respectto thediscovery andchar-acterizationof backbonenodes.
The restof the paperis organizedas follows. In Sec-tion II we describerelatedanalyticalwork in evaluatingtheeffectivenessof deploying wide-areameasurementin-frastructurewith a focuson topologymapping.In SectionIII, weestablishbasicdefinitionsfor thenetworkdiscoveryproblemswe considerandoutlinehow to casttheseprob-
lemsin amarginalutility framework. In SectionIV, wede-scribeour dataset,our graphclassificationprocedureandthe limitations of our approach.We presentour statisti-calresultsfor interfacedisambiguation,nodeclassificationandmarginal utility in SectionV. We defineinformation-theoretictoolsandresultsfrom theirapplicationto thedatain SectionVI. Wesummarize,concludeanddiscussfuturework in SectionVII.
I I . RELATED WORK
A numberof researchgroupshave generatedmapsofthe Internetusing route tracing tools suchastracer-oute [8], [11] andhavebuilt repositoriesof Internetmap-ping information.We now survey themostcloselyrelatedof thoseworksto ours.
Work by Govindan [24], [14] outlinesheuristic tech-niquesfor generatingcompletedomainmaps.Oneof thechallengesin this areagoesfar beyond thecapabilitiesoftraceroute,and lies in mappingout the nooksand cran-nies of regions in autonomoussystems(AS’s) which donot transit a substantialamountof data. This work alsodiscussestheproblemof alias resolutionin detail,whichis thesameasour interfacedisambiguationproblem.Theyemploy thesametechniquesaswe do to resolve multipleinterfacesat asinglenode.
Jaminetal [18] studyalgorithmsfor effectiveplacementof Internetinstrumentationin thecontext of their IDMapsproject,a projectwhich seeksto provide anInternet-widedistanceestimationservice,following thearchitecturede-signedin [12]. Themajorityof theirwork focusesonalgo-rithmic approachesfor placinga fixedsetof measurementsitesongeneratedtopologies,andmeasurementsontheef-fectivenessof the placement.While their work mentionsdiminishingreturnsin thecontext of infrastructureplace-ment,it doesnotprovideanalyticalresultsin thisarea.
PansiotandGrad[19] reporton the topologyresultingfrom a detailedcollectionof end-to-endroutesthey col-lectedin 1995 with the goal of constructingrepresenta-tive multicasttrees. Using traceroute,they tracedroutesto 5000geographicallydistributedhostschosenfrom theirnetwork accountingdatabase.Thenthey choseasubsetof11 of thesehoststo be additionalsourcesof routes,andran traceroutefrom these11 hoststo eachof the original5000hosts(with theassistanceof theLooseSourceRout-ing option). In the topologyrevealedby this experiment,they found that the routesfrom any subsetof six sourcescontainednearly90% of the nodesandedgesultimatelydiscovered. They alsoprovided a classificationof nodessimilar to theonewe provide andpresentthedistributionof the degreeof nodesof the graphthey discover, a dis-tribution which clearly follows a power law. (This power
law andevidenceof otherpower laws in this dataset,aswell asin otherdatasets,werereportedin [10]). However,they provide no qualitative discussionof thecharacteriza-tion of thetopologythatthey obtain,nordothey attempttoquantifythemarginalvalueof informationgainedasmea-surementsareadded.
Broido andClaffy [5] alsoleveragetraceroutedatasetsfrom CAIDA to build up andstudy the aggregation of asetof treetopologiesinducedby IP routing. While theireffort doesprovide useful characterizationsand insightsinto thesetopologies,it doesnot focuson thequestionsofmarginalutility whichwestudyhere.
Paxson[20], [21], [22] deployeda “network probedae-mon” (NPD) at 37 sites in the wide-area,which usedtraceroute to investigateend-to-endroutingbehaviorandlater, performanceof transportprotocolsbetweenallpairs of sitesover several weeks. His work emphasizedthe importanceof exploring a large numberof pathstoobserve rare and occasionallyanomalousrouting behav-ior. Paxsonalsostudiedtheissueof interfacedisambigua-tion in [21] from the perspective of resolving nodestogeographiclocationsandnot necessarilyspecificrouters.Wide-areameasurementandanalysiscontinuesto bea fo-cusof many researchandindustrygroupsincludingNIMI[2], WAWM [3] andSurveyor [25]. Anotherpieceof gen-erally relatedwork aretheInternetweatherreportssuchas[27], [26]. Thesearegeneralcompilationsof the packetlossandroundtrip timemeasurementsfrom Internetmon-itoring boxesdeployedin thewide-area.
Finally, other recentstudieshave usedmeasurement-basedapproachesto studyaspectsof theInternettopology,albeit usingdifferent tools. Someresearchershave usedlogs collectedin the wide-areaby BGP-capableroutersto study the effectsof policy-basedrouting, with an em-phasison quantifying the inflation in route lengths[16],[31], [28]. At a higherlevel of abstraction,therehasbeenconsiderablework onunderstandingAS-level connectivity[13], [4] includingwork which leveragestraceroutemea-surementsandBGProutesto helpinfer AS-Level connec-tivity [7], [6], Thesepiecesof work, like ours,emphasizetheimportanceof incorporatingsnapshotstakenfrom mul-tiple vantagepointsto providing themostcompletereflec-tion of theoverall topology.
I I I . DEFINITIONS AND OBJECTIVES
The network discovery problemswe considerhave anaturalgraph-theoreticformulation, study of which maybe of independentinterest both to theoristsand to re-searcherswho wish to bettercharacterizenetwork topolo-gies.Consideranetwork topologyrepresentedby anundi-rectedgraph ������� ��� in which � ������� . The central
questionwhich we studyis theextent to which theunder-lying topologycanaccuratelybecharacterizedasthenum-berof end-to-endobservationpointsgrows. In practice,weassumethat � sourcesand � destinationsarechosenuni-formly at randomfrom thevertex setof this graph. Thenwe considerthefractionof thevertex setandedgesetthatis coveredby thesetof routingpathsfrom thesourcestoeachof thedestinations,usingthefollowing terminology.
Definition1: Givenagraph������������ andasubgraph�������� �!��"�#� of � , thenodecoverage of � by ��� is theratio $ %'&($$ %)$ . Similarly, theedge coverage of � by ��� is the
ratio $ *+&($$ *�$ .Definition2: Take a setof sourcevertices ,�-.� and
a set of destinationvertices / -0� . Also assumethatwe have a routingalgorithm 1 which selectsfixed routesbetweenall pairs 2 34, , 5637/ . Wedefinetheunionof thesetof �28959� pathsin � to bethesubgraphof � inducedby1 onall pairsof routesfrom , to / .
The subgraphinducedby a routing algorithm corre-spondsto overlaysof “projections”from multiplesources,i.e. theunionof individual directedgraphsrootedat thesevantagepointsto thesetof destinations.Thefunctionsde-finedbelow describehow coverageincreasesasthenum-ber of endpointsusedto generatethe inducedsubgraphgrows.
Definition3: For a graph � with routesinducedby 1andfor parameters� and � , let :<;=���>9�7� denotethe ex-pectednodecoverageof � by thesubgraphinducedby arandomlychosensetof sources, of cardinality � , a ran-domlychosensetof destinations/ of cardinality � . Sim-ilarly, let ?@;=��AB�7� denotetheexpectededgecoverageof� by sucha subgraph.
The rateat which :<; and ?@; changewith respectto �and� giveinsightinto thebenefitof conductingadditionalmeasurementsor deploying additionalmeasurementsitesin discovering a given graph � . Thesefunctionswhichwe considerarea generalfamily of scalingpropertiesofwhich somespecificcasesare also beingcarefully stud-ied. For example,considerthesefunctionsfor thespecialcaseof �C�ED , which describesthe scalingbehavior of amulticasttreeto � clients.This relationshipwasfirst con-sideredby ChuangandSirbu [9]. Their work, andsubse-quentwork by Phillips,ShenkerandTangmunarunkit[23],demonstratesthat the numberof hopsin a multicasttree,i.e. ?@;=�BDFB�7� , scalesasE GIHJ;LKM�ONQP R for �TS S�� , whereE G HU;LK capturestheaveragepathlengthin � . In ourwork,we considercasesin which �WV0D andwhere � canbemoderatelylarge(we notethatanotherinterestingspecial

caseariseswhen �X�Y� ).2 A relateddirectionof futureinterestlies in the characterizationand understandingofthoseregionsof theInternettopologywhich arerelativelydifficult to uncover usingtraceroute.Sucha studycouldconceivably leadto a betterunderstandingon theconnec-tion betweentopologyandroutingbehavior or providefur-ther insight into relationshipsbetweentopologyandpeer-ing agreements.
We focus specificallyon marginal utility, i.e. the in-crementalbenefitobtainedby conductingoneor moread-ditional measurements.For edgecoverage,we definethemarginal utility of addingtargetsasfollows (relateddefi-nitionsaresimilar):
Definition4: The marginal utility of conductingedgecoveragemeasurementZ6[.D on graph ��� from a set of� sourcesis ? � ; ���>9ZA[WD\�^]_? �; ���>9Z`� .
This andrelatedquantitieswill betheprimary focusofthe restof thepaper. We first studymarginal utility froma purelyempiricalperspective, focusingon thedistinctionbetweenthecoreof thenetwork andfeedernetworks. Wethenreturnto theproblemfrom a theoreticalperspective,developingandstudyingan information-theoreticformal-ismof marginalutility in thiscontext.
IV. EXPERIMENTAL METHODOLOGY
Wenow presenttheexperimentalmethodologyweusedto investigatescalingbehavior in theInternet.Thetracer-outedatasetsweusein thissectiondeviatein severalwaysfrom theidealtheoreticalframework weprescribedin Sec-tion III, anda significantportionof this sectionis devotedto a discussionof additionalassumptionswhich we madeandadescriptionof mechanismsfor post-processingof ac-tualdatasets.
A. InternetTraceData
Thetopologydatausedin thiswork wassuppliedby theSkitter projectat CAIDA. The Skitter projecthasa num-ber of goalsincluding Internetmapping,routecharacter-istic analysisandperformanceanalysis. At the time theprimary datasetfor this studywascollected(May 2000),theSkitter infrastructureconsistedof 16 sourcenodesde-ployedaroundtheworld; wereceiveddatafrom 8 of thosenodes. Eachsourcenodesendstraceroute-like probestodestinationnodeslocatedworld-wide. All of thedestina-tion nodesareWebservers.Our primarydatasetcontainsresultsfrom tracesrun to 1277 destinations;The sourcenodesandthecorrespondingupstreamproviders(listedina
While our work is primarily experimentalin nature,we believe thatthe theoreticalstudyof thesepropertieson graphsof interest(suchaspower-law graphsvs. randomgraphs)with idealizedroutingalgorithms(suchasuseof shortest-pathroutes)mayhelpprovidedeeperinsight.
parentheses)werelocatedin Hamilton,NZ (UniversityofWaikato);Tokyo, Japan(APAN), Singapore,SG(providerunknown); San Jose,CA, USA (Worldcom); San Jose,CA, USA (ABOVENet); Ottawa, CA (CANET); London,UK (RIPE); andWashingtonDC, USA(QWest). On av-erage,probesaresentto eachdestinationonceevery 30minutes. While it is not clearpreciselyhow destinationsfor destinationsare selectedin Skitter, the Skitter website statesthat destinationsarerandomlysampledfrom a“crawl of IP addressspace”[11]. We alsoincluderesultsfrom a larger datasetwith 12 sourcesand over 300,000destinations. This datasetincludesthe eight sites listedabove, with the exceptionof Singapore,plus Marina DelRey, CA, USA (ISI); Moffett Field, CA, USA (NASA),Palo Alto, CA, USA; SanDiego,CA, USA (CAIDA) andLondon,UK ()
B. NodeandEdgeClassification
Using theexperimentalresultswe gathered,it wasim-mediatelyapparentthatthenetwork graphunderobserva-tion wasnot a randomnetwork, but consistedof two con-stituentcomponents:1) a centralrouting core, and 2) aset of “feeder” links which feed into the backbone.Wethenfocusedonhow successfullytraceroutecouldbeusedwhenappliedto identifying thesetwo constituentcompo-nents,which hadevidently differentproperties.A centralchallengeto doing so is to develop an automatedproce-dure which classifiesnodes(and edges)into thesecate-gories. Using the terminologyof Zeguraet al [33] to de-scribetheir GT-ITM topologygenerator, we assumethatthereis a naturalandidentifiableseparationbetweentran-sit domains,which comprisethe Internetbackbone,andstubdomains,which only transittraffic eitheroriginatingor terminatingin their domain. In this model, the setoftransitdomainstypically forms a highly connectedback-bone,with a number(at leasttwo andoften many more)of node-disjointpathsbetweenany two transit domains,while stubdomainstypically consistof treeswith a singleconnectionto thetransitdomainbackbone.
The objective of our classificationalgorithmis to takeour observationsof a topologyanddeterminethe bound-ary betweenwherethe backboneendsandstubdomainsbegin basedon the availableevidence. Therearea num-ber of reasonswhy our classificationproceduremay failto classifynodescorrectly– in future work, we intendtoconductvalidation trials to measurethe effectivenessofour classificationmethodsfrom traceroutemeasurements.Routesto destinationswhichdid not respondto thetracer-outerequestswerediscarded,but routesin which interme-diate hostsfailed to respondto ICMP requestswere in-cluded.Evenusinga relatively smallnumberof measure-

mentsites,a cleardistinctionbetweenbackbonelinks andstub links in this subgraph��� emerged(we will demon-stratethisandquantifyhow mucherrorwasremovedfromour classificationprocessasthenumberof measurementsincreased).
Given this subgraph,our classificationprocedurenowamountsto a labelling of the nodesandedgesof ��� . Tothis end,nodeswhich correspondto routersandInternethostsare classifiedas core routers, border routers, stubrouters andleaf nodes. Our nodeclassificationprocedureis performedasfollows. First, leafnodesareidentifiedandlabelledassuch,andedgesadjoiningleaf nodesareclas-sifiedasstublinks. Then,in a bottom-upfashion,internalnodeswhich adjoina setof edgesall but oneof which arestublinks, areclassifiedasstubrouters.
Upon completionof this procedure,the logical treesforming the visible portion of stubdomainsin � � arees-tablished.Theremainingunclassifiednodesall satisfythepropertythatat leasttwo of their incidentedgesareunla-beled– thatentireunlabeledportionof thegraph ��� is thenetwork backbone,andwe classifyit assuch.Within thenetwork backbone,unlabellednodeswhich adjoinat leastonestub link areclassifiedasborderrouters,all remain-ing nodesare classifiedas core routers,and thoselinkswhich arenot yet classifiedarebackbonelinks. Figure1providesa simplediagramof theresultsof a classificationprocedure.
C. Coveragevs.Marginal Coverage
In theexampleswehavedescribedsofar, ourclassifica-tion procedurelabelsthesubsetof Internetnodesandlinksvisible in oneor moreof theend-to-endmeasurementsinourstudy. Sinceweareprimarily interestedin characteriz-ing the Internetbackbone,andsincewe have no expecta-tion of completelymappingstubdomains,we would ide-ally like to measurethecoverage of theInternetbackboneachieved by our experiments,using the definitions pre-sentedin SectionIII. However, thisapproachis infeasible,as the exact topology of the graphwhich comprisesthisbackboneis notknown aposteriori.While wecannotmea-suretotal coveragedirectly, we canmeasurethemarginalimprovementin coverageaswe conductadditionalmea-surements.To quantify this approach,we take theaggre-gatedinformation from all of the collectedtracesas thebaselinegraphfor our study, andmeasurehow well smallsubsetsof themeasurementsmanageto coverthatbaselinegraph. This point highlightsan importantdistinctionbe-tweenmarginal coverageandoverall coverage— thefactthat additionalmeasurementsmay provide low marginalcoveragedoesnot necessarilyimply that the overall cov-erageobtainedis high — it maybe thecasethat thecov-
erageis poor, but theadditionalmeasurementschosenarenotproductive.3
D. InterfaceDisambiguation
One of the unfortunateissuesaboutbuilding networkmapsbasedon tracerouteis the existenceof routerswithmultiple interfaces,eachwith differentnetwork addresses.This issueis pervasive– in ourstudywe foundthatnearlytwentypercentof all thenodeswe classifiedasbackbonenodesusedmultiple interfaceswith distinct IP addressesto transmitpackets. Clearly, studieswhich disregard thisissue,by treatingeachdistinctInternetaddressasif it wereadistinctnode,generateinaccuratemaps.
The techniquewe employed to disambiguatemultipleinterfacesat a single nodeusesthe samebasicprincipleastheoneoriginally usedby PansiotandGrad[19]. Thekey to this techniqueis that whentransmittingan ICMPmessage,a routerwill typically transmitthat packet witha sourceaddressequalto that of the outboundinterfaceon which the packet is sent. Therefore,if one suspectsthat a routerhastwo interfacesbdc and b\e , onecantrans-mit a UDP packet to an unusedport at eachof thosein-terfacesfrom a commonsource. If the interfacesare infact on the samerouter, the routerwill respondwith twoICMP PortUnreachablemessages,bothof whichwill havethe samesourceaddressbgf , possiblyequal to bdc or b\e .By performingpost-hocprobesof this form from a com-mon source(BostonUniversity) to all potentiallydistinctinterfaces,we areable to detectand collapsehostswithduplicateinterfaces. Unfortunately, this techniqueis notinfallible. First, approximately10% of the core routersneverrespondedto UDPmessagestransmittedto unknownports;othersrespondextremelysporadically– we conjec-turethatthelikelihoodof responsemaybecorrelatedwiththe load on the router. For thoserouters,disambiguationappearsto beimpossiblewith this currenttechnique.Sec-ond, our techniquereliesuponroutersrespondingwith asourceaddressequalto theoutboundinterface. If routersinsteadrespondwith a sourceaddressequalto the UDPdestinationaddress,our techniquewould berendereduse-less. We have no way of estimatingthe likelihoodof thisevent;however, thefactthatwefrequentlyobserverouterswhich respondwith addresseswhichdiffer from thetargetaddressgives us someinformal level of confidencethatroutersdo in factbehaveaccordingto specification.h
An analogoussituationariseswhenchoosingblack-boxtestcasestoprovidecoverageof codepathsin asoftwaremodule.
0
1000
2000
3000
4000
5000
6000
0 1 2 3 4 5 6 7
Cum
ulat
ive
Uni
que
Nod
es D
isco
vere
d
Sources
Stub InterfacesBorder Interfaces
Backbone InterfacesStub Nodes
Border NodesBackbone Nodes
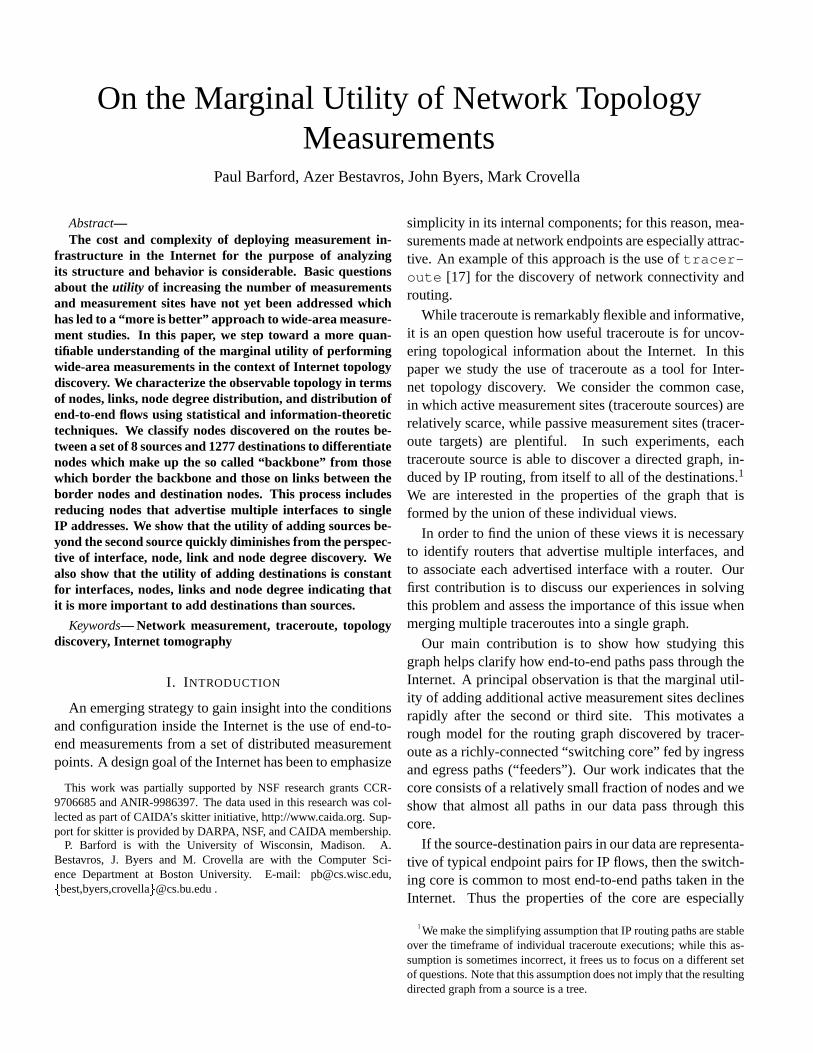
Fig. 2. Classof nodesandinterfacesdiscoveredassourcesareadded(greedily)whenclassificationis notknown apriori.
E. Accuracyof Classification
Onecentralaspectof nodeclassificationis theaccuracywith which we performclassification.With a smallnum-ber of sources(lessthanfive), many backbonenodesaremisclassifiedaseitherstubnodesor bordernodesby virtueof the fact that the observable Internetis the union of asmallnumberof trees.Figure2depictstherelativeclassifi-cationof nodesandlinks assourcesareincreased.In someplotsin thispaper, theorderin whichsourcesareaddedhasasignificantimpacton theoverall results.A greedyorder-ing addsthesourcesin theorderwhichmaximizesateachstepthe total numberof distinct nodesobserved. A ran-domorderingaveragesoverasetof trials in whichsourcesareaddedpurelyatrandom(withoutreplacement)for eachtrial. In thecontext of accuracy of classification,behaviorof greedyandrandomorderingsweresimilar; thegreedyorderingis depicted.
As we increasethe numberof sources,our classifica-tion procedureincreasesin accuracy. For example,oncewe have amassedsufficient evidenceto classifya nodeasa backboneor borderrouter, no setof additionalmeasure-mentswill reversethatclassificationdecision.Ontheotherhand,nodeswhichweinitally classifyaspartof astubdo-mainmayin factbebackbonenodes,andwemayuncoverevidenceto that effect with additionalmeasurements.Ingeneral,we expectto underestimatethe fraction of back-bonenodesandoverestimatethefractionof stubnodesinour classification.Thediagramin Figure2 quantifiesthatintuition whenthenumberof measurementsitesis small,but it is alsointerestingto notethatfor thisdataset,classi-ficationstabilizesafteronly aboutfive measurementsites(vantagepoints)areused.
F. Limitationsof theApproach
Themetricsweproposearedifficult to usedirectly, firstbecausethegraphwhich comprisesthe Internetis neitherfixed nor given in advance. Moreover, even if the graph
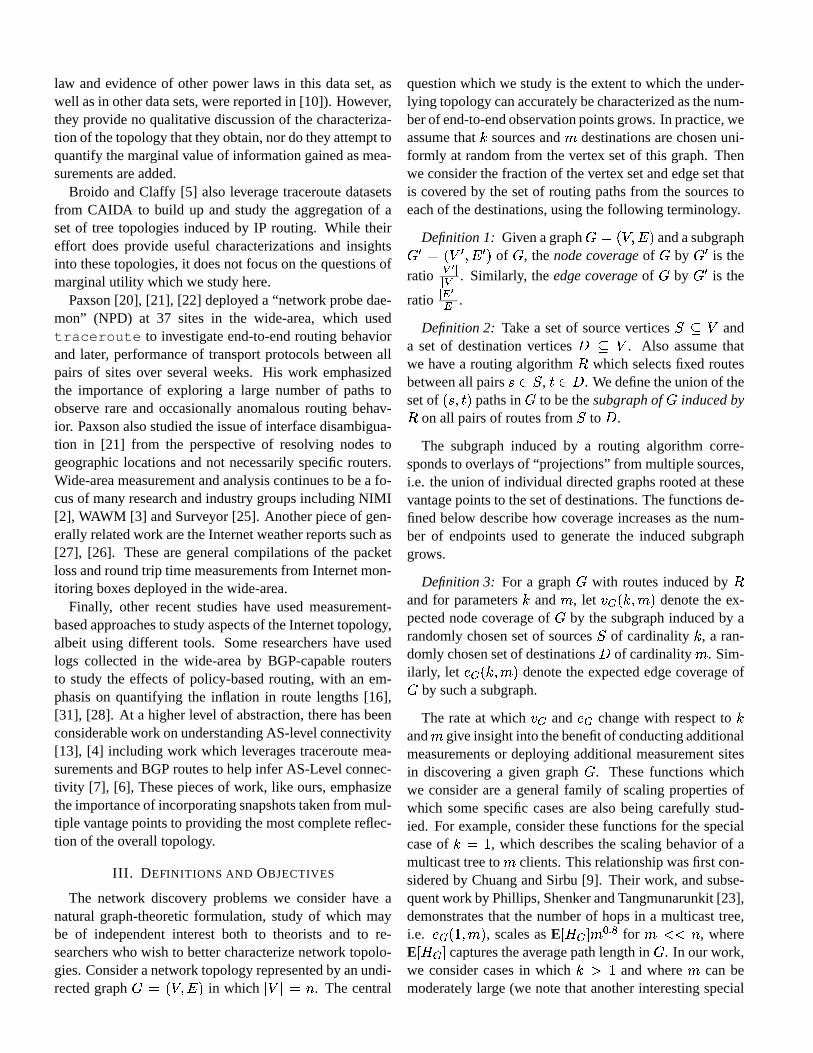
# of Interfaces 1 2 3 4 5 6 7 10# of Routers 4892 602 169 54 29 13 3 1
Fig.3. Distributionof observedinterfacedensityacrossrouters.
comprisingtheInternetwereknown in advance,our mea-suresof coveragemayfluctuate,sincethebehavior of theroutingalgorithmsin theInternetis non-deterministic,dueto theeffectof routingpolicies[28], [32]. Also, while onemight hopeto quantify topology scalinglaws on certainclassesof graphs(suchason power-law randomgraphs)whenshortest-pathrouting is in effect, policy-basedrout-ing at the level of AS’s skews (or “inflates”) routes,mak-ing theproblemof accuratelymodelingthesescalinglawsmuchmoredifficult. We notethat factorsrangingfrom awidevarietyof routingmetricsandprotocols,variability innetwork load,andpolicy-basedeconomicagreementsbe-tweenautonomoussystemscausethe routeschosento bequitedifferentthananobserver with accessonly to topol-ogy informationmight expect.
V. RESULTS
Theresultsin thissectionaredividedinto fiveparts:(1)the resultsof interfacedisambiguatonrun on all nodesinthe primary dataset, (2) a quantitative evaluationof thenumberof nodesandlinks discoveredin thebackboneasthe numberof sourcesanddestinationsvary, (3) an eval-uationof the estimateddistribution of nodedegreein thebackboneasthenumberof sourcesanddestinationsvary,(4) fitting the evidenceof theseevaluationsto statisticalmodelsand(5) assessingtheaccuracy of thenodeclassifi-cationprocedureitself.
A. Resultsof runningthedisambiguationprocedure
Approximatelythreeweeksafterthetraceroutedatawascollectedby CAIDA, we ran our interface disambigua-tion tool to all network interfaceswhich we had classi-fied as part of the network backbone. An early lessonwelearnedin ourpreliminaryexperimentswith thedisam-biguationsoftwarewasthatasubstantialfractionof routersrespondedto ourprobeswith very low frequency. In anef-fort to elicit responsesfrom asmany respondinginterfacesaspossible,we transmittedfive ICMP messagesto eachinterfaceevery twentyminutesfor 12successivehours.
Of the 7451 interfaceson our list, 6510 respondedtooneor moreof our probesandtheremaining941(12.6%)never responded.We recordedpairsof the form [TargetAddress,ResponseAddress]and recorded6709 distinctpairsfrom the 6510targetedinterfaceswhich responded.Wesuspectthatthisslight(3%)discrepancy is dueto routefluctuationaffectingthefirst hopof thereturnpathto B.U.

0
2000
4000
6000
8000
10000
12000
1 2 3 4 5 6 7 8Cum
. Uni
que
Nod
es/In
terf
aces
Dis
cove
red
iSources
InterfacesNodes
Fig. 4. Number of nodesdiscovered as sourcesare added(greedily)
anddoesnot representanomalousbehavior. Thenext stepwe took was to representthe set of addressespresentinour list of pairsasnodesin agraph.Wedrew acorrespon-dencebetweeneachconnectedcomponentof this graphandasinglerouter, wherethenodesof thecomponentcor-respondto distinct addressesfor interfacesof the router.Using this strategy, the 6510 targetedinterfacesmappedto 5763distinct routers. The distribution of multiple in-terfaceswe observed is depictedin Figure 3. Using theresultsin this table,weobservedanincidencerateof mul-tiple interfacesof R j ck jBl f �mD\npoMDrq .
B. Estimatingthesetof nodesandlinks in theInternet
In the resultsbelow, we have the goal of taking mea-surementsover a setof pathswhich cover at least � dis-tinct nodes(resp.links) in theInternet.Our first setof ex-perimentsdemonstratesrapidly diminishingmarginal re-turns as sourcesare addedto traceroutesto the full setof 1277 destinations,while our secondset demonstratesnearlyconstantmarginal returnsasdestinationsareincre-mentallyaddedto a destinationsettargetedby thefull setof 8 sources.
In Figures4 and5, we demonstratehow thenodecov-erageandlink coveragein theInternetimproveassourcesareadded.In bothof theseplots, thereis pronouncedev-idenceof diminishingreturnsassourcesareadded,whichis highly evidentevenwhenrunningtraceroutebetweenasmallnumberof sources(8) anda muchlargernumberofdestinations(1277).In eachfigurewealsodemonstratetheeffectof nodeandlink discoverybeforeandafterinterfacedisambiguation.
In Figures6 and7, we demonstratehow thenodecov-erageandlink coveragein the Internetimprove asdesti-nationsareadded. In both of theseplots, thereis a rela-tively constantadditionasdestinationsareadded.A sim-pleslopecalculationshows thatafter200destinations,ap-proximately3 new nodesarediscoveredand4 new linksare discoveredwhen a new destinationis added. Each
0
2000
4000
6000
8000
10000
12000
14000
16000
1 2 3 4 5 6 7 8
Cum
ulat
ive
Uni
que
Link
s D
isco
vere
d
sSources
Links with interfacesLinks with nodes
Fig.5. Numberof links discoveredassourcesareadded(greed-ily)
0
500
1000
1500
2000
2500
3000
3500
4000
4500
5000
0 200 400 600 800 1000 1200 1400C
umul
ativ
e U
niqu
e N
odes
Dis
cove
red
Destinations
Fig. 6. Numberof nodesdiscoveredasdestinationsareadded(randomly).Eachline is for a singlesource
of thesefiguresshows effectsafter interfacedisambigua-tion. Resultsfor interfacediscoveryareapproximatelythesame.
Next, we breakdown nodediscovery by nodeclassifi-cation. In Figure8 we show how nodesandinterfacesarediscoveredassourcesareaddedwhenthenodeclassifica-tion is known apriori. This resultshows thatweprimarilydiscover new backbonenodesandinterfacesasadditionalsourcesareadded,but backbonediscoveryshow diminish-ing marginalutility.
0
500
1000
1500
2000
2500
3000
3500
4000
4500
5000
0 200 400 600 800 1000 1200 1400
Cum
ulat
ive
Uni
que
Link
s D
isco
vere
d
sDestinations
Fig. 7. Numberof links discoveredasdestinationsareadded(randomly).Eachline is for a singlesource

0
1000
2000
3000
4000
5000
6000
7000
0 1 2 3 4 5 6 7Cum
. Uni
que
Nod
es/In
terf
aces
Dis
cove
red
iSources
Stub InterfacesBorder Interfaces
Backbone InterfacesStub Nodes
Border NodesBackbone Nodes
Fig. 8. Classof nodesandinterfacesdiscoveredassourcesareadded(greedily)whenclassificationis known apriori.
C. ContourPlots
Thefollowing diagramsplot thescalingbehavior of thesubgraphsinducedby IP routing for the topologiesob-served via the CAIDA tracedata,assumingthat eachofthe CAIDA sourcesanddestinationsreflectsa randomlychosenvertex in thegraph.In particular, we studythebe-havior of the function :<;=���>9�7� as � and � vary. Thevaluesof � and � areplottedalongthe t and u -axes,re-spectively. Eachlabelledcontour, or isoline,representsthediscoveryof afixedconstantnumberof nodes,suchthatallsetsof measurementscorrespondingto apoint �!t�Buv� alongacontourhaveanequalvalueof :<; . Ourexperimentswereconstrainedby the fact that we have a limited numberofsources,anda muchlarger setof destinations,so we areunableto plot a full square’sworth of data.Anotherpointregardingsymmetry: if both sourcesanddestinationsarechosenuniformly atrandomfrom all locationsin theInter-net,thenthelabelsof sourceanddestinationarearbitrary,which implies that wxZ zy , points �{Z �yp� and �#y<9Z|� lie alongthesamecontour.
Thedepictionshown in Figure9 4 givespreliminaryev-idencethat the isolinesdo not follow hyperbolasof theform t~}�u��m� , which would hold in theevent thateachpair of measurementsis equivalentlyuseful. Instead,andpendingfurther studyon larger tracedata,thesecontourplots indicatethatstriking a balancebetweensourcesanddestinationsis relatively lessimportantthan making useof a largenumberof sitesoverall, which canbedonerel-atively easily by employing more passive targets, ratherthanrequiringdeploymentof moreactivemeasurementin-frastructure.
�We excluded the one anomaloussourcewhich only reached184
destinationssinceits inclusionwoulddramaticallyaltertheresultsdis-playedin thisfigure.
3e+03 2.5e+03 2e+03 1.5e+03 1e+03
500
0
200
400
600
800
1000
1200
Destinations
1 2 3 4 5 6 7Sources
Fig. 9. Backbonenodediscovery asbothsourcesanddestina-tionsarevaried
D. Estimatingthedistributionof nodedegreein theback-bone
As the numberof measurementsourcesincreases,thedistributionof nodedegreein thediscoveredportionof thebackboneshown in Figures10 and 11 (especiallyin thetail) changes.We calculatedthe root meansquarediffer-enceto measurethedifferencesin thedistributionsasweaddnodes,which is shown in Figure12. Surprisingly, thedistributionon nodedegreein thebackbonewhich we ob-serve after takingmeasurementsfrom a singlesite (form-ing atreeto thesources)is bothvisibly similarandsimilarwith respectto theRMSEmetricto themorerefineddistri-bution we identify with subsequentmeasurements.Quan-tifying the refinementin our measureddistribution overtime, in Figure 11, it appearsthat the weight in the tailmay actuallydiminish somewhat as the numberof mea-surementsincrease.5 Another interestingpoint is that inthe RMSE plot in Figure12, the error actually increasesafter source6 is added.Unlike nodeandedgecoverage,whichneverdecreaseasadditionalmeasurementsarecon-ducted,theestimatednodedegreedistribution mayin factbecomelessaccurate.
We conducteda similar analysisconsideringhow theaddition of destinationnodesaffects backbonenodede-greedistributions. In Figures13 and14 we seethedistri-butionof backbonenodedegreewhenall sourcesareusedto traceto increasingnumbersof destinationsin groupsof 100. The figuresshow that while the body of the dis-�
Thereareseveralexplanationsfor why thismayarisein ourdatasetswhich we arecurrentlyinvestigating,includinga statisticallyinsignifi-cantsamplesize,effectsfrom hostswith multiple interfaces,or issuesinherentin themeasurementset-up.We planon re-runningthis exper-imentwith otherorderingsof thesourcesaspartof our furtherinvesti-gation.

0
0.1
0.2
0.3
0.4
0.5
0.6
0.7
0.8
0.9
1
0 5 10 15 20 25 30 35
P[X
<=
x]�
Node Degree
1 Server2 Servers3 Servers4 Servers5 Servers6 Servers7 Servers8 Servers
Fig. 10. CDF of backbonenodedegreeassourcesareadded(randomly)
-4
-3.5
-3
-2.5
-2
-1.5
-1
-0.5
0
0 0.2 0.4 0.6 0.8 1 1.2 1.4 1.6
log1
0(P
[X >
x])
log10(Node Degree)
1 Server2 Servers3 Servers4 Servers5 Servers6 Servers7 Servers8 Servers
Fig. 11. Tail of CDF of backbonenodedegreeassourcesareadded(randomly)
tribution staysrelatively constantasdestinationnodesareadded,the tail weight increasesas destinationnodesareadded.
E. Comparisonto Larger Dataset
The resultsso far provide considerableinsight into IProutingpatternsbut thelimited sizeof thenodesetcoveredmakesit hardto extendourconclusionsto theInternetasawhole. To addressthis we examinea muchlargerdatasetto seewhetherit shows similar patternsof diminishingre-turnswhenaddingmeasurementsites.
Theseconddatasetsconsistsof 12sourcesand313,709
0
0.005
0.01
0.015
0.02
0.025
0.03
0.035
0.04
0.045
1 2 3 4 5 6 7 8 9Roo
t Mea
n S
quar
e D
iffer
ence
in D
istr
ibut
ions
�Added Server Number
Fig. 12. Rootmeansquarederrordifferencein backbonenodedegreedistributions
0
0.2
0.4
0.6
0.8
1
0 5 10 15 20 25 30 35
P[X
<=
x]�
Node Degree
100 Destns200 Destns300 Destns400 Destns500 Destns600 Destns700 Destns800 Destns900 Destns
1000 Destns1100 Destns1200 Destns
Fig.13. CDFof backbonenodedegreeasdestinationsareadded(randomly)
-3.5
-3
-2.5
-2
-1.5
-1
-0.5
0
0.2 0.4 0.6 0.8 1 1.2 1.4 1.6 1.8 2lo
g10(
P[X
> x
])�log10(Node Degree)
100 Destns200 Destns300 Destns400 Destns500 Destns600 Destns700 Destns800 Destns900 Destns
1000 Destns1100 Destns1200 Destns
Fig. 14. Tail of CDF of backbonenodedegreeasdestinationsareadded(randomly)
destinations;thusit is morethan10 timesthe sizeof thefirst dataset. This datasetwasgatheredin October, 2000.Sourcelocationsfor this datasetwereHamilton,NZ; SanJose,CA, USA; London,UK; Marinadel Rey, CA, USA;Palo Alto, CA, USA; Tokyo, JP; Ottawa, CA; London,UK; Moffett Field,CA, USA; Washington,DC, USA; SanJose,CA, USA; andSanDiego,CA, USA.
Unlikethefirst dataset,in thiscasesourcesdid nottraceroutesto acommonsetof destinations.In fact,nodestina-tion in this setis commonto all sources.Furthermore,theconsiderablesizeof thisnodesetmakesit muchmoredif-ficult to disambiguateinterfaces,soourresultsarein termsof interfacesratherthannodes(routers).
In Figure15weshow how thenumberof interfacesdis-coveredgrows aswe addsourcesgreedily. In this case,addinga sourcemeansthat we addall the measurementpathsoriginatingfrom that source.The line labelled“in-terfaces”denotesthenumberof interfacesthatwouldhavebeendiscoveredhadeachsourcebeenusedindependentlyfrom the others. In Figure16 we show how the numberof interface-interface links discovered grows as we addsources. Presumablyeachindividual interface-interfacelink correspondsto a router-routerlink, sofor thisplot thedistinctionbetweennodesandinterfacesis lessimportant.
Thesefigures show a declining slope as sourcesare

0
100000
200000
300000
400000
500000
600000
700000
1 3 5 7 9 11
Uni
que
Inte
rfac
es D
isco
vere
d
�Sources
Cumulative InterfacesInterfaces
Fig. 15. Numberof nodesdiscoveredas sourcesare added(greedily)
0
100000
200000
300000
400000
500000
600000
700000
800000
1 3 5 7 9 11
Uni
que
Link
s D
isco
vere
d�Sources
Cumulative LinksLinks
Fig. 16. Number of links discovered as sourcesare added(greedily)
added,similar in generalshapeto Figures4 and5. Whilethe lack of identicalexperimentalsetup(i.e., the absenceof commondestinations)makes it impossibleto directlycomparethetwo pairsof figures,thesimilarity is sugges-tivethataphenomenonof diminishingreturnsasmeasure-mentsitesareaddedis presentin themuchlargerdatasetaswell.
VI . AN INFORMATION THEORETIC MEASURE OF
MARGINAL UTIL ITY
Two elementarymetrics which we definedearlier tocomparea graphto oneof its subgraphsarethenodeandedgecoverage,andmarginalutility of additionalmeasure-mentsreflectsthe increasein thesemetrics. We now re-turn to anotherquestionclosely to thoseposedin Sec-tion III: If we run additionaltraceroutesto provide fur-therrefinementto anexisting topologysnapshot,how canwe quantitavely specify the information gainedby thesemeasurements.We provide a morepreciseformulationininformation-theoreticterms.
A. Theory
The information content (measuredin bits) revealedfrom the outcome 2�� of an experiment , is definedas]����<�A�������2 � �9� [29]. For example, when there are two
equally-likely outcomesof anexperimentthentheamountof informationrevealedby theoutcomeof theexperimentis ]����<�A��po�n<����D bit. The expectedinformationcontent(measuredin bits) gainedasa resultof conductingtheex-periment, is theentropyof , .
Definition5: Theentropyof , is givenbyH��,�����]4��� � �"���2 � ���)���8�A�������2 � �9�The entropy of an experimentgivesus a measureof theusefulnessof thatexperiment,or equivalently, theaverageamountof uncertaintyremovedby theoutcomeof theex-periment[30], [1].
Consider a sequenceof � identical experiments, c �, e \o�o#o#�,�� . By identicalexperiments,we meanexper-imentsthat areaimedat discovering a commonproperty.Without loss of generality, we assumethat theseexperi-mentsareconductedin sequentialorder, i.e. theresultsofexperiment , � areknown prior to conductingexperiment,+� , whereyUV�Z .
Intuitively, themarginalutility of experiment,�� canbemeasuredin termsof the reductionin uncertaintythat re-sultedfrom conductingthis experiment. For experiment, � , thereductionin uncertaintyfor outcome2 � is simply
]����<�A�����v�2 �p� c� �B�'[����<�A�������2 �� �9�������8� ������2 �� �������2 �p� c� �d¡We define the marginal utility of experiment ,�� as themeanreductionin uncertaintythatresultedfrom conduct-ing this experiment.This quantitycanbeestimatedusingtheKullback-Leibler(K-L) distancemetric [15], which isameasureof the“relativeentropy” of experiment, � .
Definition6: Theonlinemarginal utility of experiment, � is definedto be ¢£��, � � , which is givenby:
¢J�, � �¤� ��� � ���v�2 �� �p���8� ������2 �¥� c� �������2 �� � ¡ (1)
where Z rangesover all possibleoutcomesand ������2 � � � isthe probability associatedwith outcome2�� after the con-clusionof experiments, c Q, e \ogo\ogQ,+� .
Definition6 quantifiesthe(multiplicative)gain in infor-mation(i.e. numberof bits)asaresultof additionalexper-imentation.Clearly, theutility of additionalexperimenta-tion diminishesastheaverageinformationgaindecreases.Thisoccurswhentheadditionalexperimentsrevealnonewsurprises,in thesensethat theprobabilitiesof thevariousoutcomesof anexperimentconvergeto afixedpoint.
Theformulationof marginal utility given in equation6assumesthattheevaluationof marginalutility is donein anonline fashion. In otherwords,we evaluatethe marginal

utility of experiment,^� before conductingany additionalexperiments,�¦ , �§V�� .
An alternative formulationof marginal utility evaluateseachexperimentonanex postfactobasis,measuringeachexperiment’s usefulnessoffline afterall experimentshavebeenconducted. While this evaluation cannotbe per-formedonline, it providesan estimateof marginal utilitywhichisnotbiasedby theorderingin whichmeasurementsareconducted.
Definition7: Theoffline marginal utility of experiment, � is definedto be ¢©¨£��, � � , which is givenby:¢ ¨ ��, � �¤� � � � ������2 ¨� �¥���<�A� ������2�¨� �������2 �� � � (2)
where Z rangesover all possibleoutcomesand ������2 � � � isthe probability associatedwith outcome2 � after the con-clusionof experiments, c �, e \ogo\o\�,+� , and � is the totalnumberof experimentsconducted.
B. Applicationsto Marginal Utility of NetworkTopologyMeasurements
Startingfrom the definition provided above for gaug-ing offline marginal utility, we focus on three networkcharacterizations—namely, nodecoverage,link coverage,and the distribution of backbonenodedegrees. We thenconsidertwo typesof experiments:onein which thesetofdestinationsarefixedandsourcesareaddedoneat a time,and one in which the set of sourcesare fixed and desti-nationsareaddedoneat a time. Consideringthe caseofnodecoveragewheneachof our experimentsaddsanad-ditional source,an outcomeof the experimentis a subsetof nodescovered.For simplicity, we expresstheoutcomeasa simpleprobability– theprobability thata givennodeis covered,i.e. thenodecoverage.Weconsiderthesecasesin detailnext.Utility of Adding NewTracerouteSources:UsingtheK-L distancemetricasa gaugeof marginal utility, we quan-tify the gain in information (bits) as a result of increas-ing the numberof traceroutesourcesconsidered.Figure17 shows the offline marginal utility for eachsuccessiveexperimentaimedat characterizingthe probability that anodeor link pickedat randomis discoveredusingtracer-outeexperimentsfrom Z sources.This figure alsoshowsthemarginal utility of additionalsourceswhencharacter-izing theoutdegreedistributionof backbonenodes.
Pendingfurtherstudyonlargerdatasets,Figure17givesapreliminaryindicationthatthemarginalutility of addingnew sourcesdecreasesrapidly for all threedistributions,onceasmallconstantnumberof sourcesarepresent.Utility of Adding New Traceroute Destinations: Figure
0
0.05
0.1
0.15
0.2
0.25
0.3
0.35
0.4
2 3 4 5 6 7 8
Ma
rgin
al U
tilityª
Node DiscoveryLink Discovery
Degree Characterization
Fig. 17. Utility of additionalsources(off-line)
0
0.1
0.2
0.3
0.4
0.5
0.6
20 40 60 80 100 120 140 160
Ma
rgin
al U
tilityª
Node DiscoveryLink Discovery
Fig. 18. Utility of additionaldestinations(off-line)
18 shows themarginal utility for characterizingtheprob-ability that a link (node)picked at randomis discoveredusing tracerouteexperimentsfrom a constantnumberofsourcesto Z destinations.Thefigureindicatesthatmostoftheinformationgain is achievedafterconsideringthefirst100clients.
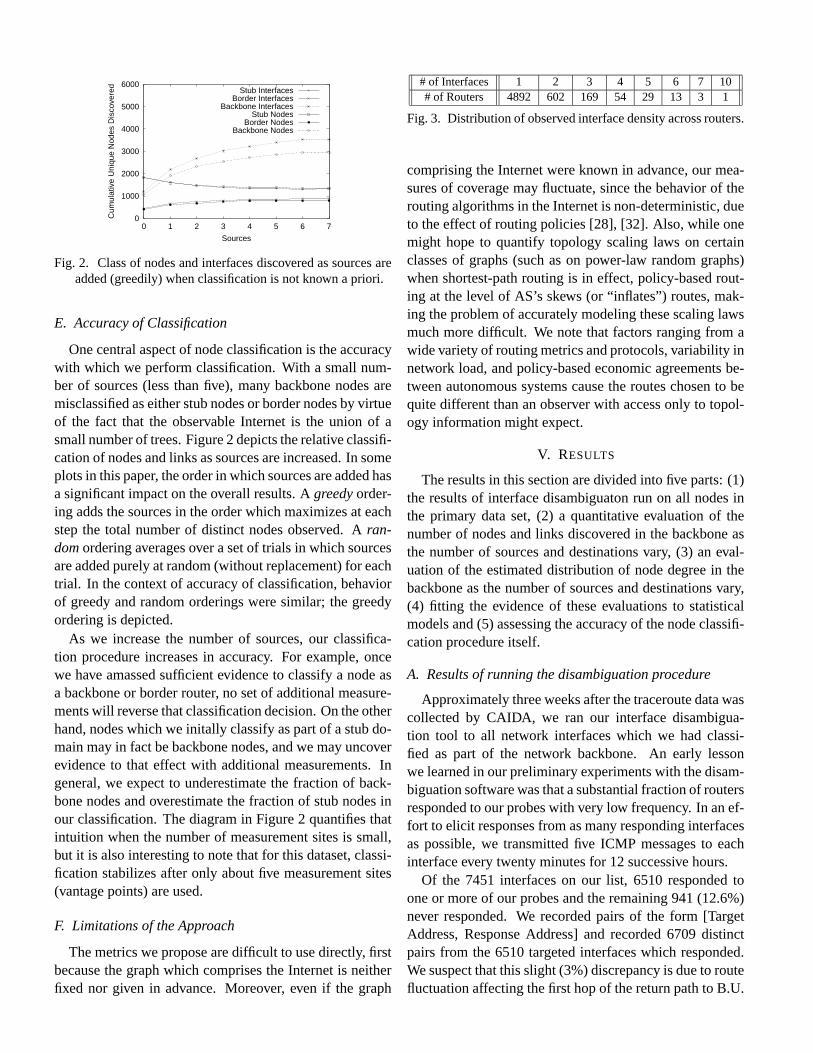
Theabovequantificationof marginalutility assumedanoffline approach(i.e. knowledgegainedthroughexper-iment Z�«X� is gaugedagainst the cumulativeknowl-edgegained throughall � experiments). Alternatively,onecouldusetheonlineapproachto incrementallyquan-tify theutility of thelastexperimentperformedandhencedeterminewhetheradditionalmeasurementsare needed.Figure19 shows theonlinemarginal utility for character-izing theprobabilitythata link (node)pickedat randomisdiscoveredusing tracerouteexperimentsfrom a constantnumberof sourcesto Z destinations.Unlike theoffline K-L distancemetric, the online K-L distancemetric is notmonotonicallydecreasing.An increasein theK-L distancemetricfor experimentZ is indicativeof anexperimentwitha “surprisingly” large informationcontent(relative to thecumulative knowledgegainedup to thatexperiment).Forexample,an addeddestinationmay result in the discov-ery of anunexpectedlylargenumberof nodes/linkssincetracerouteexperimentsto thatclientsmayfor exampleun-veil a new AS. Despitethis non-monotonicity, the mag-nitudeof the “surprises”unveiledby theon-lineK-L dis-
0
0.002
0.004
0.006
0.008
0.01
0.012
0.014
20 40 60 80 100 120 140 160
Ma
rgin
al U
tilityª
Node DiscoveryLink Discovery
Fig. 19. Utility of additionaldestinations(on-line)
tancemetricseemto decreasemonotonically.Comparative Utility of Adding SourcesversusAddingDestinations: Oneof theattractiveaspectsof informationtheoreticmeasuresof marginal utility is that they enablecomparisonof marginal utility (1) acrossmultiple distri-butions(e.g.link vsnodevsdegreediscoveryaswasdonein Figure17) and(2) acrossmultiple experimentalsetups(e.g. addingnew sourcesvs addingnew destinations).Toexemplify the latter of thesecases,considerthe questionof comparingtheutility of addingtraceroutesourcesto theutility of addingtraceroutedestinations.Comparingthere-sultsillustratedin Figure17 to thoseillustratedin Figure18 revealsthat doublingthe numberof destinationsfrom80 to 160while holding thenumberof sourcesfixedat 8(a total of 640additionaltracerouteexperiments)yieldsamarginalutility thatis approximatelyequivalentto thatre-sultingfrom increasingthenumberof sourcesfrom 7 to 8while runningtracerouteto all 1277destinations(atotalof1,277additionaltracerouteexperiments).
VI I . CONCLUSIONS AND FUTURE WORK
In principle, it shouldbe possibleto gain considerableinsightinto theconditionsandconfigurationsin thecoreoftheInternet,givenasufficientarrayof measurementpointslocatedin endsystems.Thisconcepthasbeencalled“net-work tomography” becauseeachmeasurementpoint seesa “projection” of theInternet’s resourcesin a mannerspe-cific to its location.
While the conceptof network tomography is attrac-tive andin keepingwith thedesignphilosophy of keepingnetwork-internalcomponentsassimpleaspossible,sofarit hasnot beenclearhow extensive a measurementinfras-tructureis neededin order to seea large fraction of thenetwork from its edges.In theabsenceof preciseknowl-edge,theprevailing wisdomin Internetmeasurementhasseemedto be“more is better.” In thispaperwe have takena steptowarddevelopinga morerefinedunderstandingofthis problem. We have concentratedon the problemof
discoveryof basicInternetcomponents— links andnodes(endsystemsandrouters).Weassumedthecommonmea-surementsituationin which active measurementsitesarescarce,but passive targetsfor measurementprobesarerel-atively plentiful.
Ourpreliminaryresultsindicatethatthemarginalutilityof additionalmeasurementsitesdeclinesrapidlyevenafterthefirst two sites.Thisis evidentin thediscoveryof nodes,of links, andof nodedegreedistribution. We consideredtheaggregationof all datasetsto bethemostcompletepic-tureavailable;in eachcase(nodes,links, andnodedegreedistribution) a vastmajority of the informationpresentintheaggregateddatasetwaspresentin thefirst two or threedatasetsalone. On the otherhand,conductingadditionalmeasurementsinvariably provided a more completepic-tureof theentiretopology.
Our conclusionsareunavoidablysensitive to thepartic-ular choiceof measurementsitesto which we hadaccess,andwebelievethatfurthermeasurementsarewarrantedtoreinforceour conclusions.However we believe that theseresultsshedlight on how typical IP routespassthroughthe Internet,and show that a majority of routestend topassthrough a relatively well-defined“switching core.”We also note that traceroute measurementsare justone techniquefor studyingthe marginal utility andscal-ing questionsweposehere;numerousotherdatasetsmightalsoapplywell, albeitwith differentprosandcons.
Finally, discoveryof nodesandlinks in aninternetworkprovides only the most basic topographicalinformationaboutthenetwork. Questionsaboutmarginal utility couldbeframedin thecontext of richernetwork characteristics,suchas studyingthe marginal utility of additionalmea-surementsto characterizethedistributionof packet lossinthe network. We hopethat this paper, which we believeto bethefirst to rigorouslyquantifythemarginalutility ofnetwork measurements,will eventuallyseebroadapplica-tion to a rangeof importantproblemdomainsin networkmeasurement.
VI I I . ACKNOWLEDGEMENTS
The datausedin this researchwascollectedaspart ofCAIDA’s skitter initiative, http://www.caida.org. Supportfor skitteris providedby DARPA, NSF, andCAIDA mem-bership. The authorswould like to thankkc claffy, AmyBlanchardandEdouardLagachefrom CAIDA for makingSkittertracedataavailablefor this study.
The authorswould alsolike to thankJenniferRexfordfor hervaluablehelpshepherdingthispaperandtheanony-mousIMW reviewersfor their suggestionsfor improvingthepaper.
REFERENCES
[1] N. Abramson. InformationTheoryand Coding. McGraw-Hill,1963.
[2] A. Adams,J. Mahdavi, M. Mathis, and V. Paxson. CreatingaScalableArchitecturefor InternetMeasurement.In Proceedingsof INET ’98, 1998.
[3] P. Barford andM. Crovella. Measuringweb performancein thewidearea.PerformanceEvaluationReview, August1999.
[4] H-W BraunandK.C. Claffy. GlobalISPinterconnectivity by ASnumber. http://moat.nlanr.net/AS/.
[5] A. Broido and K. Claffy. Connectivity of IP Graphs. In Pro-ceedingsof SPIEITCom’01, ScalabilityandTraffic Control in IPNetworks, August2001.
[6] H. Chang, S. Jamin, and W. Willinger. On Inferring AS-Level Connectivity from BGP Routing Tables. Available athttp://topology.eecs.umich.edu/archive/inferbgp.ps.
[7] H. Chang,S. Jamin,andW. Willinger. Inferring AS-level Inter-net Topologyfrom Router-level Traceroutes.In ProceedingsofSPIEITCom’01, ScalabilityandTraffic Control in IP Networks,August2001.
[8] B. Cheswick.Internetmappingproject.http://www.cs.belllabs.com/who/ches/map/.
[9] J. Chuangand M. Sirbu. Pricing multicastcommunication:Acost-basedapproach.In Proceedingsof INET ’98, 1998.
[10] M. Faloutsos,P. Faloutsos,andC. Faloutsos.On Power-Law Re-lationshipsof the InternetTopology. In ACM SIGCOMM, pages251–62,Cambridge,MA, September1999.
[11] Cooperative Associationfor Internet Data Analysis (CAIDA).TheSkitterproject.http://www.caida.org/Tools/Skitter.
[12] P. Francis,S. Jamin,V. Paxson,L. Zhang,D. Gryniewicz, andY. Jin. An Architecturefor a Global Host DistanceEstimationService.In Proceedingsof IEEE INFOCOM’99, March1999.
[13] R.GovindanandA. Reddy. An Analysisof InternetInter-DomainRoutingandRouteStability. In Proceedingsof IEEE INFOCOM’97, April 1997.
[14] R.GovindanandH. Tangmunarunkit.Heuristicsfor InternetMapDiscovery. In Proceedingsof IEEE INFOCOM’00, April 2000.
[15] R. M. Gray. Entropy and InformationTheory. Springer-Verlag,1990.
[16] T. Griffin and G. Wilfong. An Analysis of BGP ConvergenceProperties.In ACM SIGCOMM, pages277–88,Cambridge,MA,September1999.
[17] V. Jacobson.traceroute.ftp://ftp.ee.lbl.gov/traceroute.tar.Z,1989.[18] S.Jamin,C. Jin,Y. Jin,D. Raz,Y. Shavitt, andL. Zhang.On the
Placementof InternetInstrumentation.In Proceedingsof IEEEINFOCOM2000, March2000.
[19] J.-J.PansiotandD. Grad. On RoutesandMulticastTreesin theInternet. ACM ComputerCommunicationReview, 28(1):41–50,January1998.
[20] V. Paxson.End-to-EndInternetPacketDynamics.In Proceedingsof ACM SIGCOMM’97, Cannes,France,September1997.
[21] V. Paxson. Measurementsand Analysisof End-to-EndInternetDynamics. PhDthesis,Universityof CaliforniaBerkeley, 1997.
[22] V. Paxson. End-to-End Routing Behavior in the Internet.IEEE/ACM TransactionsonNetworking, pages601–615,Decem-ber1998.
[23] G. Phillips,S.Shenker, andH. Tangmunarunkit.Scalingof mul-ticasttrees:Commentson theChuang-Sirbu scalinglaw. In Pro-ceedingsof ACM SIGCOMM’99, September1999.
[24] TheSCAN Project.http://www.isi.edu/scan/.[25] TheSurveyor Project.http://www.advanced.org/, 1998.[26] InternetTraffic Report.http://www.internettrafficreport.com/.
[27] TheInternetWeatherReport.http://www3.mids.org/weather/index.html,2000.
[28] S. Savage,A. Collins, E. Hoffman, J. Snell, and T. Anderson.End-to-endEffects of Internet Path Selection. In ACM SIG-COMM, pages289–300,Cambridge,MA, September1999.
[29] C. Shannon. A MathematicalTheoryof Communication. BellSystemsTechnical Journal, 47:143–157,1948.
[30] C. E. ShannonandW. Weaver. MathematicalTheoryof Commu-nication. Universityof Illinois Press,1949.
[31] R. Siamwalla, R. Sharma,andS. Keshav. Discovering internettopology. Technicalreport,CornellUniversityComputerScienceDepartment,July 1998.http://www.cs.cornell.edu/skeshav/papers/discovery.pdf.
[32] H. Tangmunarunkit,R. Govindan,S.Shenker, andD. Estrin. TheImpactof Policy on InternetPaths. In Proceedingsof IEEE IN-FOCOM’01, April 2001.
[33] E. W. Zegura, K.L. Calvert, and M. J. Donahoo. A Quan-titative Comparisonof Graph-basedModels for Internetworks.IEEE/ACM TransactionsonNetworking, pages770–783,Decem-ber1997.