On the low primary water stress corrosion cracking susceptibility of...
58
On the low primary water stress corrosion cracking susceptibility of weld deformed Alloy 690 Rickard Ruici Shen Doctoral thesis no. 101, 2017 KTH School of Engineering Sciences Department of Solid Mechanics Royal Institute of Technology SE-100 44 Stockholm Sweden
Transcript of On the low primary water stress corrosion cracking susceptibility of...
On the low primary water stress
corrosion cracking susceptibility of weld deformed Alloy 690
Rickard Ruici Shen
Doctoral thesis no. 101, 2017
KTH School of Engineering Sciences Department of Solid Mechanics
Royal Institute of Technology SE-100 44 Stockholm Sweden

Akademisk avhandling som med tillstånd av Kungliga Tekniska Högskolan i Stockholm framlägges till offentlig granskning för avläggande av teknologie doktorsexamen onsdagen den 29 mars 2017 kl. 10.00 i sal F3, Kungliga Tekniska Högskolan, Lindstedtsvägen 26, Stockholm.
TRITA HFL-0613 ISSN 1654-1472 ISRN ISBN
KTH/HFL/R-17/08-SE 978-91-7729-294-4

“Those who fail to learn from history are doomed to repeat it.”
George Santayana

V
Abstract
It has been shown in recent years that the nickel-base Alloy 690 can become
susceptible to stress corrosion cracking (SCC) in the primary water of nuclear
power plants with pressurized water reactors if it has been sufficiently deformed
at room temperature. Although the material is not intentionally used in a
deformed state, it can become deformed by various manufacturing processes.
Welding is believed to be the process that is most likely to cause susceptibility,
yet it does not seem quite that detrimental in experiments. The overall purpose of
this work was to investigate why weld-induced deformation does not seem to
cause the same degree of susceptibility as cold deformation.
The work started with a microstructural investigation, presented in Paper A, to
assess if any of the changes caused by welding can explain the difference in
behavior. While a beneficial change in the microstructure was observed, it was
not enough to explain the differences.
The focus was then turned towards addressing knowledge gaps of the method
used to assess weld-induced deformation. This method is based on measuring
misorientations using electron backscatter diffraction (EBSD). It was shown in
Paper B that kernel average misorientation (KAM) is closer related to the degree
of hardening than the degree of deformation, and that it can be used to obtain a
qualitative map of hardness at the micrometer scale. Improvements to the KAM-
based method were presented in Paper C along with estimates near welds from
component mockups.
The validity of using a misorientation-based method on warm deformation was
tested in Paper D. It was shown that the method gives a rough estimate of the
degree of strain hardening, although the data suggests it is a small
overestimation. The overestimation would mean that weld deformation may
have a lower hardness than the strain estimate implies, which is beneficial for
SCC resistance.

VI

VII
Sammanfattning
Under senare år har det visats att nickelbasen Alloy 690 kan bli känslig för
spänningskorrosion (SCC) i primärvatten av kärnkraftverk med tryckvatten-
reaktorer om det har blivit tillräckligt deformerat i rumstemperatur. Även om
materialet inte medvetet används i ett deformerat tillstånd, så kan det bli
deformerat av olika tillverkningsprocesser. Svetsning är den process som anses
mest sannolik att orsaka känslighet, dock verkar den inte vara riktigt så skadlig i
experiment. Det övergripande målet med det här arbetet var att undersöka varför
svetsinducerad deformation inte verkar orsaka samma nivå av känslighet som
kalldeformation.
Arbetet började med en mikrostrukturell undersökning, presenterad i Artikel A,
för att bedöma om någon av förrändringarna orsakade av svetsning kan förklara
skillnaderna i beteende. Även om en gynnsam förrändring i mikrostrukturen
observerades så var det inte tillräckligt för att förklara skillnaderna.
Fokusen vändes istället mot att adressera kunskapsbristerna i metoden som
användes för att uppskatta den svetsinducerade deformationen. Denna metod är
baserad på att mäta misorienteringar med bakåtspridd elektrondiffraktion
(EBSD). Det visades i Artikel B att kärn-medel-misorientering (KAM) är närmare
besläktat med nivån av hårdnande än nivån av deformation, och att det kan
användas för att erhålla en kvalitativ karta över hårdhet på mikrometerskalan.
Förbättringar till en KAM-baserad metod presenterades i Artikel C tillsammans
med uppskattningar nära svetsar från komponentattrapper.
Giltigheten i att använda en misorienteringsbaserad metod för varmdeformation
testades i Artikel D. Det visades att metoden ger en grov uppskattning av nivån
av hårdnande, dock antyder data att det är en liten överskattning.
Överskattningen skulle betyda att svetsdeformerat material kan ha en lägre
hårdhet än töjningsuppskattningen antyder, vilket är gynnsamt för SCC-
resistens.

VIII
IX
Preface
The work in this thesis has been performed at the Department of Solid
Mechanics, KTH. The work was funded by Vattenfall, Fortum and Uniper, which
are gratefully acknowledged. Eric Willis at the Electric Power Research Institute
(EPRI) and Torsten Pedersen at Ringhals AB are also sincerely acknowledged for
supplying the component mockups used in this work.
First of all I would like to thank my supervisor Professor Pål Efsing for taking me
under his wing, supporting and encouraging me along the way. I am especially
grateful for him wanting me to choose the direction of my research myself, which
I believe has made me a better researcher.
Further, I would like to thank all my colleagues at the Department of Solid
Mechanics. You are the reason why this workplace has been so pleasant. I have
enjoyed the many discussions we have had over lunch, coffee, the field trips, and
to have worked with you in teaching. Special thanks to the colleagues in the
laboratory and workshop who have helped me in this work.
Finally, I would like to thank my family and my fiancée Anna, who had to put up with me during stressful periods when I needed to come home late, or keep working after getting home.
Stockholm, March 2017 Rickard Ruici Shen
X
List of appended papers
Paper A Experimental and theoretical investigation of three Alloy 690 mockup components: Base metal and welding induced changes
Rickard R. Shen, Bartek Kaplan & Pål Efsing International Journal of Nuclear Energy, 2014. Paper B Spatial correlation between local misorientation and nanoindentation hardness in nickel-base Alloy 690
Rickard R. Shen, Valter Ström & Pål Efsing Materials Science and Engineering A, vol. 674, 2016. Paper C Plastic strain assessment of Alloy 690 heat affected zones from component mockups using KAM and GOS
Rickard R. Shen & Pål Efsing Internal report No. 611, Department of Solid Mechanics, KTH Royal Institute of Technology, Stockholm. To be submitted for international publication. Paper D Comparison of EBSD-based plastic strain estimation of Alloy 690 strained at 500–650 °C and at room temperature
Rickard R. Shen & Pål Efsing Internal report No. 612, Department of Solid Mechanics, KTH Royal Institute of Technology, Stockholm. To be submitted for international publication.

XI
In addition to the appended papers, the work has resulted in the following
publications and conference contributions*:
Microstructural studies of Alloy 690 mockup components
Rickard R. Shen & Pål Efsing
Presented at EPRI Alloy 690/52/152 PWSCC Research Collaboration Meeting,
November 2012, Tampa, FL, USA. (OP)
Review of the effect of cold work on stress corrosion cracking of Alloy 690
Rickard R. Shen
Hannu Hänninen & Timo Kiesi (eds.) Materials Science and Technology—Nuclear
Materials Advanced Course, Helsinki University Press, Espoo, Finland, 2012 pp. 133–
145. (OP, PP)
Microstructural study of Alloy 690 base metal and HAZ from mockup
components – Influence of Ti(C,N) banding
Rickard R. Shen & Pål Efsing
Presented at Fontevraud 8, September 2014, Avignon, France. (OP, EA, PP)
Effects of PWHT on the microstructure and mechanical properties of
ERNiCrFe-7 all-weld metal
Rickard R. Shen, Zhiliang Zhou, Ping Liu & Guocai Chai
Presented at the 67th IIW Annual Assembly, July 2014, Seoul, South Korea. (OP)
Published in Welding in the World, vol. 59, no. 3, 2015. (JP)
Investigation of the relationship between local plastic strain estimated by
EBSD and local nanoindentation hardness in Alloy 690
Rickard R. Shen, Valter Ström & Pål Efsing
Presented at the 17th International Conference on Environmental Degradation of
Materials in Nuclear Power Systems–Water Reactors, August, 2015, Ottawa, Ontario,
Canada. (OP, PP)
Validity of EBSD plastic strain estimation on a microstructural size scale
Rickard R. Shen, Valter Ström & Pål Efsing
Presented at the SKC Symposium, October 2015, Sigtuna, Sweden. (OP)
Understanding EBSD-based plastic strain estimation
Rickard R. Shen & Pål Efsing
Presented at EPRI Alloy 690/52/152 PWSCC Research Collaboration Meeting,
November 2016, Tampa, FL, USA. (OP)
* OP = oral presentation, PP = proceedings paper, EA = extended abstract, JP = journal paper

XII
Contribution to the papers
Paper A
Principal author and performed all metallography. Parts about thermodynamic
calculations were performed and written by Bartek Kaplan. The work was
supervised by Pål Efsing.
Paper B
Principal author, wrote the scripts for post-processing of EBSD data, performed
all metallography, Vickers hardness indentation and area measurements from
nanoindentation. Nanoindentation was planned together with Valter Ström, who
performed it and wrote about its experimental details. The work was supervised
by Pål Efsing.
Paper C
Principal author, performed all the experimental work and computations under
supervision of Pål Efsing.
Paper D
Principal author, performed all computations and hardness testing, planned the
warm deformation, which was performed by Martin Öberg. The work was
supervised by Pål Efsing.
XIII
Abbreviations and acronyms
AMIS Average intragrain misorientation
CCD Charge-coupled device
CGR Crack growth rate
CRDM Control rod drive mechanism
DIC Digital image correlation
DP Divider plate
EDS Energy dispersive X-ray spectroscopy
EBSD Electron backscatter diffraction
EPRI Electric power research institute
FCC Face centered cubic
GND Geometrically necessary dislocation
GOS Grain orientation spread
HAZ Heat affected zone
IMD Integrated misorientation density
KAM Kernel average misorientation
LOM Light optical microscopy
MA Mill annealed
MCD Modified crystal deformation
PWR Pressurized water reactor
PWSCC Primary water stress corrosion cracking
SCC Stress corrosion cracking
SEM Scanning electron microscopy
SSD Statistically stored dislocation
TT Thermally treated
XRD X-ray diffraction

XIV
XV
Contents
Introduction ........................................................................................ 1
Historical background ................................................................................................. 1
Questioning the relevance of the warning signs ..................................................... 5
Microstructure .................................................................................. 10
Base metal ................................................................................................................... 10
Heat affected zone ..................................................................................................... 15
Plastic strain estimation ................................................................. 17
The cause of misorientations .................................................................................... 20
Misorientation metrics .............................................................................................. 21
Kernel average misorientation ............................................................................. 21
Grain orientation spread ....................................................................................... 27
Warm deformation .................................................................................................... 29
Conclusions ...................................................................................... 33
Suggestions for future work ......................................................... 35
Bibliography ..................................................................................... 36
Summary of appended papers ...................................................... 41
Paper A
Paper B
Paper C
Paper D

XVI
Rickard R. Shen
1
Introduction
The overall goal of this thesis was to strive towards understanding whether or
not the nickel-base Alloy 690 becomes susceptible to primary water stress
corrosion cracking (PWSCC) as a result of weld-induced deformation. The details
of the work are described in the appended papers, but how each individual
paper fits into the bigger picture may not be obvious. This thesis serves to put the
work performed in context. It is also intended to give a more in-depth
background since the introduction section in the papers are quite brief, and are
written for readers already in the field.
Historical background
Alloy 690 is a nickel-base alloy that is used in various components in nuclear
power plants a pressurized water reactor (PWR). This type of power plants has a
primary cooling system consisting of recirculating “primary water” kept under
high pressure to avoid boiling. This primary water picks up the heat generated
by nuclear fission in the core and transports it to several steam generators, where
the heat is transferred to the water of the secondary cooling system. The
secondary water boils, and the steam is used for power generation. A schematic
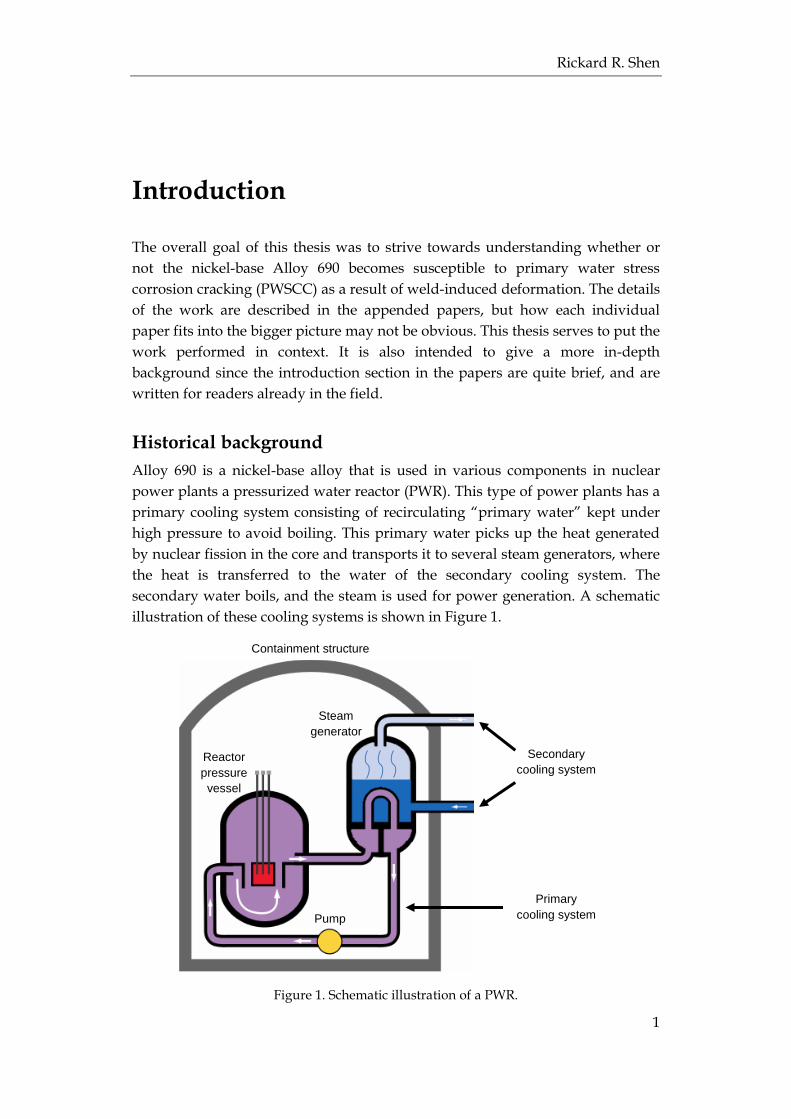
illustration of these cooling systems is shown in Figure 1.
Figure 1. Schematic illustration of a PWR.
Steam
generator
Reactor
pressure
vessel
Containment structure
Pump
Secondary
cooling system
Primary
cooling system
Introduction
2
Examples of components made of Alloy 690 are the heat exchanger tubes in the
steam generators, the divider plate in the steam generators and the nozzles
penetrating the reactor pressure vessel which serve as entry points for control
rods or instrumentation. This alloy has been in use in operating nuclear power
plants since the late 1980s, and to the knowledge of the author, has not failed by
PWSCC to date. Considerable effort has been put into research on PWSCC of
Alloy 690 despite the lack of failures. To understand why, one must understand
the history of its predecessor, Alloy 600.
Alloy 600 is a very similar nickel-base alloy that was originally chosen for use in
PWRs for a range of good properties including weldability, mechanical strength
and toughness, and for having a thermal expansion coefficient that lies in-
between that of low alloy steel and stainless steel. The main deciding factor to
choose Alloy 600 was nonetheless that it had shown excellent overall corrosion
resistances in a wide range of environments, particularly against stress corrosion
cracking (SCC) caused by the presence of chlorides, which had been an issue to
earlier PWRs using steam generator tubes of stainless steel [1].
Ironically it soon became evident that Alloy 600 was susceptible to PWSCC. The
first indications that Alloy 600 might be susceptible were observed by Coriou et
al. [2] already in 1959. In hindsight the observation did not catch the attention it
deserved, but at the time it was understandable since other labs had trouble
cracking Alloy 600 by SCC. Furthermore, Coriou had acknowledged that a part
of their success was the high stress level and high degree of cold deformation in
his material, i.e. plastic deformation induced at room temperature, which is a
well-known way to increase the SCC susceptibility of metals. This warning sign
that Coriou had discovered was unfortunately overlooked, and led to the
beginning of the Alloy 600 PWSCC issue.
In Sweden failure by SCC in Alloy 600 occurred as early as in 1964 in the Ågesta
reactor, after only 250 days of operation [3]. By the end of 1971, 19 of 34 reactors
around the world had experienced failure in Alloy 600 steam generator tubes,
and this had caused steam generator failures on average every 7 months [4]. Over
the years more than 70 pressure vessel heads had been damaged by PWSCC,
some of which began leaking. This has caused considerable downtimes for
inspections, repairs, replacements and upgrades. In several cases plants were
shut down for several months, and in the case of the Davis-Besse reactor, the
plant was shut down for over two years [1].
Leakage from the primary cooling circuit cannot be taken lightly since it is the
system directly cooling the core. Moreover, the primary water also tends to
collect radioactive particles with time, so for obvious reasons there is a desire to
keep this contaminated water contained within its closed circuit.
Rickard R. Shen
3
In addition to damaged pressure vessel heads, there has also been extensive
cracking in steam generators and pressurizers over the years, which has also
caused significant costs in repairs and down time. It is thus not difficult to
understand why PWSCC in Alloy 600 is infamous for being one of the most
costly struggles in the history of nuclear industry. This alone is certainly enough
to motivate research on PWSCC in Alloy 690 before it was chosen as the
replacement material for Alloy 600.
Extensive crack initiation tests have been attempted in Alloy 690 though in its as-
delivered state, and not even decade-long tests have caused any specimens to fail
[5–8]. With these kinds of results it might have been understandable to reduce or
suspend research on Alloy 690 and accept that it is resistant enough. Again, the
reason for continued research is answered by history.
Before Alloy 690 was developed, other means of SCC mitigation were sought
after, and the cracking problem was noticeably alleviated, but certainly not
stopped. SCC requires three constituents to occur,
1. Tensile stress (Stress) 2. Chemically active environment (Corrosion) 3. Susceptible material (Cracking)
and thus SCC can be mitigated by reducing one of these factors, or prevented if
one of the factors is removed. While stresses caused by internal water pressure
can be kept low by design in most components, steam generator tubes still need
to be kept thin enough to allow for an efficient heat transfer. Furthermore,
residual stresses from e.g. welding and fitting also contribute to the total stress
state of the material, and these stresses are difficult to relieve.
Some changes have luckily been made in the water chemistry over the years with
positive results, but only so much can be done without affecting other materials
in the system in a negative way. Reducing the susceptibility of Alloy 600 was on
the other hand possible.
The specifications for Alloy 600 were originally less stringent since what was
produced had not shown any major issues in other industries. It was delivered in
a mill annealed (MA) state, i.e. after a final heat treatment mainly intended to
soften the material. This heat treatment differed between manufacturers in time
and temperature, so there was accordingly a relatively large spread in
microstructures and mechanical strength among the Alloy 600 materials
produced in the early days. This unsurprisingly also led to a spread in PWSCC
susceptibility.
Differences in the microstructure between materials that had cracked and
materials that had not cracked were soon identified, and it was found that Alloy
600 with plenty of fine intergranular carbides (particles along its grain
Introduction
4
boundaries), and minimal amount of intragranular carbides (particles within the
grains), resulted in the highest SCC resistance [5–7, 9–11].
A thermal treatment to consistently produce this desired microstructure was
adopted, and “thermally treated” (TT) Alloy 600 became the material used for
both new power plants, and for replacement components in pre-existing plants.
TT Alloy 600 looked very promising based on accelerated experiments, and the
operational experience improved as well. But eventually, components kept
cracking, albeit after a longer incubation time, and the accumulated costs
associated with PWSCC in Alloy 600 kept growing.
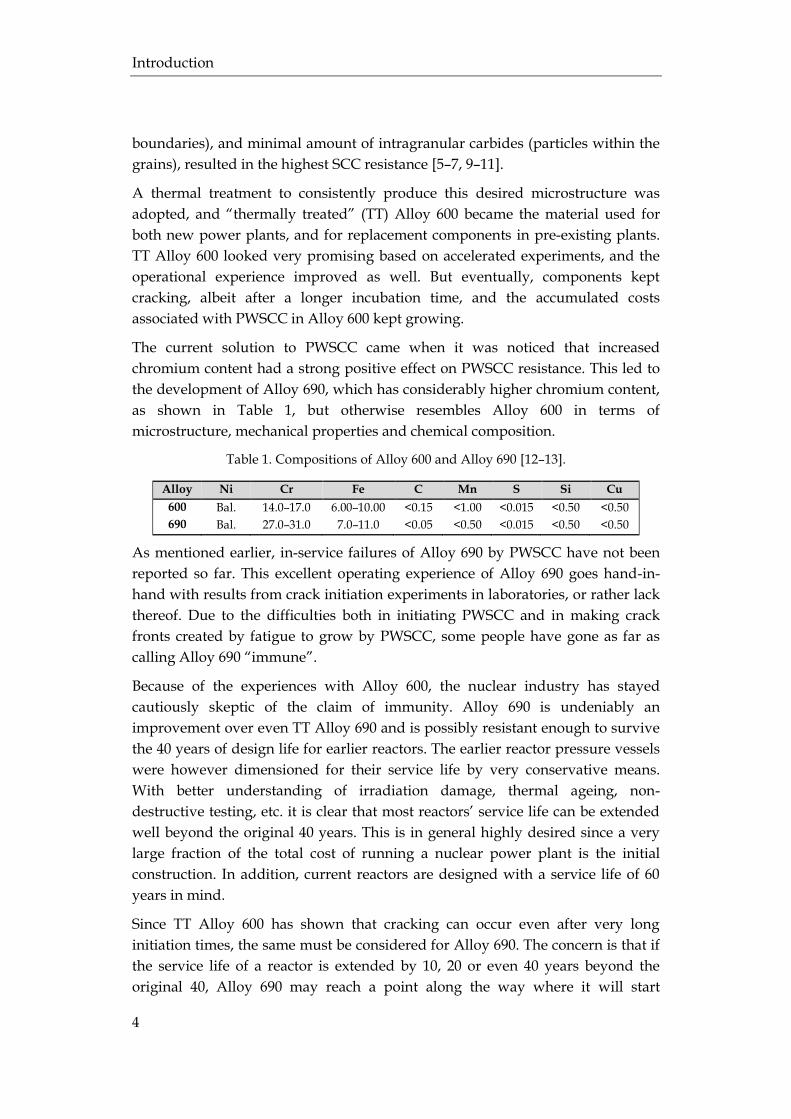
The current solution to PWSCC came when it was noticed that increased
chromium content had a strong positive effect on PWSCC resistance. This led to
the development of Alloy 690, which has considerably higher chromium content,
as shown in Table 1, but otherwise resembles Alloy 600 in terms of
microstructure, mechanical properties and chemical composition.
Table 1. Compositions of Alloy 600 and Alloy 690 [12–13].
Alloy Ni Cr Fe C Mn S Si Cu
600 Bal. 14.0–17.0 6.00–10.00 <0.15 <1.00 <0.015 <0.50 <0.50
690 Bal. 27.0–31.0 7.0–11.0 <0.05 <0.50 <0.015 <0.50 <0.50
As mentioned earlier, in-service failures of Alloy 690 by PWSCC have not been
reported so far. This excellent operating experience of Alloy 690 goes hand-in-
hand with results from crack initiation experiments in laboratories, or rather lack
thereof. Due to the difficulties both in initiating PWSCC and in making crack
fronts created by fatigue to grow by PWSCC, some people have gone as far as
calling Alloy 690 “immune”.
Because of the experiences with Alloy 600, the nuclear industry has stayed
cautiously skeptic of the claim of immunity. Alloy 690 is undeniably an
improvement over even TT Alloy 690 and is possibly resistant enough to survive
the 40 years of design life for earlier reactors. The earlier reactor pressure vessels
were however dimensioned for their service life by very conservative means.
With better understanding of irradiation damage, thermal ageing, non-
destructive testing, etc. it is clear that most reactors’ service life can be extended
well beyond the original 40 years. This is in general highly desired since a very
large fraction of the total cost of running a nuclear power plant is the initial
construction. In addition, current reactors are designed with a service life of 60
years in mind.
Since TT Alloy 600 has shown that cracking can occur even after very long
initiation times, the same must be considered for Alloy 690. The concern is that if
the service life of a reactor is extended by 10, 20 or even 40 years beyond the
original 40, Alloy 690 may reach a point along the way where it will start
Rickard R. Shen
5
cracking. If the cracking is frequent enough, it can make continued use of the
reactors uneconomical and would thus effectively limit the practical service life.
This is especially problematic if a service life extension would require costly
upgrades or component replacements to ensure safe operation. Research on
PWSCC of Alloy 690 has consequently continued in order to avoid expensive
surprises in the future.
Owing to the continued research, laboratory experiments in the last decade have
indeed managed to show that Alloy 690 is not immune to PWSCC. In fact it has
been found that Alloy 690 can exhibit PWSCC crack growth rates (CGRs) on par
with Alloy 600 if it has been cold deformed [14–20]. Although the considerable
deformation of these tested materials have made the experiments accelerated to
the point that the relevance of the results is questionable, so was the case with
Coriou’s experiments on Alloy 600 in the late 1950s. This time however, the
warning signs have not been disregarded.
Questioning the relevance of the warning signs
That Alloy 690 can exhibit fast crack growth in simulated primary water is
alarming, even if plastic deformation appears to be a prerequisite to achieve it.
Because of this potential susceptibility, much of the current research is focused
on understanding how plastic straining causes the increased PWSCC
susceptibility, and whether or not these high CGRs are relevant for the actual
conditions in operating plants.
An obstacle in answering these questions is the limited understanding of the
mechanism(s) of SCC. Despite SCC being a well-known phenomenon, it is still
unclear exactly how the cracking occurs. A variety of models of SCC based on
different concepts of mechanisms have been proposed over the years, and many
of them have been summarized [11, 21–22], but no one model seems to fully
explain the phenomenon.
The governing mechanism of SCC being unresolved makes it difficult to pinpoint
exactly happens in the material during deformation that makes it more
susceptible to SCC. Deformation can for example cause cracking of brittle
particles or void formation, and at the microstructural size scale the deformation
can be localized. Deformation also causes the material to harden. While none of
these changes seem beneficial, it is difficult to say how detrimental they are, and
why.
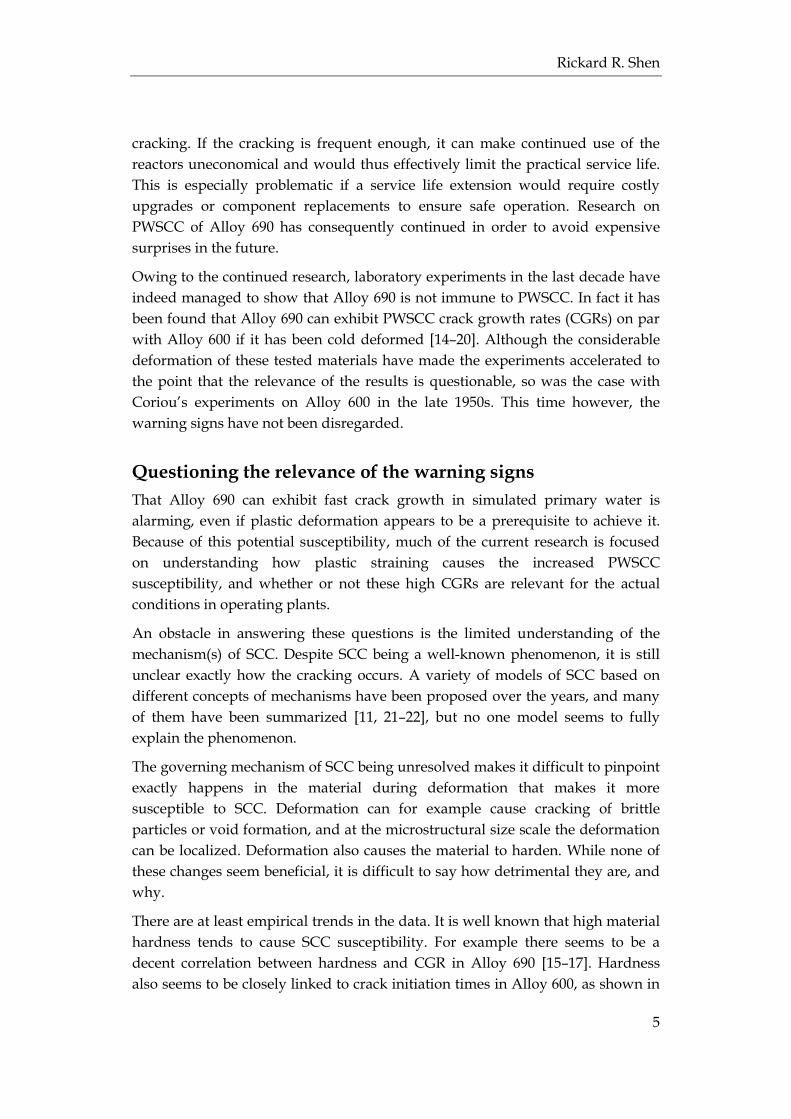
There are at least empirical trends in the data. It is well known that high material
hardness tends to cause SCC susceptibility. For example there seems to be a
decent correlation between hardness and CGR in Alloy 690 [15–17]. Hardness
also seems to be closely linked to crack initiation times in Alloy 600, as shown in
Introduction
6
Figure 2. Additionally, Andresen [23] has shown that hardening of stainless steel
by neutron irradiation has a similar detrimental effect on SCC resistance as strain
hardening by cold deformation.
Figure 2. SCC crack initiation times for Alloy 600 seems to depend on the yield strength of the material. This graph was reproduced from data from Studsvik [5–6] and
Westinghouse [7].
Alloy X-750 further adds to the trend. Compositionally it can be described as
Alloy 600 with some additional alloying elements allowing it to be precipitation
hardened. This means that Alloy X-750 is designed to have a much higher
hardness than Alloy 600 when correctly heat treated. Alloy X-750 has an overall
similar corrosion resistance as Alloy 600, but it is significantly more susceptible
to SCC.
Alloy 690 cannot be precipitation hardened. Strain hardening is required for it to
significantly increase its hardness. Alloy 690 is however not used in a deformed
state, at least not intentionally. In fact, there are regulations for how much plastic
strain as-delivered material may have. For example in Sweden, the plastic strain
in as-delivered stainless steels and nickel-bases is limited to 3% [24]. The material
can on the other hand accumulate plastic strains during the construction process
of the plant, e.g. from tube straightening, grinding or welding. All these sources
of deformation add up, and if repair welding is needed it can further elevate the
total level of deformation.
While grinding is the most likely source of severe cold plastic deformation, the
deformation is also confined to the surface. It is assumed that the superficial
deformation from grinding might be able to aid crack initiation, but that further
crack growth would be slow once it grows past the deformed layer. Furthermore,
even if grinding would create a susceptible material, it does not create the
through-thickness tensile stresses required to sustain crack growth.
Rickard R. Shen
7
Instead, weld-induced deformation is currently believed to be the most probable
cause of issues. The deformation is caused right after the weld pool solidifies.
The volume of the hot material shrinks as it cools, and pulls the surrounding
material. If the surrounding material is constrained, which it often is, the weld
shrinkage is likely to cause significant plastic deformation in both the material
near the weld in the heat affected zone (HAZ) and the weld metal itself. Welding
also tends to leave the material with high residual tensile stresses. Additionally
the deformation and residual stresses from welding are not limited to the surface,
but can affect volume spanning from the side in contact with primary water all
the way to the external side.
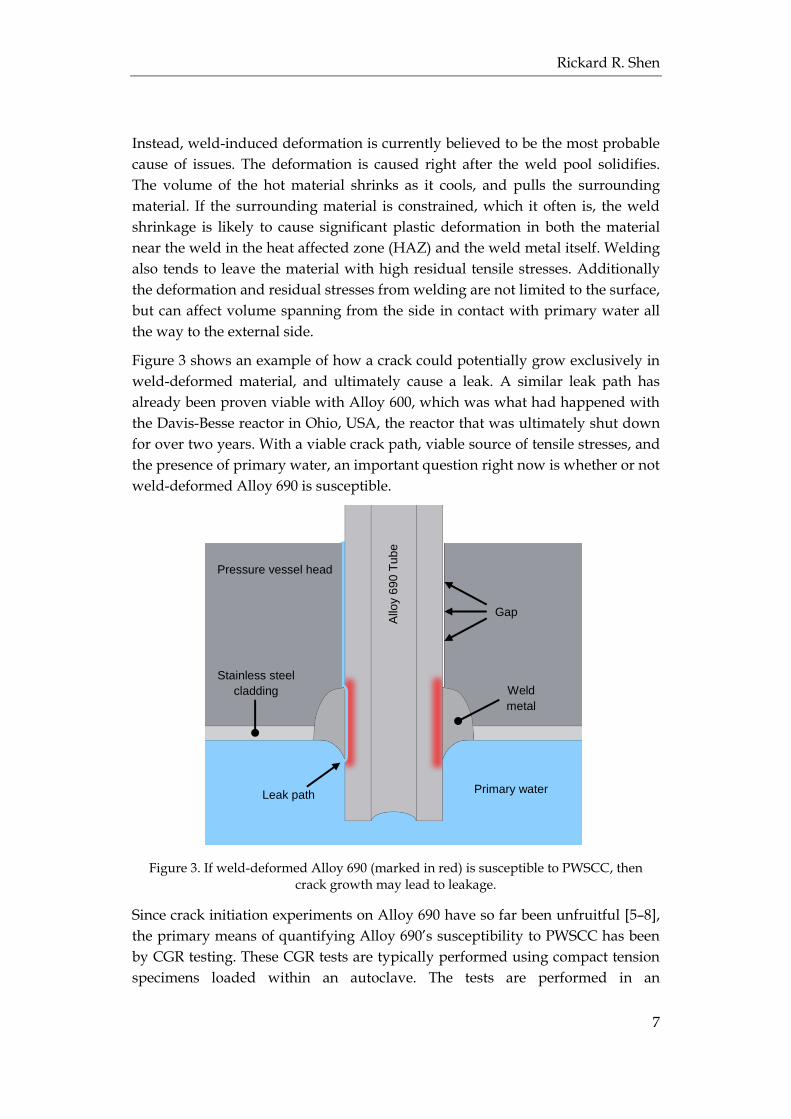
Figure 3 shows an example of how a crack could potentially grow exclusively in
weld-deformed material, and ultimately cause a leak. A similar leak path has
already been proven viable with Alloy 600, which was what had happened with
the Davis-Besse reactor in Ohio, USA, the reactor that was ultimately shut down
for over two years. With a viable crack path, viable source of tensile stresses, and
the presence of primary water, an important question right now is whether or not
weld-deformed Alloy 690 is susceptible.
Figure 3. If weld-deformed Alloy 690 (marked in red) is susceptible to PWSCC, then crack growth may lead to leakage.
Since crack initiation experiments on Alloy 690 have so far been unfruitful [5–8],
the primary means of quantifying Alloy 690’s susceptibility to PWSCC has been
by CGR testing. These CGR tests are typically performed using compact tension
specimens loaded within an autoclave. The tests are performed in an
Allo
y 6
90 T
ub
e
Pressure vessel head
Weld
metal
Primary water Leak path
Gap
Stainless steel
cladding
Introduction
8
environment similar to primary water, i.e. pressurized hot water with added B
and Li. In order to accelerate the testing, the dissolved hydrogen level is usually
set at the concentration of Ni/NiO equilibrium, and the tests are usually run at
360 °C. In comparison, Alloy 690 only experiences up to around 325 °C under
normal operating conditions.
Most CGR experiments have been performed on Alloy 690 base metals, i.e. non-
welded plates, bars, tubes, etc. with added deformation by rolling or forging [14–
20]. These experiments allow for studies of the effect of cold deformation in a
controlled manner, e.g. how it synergizes with microstructure and how the plane
of deformation synergizes with the plane of cracking.
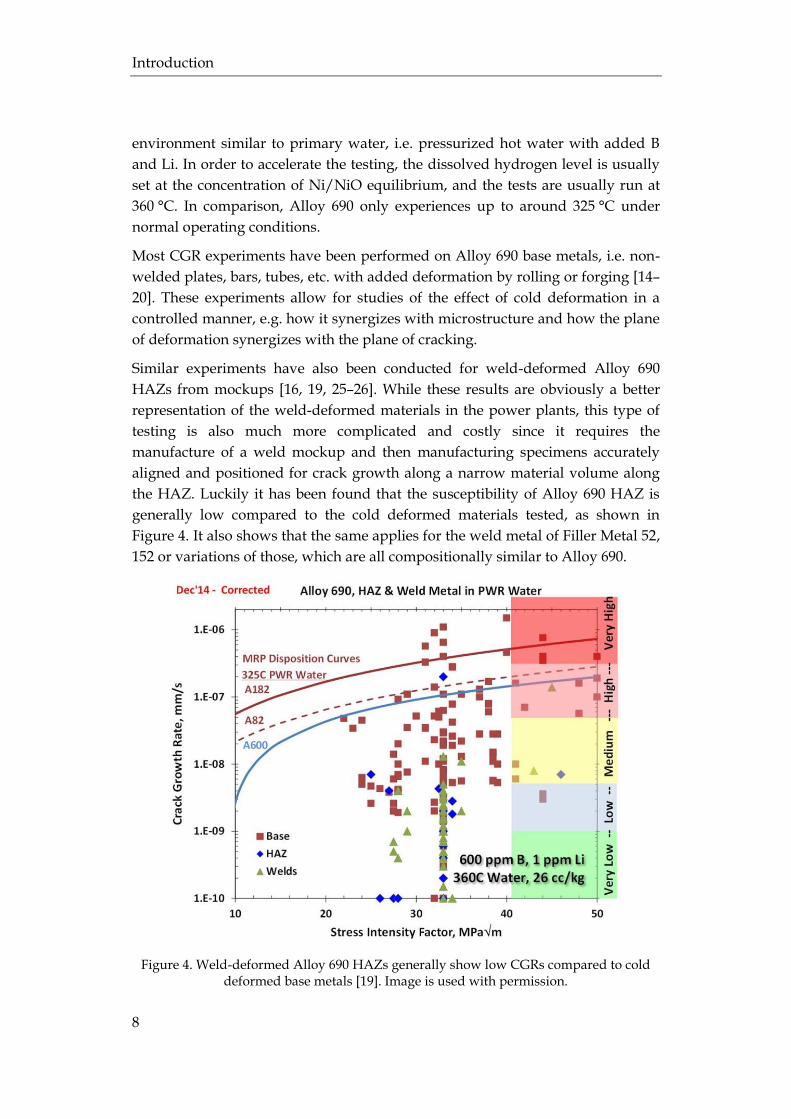
Similar experiments have also been conducted for weld-deformed Alloy 690
HAZs from mockups [16, 19, 25–26]. While these results are obviously a better
representation of the weld-deformed materials in the power plants, this type of
testing is also much more complicated and costly since it requires the
manufacture of a weld mockup and then manufacturing specimens accurately
aligned and positioned for crack growth along a narrow material volume along
the HAZ. Luckily it has been found that the susceptibility of Alloy 690 HAZ is
generally low compared to the cold deformed materials tested, as shown in
Figure 4. It also shows that the same applies for the weld metal of Filler Metal 52,
152 or variations of those, which are all compositionally similar to Alloy 690.
Figure 4. Weld-deformed Alloy 690 HAZs generally show low CGRs compared to cold deformed base metals [19]. Image is used with permission.
Rickard R. Shen
9
While these results are pleasing, they are also a bit puzzling. The degree of
plastic deformation in HAZs has been studied using a plastic strain estimation
technique based on electron backscatter diffraction (EBSD), which is discussed in
more detail later. What the studies have shown is that the estimated level of
deformation in the HAZ is often comparable to more than 10% uniaxial
elongation, and that up to around 20% is not inconceivable, which is around the
level of deformation applied on the cold deformed base metals used for CGR
testing [19, 27–28]. This deformation usually peaks in the HAZ close to the weld
interface, and slowly diminishes over a few millimeters. Similar estimates were
made in Paper C showing similar results.
CGR tests have also been conducted on Alloy 690 forged at around 700 °C
instead of at room temperature [29]. It appears that deformation at this
temperature causes less susceptibility than the same deformation at room
temperature, which is in line with the behavior seen in weld-deformed HAZ.
These results suggest that something changes when the deformation temperature
is high.
Microstructure
10
Microstructure
The microstructure is always important in material failure since the
microstructure determines the material properties. It is even more important
when the failure mode is highly localized to certain microstructural features, as
in the case of PWSCC where cracking occurs along grain boundaries. The Alloy
690 base metal microstructure and its changes associated with welding were
therefore characterized in Paper A, and for the same reason the microstructure
will be reviewed in this chapter.
Base metal
In order to understand how a microstructure changes from the thermal cycles of
welding, one should first be familiar with the microstructure of Alloy 690 in the
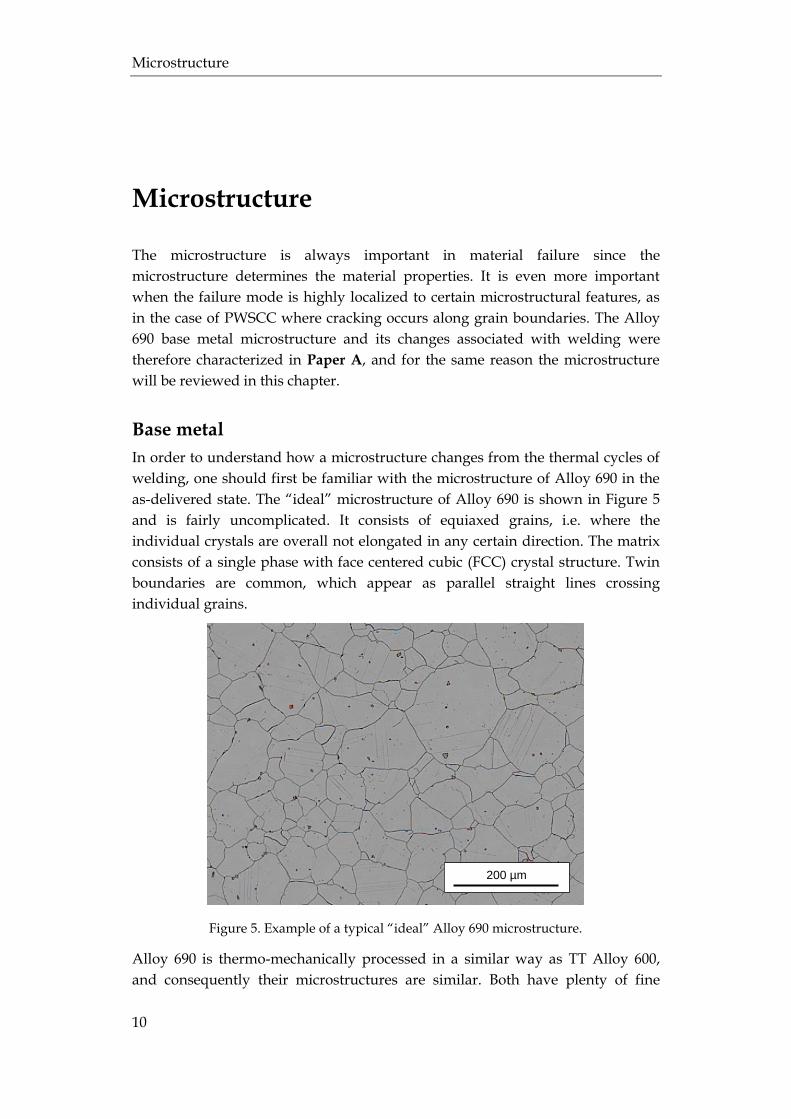
as-delivered state. The “ideal” microstructure of Alloy 690 is shown in Figure 5
and is fairly uncomplicated. It consists of equiaxed grains, i.e. where the
individual crystals are overall not elongated in any certain direction. The matrix
consists of a single phase with face centered cubic (FCC) crystal structure. Twin
boundaries are common, which appear as parallel straight lines crossing
individual grains.
Figure 5. Example of a typical “ideal” Alloy 690 microstructure.
Alloy 690 is thermo-mechanically processed in a similar way as TT Alloy 600,
and consequently their microstructures are similar. Both have plenty of fine
200 µm

Rickard R. Shen
11
carbides precipitated along their grain boundaries, but in TT Alloy 600 carbides
of both M7C3 and M23C6 type are normally found, while they are normally
exclusively of M23C6 type in Alloy 690 [6]. The “M” here stands for metallic
elements, but is predominantly chromium in these carbides.
Apart from chromium carbides, there are also Ti(C,N) particles scattered all over
the material, which span a wide range of sizes, from sub-micron up to around
10 µm. These typically appear orange in light optical microscopy (LOM). This
indicates that they are rich in nitrogen, but that they still contain carbon [30].
It is naïve to expect all the material volume of all commercial heats of Alloy 690
to have an ideal microstructure. In practice it is very common to have various
types of imperfections. Characterizing these imperfections was one of the goals
of Paper A. Three commercial Alloy 690 heats were therefore used, which are
illustrated in Figure 6.
Figure 6. Illustration of the three mockups used in this thesis.
Two of these were mockups of penetration nozzles for the control rod drive
mechanism (CRDM) and one was of a steam generator divider plate (DP), a plate
that separates the hot and cold primary water in a steam generator. These
mockups will be referred to as CRDM1, CRDM2 and DP respectively. On the one
hand this is of course not enough to expect to capture all types of imperfections
that exist in the heats used in the power plants. On the other hand, every
imperfection found in these mockups should also be expected to be found in
power plants.
The excellent microstructure in Figure 5 came from the Alloy 690 tube of
CRDM1. The tube from CRDM2 appeared equally fine at first glance. Figure 7 a)
shows how this tube appeared in when viewed with bright field LOM.
Figure 7 b) is captured at the exact same location, but using dark field LOM
instead. Dark field imagery is very useful for visualizing very fine particles, and
Reactor
pressure
vessel
Steam
generator
Penetration nozzle
“CRDM2”
Penetration
nozzle
“CRDM1”
Steam generator
divider plate “DP”
Microstructure
12
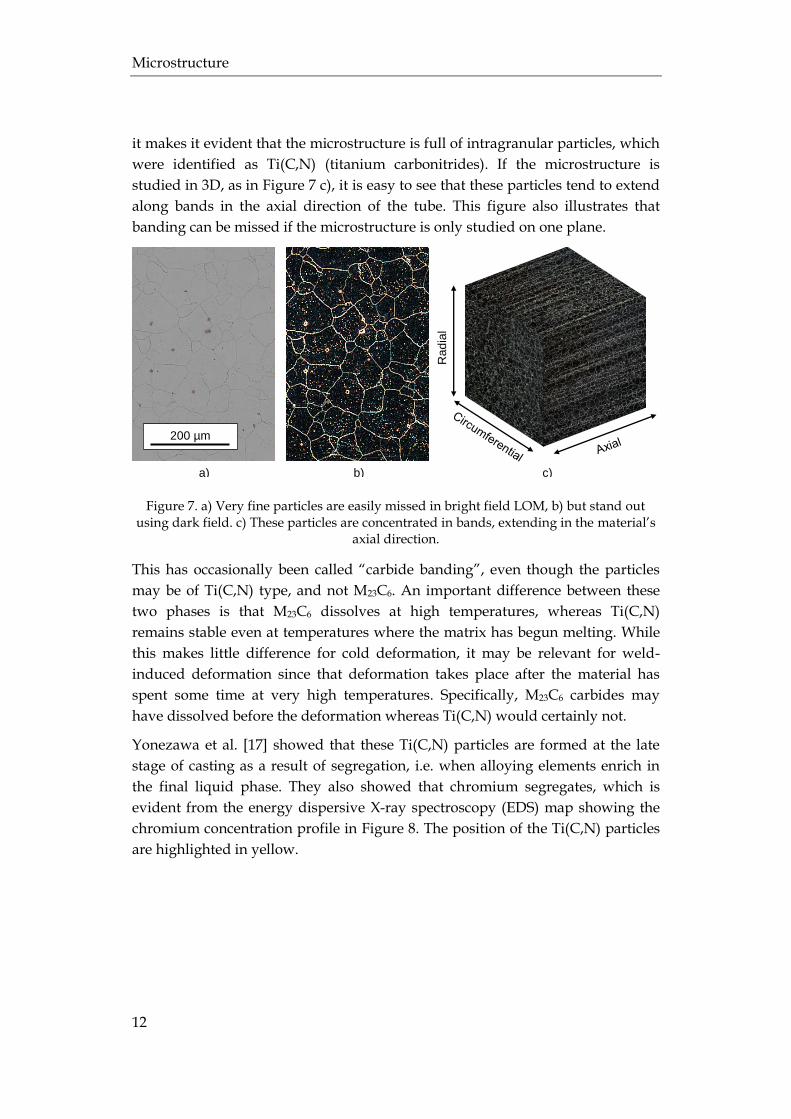
it makes it evident that the microstructure is full of intragranular particles, which
were identified as Ti(C,N) (titanium carbonitrides). If the microstructure is
studied in 3D, as in Figure 7 c), it is easy to see that these particles tend to extend
along bands in the axial direction of the tube. This figure also illustrates that
banding can be missed if the microstructure is only studied on one plane.
Figure 7. a) Very fine particles are easily missed in bright field LOM, b) but stand out using dark field. c) These particles are concentrated in bands, extending in the material’s
axial direction.
This has occasionally been called “carbide banding”, even though the particles
may be of Ti(C,N) type, and not M23C6. An important difference between these
two phases is that M23C6 dissolves at high temperatures, whereas Ti(C,N)
remains stable even at temperatures where the matrix has begun melting. While
this makes little difference for cold deformation, it may be relevant for weld-
induced deformation since that deformation takes place after the material has
spent some time at very high temperatures. Specifically, M23C6 carbides may
have dissolved before the deformation whereas Ti(C,N) would certainly not.
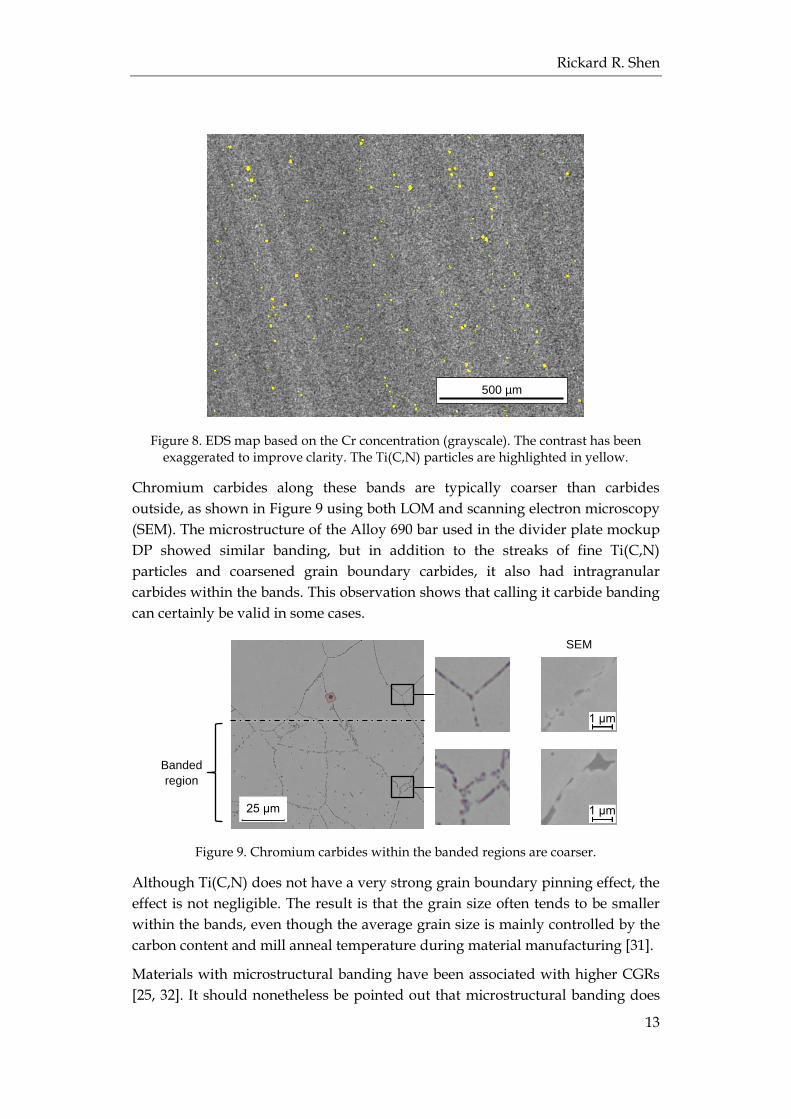
Yonezawa et al. [17] showed that these Ti(C,N) particles are formed at the late
stage of casting as a result of segregation, i.e. when alloying elements enrich in
the final liquid phase. They also showed that chromium segregates, which is
evident from the energy dispersive X-ray spectroscopy (EDS) map showing the
chromium concentration profile in Figure 8. The position of the Ti(C,N) particles
are highlighted in yellow.
200 µm R
ad
ial
a) b) c)
Rickard R. Shen
13
Figure 8. EDS map based on the Cr concentration (grayscale). The contrast has been exaggerated to improve clarity. The Ti(C,N) particles are highlighted in yellow.
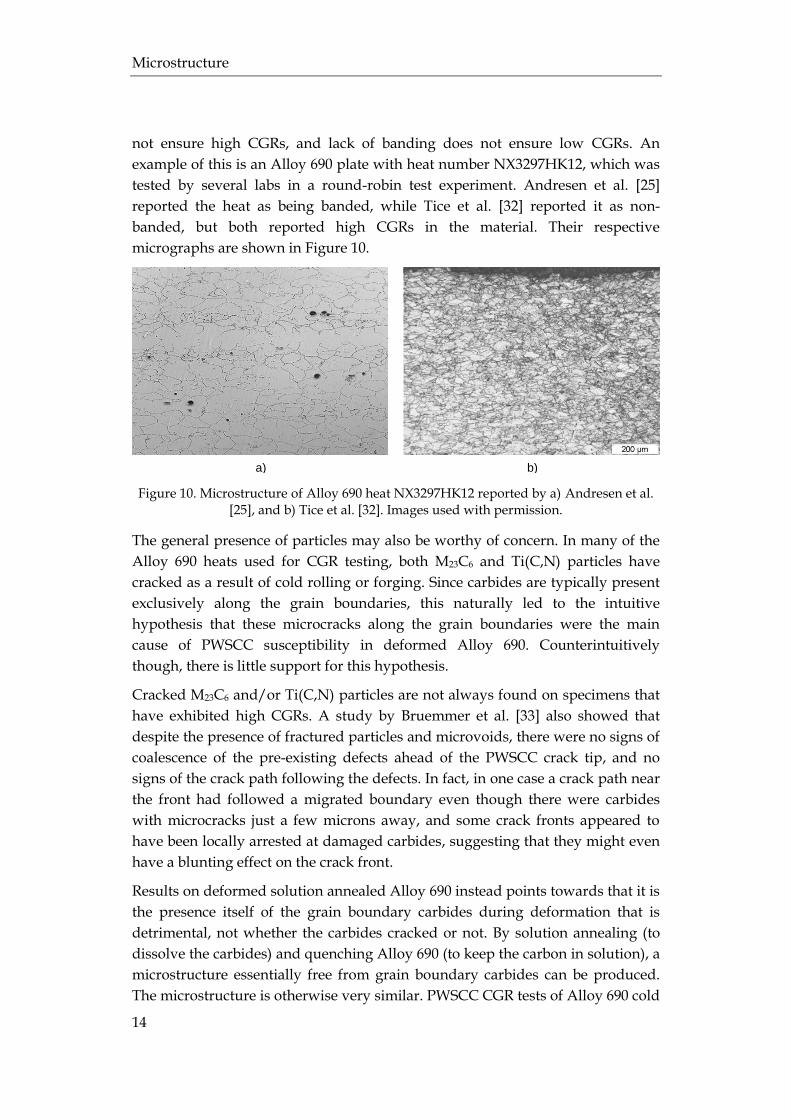
Chromium carbides along these bands are typically coarser than carbides
outside, as shown in Figure 9 using both LOM and scanning electron microscopy
(SEM). The microstructure of the Alloy 690 bar used in the divider plate mockup
DP showed similar banding, but in addition to the streaks of fine Ti(C,N)
particles and coarsened grain boundary carbides, it also had intragranular
carbides within the bands. This observation shows that calling it carbide banding
can certainly be valid in some cases.
Figure 9. Chromium carbides within the banded regions are coarser.
Although Ti(C,N) does not have a very strong grain boundary pinning effect, the
effect is not negligible. The result is that the grain size often tends to be smaller
within the bands, even though the average grain size is mainly controlled by the
carbon content and mill anneal temperature during material manufacturing [31].
Materials with microstructural banding have been associated with higher CGRs
[25, 32]. It should nonetheless be pointed out that microstructural banding does
500 µm
25 μm
Banded
region
1 μm
1 μm
SEM
Microstructure
14
not ensure high CGRs, and lack of banding does not ensure low CGRs. An
example of this is an Alloy 690 plate with heat number NX3297HK12, which was
tested by several labs in a round-robin test experiment. Andresen et al. [25]
reported the heat as being banded, while Tice et al. [32] reported it as non-
banded, but both reported high CGRs in the material. Their respective
micrographs are shown in Figure 10.
Figure 10. Microstructure of Alloy 690 heat NX3297HK12 reported by a) Andresen et al.
[25], and b) Tice et al. [32]. Images used with permission.
The general presence of particles may also be worthy of concern. In many of the
Alloy 690 heats used for CGR testing, both M23C6 and Ti(C,N) particles have
cracked as a result of cold rolling or forging. Since carbides are typically present
exclusively along the grain boundaries, this naturally led to the intuitive
hypothesis that these microcracks along the grain boundaries were the main
cause of PWSCC susceptibility in deformed Alloy 690. Counterintuitively
though, there is little support for this hypothesis.
Cracked M23C6 and/or Ti(C,N) particles are not always found on specimens that
have exhibited high CGRs. A study by Bruemmer et al. [33] also showed that
despite the presence of fractured particles and microvoids, there were no signs of
coalescence of the pre-existing defects ahead of the PWSCC crack tip, and no
signs of the crack path following the defects. In fact, in one case a crack path near
the front had followed a migrated boundary even though there were carbides
with microcracks just a few microns away, and some crack fronts appeared to
have been locally arrested at damaged carbides, suggesting that they might even
have a blunting effect on the crack front.
Results on deformed solution annealed Alloy 690 instead points towards that it is
the presence itself of the grain boundary carbides during deformation that is
detrimental, not whether the carbides cracked or not. By solution annealing (to
dissolve the carbides) and quenching Alloy 690 (to keep the carbon in solution), a
microstructure essentially free from grain boundary carbides can be produced.
The microstructure is otherwise very similar. PWSCC CGR tests of Alloy 690 cold
a) b)
Rickard R. Shen
15
deformed in this state consistently show lower CGRs compared to the same heat
deformed in its as-delivered state [19, 33].
Heat affected zone
While Alloy 690 is not intentionally used in a deformed or solution annealed
state, the case may be relevant to welding. That welding can cause severe
deformation has been described earlier, but welding also causes a brief, but
intense, heat treatment. Material far away from the weld will not be affected at
all, but material near the weld interface will have experienced temperatures all
the way up to melting.
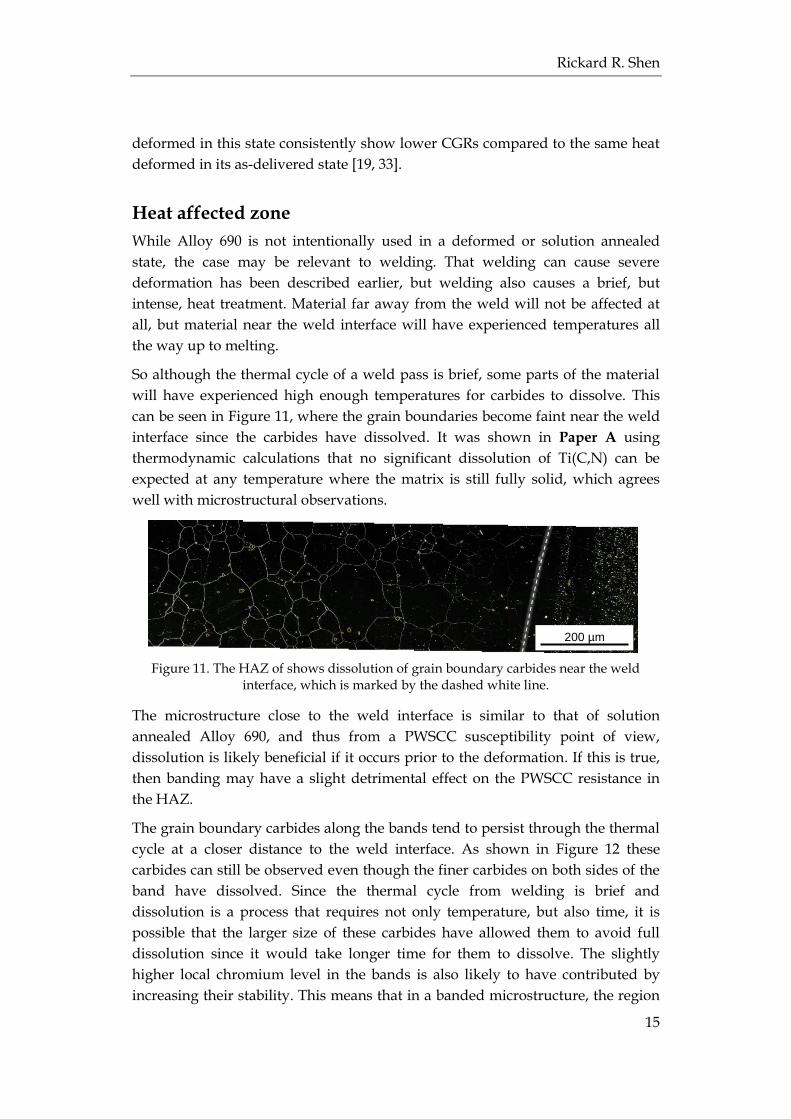
So although the thermal cycle of a weld pass is brief, some parts of the material
will have experienced high enough temperatures for carbides to dissolve. This
can be seen in Figure 11, where the grain boundaries become faint near the weld
interface since the carbides have dissolved. It was shown in Paper A using
thermodynamic calculations that no significant dissolution of Ti(C,N) can be
expected at any temperature where the matrix is still fully solid, which agrees
well with microstructural observations.
Figure 11. The HAZ of shows dissolution of grain boundary carbides near the weld
interface, which is marked by the dashed white line.
The microstructure close to the weld interface is similar to that of solution
annealed Alloy 690, and thus from a PWSCC susceptibility point of view,
dissolution is likely beneficial if it occurs prior to the deformation. If this is true,
then banding may have a slight detrimental effect on the PWSCC resistance in
the HAZ.
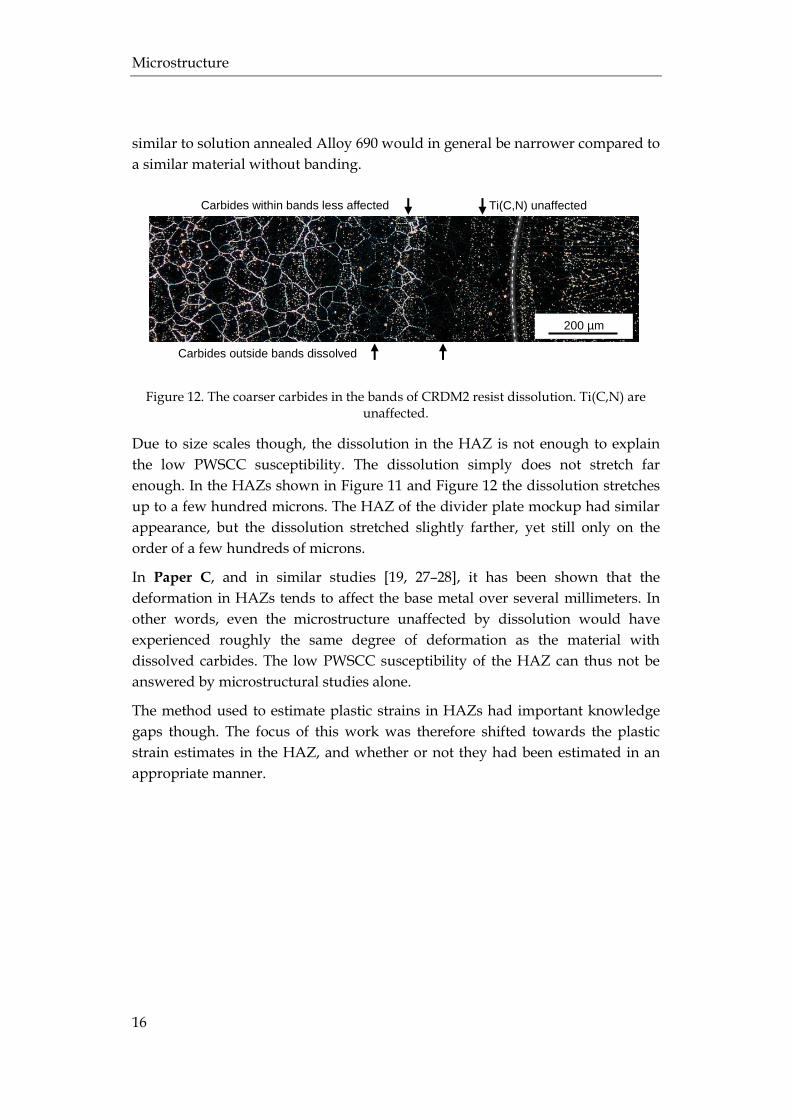
The grain boundary carbides along the bands tend to persist through the thermal
cycle at a closer distance to the weld interface. As shown in Figure 12 these
carbides can still be observed even though the finer carbides on both sides of the
band have dissolved. Since the thermal cycle from welding is brief and
dissolution is a process that requires not only temperature, but also time, it is
possible that the larger size of these carbides have allowed them to avoid full
dissolution since it would take longer time for them to dissolve. The slightly
higher local chromium level in the bands is also likely to have contributed by
increasing their stability. This means that in a banded microstructure, the region
200 µm
Microstructure
16
similar to solution annealed Alloy 690 would in general be narrower compared to
a similar material without banding.
Figure 12. The coarser carbides in the bands of CRDM2 resist dissolution. Ti(C,N) are unaffected.
Due to size scales though, the dissolution in the HAZ is not enough to explain
the low PWSCC susceptibility. The dissolution simply does not stretch far
enough. In the HAZs shown in Figure 11 and Figure 12 the dissolution stretches
up to a few hundred microns. The HAZ of the divider plate mockup had similar
appearance, but the dissolution stretched slightly farther, yet still only on the
order of a few hundreds of microns.
In Paper C, and in similar studies [19, 27–28], it has been shown that the
deformation in HAZs tends to affect the base metal over several millimeters. In
other words, even the microstructure unaffected by dissolution would have
experienced roughly the same degree of deformation as the material with
dissolved carbides. The low PWSCC susceptibility of the HAZ can thus not be
answered by microstructural studies alone.
The method used to estimate plastic strains in HAZs had important knowledge
gaps though. The focus of this work was therefore shifted towards the plastic
strain estimates in the HAZ, and whether or not they had been estimated in an
appropriate manner.
Ti(C,N) unaffected
Carbides outside bands dissolved
Carbides within bands less affected
200 µm
Rickard R. Shen
17
Plastic strain estimation
Strain gauges, clip gauges and digital image correlation (DIC) are commonly
used in mechanical laboratories for measuring strains in materials during
mechanical testing. These methods are precise and straightforward, but
technically do not measure an absolute value of deformation. What they measure
is the change in deformation. Deformation occurring before the strain gauge or
clip gauge is attached, or before the initial image for DIC was captured, will not
show in the measurements. In many cases this is perfectly sufficient, but in some
cases it is not.
EBSD is a tool used for measuring the crystal lattice orientation, and can be used
to give an estimate of the total degree of plastic straining. The crystal lattice
orientation within individual metal grains is normally highly uniform before it is
deformed. Plastic straining changes this and tends to make the lattice
orientations within grains more and more inhomogeneous as the straining
continues. This inhomogeneity can be measured using EBSD and thus allows an
estimate of an absolute value of the deformation. The main strength of this
method is that this estimate can be attained without requiring a measurement on
the virgin, deformation free, material. This allows EBSD to be used for
investigations of old components, for plastic strain estimates in HAZs, or even
for the weld metal.
Plastic strain estimation based on X-ray diffraction (XRD) works on a similar
basis, but EBSD has become a popular alternative since it offers a significantly
higher spatial resolution. It also provides additional useful information about the
microstructure at the same time, including an image of the microstructure and
how phases are distributed across the surface. The data can also be used to
calculate the elastic strains on the surface.
EBSD is based on using an SEM to bombard a tilted specimen with an electron
beam, focused on one small point on the specimen surface at a time. Some of
these electrons escape from the specimen as backscattered electrons. These
backscattered electrons interact with the crystal planes of the specimen as they
escape, and diffraction makes them more inclined to leave the specimen in
certain directions.
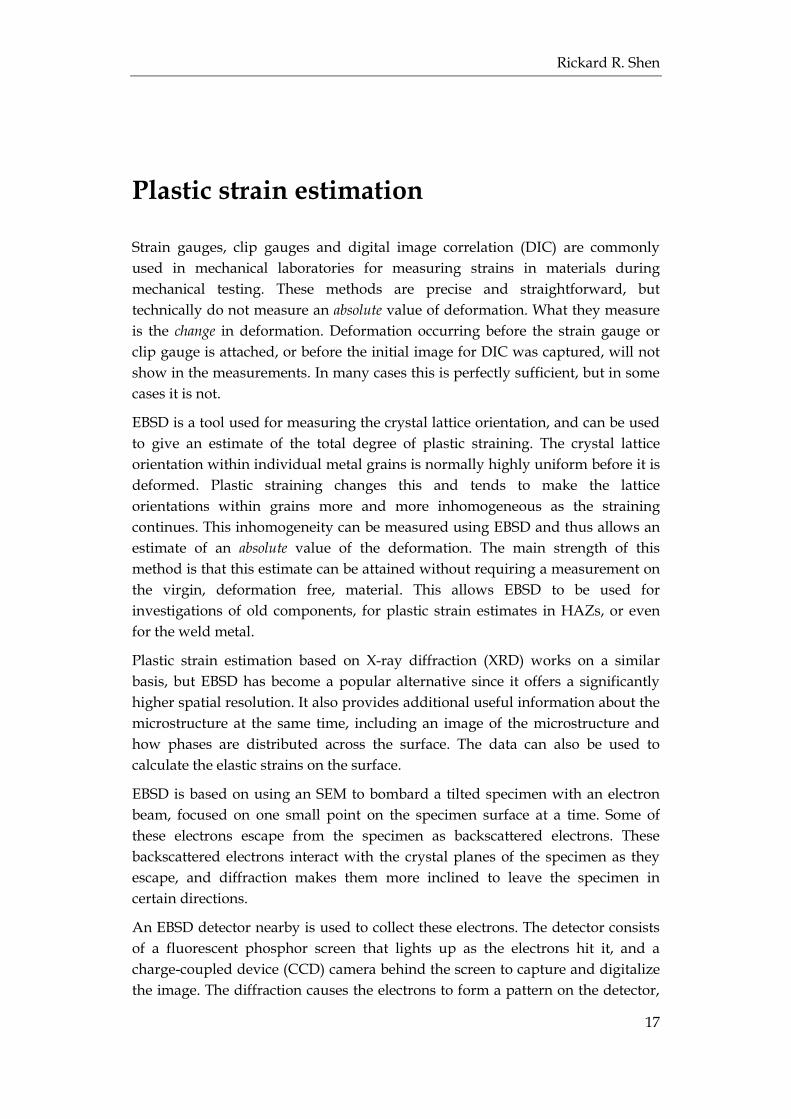
An EBSD detector nearby is used to collect these electrons. The detector consists
of a fluorescent phosphor screen that lights up as the electrons hit it, and a
charge-coupled device (CCD) camera behind the screen to capture and digitalize
the image. The diffraction causes the electrons to form a pattern on the detector,
Estimation of plastic deformation
18
carrying information about the crystal lattice from which the electrons escaped.
An example of such a diffraction pattern is shown in Figure 13.
Figure 13. Example of a diffraction pattern formed on the EBSD detector.
Based on the lines of such a pattern, a computer can then calculate the crystal
orientation of the point on the specimen along with its lattice parameters. The
electron beam is then focused on the next point, and the procedure is repeated
until a desired area has been scanned. The scanning is typically performed over
either a rectangular or hexagonal grid, and the scanned points can be thought of
as the pixels of a digital image.
It should be pointed out that the backscattered electrons only interact with a very
limited specimen volume. The interaction depth of these electrons is on the order
of several tens of nanometers. Hence it is important to take care during specimen
preparation so that any remaining surface deformation caused by the preparation
itself is negligible compared to the deformation of the material of interest.
There are two main approaches when using EBSD for estimation of plastic
deformation. One approach is to use the image quality of the diffraction patterns,
which deteriorates with increased deformation as the dislocation density
increases [34]. While this may be a viable approach, it is also sensitive to a range
of parameters including beam conditions, surface preparation, crystal
orientation, etc. This sensitivity makes this approach less attractive than the
alternative.
The more popular alternative is by using EBSD to map the crystal lattice
orientation over a surface and then calculate misorientations (differences in
orientation) between points. An average misorientation over the surface can be
defined in different ways, but all tend to increase linearly with plastic
deformation [27–28, 35–38]. This linear relationship, often called the calibration
curve, makes misorientation-based plastic strain estimation very straightforward.
Rickard R. Shen
19
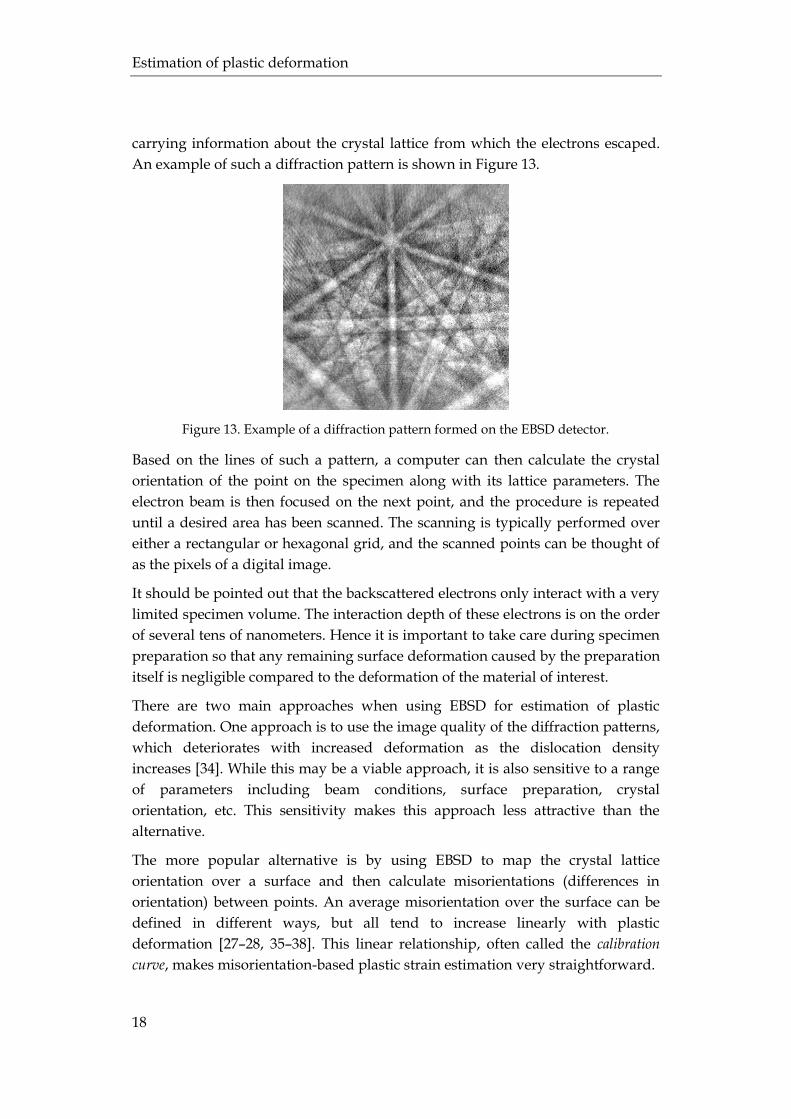
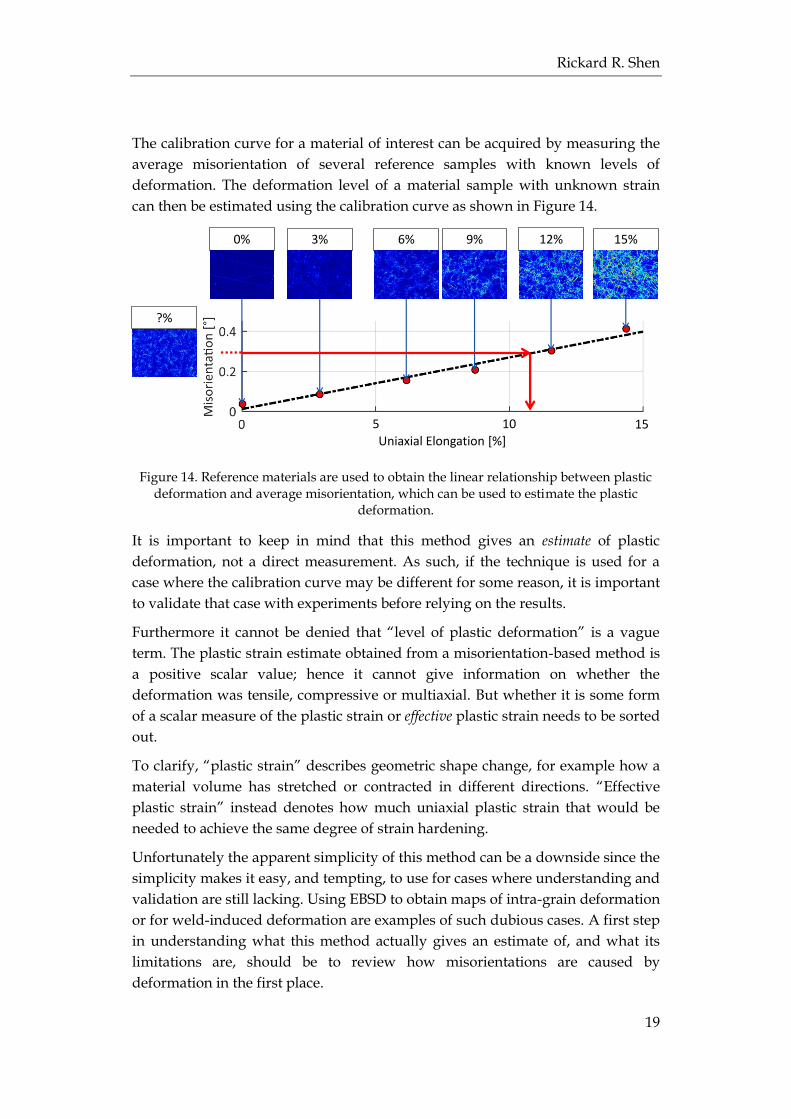
The calibration curve for a material of interest can be acquired by measuring the
average misorientation of several reference samples with known levels of
deformation. The deformation level of a material sample with unknown strain
can then be estimated using the calibration curve as shown in Figure 14.
Figure 14. Reference materials are used to obtain the linear relationship between plastic deformation and average misorientation, which can be used to estimate the plastic
deformation.
It is important to keep in mind that this method gives an estimate of plastic
deformation, not a direct measurement. As such, if the technique is used for a
case where the calibration curve may be different for some reason, it is important
to validate that case with experiments before relying on the results.
Furthermore it cannot be denied that “level of plastic deformation” is a vague
term. The plastic strain estimate obtained from a misorientation-based method is
a positive scalar value; hence it cannot give information on whether the
deformation was tensile, compressive or multiaxial. But whether it is some form
of a scalar measure of the plastic strain or effective plastic strain needs to be sorted
out.
To clarify, “plastic strain” describes geometric shape change, for example how a
material volume has stretched or contracted in different directions. “Effective
plastic strain” instead denotes how much uniaxial plastic strain that would be
needed to achieve the same degree of strain hardening.
Unfortunately the apparent simplicity of this method can be a downside since the
simplicity makes it easy, and tempting, to use for cases where understanding and
validation are still lacking. Using EBSD to obtain maps of intra-grain deformation
or for weld-induced deformation are examples of such dubious cases. A first step
in understanding what this method actually gives an estimate of, and what its
limitations are, should be to review how misorientations are caused by
deformation in the first place.
15%12%9%6%3%0%
?%
5 10 15Uniaxial Elongation [%]
Estimation of plastic deformation
20
The cause of misorientations
The description of this method using a calibration curve is essentially the
description of a “black box” function. The input is a misorientation and the
output is a plastic strain, while what actually happens in between is hidden and
handled by the calibration curve. To assess whether or not the method can be
used for a certain case or if further validation is needed, the black box must be
made transparent.
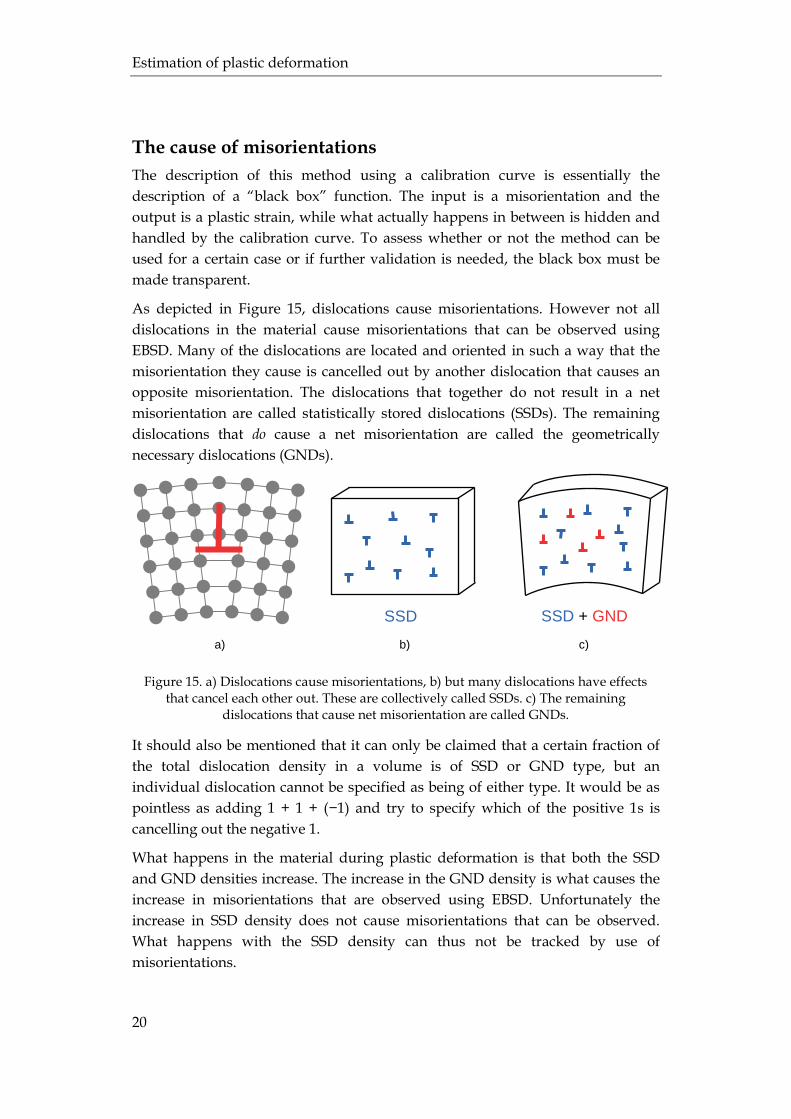
As depicted in Figure 15, dislocations cause misorientations. However not all
dislocations in the material cause misorientations that can be observed using
EBSD. Many of the dislocations are located and oriented in such a way that the
misorientation they cause is cancelled out by another dislocation that causes an
opposite misorientation. The dislocations that together do not result in a net
misorientation are called statistically stored dislocations (SSDs). The remaining
dislocations that do cause a net misorientation are called the geometrically
necessary dislocations (GNDs).
Figure 15. a) Dislocations cause misorientations, b) but many dislocations have effects that cancel each other out. These are collectively called SSDs. c) The remaining
dislocations that cause net misorientation are called GNDs.
It should also be mentioned that it can only be claimed that a certain fraction of
the total dislocation density in a volume is of SSD or GND type, but an
individual dislocation cannot be specified as being of either type. It would be as
pointless as adding 1 + 1 + (−1) and try to specify which of the positive 1s is
cancelling out the negative 1.
What happens in the material during plastic deformation is that both the SSD
and GND densities increase. The increase in the GND density is what causes the
increase in misorientations that are observed using EBSD. Unfortunately the
increase in SSD density does not cause misorientations that can be observed.
What happens with the SSD density can thus not be tracked by use of
misorientations.
SSD SSD + GND
a) b) c)
Rickard R. Shen
21
A more detailed description of the plastic strain estimation method, with the
black box opened up, can be summarized as:
1. Quantify misorientations using EBSD. 2. Quantify the GND density using the misorientations. 3. Make an assumption of the SSD density based on the GND. 4. Estimate the plastic strain based on total (GND+SSD) dislocation density.
It is important to be aware that step 3 includes an assumption, and that the
calibration curve (black box) is only valid as long as this assumption is valid. The
assumed SSD density is indirectly captured by the use of reference specimens.
The assumption should thus be good if the studied material, with unknown
strain, is deformed in a similar manner as the reference materials in terms of
stress state, strain rate, temperature, etc. What exactly constitutes as “similar” is
unfortunately difficult to define. Modeling the micromechanics would be useful
in understanding the region of applicability of the reference materials. Until there
is a better understanding though, validating experiments are advised when
unsure.
In a material such as Alloy 690, the only mechanism causing strain hardening is
the dislocation density buildup. When the dislocation density increases, so does
the dislocation entanglement, which increases the stress required to cause further
plastic deformation. Step 4 thus suggests that the vague term “level of
deformation” obtained from this misorientation-based technique should be
interpreted as effective plastic strain, i.e. the degree of strain hardening. Worth
repeating is that the assumption in step 3 must be valid for this interpretation to
be valid.
Misorientation metrics
Many ways of defining misorientation metrics, i.e. ways of quantifying the
misorientations, have been proposed. Most of these can be divided into either
using local data to calculate local misorientations, or by quantifying the spread of
orientations within individual grains. A version of the former is typically
implemented into commercial EBSD software under the name kernel average
misorientation (KAM). A version of the latter is typically also implemented, but
the name can differ. In this work, the umbrella term “grain orientation spread”
(GOS) will be used.
Kernel average misorientation
KAM is calculated for each point in the scanned map, using local data from the
neighborhood of each respective point. For each point, KAM is typically
calculated as the arithmetic mean of misorientations from that point to its
surrounding neighboring points. Which points to be considered as “neighboring
Estimation of plastic deformation
22
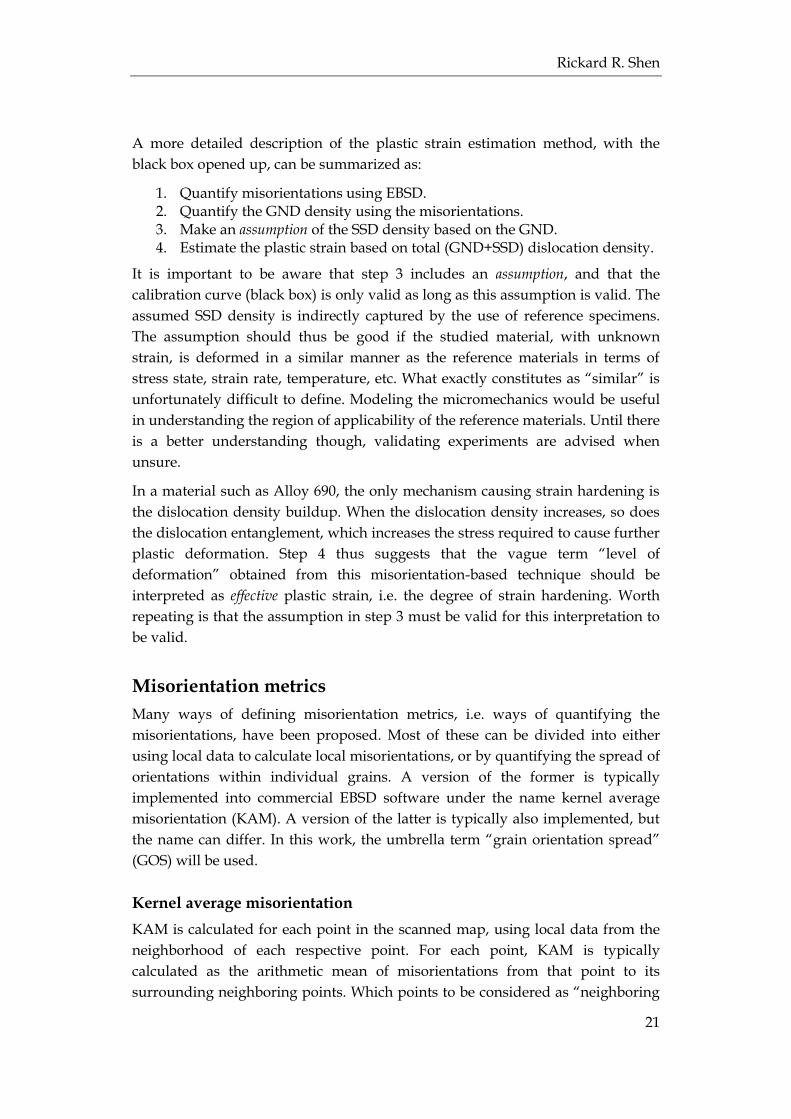
points” is defined by the kernel, as illustrated in Figure 16. In other words,
“neighboring points” does not necessarily imply only the closest neighbors, but
can also include points farther away as well.
Figure 16. KAM is calculated as the average misorientation of the points in the kernel to the central point. Kernel points belonging to a different grain are excluded.
For points near grain boundaries some of its neighboring points will inevitably
belong to a different grain, and would thus naturally have a very high
misorientation. Since these high misorientations are directly associated with the
grain boundary, and not the GND density from plastic deformation, these points
are excluded from the calculation.
One popular way to know if a point in the kernel belongs to another grain is to
define which grain each data point belongs to beforehand. This is done by
calculating the misorientations between immediate neighboring points, and
defining a grain boundary between points if the misorientation between them
exceeds a certain threshold, typically set between 5–10°. A group of points fully
surrounded by boundaries would then be defined as a grain.
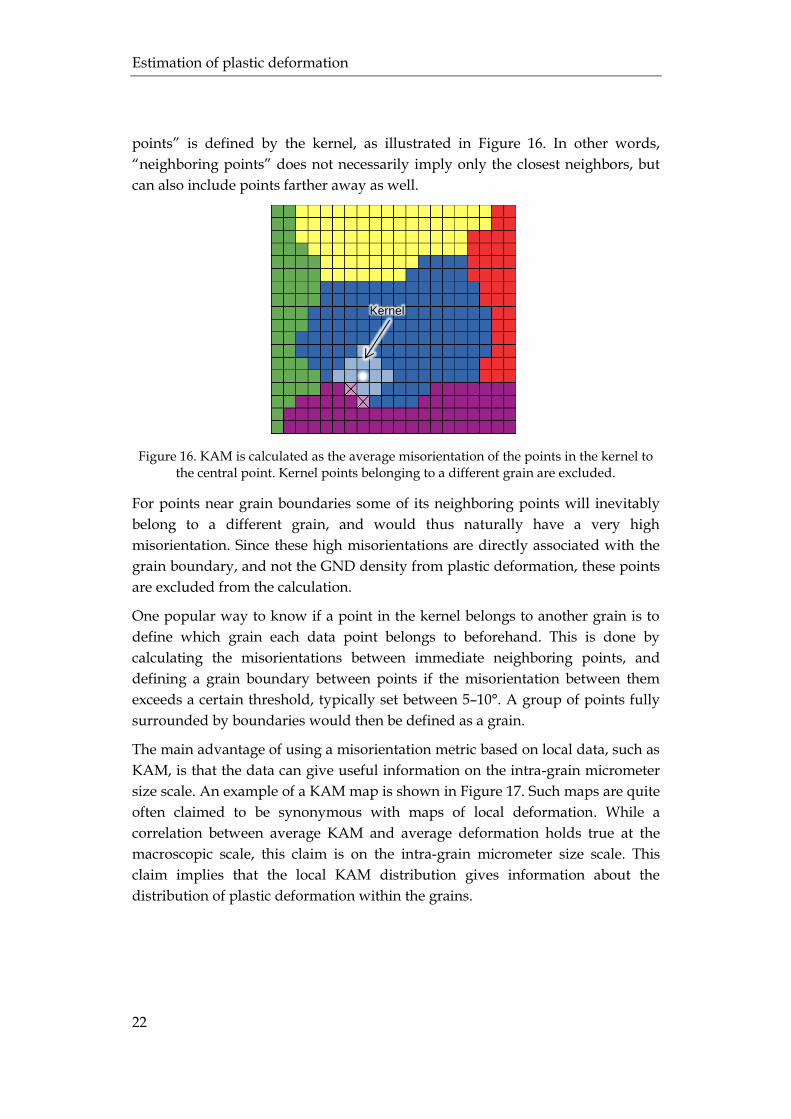
The main advantage of using a misorientation metric based on local data, such as
KAM, is that the data can give useful information on the intra-grain micrometer
size scale. An example of a KAM map is shown in Figure 17. Such maps are quite
often claimed to be synonymous with maps of local deformation. While a
correlation between average KAM and average deformation holds true at the
macroscopic scale, this claim is on the intra-grain micrometer size scale. This
claim implies that the local KAM distribution gives information about the
distribution of plastic deformation within the grains.
Kernel
Rickard R. Shen
23
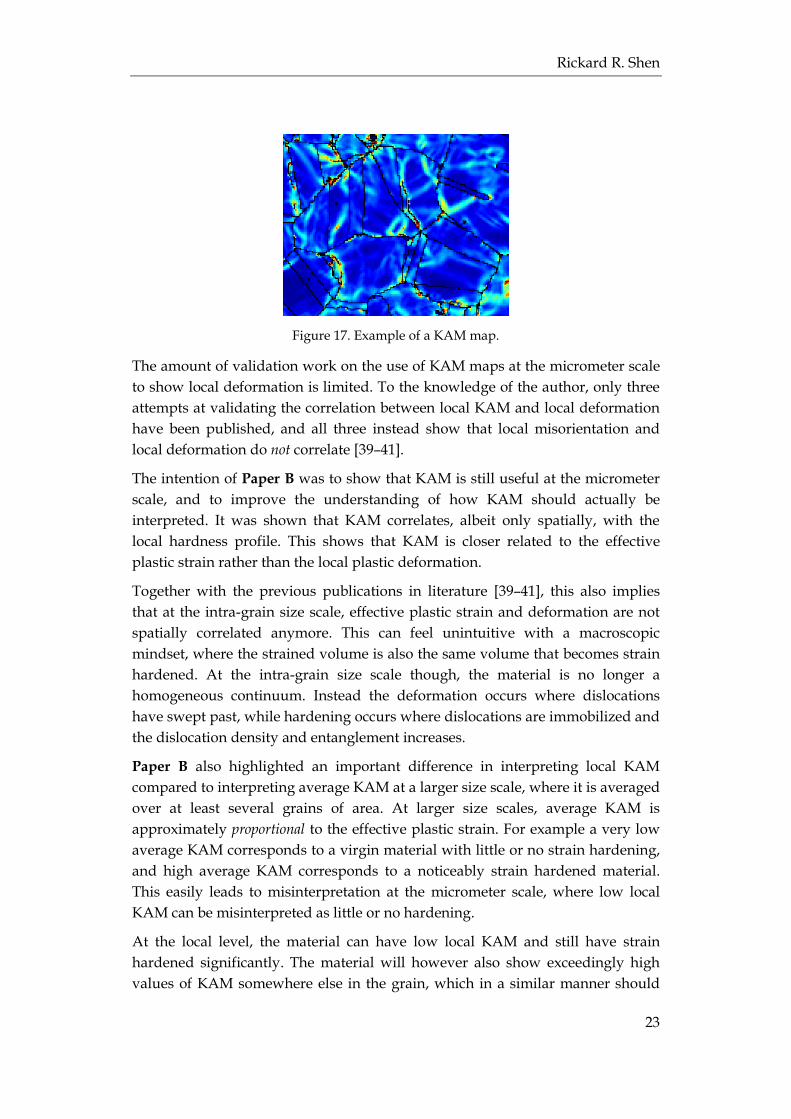
Figure 17. Example of a KAM map.
The amount of validation work on the use of KAM maps at the micrometer scale
to show local deformation is limited. To the knowledge of the author, only three
attempts at validating the correlation between local KAM and local deformation
have been published, and all three instead show that local misorientation and
local deformation do not correlate [39–41].
The intention of Paper B was to show that KAM is still useful at the micrometer
scale, and to improve the understanding of how KAM should actually be
interpreted. It was shown that KAM correlates, albeit only spatially, with the
local hardness profile. This shows that KAM is closer related to the effective
plastic strain rather than the local plastic deformation.
Together with the previous publications in literature [39–41], this also implies
that at the intra-grain size scale, effective plastic strain and deformation are not
spatially correlated anymore. This can feel unintuitive with a macroscopic
mindset, where the strained volume is also the same volume that becomes strain
hardened. At the intra-grain size scale though, the material is no longer a
homogeneous continuum. Instead the deformation occurs where dislocations
have swept past, while hardening occurs where dislocations are immobilized and
the dislocation density and entanglement increases.
Paper B also highlighted an important difference in interpreting local KAM
compared to interpreting average KAM at a larger size scale, where it is averaged
over at least several grains of area. At larger size scales, average KAM is
approximately proportional to the effective plastic strain. For example a very low
average KAM corresponds to a virgin material with little or no strain hardening,
and high average KAM corresponds to a noticeably strain hardened material.
This easily leads to misinterpretation at the micrometer scale, where low local
KAM can be misinterpreted as little or no hardening.
At the local level, the material can have low local KAM and still have strain
hardened significantly. The material will however also show exceedingly high
values of KAM somewhere else in the grain, which in a similar manner should
Estimation of plastic deformation
24
not be misinterpreted as an extreme local hardening. It was found in Paper B that
areas with high KAM were certainly harder, but only slightly. The small variety
in hardness was explained by a high background SSD density, the part of the
dislocation density that does not result in misorientations.
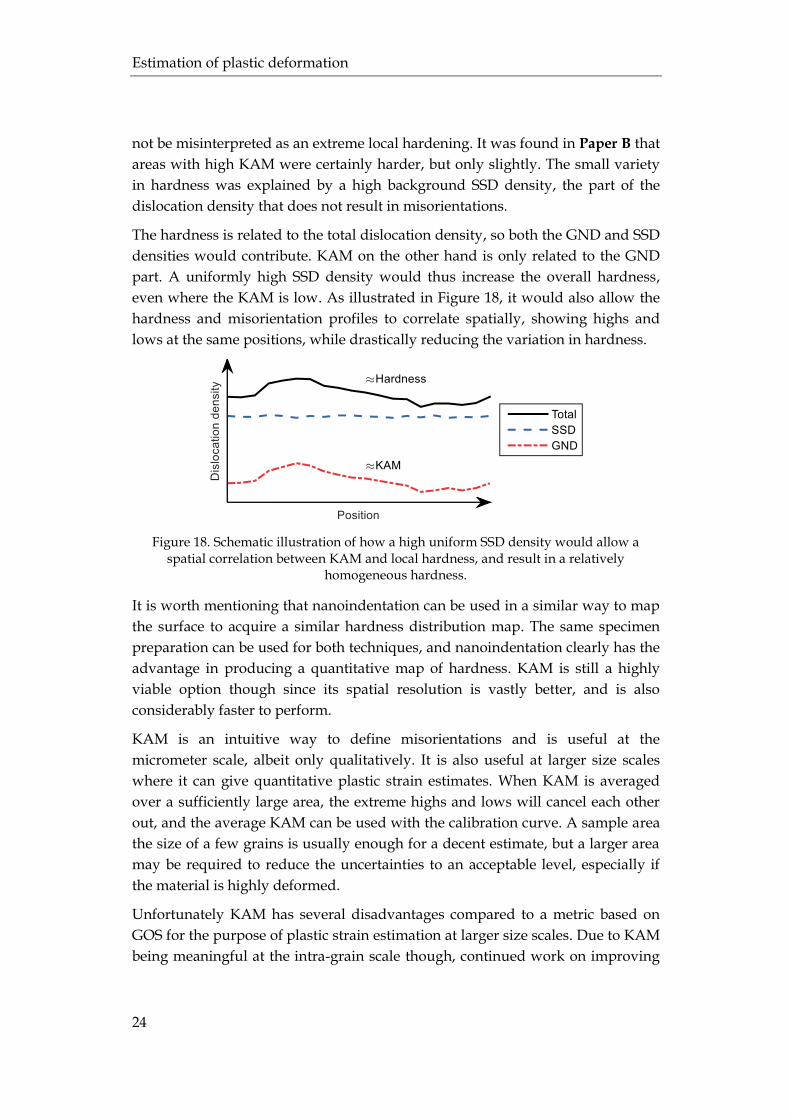
The hardness is related to the total dislocation density, so both the GND and SSD
densities would contribute. KAM on the other hand is only related to the GND
part. A uniformly high SSD density would thus increase the overall hardness,
even where the KAM is low. As illustrated in Figure 18, it would also allow the
hardness and misorientation profiles to correlate spatially, showing highs and
lows at the same positions, while drastically reducing the variation in hardness.
Figure 18. Schematic illustration of how a high uniform SSD density would allow a spatial correlation between KAM and local hardness, and result in a relatively
homogeneous hardness.
It is worth mentioning that nanoindentation can be used in a similar way to map
the surface to acquire a similar hardness distribution map. The same specimen
preparation can be used for both techniques, and nanoindentation clearly has the
advantage in producing a quantitative map of hardness. KAM is still a highly
viable option though since its spatial resolution is vastly better, and is also
considerably faster to perform.
KAM is an intuitive way to define misorientations and is useful at the
micrometer scale, albeit only qualitatively. It is also useful at larger size scales
where it can give quantitative plastic strain estimates. When KAM is averaged
over a sufficiently large area, the extreme highs and lows will cancel each other
out, and the average KAM can be used with the calibration curve. A sample area
the size of a few grains is usually enough for a decent estimate, but a larger area
may be required to reduce the uncertainties to an acceptable level, especially if
the material is highly deformed.
Unfortunately KAM has several disadvantages compared to a metric based on
GOS for the purpose of plastic strain estimation at larger size scales. Due to KAM
being meaningful at the intra-grain scale though, continued work on improving
Rickard R. Shen
25
and understanding KAM is still highly valuable. It was therefore worked out in
Paper C how the drawbacks of KAM can be dealt with.
The drawbacks are unfortunately related to the use of local data and a kernel,
and are thus intrinsic to KAM. It is easy to understand that two points lying very
closely would have very similar lattice orientations. If the distance between the
points was increased though, their lattice orientations would typically differ
more and more, i.e. their misorientation would increase. Since the distance
between points in the kernel is directly linked to the EBSD step length, it is only
natural that a coarser step length would result in larger KAM values. This is
typically called the “step length dependency”, and is why the EBSD step length
is typically reported when publishing results based on KAM.
It is nonetheless clear from Figure 16 that the different points within the kernel
do not necessarily have the same distance to the center point. This allows the
same effect to be artificially created by re-defining a kernel including more
distant points and thereby increasing the average distance between points used
to calculate KAM. Since the term “step length dependency” is fairly established
and intuitive, the combined effect of EBSD step length and kernel design will be
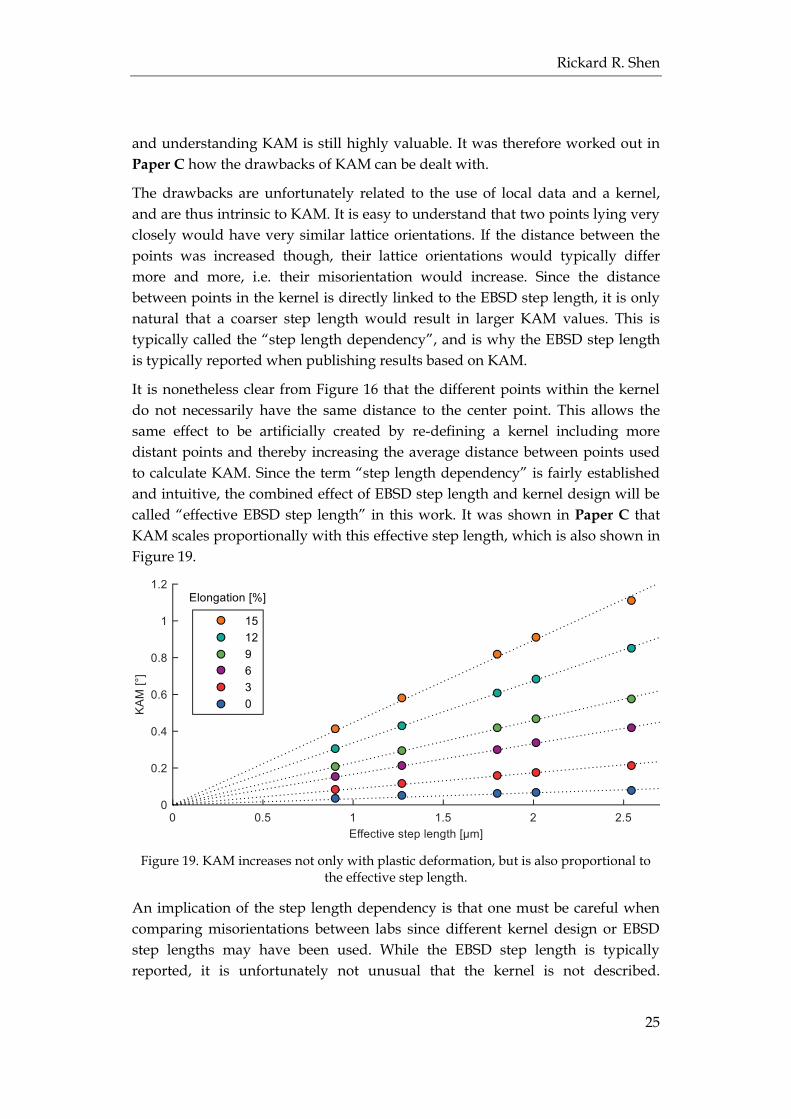
called “effective EBSD step length” in this work. It was shown in Paper C that
KAM scales proportionally with this effective step length, which is also shown in
Figure 19.
Figure 19. KAM increases not only with plastic deformation, but is also proportional to the effective step length.
An implication of the step length dependency is that one must be careful when
comparing misorientations between labs since different kernel design or EBSD
step lengths may have been used. While the EBSD step length is typically
reported, it is unfortunately not unusual that the kernel is not described.
Estimation of plastic deformation
26
Furthermore, Nomura et al. have also shown that KAM decreases with
increasing average grain size [35], and grain size is not always reported either.
Another implication of the combination of this step length dependency and the
grain boundary detection threshold value is commonly observed for heavily
deformed materials which are mapped using an insufficiently fine step length. In
these cases many of the deformation-induced misorientations become large
enough to exceed the grain boundary threshold value and are misinterpreted as
grain boundaries by the algorithm. Depending on how KAM is implemented,
those high misorientation values may be excluded from the KAM calculation.
This results in KAM reaching a lower value than it should have, which is why
the calibration curve at times have been reported showing “saturation”, where
calibration curve becomes non-linear with decreased slope at high plastic strains
[42].
It is shown in Paper C how results obtained using different effective EBSD step
length and grain size can be made comparable. It is thus not critical that two sets
of data must have been acquired using the exact same EBSD step length, which is
an occurring misconception. It is of particular interest that the criteria for two sets
of misorientation data being comparable against each other is that they have the
same effective step length to grain size ratio. The proposed solution is however
not applicable if there is a significant saturation effect in the data.
KAM is also inherently plagued by a high sensitivity to measurement error. This
is a direct result of the points in the kernel being situated in the same local
neighborhood. Consequently the lattice orientations of the points in the kernel
are all quite similar. This allows any random scatter in the orientation
measurements to have a large impact on the misorientation. The resulting effect
of measurement scatter is that the observed misorientations appear larger than
they should.
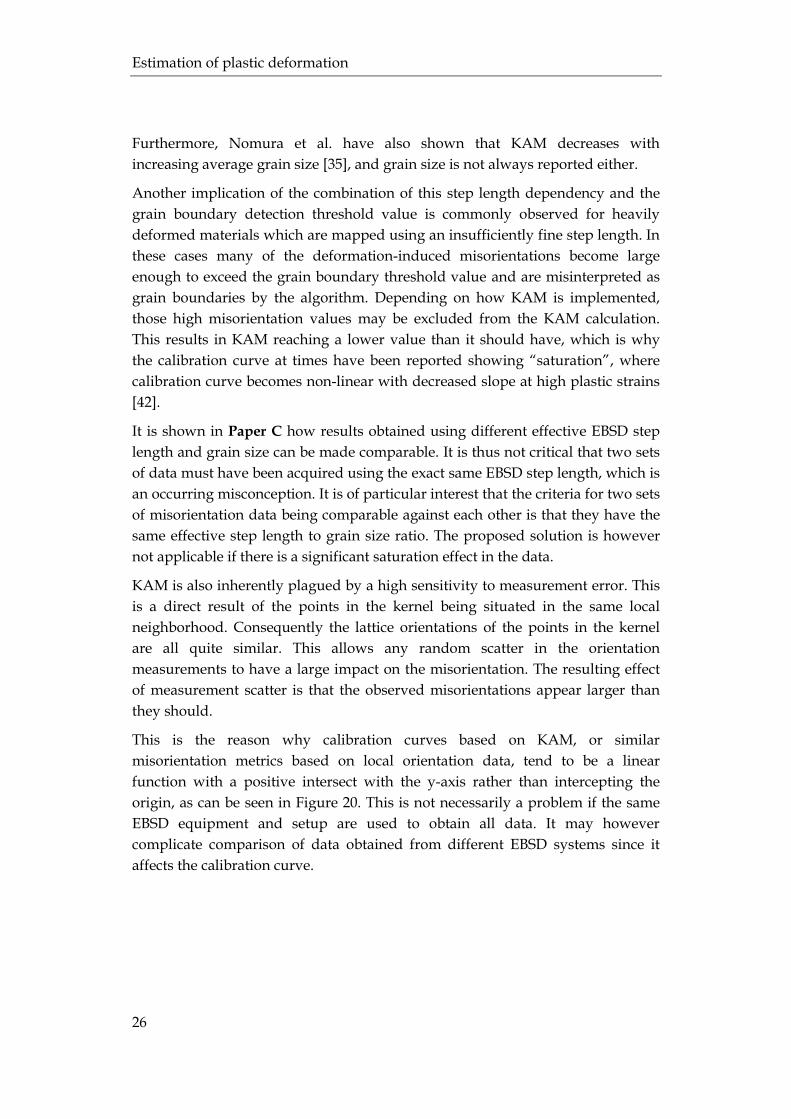
This is the reason why calibration curves based on KAM, or similar
misorientation metrics based on local orientation data, tend to be a linear
function with a positive intersect with the y-axis rather than intercepting the
origin, as can be seen in Figure 20. This is not necessarily a problem if the same
EBSD equipment and setup are used to obtain all data. It may however
complicate comparison of data obtained from different EBSD systems since it
affects the calibration curve.
Rickard R. Shen
27
Figure 20. Calibration curves with and without the orientation smoothening filter to reduce the effect of measurement scatter.
Kamaya [43] has proposed an orientation smoothening filter, which reduces the
effects of measurement scatter on KAM, and the effect is shown in Figure 20. It
was shown in Paper C that such a filter is needed in order to use the neat
expression for compensating for differences in effective step length and grain
size.
Grain orientation spread
There are multiple misorientation metrics that quantify the spread of lattice
orientations within grains, and proposed under a variety of names, e.g. GOS [44],
average intragrain misorientation (AMIS) [36], integrated misorientation density
(IMD) [37], modified crystal deformation (MCD) [38]. Even though the
definitions of these metrics differ, the metrics have very similar properties, and
there is no significant advantage of choosing one method over the other.
Despite their different definitions, what is being calculated one way or another is
the average of the misorientations between the points in the grain and a
representative “central orientation”, as illustrated in Figure 21. The central
orientation is defined differently for each method, for example being the
orientation of the point closest to the grain center, the average orientation of all
points in the grain, the orientation of the point that results in the lowest value of
GOS, etc.
Estimation of plastic deformation
28
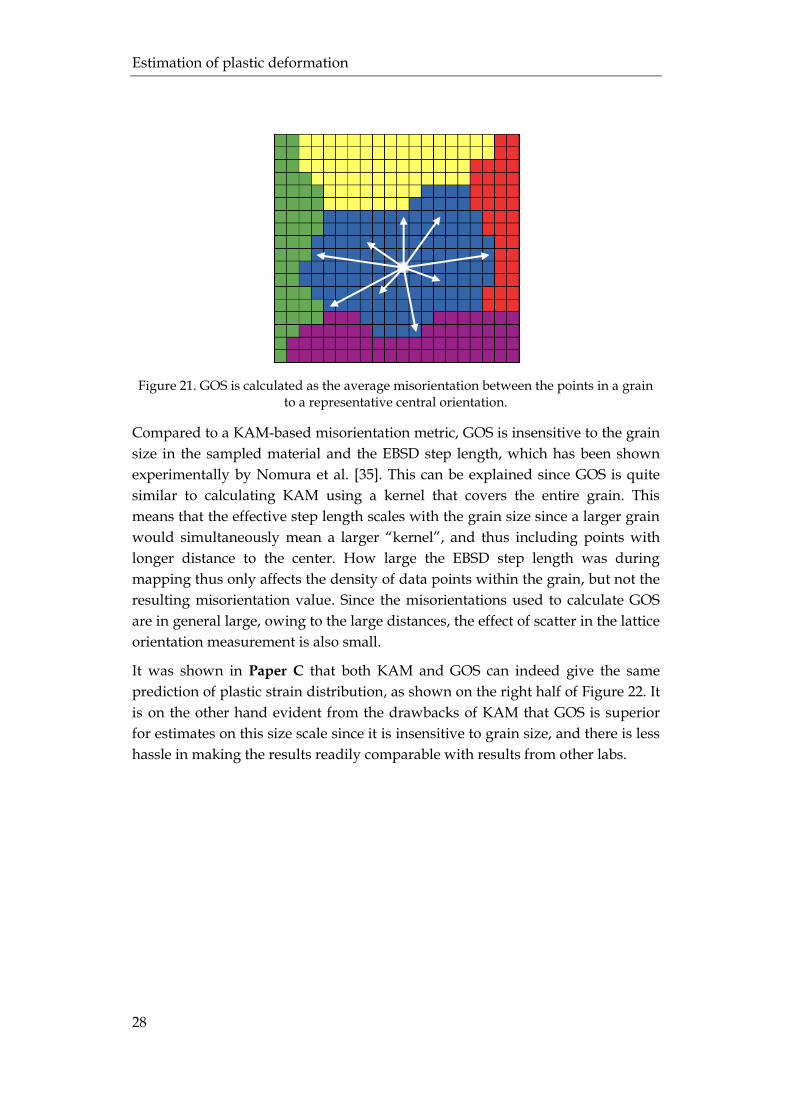
Figure 21. GOS is calculated as the average misorientation between the points in a grain to a representative central orientation.
Compared to a KAM-based misorientation metric, GOS is insensitive to the grain
size in the sampled material and the EBSD step length, which has been shown
experimentally by Nomura et al. [35]. This can be explained since GOS is quite
similar to calculating KAM using a kernel that covers the entire grain. This
means that the effective step length scales with the grain size since a larger grain
would simultaneously mean a larger “kernel”, and thus including points with
longer distance to the center. How large the EBSD step length was during
mapping thus only affects the density of data points within the grain, but not the
resulting misorientation value. Since the misorientations used to calculate GOS
are in general large, owing to the large distances, the effect of scatter in the lattice
orientation measurement is also small.
It was shown in Paper C that both KAM and GOS can indeed give the same
prediction of plastic strain distribution, as shown on the right half of Figure 22. It
is on the other hand evident from the drawbacks of KAM that GOS is superior
for estimates on this size scale since it is insensitive to grain size, and there is less
hassle in making the results readily comparable with results from other labs.
Rickard R. Shen
29
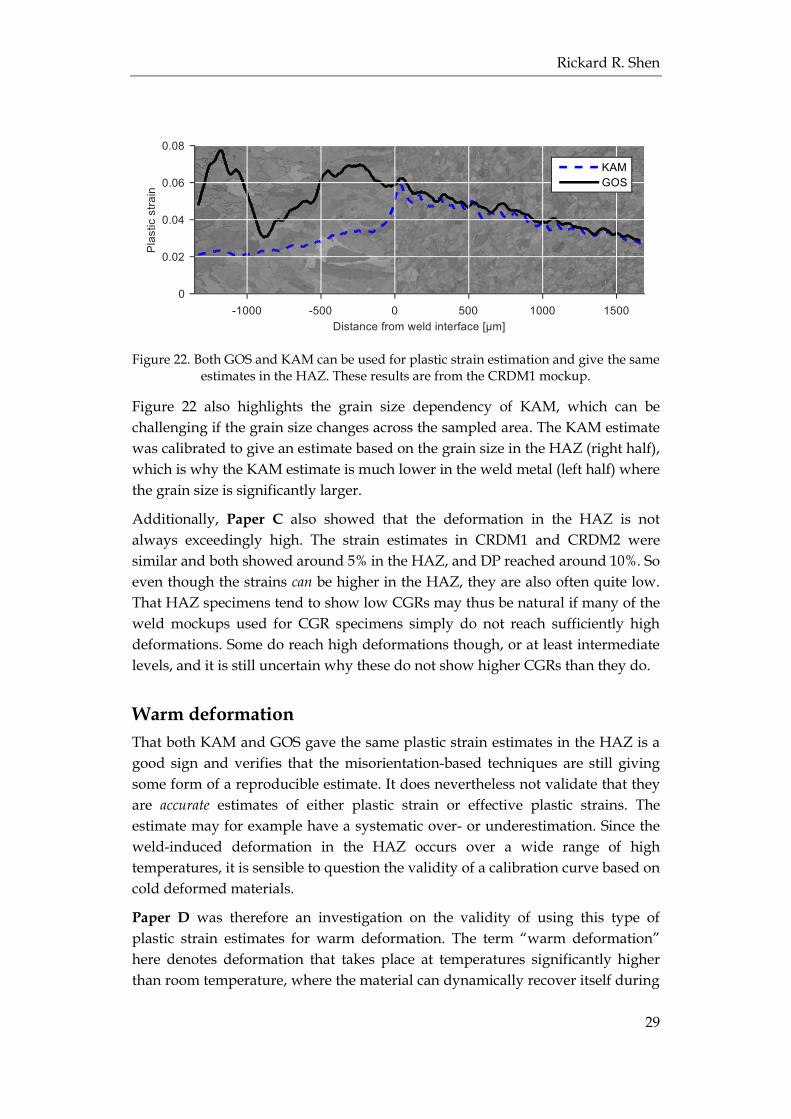
Figure 22. Both GOS and KAM can be used for plastic strain estimation and give the same estimates in the HAZ. These results are from the CRDM1 mockup.
Figure 22 also highlights the grain size dependency of KAM, which can be
challenging if the grain size changes across the sampled area. The KAM estimate
was calibrated to give an estimate based on the grain size in the HAZ (right half),
which is why the KAM estimate is much lower in the weld metal (left half) where
the grain size is significantly larger.
Additionally, Paper C also showed that the deformation in the HAZ is not
always exceedingly high. The strain estimates in CRDM1 and CRDM2 were
similar and both showed around 5% in the HAZ, and DP reached around 10%. So
even though the strains can be higher in the HAZ, they are also often quite low.
That HAZ specimens tend to show low CGRs may thus be natural if many of the
weld mockups used for CGR specimens simply do not reach sufficiently high
deformations. Some do reach high deformations though, or at least intermediate
levels, and it is still uncertain why these do not show higher CGRs than they do.
Warm deformation
That both KAM and GOS gave the same plastic strain estimates in the HAZ is a
good sign and verifies that the misorientation-based techniques are still giving
some form of a reproducible estimate. It does nevertheless not validate that they
are accurate estimates of either plastic strain or effective plastic strains. The
estimate may for example have a systematic over- or underestimation. Since the
weld-induced deformation in the HAZ occurs over a wide range of high
temperatures, it is sensible to question the validity of a calibration curve based on
cold deformed materials.
Paper D was therefore an investigation on the validity of using this type of
plastic strain estimates for warm deformation. The term “warm deformation”
here denotes deformation that takes place at temperatures significantly higher
than room temperature, where the material can dynamically recover itself during
Estimation of plastic deformation
30
the deformation process. The temperature during warm deformation, and the
degree of deformation, should also be kept low enough to avoid recrystallization.
Deformation performed at even higher temperatures with the intent to allow the
material to recrystallize dynamically during the process is instead called hot
deformation. Recrystallization is a process where new grains, with very low
dislocation density, nucleate in heavily deformed material volumes and grow by
absorbing the surrounding deformed material where dislocation density is high.
Since the recrystallized volume has a very low dislocation density, the
misorientation also drops to very low levels. This is well-established, and has
already made EBSD a common tool for measuring the fraction of material that
has recrystallized [44]. How hot deformation affects misorientations is in other
words understood. Warm deformation on the other hand still needs more work.
Nomura et al. have shown that the relationship between misorientation and
plastic strain is still linear for warm deformation in austenitic stainless steels [35].
The deformation temperature may still change the slope of the calibration curve
though, and it is still important to confirm whether or not the estimation still
gives a quantitative estimate of effective plastic strain, or if it at least gives a
qualitative one.
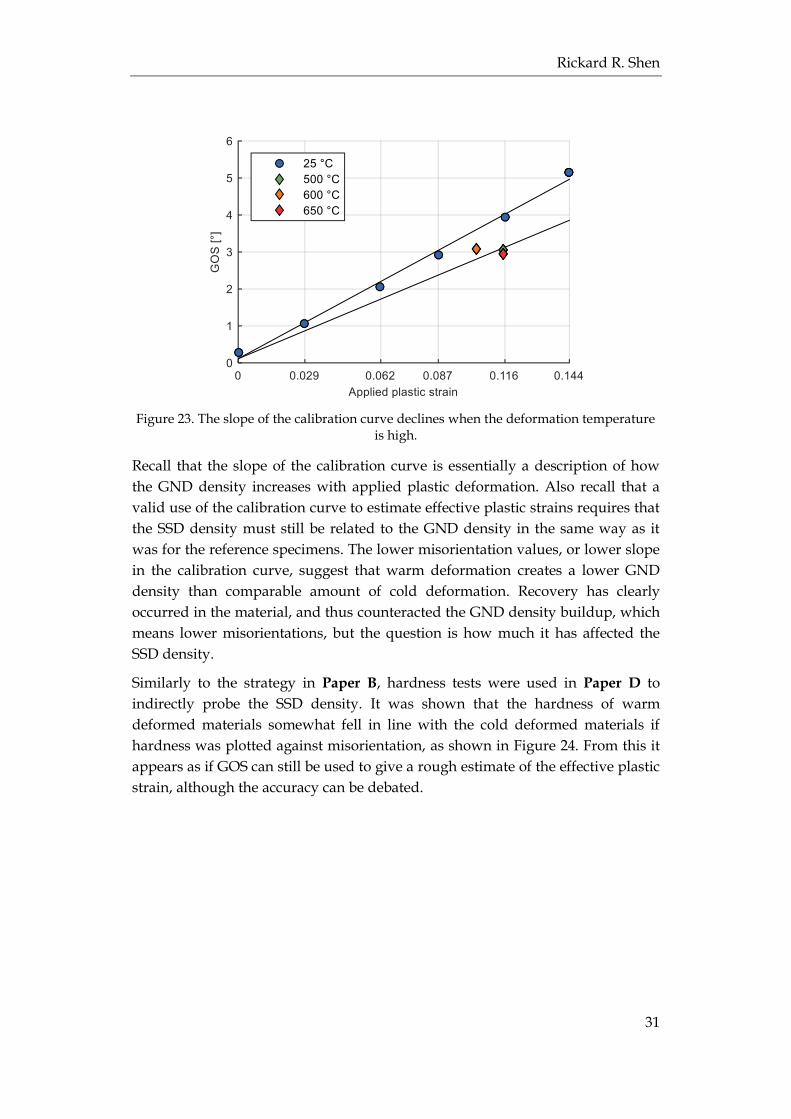
It was shown in Paper D that warm deformation indeed results in lower
misorientations than the same applied deformation at room temperature. This
suggests that the increased deformation temperature has resulted in a decreased
slope of the calibration curve, as shown in Figure 23. If this effect is not
considered, a GOS-based estimation would thus underestimate the applied
plastic strain. In this case for example, the actual applied elongation by warm
deformation was over 11%, whereas according to the calibration curve based on
cold deformed reference specimens the estimated applied elongation would have
only been around 9%.
Rickard R. Shen
31
Figure 23. The slope of the calibration curve declines when the deformation temperature is high.
Recall that the slope of the calibration curve is essentially a description of how
the GND density increases with applied plastic deformation. Also recall that a
valid use of the calibration curve to estimate effective plastic strains requires that
the SSD density must still be related to the GND density in the same way as it
was for the reference specimens. The lower misorientation values, or lower slope
in the calibration curve, suggest that warm deformation creates a lower GND
density than comparable amount of cold deformation. Recovery has clearly
occurred in the material, and thus counteracted the GND density buildup, which
means lower misorientations, but the question is how much it has affected the
SSD density.
Similarly to the strategy in Paper B, hardness tests were used in Paper D to
indirectly probe the SSD density. It was shown that the hardness of warm
deformed materials somewhat fell in line with the cold deformed materials if
hardness was plotted against misorientation, as shown in Figure 24. From this it
appears as if GOS can still be used to give a rough estimate of the effective plastic
strain, although the accuracy can be debated.
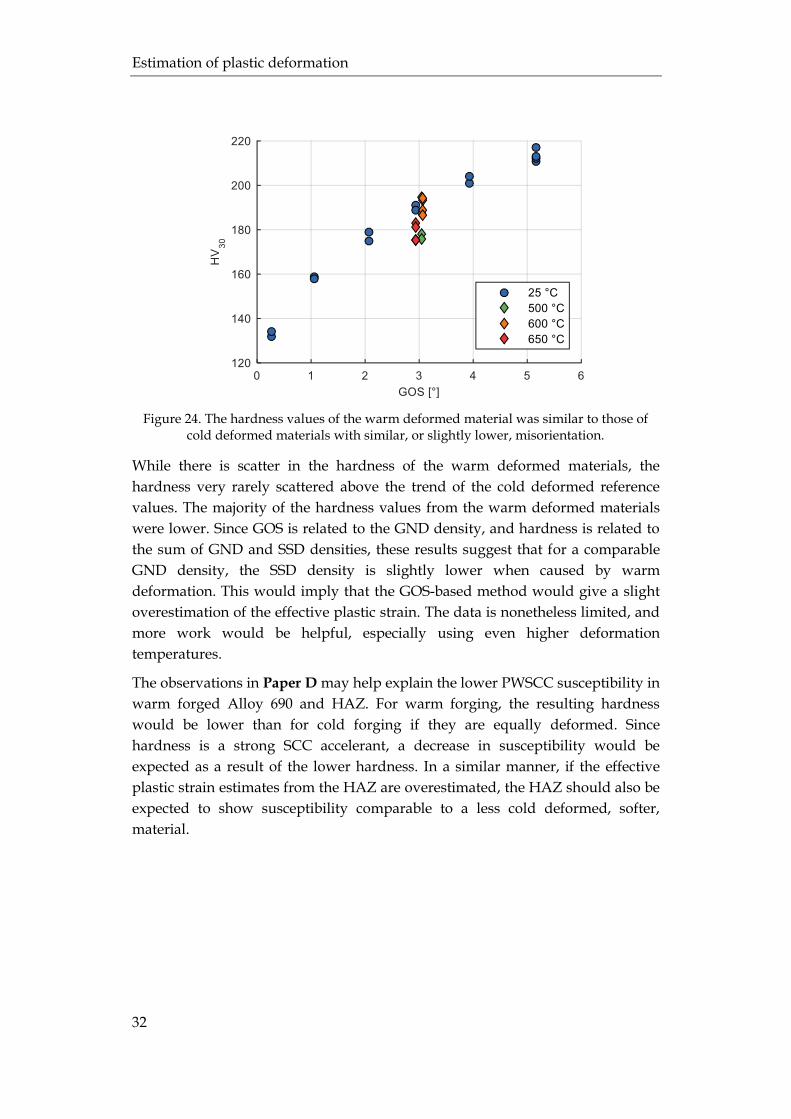
Estimation of plastic deformation
32
Figure 24. The hardness values of the warm deformed material was similar to those of cold deformed materials with similar, or slightly lower, misorientation.
While there is scatter in the hardness of the warm deformed materials, the
hardness very rarely scattered above the trend of the cold deformed reference
values. The majority of the hardness values from the warm deformed materials
were lower. Since GOS is related to the GND density, and hardness is related to
the sum of GND and SSD densities, these results suggest that for a comparable
GND density, the SSD density is slightly lower when caused by warm
deformation. This would imply that the GOS-based method would give a slight
overestimation of the effective plastic strain. The data is nonetheless limited, and
more work would be helpful, especially using even higher deformation
temperatures.
The observations in Paper D may help explain the lower PWSCC susceptibility in
warm forged Alloy 690 and HAZ. For warm forging, the resulting hardness
would be lower than for cold forging if they are equally deformed. Since
hardness is a strong SCC accelerant, a decrease in susceptibility would be
expected as a result of the lower hardness. In a similar manner, if the effective
plastic strain estimates from the HAZ are overestimated, the HAZ should also be
expected to show susceptibility comparable to a less cold deformed, softer,
material.
Conclusions
33
Conclusions
This thesis has been an effort in understanding why subjecting Alloy 690 to cold
deformation usually results in it becoming susceptible to PWSCC, while weld-
induced deformation in the HAZ does not seem to have a nearly as strong effect.
Answers and clues were sought after in its microstructure and its weld-induced
changes in Paper A. The grain boundary carbides were found to have dissolved
near the weld interface which is believed to be beneficial against deformation-
induced susceptibility to PWSCC. The length scales involved nonetheless ruled
this out as an explanation for the low susceptibility in the HAZ. The majority of
the HAZ affected by significant deformation has not shown any noticeable
changes in its microstructure.
The degree of plastic straining in the HAZ as a result of welding has typically
been estimated using misorientations mapped by EBSD. Although the plastic
strains according to this method can be high for some welds, results in Paper C
and similar published work show that it is not always high enough for
meaningful PWSCC susceptibility to be expected. This still does not explain the
rarity of higher PWSCC susceptibility of weld-deformed HAZ. This plastic strain
estimation method has however been used despite having knowledge gaps and
limited validation. Therefore addressing the issues of this method became the
main focus of this thesis.
One of the issues was the interpretation of local KAM. At least three published
works in literature have shown that local KAM do not correlate with local plastic
strains, i.e. how the surface had deformed. In Paper B it was instead shown that
KAM is related to the effective plastic strains, i.e. degree of strain hardening, albeit
only in a qualitative way. This also suggests that KAM should only be used in a
quantitative way if it is averaged over a sufficiently large surface. A minimum
sample area corresponding to a few grains seems to be a good rule of thumb.
Another issue with KAM is that it has it is sensitive to orientation measurement
scatter, and dependent on average grain size, definition of kernel and EBSD step
length. It was shown in Paper C how this can be dealt with, which allows
comparison of results between labs, for example so that a published calibration
curve can be readily used by another lab even if they have different EBSD
hardware and software. Specifically, using the same EBSD step length alone does
not make two sets of KAM data compatible, but having the ratio of effective
EBSD step length to grain size does.
Estimation of plastic deformation
34
Paper D addressed the debatable use of misorientation mapping to estimate
plastic strains in HAZ since the weld-induced deformation is clearly not cold
deformation. It was shown that the misorientation-based method indeed cannot
be used to estimate the degree of plastic deformation induced in the material by
warm deformation if the calibration curve was made using cold deformed
reference materials. The estimate did however appear to be a rough estimate of
the effective plastic strain, although possibly with an overestimation. If this is
true, then it would indicate that the HAZ would be less strain hardened than
EBSD implies, which is beneficial from a PWSCC point of view. More work is
nonetheless advised to confirm if there truly is an overestimation.
Rickard R. Shen
35
Suggestions for future work
During the work with this thesis some ideas for possible future work have
sprouted, and some ideas for the already ongoing work:
Information about crystallographic texture has generally not been reported
with CGR testing, and may be worth including. Hardness or yield strength
would also be useful to present with the specimens in addition to its cold
deformation level.
The understanding of how banding affects PWSCC is still very limited. Finite
element simulations of rolling or forging of banded material would be useful
to show how the direction of deformation and banding may synergize, e.g. by
looking into the resulting plastic strain distribution, the resulting hardness
profile, residual stresses on the microstructural level, etc.
More work similar to that of Paper D, but with warm deformation at even
higher temperatures would be useful in clarifying if the calibration curve
gives an accurate estimate of effective plastic strain or not. More specifically,
to clarify if the indication of overestimation observed in this work was true or
not, and if it becomes more prominent at higher temperatures if true.
Simulation of how SSD and GND densities evolve depending on deformation
would be helpful in understanding the limits of misorientation-based plastic
strain estimation method.
The effect of grain size on misorientation seems understood for equiaxed
grains, but if elongated grains should be treated differently is a highly
relevant question if a misorientation-based plastic strain estimation method is
to be used on weld metals, where the length of a grain can reach millimeters
while its width is still in the range of 50–150 µm. This should be clarified,
especially since it is also relevant for highly deformed materials where grains
can become elongated.
Bibliography
36
Bibliography
[1] J. Gorman, S. Hunt & P. Riccardella. (2006) “PWR reactor vessel Alloy 600 issues”, in Companion Guide to the ASME Boiler & Pressure Vessel Code. K.R. Rao (ed.), vol. 3, ASME Press, New York.
[2] H. Coriou, L. Grall, Y. Le Gall & S. Vettier. (1959) “Stress corrosion cracking of Inconel in high temperature water”, in 3rd Metallurgy Conference of Corrosion. Saclay, France, 1959, North Holland Publishing Company, Amsterdam, pp 161–169.
[3] B. Grönvall, L. Ljungberg, W. Hübner & W. Stuart. (1967) ”Intercrystalline stress corrosion cracking of Inconel 600 inspection tubes in the Ågesta reactor”, Nuclear Engineering and Design, vol. 6, no. 4, pp. 383–390.
[4] D. Van Rooyen. (1975) “Review of the stress corrosion cracking of Inconel 600”, Corrosion, vol. 31, no. 9, pp. 327–337.
[5] K. Norring & J. Engström. (2008) “Initiation of SCC in nickel base alloys in primary PWR environment: studies at Studsvik since mid 1980s”, Energy Materials, vol. 3, no. 2, pp. 113–118.
[6] K. Stiller, J.-O. Nilsson & K. Norring. (1996) ”Structure, chemistry, and stress corrosion cracking of grain boundaries in alloys 600 and 690”, Metallurgical and Materials Transactions A, vol. 27, no. 2, pp. 327-341.
[7] R.J. Jacko & R.E. Gold, (2005) “Crack initiation in Alloy 600 SG tubing in elevated pH PWR primary water”, in Proceedings of the 12th International Conference on Environmental Degradation of Materials in Nuclear Power Systems – Water Reactors, Salt Lake City, UT, USA, 2005, pp. 925–936.
[8] K. Kawasaki, T. Maeguchi, K. Sakima, S. Asada & K. Tsutsumi. (2016) “MHI approach for evaluation and mitigation of PWSCC of Alloy 690/152/52 in actual plant”, in EPRI Alloy 690/52/152 PWSCC Research Collaboration Meeting, Tampa, FL, USA, 2016.
[9] H.A. Domian, R.H. Emanuelson, L.W. Sarver, G.J. Theus & L. Katz. (1977) “Effect of microstructure on stress corrosion cracking of Alloy 600 in high purity water”, Corrosion, vol. 33, no. 1, pp. 26–38.
[10] J.M. Sarver, J.R. Crum & W.L. Mankins. (1987) “Carbide precipitation and the effect of thermal treatments on the SCC behavior of INCONEL Alloy 690”, in Proceedings of the 3rd International Conference on Environmental Degradation of Materials in Nuclear Power Systems – Water Reactors, Traverse City, MI, USA, 1987, pp. 581–586.
Rickard R. Shen
37
[11] D. Noel, O. de Bouvier, F. Foct, T. Magnin, J.D. Mithieux & F. Vaillant. (1996) ”Study of the mechanisms of stress corrosion cracking of Alloys 600 and 690 in primary water reactor conditions”, in Proceedings of the 2nd International Conference on Corrosion-Deformation Interactions, Nice, France, 1996, pp. 435–452.
[12] Special Metals Corporation. (2008) “INCONEL® alloy 600”, no. SMC-027.
[13] Special Metals Corporation. (2009) ”INCONEL® alloy 690”, no. SMC-079.
[14] D.J. Paraventi & W.C. Moshier. (2007) “Alloy 690 SCC growth rate testing”, in Proceedings of the EPRI Workshop on Cold Work in Iron and Nickel Base Alloys, Toronto, ON, Canada, 2007, R.W. Staehle, J. Gorman (eds.), no. 1016519, EPRI, Palo Alto, CA, USA.
[15] N.R. Overman, M.B. Toloczko, M.J. Olszta & S.M. Bruemmer. (2014) “Strain correlations in Alloy 690 materials using electron backscatter diffraction and Vickers hardness, in Corrosion 2014, San Antonio, TX, USA, 2014.
[16] M.B. Toloczko, N.R. Overman, M.J. Olszta & S.M. Bruemmer. (2016) “Pacific Northwest National Laboratory investigation of stress corrosion cracking in nickel-base alloys: Stress corrosion cracking of cold worked Alloy 690”, vol. 3, no. NUREG/CR-7103, PNNL-24647, Pacific Northwest National Laboratory, Richland, WA, USA.
[17] Yonezawa, T., Watanabe, M. and Hashimoto, A. (2015) “The effects of metallurgical factors on PWSCC crack growth rates in TT Alloy 690 in simulated PWR primary water”, Metallurgical and Materials Transactions A, vol. 46, no. 6, pp. 2768–2780.
[18] K. Arioka, R.W. Staehle, T. Yamada, T. Miyamoto & T. Terachi. (2016) ”Degradation of Alloy 690 after relatively short times”, Corrosion, vol. 72, no. 10, pp. 1252–1268.
[19] P.L. Andresen & A. Ahluwalia. (2016) ”SCC of Alloy 690, Alloy 152/52/52i weld metals and dilution zones”, in EPRI Alloy 690/52/152 PWSCC Research Collaboration Meeting, Tampa, FL, USA, 2016.
[20] F.J. Perosanz, M.S. Garcia-Redondo, J. Lapeña, A. Sáez-Maderuelo & D. Gómez-Briceño. (2015) “Crack growth rate data from Alloy 690 CRDM mock-up”, in Proceedings of the 17th International Conference on Environmental Degradation of Materials in Nuclear Power Systems – Water Reactors, Ottawa, ON, Canada, 2015.
[21] R.B. Rebak & Z. Szklarska-Smialowska. (1996) ”The mechanism of stress corrosion cracking of Alloy 600 in high temperature water”, Corrosion Science, vol. 38, no. 6, pp. 971–988.
Bibliography
38
[22] R.B. Rebak & F.H. Hua. (2004) “The role of hydrogen and creep in intergranular stress corrosion cracking of Alloy 600 and Alloy 690 in PWR primary water environments – A review”, in Proceedings of the 2nd International Conference on Environment-Induced Cracking of Metals, no. UCRL-PROC-205679, Banff, AB, Canada, 2004.
[23] P.L. Andresen. (2002) “Similarity of cold work and radiation hardening in enhancing yield strength and SCC growth of stainless steel in hot water”, in Corrosion 2002, Denver, CO, USA, 2002.
[24] A. Magnusson, E. Lindén & R. Waginder. (2015) ”Technical regulations for mechanical equipment – Edition 7”, Vattenfall.
[25] P.L. Andresen, M.M. Morra & K. Ahluwalia. (2011) ”SCC of Alloy 690 and its weld metals”, in Proceedings of the 15th International Conference on Environmental Degradation of Materials in Nuclear Power Systems – Water Reactors, Colorado Springs, CO, USA, 2011.
[26] B. Alexandreanu, Y. Chen, K. Natesan & B. Shack. (2011) “Cyclic and SCC behavior of Alloy 690 in a PWR environment”, in Proceedings of the 2011 ASME Pressure Vessel and Piping Division Conference, Baltimore, MD, USA, 2011.
[27] J. Hou, T. Shoji, Z.P. Lu, Q.J. Peng, J.Q. Wang, E.-H. Han & W. Ke. (2010) “Residual strain measurement and grain boundary characterization in the heat-affected zone of a weld joint between Alloy 690TT and Alloy 52”, Journal of Nuclear Materials, vol. 397, no. 1–3, pp. 109–115.
[28] A. Saez-Maderuelo, L. Castro & G. de Diego. (2011) “Plastic strain characterization in austenitic stainless steels and nickel alloys by electron backscatter diffraction”, Journal of Nuclear Materials, vol. 416, no. 1–2, pp. 75-79.
[29] P.L. Andresen. (2013) ”SCC of Alloy 690 and heat affected zones”, in EPRI Alloy 690/52/152 PWSCC Research Collaboration Meeting, Tampa, FL, USA, 2013.
[30] W. Lengauer, S. Binder, K. Aigner, P. Ettmayer, A. Guillou, J. Debuigne & G. Groboth. (1995) "Solid state properties of group IVb carbonitrides", Journal of Alloys and Compounds, vol. 217, no. 1, pp. 137–147.
[31] P. Norberg. (1985) “The influence of composition and heat treatment on microstructure and material properties of Sandvik Sanicro 69 (Alloy 690)”, in EPRI Workshop on Thermally Treated Tube for Nuclear Steam Generators, Pittsburgh, PA, USA, 1985.
Rickard R. Shen
39
[32] D.R. Tice, S.L. Medway, N. Platts & J.W. Stairmand. (2011) “Crack growth testing on cold worked Alloy 690 in primary water environment”, in Proceedings of the 15th International Conference on Environmental Degradation of Materials in Nuclear Power Systems – Water Reactors, Colorado Springs, CO, 2011.
[33] S.M. Bruemmer, M.J. Olszta, M.B. Toloczko & L.E. Thomas. (2012) “Linking grain boundary microstructure to stress corrosion cracking of cold-rolled alloy 690 in pressurized water reactor primary water”, Corrosion, vol. 69, no. 10, pp. 953–963.
[34] A.J. Wilkinson & D.J. Dingley. (1991) “Quantitative deformation studies using electron back scatter patterns”, Acta Metallurgica et Materialia, vol. 39, no. 12, pp. 3047–3055.
[35] K. Nomura, K. Kubushiro, Y. Sakakibara, S. Takahashi and H. Yoshizawa. (2012) “Effect of grain size on plastic strain analysis by EBSD for austenitic stainless steels with tensile strain at 650°C”, Journal of the Society of Materials Science, Japan, vol. 61, No. 4, pp. 371–376.
[36] J.A. Sutliff. (1999) “An investigation of plastic strain in copper by automated-EBSP”, in Proceedings of Microscopy and Microanalysis 5, Portland, OR, 1999, pp. 236–237.
[37] E.M. Lehockey, Y.-P. Lin, & O.E. Lepik. (2000) “Mapping residual plastic strain in materials using electron backscatter diffraction”, Electron backscatter diffraction in materials science, A.J. Schwartz, M. Kumar & B.L. Adams (eds.), Kluwer Academic-Plenum Publishers, New York, pp. 247–264.
[38] M. Kamaya, A.J. Wilkinson & J.M. Titchmarsh. (2006) “Quantification of plastic strain of stainless steel and nickel alloy by electron backscatter diffraction”, Acta Materialia, vol. 54, no. 2, pp. 539–548.
[39] M. Kamaya, J.Q. da Fonseca, L.M. Li & M. Preuss. (2007) “Local plastic strain measurement by EBSD”, Applied Mechanics and Materials, vols. 7–8, pp. 173–179.
[40] K. Sasaki, M. Kamaya, T. Miura & K. Fukuya. (2010) “Correlation between microstructural scale plastic strain and misorientation”, Journal of the Japan Institute of Metals, vol. 74, no. 7, pp. 467–474.
[41] S. Mukherjee, S.K. Mishra, I. Samajdar & P. Pant. (2012) ”Local strain calculations using electron backscattered diffraction (EBSD) measurements and digital image processing”, Materials Science Forum, vols. 702–703, pp. 562–565.
[42] M. Kamaya. (2009) “Measurement of local plastic strain distribution of stainless steel by electron backscatter diffraction”, Materials Characterization, vol. 60, no. 2, pp. 125–132.

Bibliography
40
[43] M. Kamaya. (2010) “A smoothing filter for misorientation mapping obtained by EBSD”, Materials Transactions, vol. 51, no. 9, pp. 1516–1520.
[44] S.I. Wright. (1999) “Quantification of recrystallized fraction from orientation imaging scans”, in Proceedings of the 12th International Conference on Textures of Materials, Montreal, QC, Canada, 1999.

Rickard R. Shen
41
Summary of appended papers
Paper A: Experimental and theoretical investigation of three Alloy 690 mockup
components: Base metal and welding induced changes
The microstructure of Alloy 690 and how it changes near the weld interface was
studied in this paper using light optical microscopy (LOM) and scanning electron
microscopy (SEM). Thermodynamic calculations were used to confirm that the
Ti(C,N) phase will not be fully dissolved in the HAZ. To ensure that the results
would be representative of materials in the power plants, the material samples
came from three component mockups with Alloy 690 parts joined by welding.
Clear bands of fine Ti(C,N) precipitates were observed in two of the materials,
which was associated with locally reduced grain size and coarser intergranular
M23C6 carbides. In all three materials, the M23C6 carbides were dissolved up to a
few hundreds of microns from the weld interface while the Ti(C,N) appeared
unaffected.
Paper B: Spatial correlation between local misorientation and nanoindentation hardness in nickel-base Alloy 690
In this paper the validity of using the KAM-based calibration curve to estimate
the effective plastic strains at the local intra-grain micrometer size scale was tried.
A simple model was used to calculate the local hardness based on the local KAM.
The local hardness profile was thus calculated for a few grains, which was then
compared with hardness maps from the exact same locations acquired using
nanoindentation. A good spatial correlation between KAM and measured
hardness was found, but the hardness map based on KAM showed a drastically
larger hardness variation. This was explained as an effect of KAM being caused
by only the GND density, while strain hardening in Alloy 690 is caused by the
total dislocation density. The results indicate that there is a high and uniform
background SSD density, and thus local KAM can be used to obtain a qualitative
map of hardness.
Summary of appended papers
42
Paper C: Plastic strain assessment of Alloy 690 heat affected zones from component mockups using KAM and GOS
This paper was written for two main different purposes. One was to present
plastic strain estimates from the HAZs of the mockups that had previously been
characterized in Paper A. The other purpose was to show ways of improving the
viability of using KAM for plastic strain estimation. It was shown that the use of
an orientation smoothening filter is effective at reducing the influence of
orientation measurement scatter. It was also shown that with the filter applied,
KAM was proportional to the mean distance between points in the kernel and the
kernel center, and inversely proportional to the average grain size of the material.
This for example allows one single calibration curve to be used for a similar
Alloy 690 material with different grain size, or for EBSD data obtained using a
different step length. It was nevertheless pointed out that if GOS is used, these
parameters do not need to be considered.
Paper D: Comparison of EBSD-based plastic strain estimation of Alloy 690 strained at 500–650 °C and at room temperature
It is not obvious that the calibration curve is valid for weld deformation since the
deformation occurs at high temperatures. In this paper the same material
originally used for the calibration curve was thus deformed in the same manner,
but at 500, 600 and 650 °C instead to see how the resulting misorientation would
be relative to the original calibration curve and reference materials. It was found
that warm deformation causes noticeably lower misorientation in the material.
As expected, due to recovery, the warm deformation also caused less strain
hardening than comparable amount of applied cold deformation. That both
misorientation and hardness decreased resulted in the calibration curve still
seeming to give a crude estimate of the effective plastic strain, although the data
suggests that it may be an overestimation. More work is recommended to
ascertain the validity of using misorientations to estimate effective plastic strain,
especially with results from even higher temperatures.