
Modeling Intercontinental Transport, Hemispheric Pollution, And Climate Linkages At GFDL
Upload
evelyn-onealCategory
view
21download
0description

Environmental Modeling Center
______________________________________________ Climate Change and Air Quality Workshop
MCNC
On the intercontinental transport of Pollutants; Modeling Studies
Adel Hanna, Rohit Mathur, Aijun Xiu, Kiran Alapaty,
Uma Shankar, and Zac Adelman
MCNC-Environmental Modeling Center
P.O. Box 12889
Research Triangle Park, NC 27709-2889
USA

2
Environmental Modeling Center
______________________________________________ Climate Change and Air Quality Workshop
MCNC
Outline
Flux of Pollutants Integrated Modeling Approach Intercontinental Transport Model Evaluation and Remote Sensing Data

3
Environmental Modeling Center
______________________________________________ Climate Change and Air Quality Workshop
MCNC
1- Flux of Pollutants Characterization of Synoptic Patterns
Southwest flow at the surface ahead of a cold front approaching the Northeastern US. (e.g., June 7-8 and 10-11, 1995)
A surface high pressure extending over the middle Atlantic and Northeastern US. An OMEGA pattern at 500 mb. Re-circulation over the Southeastern US (e.g. June 16-17-18, 1995)
A surface low pressure over central US June and OMEGA pattern at 500 mb (e.g. June 26 – 27, 1995)
Large-scale circulation with surface high pressure and 500 mb high pressure (e.g., July 14 and 15, 1995)

4
Environmental Modeling Center
______________________________________________ Climate Change and Air Quality Workshop
MCNC
Surface and 500 mb MeteorologyJune 7, 1995 June 8, 1995

5
Environmental Modeling Center
______________________________________________ Climate Change and Air Quality Workshop
MCNC
O3 Daily Average Flux (June 7 & 8)
July 7, 1995
July 8, 1995

6
Environmental Modeling Center
______________________________________________ Climate Change and Air Quality Workshop
MCNC
Vertical Cross-Section of Zonal Flux- O3 (June 7 &8)

7
Environmental Modeling Center
______________________________________________ Climate Change and Air Quality Workshop
MCNC
8
Environmental Modeling Center
______________________________________________ Climate Change and Air Quality Workshop
MCNC
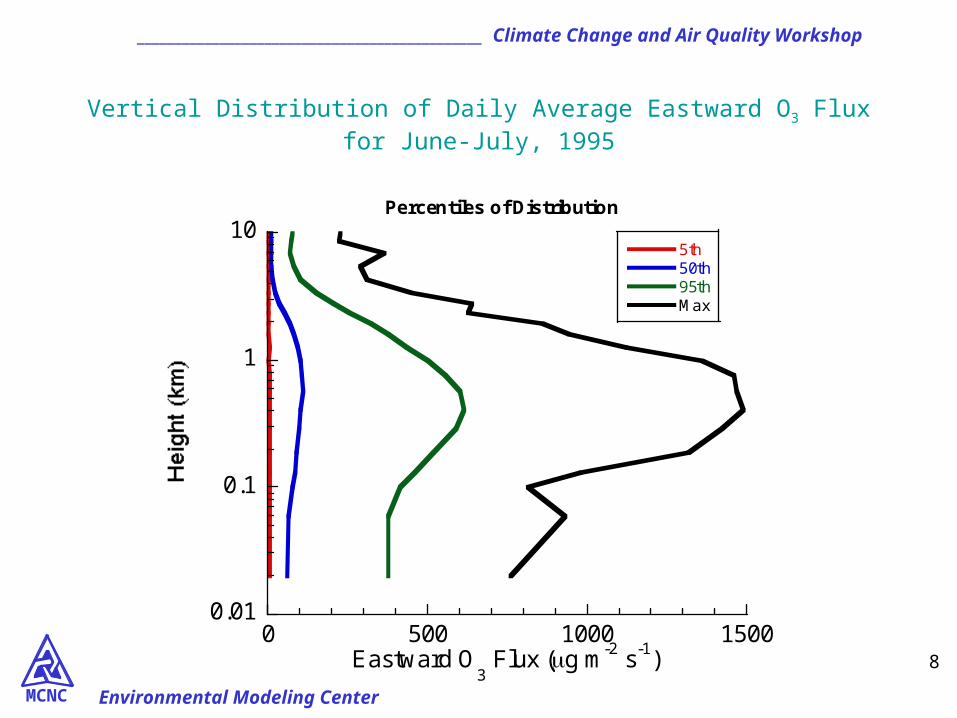
Vertical Distribution of Daily Average Eastward O3 Flux for June-July, 1995
0 500 1000 15000.01
0.1
1
10Percentiles of Distribution
5th50th95thMax
Eastward O3 Flux (g m-2 s-1)

9
Environmental Modeling Center
______________________________________________ Climate Change and Air Quality Workshop
MCNC
Export of O3 Pollution from Eastern United States
Other Studies– 1.1 Gmol/day [Parrish et al., 1993] ;
measurements– 1.6 Gmol/day [Jacob et al., 1993];
global model– 3.2 Gmol/day [Banic et al., 1996];
measurements
0
1
2
3
4
5
5 15 25 35 45 55
EastwardNorthward
Days (June/July 1995)
Mean = 2.25 Gmoles/day
June 1 July 31

10
Environmental Modeling Center
______________________________________________ Climate Change and Air Quality Workshop
MCNC
2- Online Integrated Meteorology Atmospheric Chemistry Calculations Atmospheric Aerosol Loading: Radiative Effects
0
5
10
15
20
25
30
0 5 10 15Concentration (g/m3)
0
5
10
15
20
25
30
0.05 0.1 0.15 0.2 0.25 0.3Diameter (m)
0
5
10
15
20
25
30
150 200 250 300 350 400 450 500Number Density (Number/cm3)

11
Environmental Modeling Center
______________________________________________ Climate Change and Air Quality Workshop
MCNC
3- Intercontinental TransportMAQSIP Pacific Simulations: April 15-30, 1998
Period characterized by two intense dust storms on April 15th and 19th
NASA TOMS Aerosol Index shows large-scale signatures of dust coverage over the Pacific on April 21, 1998
Time period provides an opportunity to examine and study– Transport characteristics of outflow– Effects of superposition of emissions from different regions on pollutant
distribution– Long range transport impacts on chemical composition over the Pacific

12
Environmental Modeling Center
______________________________________________ Climate Change and Air Quality Workshop
MCNC
Transport and Chemical Evolution of Sulfate at 850 mb
April 20, 1998
April 21, 1998
April 22, 1998
Daily Average

13
Environmental Modeling Center
______________________________________________ Climate Change and Air Quality Workshop
MCNC
Transport and Chemical Evolution of Ozone at 850 mb
April 21, 1998
April 22, 1998
April 23, 1998
Daily Average

14
Environmental Modeling Center
______________________________________________ Climate Change and Air Quality Workshop
MCNC
Six Day Back Trajectories

15
Environmental Modeling Center
______________________________________________ Climate Change and Air Quality Workshop
MCNC
4- Model Evaluation and Remote Sensing DataObserved and Simulated CO

16
Environmental Modeling Center
______________________________________________ Climate Change and Air Quality Workshop
MCNC
Charge Questions
How to obtain reliable emissions which are missing from major urban areas in many countries out side North America and Europe?
How to reconcile the differences between global, regional, and field measurements estimates of pollution export ?
The indirect effects of aerosols and the microphysics of clouds are crudely parameterized in regional air quality models


