on the Functioning of the European Carbon Market in 2020 ...
45
EN EN EUROPEAN COMMISSION Brussels, 26.10.2021 COM(2021) 962 final REPORT FROM THE COMMISSION TO THE EUROPEAN PARLIAMENT AND THE COUNCIL on the Functioning of the European Carbon Market in 2020 pursuant to Articles 10(5) and 21(2) of Directive 2003/87/EC (as amended by Directive 2009/29/EC and Directive (EU) 2018/410) {COM(2021) 950 final} - {SWD(2021) 308 final}
Transcript of on the Functioning of the European Carbon Market in 2020 ...

EN EN
EUROPEAN COMMISSION
Brussels, 26.10.2021
COM(2021) 962 final
REPORT FROM THE COMMISSION TO THE EUROPEAN PARLIAMENT AND
THE COUNCIL
on the Functioning of the European Carbon Market in 2020 pursuant to Articles 10(5)
and 21(2) of Directive 2003/87/EC (as amended by Directive 2009/29/EC and Directive
(EU) 2018/410)
{COM(2021) 950 final} - {SWD(2021) 308 final}

1
Table of Contents
List of acronyms and abbreviations ........................................................................................................ 2
1. INTRODUCTION .............................................................................................................................. 3
2. EU ETS INFRASTRUCTURE AND COVERAGE........................................................................... 4
2.1 EU Registry and the European Union Transaction Log .................................................................... 5
3. FUNCTIONING OF THE CARBON MARKET ............................................................................... 6
3.1. Supply: allowances put in circulation .......................................................................................... 6
3.1.1. Cap ........................................................................................................................................ 6
3.1.2. Free allocation .................................................................................................................... 10
3.1.3. Auctioning of allowances .................................................................................................... 12
3.1.4. Derogation from full auctioning for electricity and heat production ................................. 15
3.1.5 NER 300 programme ........................................................................................................... 18
3.1.6. Innovation Fund .................................................................................................................. 19
3.1.7. Modernisation Fund ............................................................................................................ 19
3.1.8. Compensation of indirect carbon costs ............................................................................... 20
3.1.9. International credits ............................................................................................................ 22
3.2. Demand: allowances taken out of circulation ............................................................................ 23
3.2.1. Emissions reductions........................................................................................................... 23
3.2.2. Balancing supply and demand ............................................................................................ 27
4. AVIATION ....................................................................................................................................... 29
5. MARKET OVERSIGHT .................................................................................................................. 32
6. MONITORING, REPORTING AND VERIFICATION OF EMISSIONS ...................................... 35
7. LINK OF THE EU ETS AND THE SWISS ETS ............................................................................ 36
8. EFFECTS OF IMPLEMENTING THE ENERGY EFFICIENCY DIRECTIVE AND THE
NATIONAL ENERGY AND CLIMATE PLANS ON THE EU ETS ................................................. 39
8.1 Impact of the Energy Efficiency Directive implementation on the EU ETS .............................. 39
8.2 Impact of national energy and climate plans’ implementation on the EU ETS .......................... 41
9. CONCLUSIONS AND OUTLOOK ................................................................................................. 42
2
List of acronyms and abbreviations
AVR Accreditation and Verification Regulation
CEF DI Connecting Europe Facility Debt Instrument
CEMs Continuous Emissions Measurement Systems
CINEA European Climate, Infrastructure and Environment Executive Agency
CO2 Carbon Dioxide
CO2eq Carbon Dioxide Equivalent
CORSIA Carbon Offsetting and Reduction Scheme for International Aviation
CP2 Second Commitment Period of the Kyoto Protocol
EA European Cooperation for Accreditation
EEA European Economic Area
EED Energy Efficiency Directive
EEX European Energy Exchange
EIB European Investment Bank
ESMA European Securities and Markets Authority
EU27 European Union Member States
EU ETS European Union Emissions Trading System
EUTL European Union Transaction Log
GHG Greenhouse Gas
ICAO International Civil Aviation Organization
ICE InterContinental Exchange Futures Europe
InnovFin EDP InnovFin Energy Demonstration Projects
MAR Market Abuse Regulation
MiFID2 Directive on Markets in Financial Instruments
MiFIR Regulation on Markets in Financial Instruments
MRR Monitoring and Reporting Regulation
MSR Market Stability Reserve
N2O Nitrous Oxide
NECPs National Energy and Climate Plans
NER New Entrants Reserve
OTC Over-the-counter
PFCs Perfluorocarbons
SARPs CORSIA Standards and Recommended Practices
TNAC Total Number of Allowances in Circulation
UK United Kingdom
UNFCCC United Nations Framework Convention on Climate Change

3
1. INTRODUCTION
The European Union Emissions Trading System (EU ETS) has been a cornerstone of the
EU's strategy for reducing greenhouse gas (GHG) emissions since 2005. Since it was
launched in 2005, emissions in the power and heat generation as well as energy-intensive
industrial sectors, covered by the EU ETS, have fallen by around 43%1. Together with other
legislation, such as on renewable energy2 and energy efficiency3, it has contributed
significantly to achieving the EU’s overall target of reducing GHG emissions by 20% by
2020 from 1990 levels. The EU surpassed this target and reduced GHG emissions by
approximately 31%4 below 1990 levels in 2020.
In July 2021, the Commission adopted a package of proposals to deliver the European Green
Deal5. The proposals aim to make the EU's climate, energy, land use, transport and taxation
policies fit for the task of reducing net GHG emissions by at least 55% by 2030 compared to
1990 levels. The EU ETS will play a major role in achieving this objective. The package
contains a proposal to increase the ambition of the EU ETS with a new emissions reduction
target of 61%6 below 2005 levels by 2030 (compared to 43% below 2005 levels currently), a
lower overall emissions cap, and a steeper annual emissions reduction of 4.2% instead of the
current 2.2% per year.7 The proposal for the revision of the EU ETS also extends its coverage
to maritime emissions and proposes a new, separate emissions trading system to cover
emissions from fuels used in road transport and buildings8.
A separate proposal strengthens the Market Stability Reserve (MSR)9, the mechanism that
addresses the surplus of allowances built up in the EU ETS since 2019 and improves the
system's resilience to major shocks by adjusting the supply of allowances to be auctioned.
Two additional proposals from the July package strengthen the EU ETS for aviation10 to
ensure the sector contributes to the EU’s emissions reduction target, and to implement the
1 Until the end of 2020, for EU27 + the UK + Iceland, Liechtenstein and Norway (which was the scope of the EU ETS until
31 December 2020). 2 Directive (EU) 2018/2001 of the European Parliament and of the Council of 11 December 2018 on the promotion of the
use of energy from renewable sources, OJ L 328, 21.12.2018, p. 82 3 Directive (EU) 2018/2002 of the European Parliament and of the Council of 11 December 2018 amending Directive
2012/27/EU on energy efficiency, OJ L 328, 21.12.2018, p. 210 4 Emissions reductions for EU27. For EU27 + the UK, the decrease was 32.5% below 1990 levels. 5 Delivering the European Green Deal of 14.7.2021 6 This target includes the proposed extention of the scope of the EU ETS to the maritime transport sector. 7 Proposal for a Directive of the European Parliament and of the Council amending Directive 2003/87/EC establishing a
system for greenhouse gas emission allowance trading within the Union, Decision (EU) 2015/1814 concerning the
establishment and operation of a market stability reserve for the Union greenhouse gas emission trading scheme and
Regulation (EU) 2015/757, COM/2021/551 final 8 COM(2021)551 final (as above) 9 Proposal for a Decision of the European Parliament and of the Council amending Decision (EU) 2015/1814 as regards the
amount of allowances to be placed in the market stability reserve for the Union greenhouse gas emission trading scheme
until 2030, COM/2021/571 final 10 Proposal for a Directive of the European Parliament and of the Council amending Directive 2003/87/EC as regards
aviation's contribution to the Union’s economy-wide emission reduction target and appropriately implementing a global
market-based measure, COM/2021/552 final, and Proposal for a Decision of the European Parliament and the Council
amending Directive 2003/87/EC as regards the notification of offsetting in respect of a global market-based measure for
aircraft operators based in the Union, COM/2021/567 final
4
Carbon Offsetting and Reduction Scheme for International Aviation (CORSIA) in EU law in
a way that is consistent with the EU’s 2030 climate objectives.
This report on the functioning of the European carbon market is presented in line with
Articles 10(5) and 21(2) of the Directive 2003/87/EC (EU ETS Directive)11. It covers the
year 2020 and the first half of 2021 (until 30 June 2021); as 2020 marks the last year of phase
3 of the EU ETS (2013-20), it also provides an overview of the main developments over this
period.
The report examines the significant emissions reductions achieved during phase 3 and the
drivers behind them (Chapter 3.2.1), and analyses the role of the MSR in reducing the surplus
of allowances built up in the EU ETS (Chapter 3.2.2). It also highlights major phase 3
developments in the fields of aviation (Chapter 4), free allocation (Chapter 3.1.2), the
auctioning of allowances, the resulting auction revenues and their utilisation (Chapter 3.1.3),
the EU ETS funding instruments (Chapters 3.1.4 to 3.1.8), market oversight (Chapter 5), and
the effectiveness of implementing the EU ETS in participating countries (Chapter 6). It
includes two new chapters: Chapter 7 describes the linking between the EU ETS and the
Swiss ETS and examines the effect the link had on the two carbon markets, while Chapter 8
examines the impact of implementing the Directive 2012/27/EU as amended by the Directive
(EU) 2018/200212 (Energy Efficiency Directive) and the 2019 national energy and climate
plans (NECPs) on the EU ETS.
Unless otherwise indicated, the data used for this report were data that were either publicly
available or available to the Commission by the end of June 2021. The report covers 2020
data for the United Kingdom (UK), to reflect the scope of the EU ETS until 31 December
2020. Technical and descriptive information on the EU ETS is provided in the appendices to
the staff working document accompanying this report.
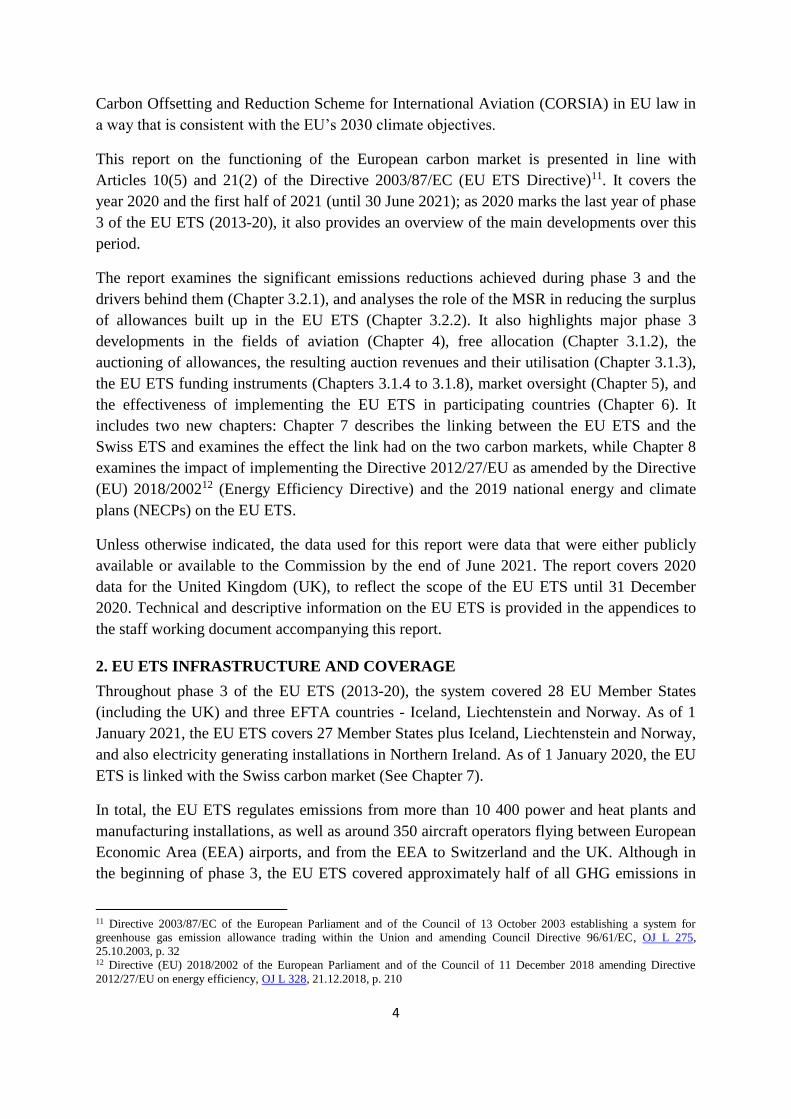
2. EU ETS INFRASTRUCTURE AND COVERAGE
Throughout phase 3 of the EU ETS (2013-20), the system covered 28 EU Member States
(including the UK) and three EFTA countries - Iceland, Liechtenstein and Norway. As of 1
January 2021, the EU ETS covers 27 Member States plus Iceland, Liechtenstein and Norway,
and also electricity generating installations in Northern Ireland. As of 1 January 2020, the EU
ETS is linked with the Swiss carbon market (See Chapter 7).
In total, the EU ETS regulates emissions from more than 10 400 power and heat plants and
manufacturing installations, as well as around 350 aircraft operators flying between European
Economic Area (EEA) airports, and from the EEA to Switzerland and the UK. Although in
the beginning of phase 3, the EU ETS covered approximately half of all GHG emissions in
11 Directive 2003/87/EC of the European Parliament and of the Council of 13 October 2003 establishing a system for
greenhouse gas emission allowance trading within the Union and amending Council Directive 96/61/EC, OJ L 275,
25.10.2003, p. 32 12 Directive (EU) 2018/2002 of the European Parliament and of the Council of 11 December 2018 amending Directive
2012/27/EU on energy efficiency, OJ L 328, 21.12.2018, p. 210

5
the EU, it currently covers around 36% of the EU's GHG emissions. A detailed overview of
the EU ETS coverage in phase 3 is available in Appendix 1 to the staff working document
accompanying this report.
2.1 EU Registry and the European Union Transaction Log
The EU Registry and the European Union Transaction Log (EUTL) track the ownership of
general and aviation allowances by recording the amounts owned in the accounts and the
transactions between accounts. These systems also register the emissions of stationary (power
and heat, and industry) installations and aircraft operators, and compliance with obligations
stemming from these emissions. Both systems are operated and maintained by the
Commission, whereas the national registry administrators in the participating countries
remain the point of contact for account holders and representatives (companies and
individuals). While the EU Registry holds the accounts and registers information on
compliance, and the EUTL automatically checks, records and authorises all transactions
between accounts, thus ensuring that all transfers comply with the EU ETS rules.
The data recorded in the EU Registry and the EUTL continues to be an important source of
information underpinning multiple types of the EU ETS reporting, such as the calculation of
the Market Stability Reserve (MSR) surplus indicator (See Chapter 3.2.2) and the reporting
carried out by the European Environment Agency. The EUTL also provides transparency in
the EU ETS by publishing information on the compliance of stationary installations and
aircraft operators with EU ETS provisions and on the transactions between accounts.
During phase 3, the public website of the EUTL functioned reliably, remaining operational
for 365 days around the clock each year, with only minor interruptions due to planned
technical upgrades. This was also the case in 2020. An exception was 18 August 2020, when,
due to technical issues, several transactions were not processed correctly. Due to
troubleshooting and repair work between 19 and 21 August, the EU Registry was
unavailable.
Several major development works were carried out on the EU Registry in 2020 and the first
half of 2021. First, the Trade and Cooperation Agreement13 between the EU and the UK was
applied provisionally as of 1 January 2021 and entered into force on 1 May 2021. In the
Agreement, the EU and the UK commit to upholding the level of ambition of their climate
and environmental policies as at the end of 2020, and to adapting these policies in line with
their international obligations. Article 392 of the Agreement provides that as of 1 January
2021, both parties shall have a system of carbon pricing in place, covering GHG emissions
from electricity and heat generation, industry and aviation. Northern Ireland electricity
generators and departing flights from the EEA to the UK remain covered by the EU ETS,
while flights from the UK to the EEA fall under the UK’s carbon pricing system (See Chapter
13 Trade and Cooperation Agreement between the European Union and the European Atomic Energy Community, of the one
part, and the United Kingdom of Great Britain and Northern Ireland, of the other part, OJ L 149, 30.4.2021, p. 10

6
4). Consequently, Northern Ireland electricity generators remained in the EU Registry, and
the EU ETS Directive was amended to accommodate changes in the flights’ coverage.14
The Doha Amendment establishing the second commitment period (CP2) of the Kyoto
Protocol (1 January 2013 - 31 December 2020) also entered into force15 on 31 December
2020. According to Article 5 of the Commission Regulation (EU) 389/2013 (Registry
Regulation)16, the Commission acts as the administrator of the EU's Kyoto Protocol Registry,
which is part of the EU Registry. Although 31 December 2020 was the last day of CP2, the
Kyoto Protocol transparency and compliance system will continue to operate until the final
compliance check. In 2023, the emissions inventories for the last year of CP2 will be
reported, reviewed and a final report submitted.
The agreement on linking the EU ETS with the Swiss ETS17 entered into force on 1 January
2020. To operationalise the link between the systems, a provisional solution to link registries
of the two systems and enable allowances to be transferred between them was put in place on
21 September 2020 (See Chapter 7).
Finally, technical implementation of the new rules brought by the Commission Delegated
Regulation (EU) 2019/112218 was successfully completed and the new functionalities became
available in the EU Registry as of 1 January 2021.
3. FUNCTIONING OF THE CARBON MARKET
3.1. Supply: allowances put in circulation
3.1.1. Cap
The cap is the maximum absolute quantity of GHG emissions that may be emitted by entities
covered by the EU ETS to ensure the ETS emissions reduction target is met, corresponding to
the number of allowances put into circulation over a trading period. A common EU-wide cap
applies for the entire EU ETS (for detailed information on the cap, see Appendix 2 to the staff
working document accompanying this report). During phase 3 of the EU ETS (2013-20), the
cap decreased every year by the linear reduction factor of 1.74%, ensuring that total
emissions fell (See Chapter 3.2.1). In phase 4 of the EU ETS (2021–30), the cap for both
stationary installations and aviation decreases annually by the linear reduction factor of 2.2%.
14 Commission Delegated Regulation (EU) 2021/1416 of 17 June 2021 amending Directive 2003/87/EC of the European
Parliament and of the Council as regards the exclusion of incoming flights from the United Kingdom from the Union
emissions trading system, OJ L 305, 31.8.2021, p. 1 15 Communication from the Commission concerning the entry into force of the Doha Amendment to the Kyoto Protocol to
the United Nations Framework Convention on Climate Change, OJ C 432, 14.12.2020, p.1 16 Commission Regulation (EU) No 389/2013 of 2 May 2013 establishing a Union Registry pursuant Directive 2003/87/EC
on the European Parliament and of the Council, Decisions No 280/3004/EC and No 406/2009/EC of the European
Parliament of the Council and repealing Commission Regulations (EU) No 920/2010 and No 1193/2011, OJ L 122,
3.5.2013, p. 190 17 Agreement between the European Union and the Swiss Confederation on the linking of their greenhouse gas emissions
trading systems, OJ L 322, 7.12.2017, p. 3 18 Commission Delegated Regulation (EU) 2019/1122 of 12 March 2019 supplementing Directive 2003/87/EC of the
European Parliament and of the Council as regards the functioning of the Union Registry, OJ L 177, 2.7.2019, p. 3

7
Table 1 shows the figures for the cap on emissions from stationary installations and the
number of aviation allowances put into circulation19 each year during phase 3.
Table 1. EU ETS cap in phase 3 of the EU ETS (2013-20)
Year Annual cap (stationary
installations)
Annual aviation allowances put into
circulation20
2013 2 084 301 856 32 455 296
2014 2 046 037 610 41 866 834
2015 2 007 773 364 50 669 024
2016 1 969 509 118 38 879 316
2017 1 931 244 873 38 711 651
2018 1 892 980 627 38 909 585
2019 1 854 716 381 38 830 950
2020 1 816 452 135 42 803 537
On 1 February 2020, the Agreement on the withdrawal of the United Kingdom from the
European Union21 entered into force. The EU ETS Directive applied to the UK until 31
December 2020, and pursuant to the Protocol of Ireland and Northern Ireland22, electricity
generation located in Northern Ireland remains in the EU ETS with the relevant rights and
obligations.
The Commission reacted to these changes by adopting the Decision on the adjusted EU-wide
quantity of allowances on 16 November 2020.23 Only emissions from electricity generation in
Northern Ireland were accounted for in the updated cap (applied from the base period 2008-
19 The number of aviation allowances put into circulation since 2013 is the result of a bottom-up approach starting from free
allocation (determined on the basis of activity-based benchmarks for operators' activity within the EEA). The number of
allowances auctioned is then derived based on the fact that free allocation (including a special reserve for distribution to fast-
growing aircraft operators and new entrants) should be 85% of the total volume. Auctioning represents the remaining 15%. 20 The updated figures include exchanges of international credits to EU ETS allowances in addition to the free allocation and
auctioned amounts. 21 Agreement on the withdrawal of the United Kingdom of Great Britain and Northern Ireland from the European Union and
the European Atomic Energy Community, OJ L 29, 31.1.2020, p. 7 22 OJ L 29 (as above) 23 Commission Decision C/2020/1722 of 16 November 2020 on the Union-wide quantity of allowances to be issued under
the EU Emmissions Trading System for 2021, OJ L 386, 16.11.2020, p. 26
8
2012), which calculated a reduction of the cap in proportion to the emissions from the UK
that were no longer accounted for.24
Figure 1 summarises the cap reduction following the increase of the linear reduction factor to
2.2% as of 2021. It also illustrates the role of the Market Stability Reserve (MSR) feed and
the backloading contributions to the MSR (See Chapter 3.2.2). The dashed bars in the figure
approximate the impact of the higher 2030 emissions reduction target as proposed by the
Commission in the revision package to deliver on the European Green Deal on 14 July 2021.
24 The cap for 2021 set out in the Commission Decision C/2020/1722 does not include the quantity of allowances to be
issued pursuant to Chapter II of the EU ETS Directive in respect of aircraft operators. This quantity is the result of a bottom-
up approach starting from free allocation to aviation, as explained in the Notice on the Union-wide quantity of allowances
for 2021 and the Market Stability Reserve under the EU Emissions Trading System, OJ C 428I, 11.12.2020, p. 1

9
Figure 1. Cap reduction applying the linear reduction factor of 2.2% as of 202125
25 The cap for phase 4 reflects the post-BREXIT publication of the EU ETS total volume of allowances in the Commission Decision (EU) 2020/1722.
Backloaded allowances (total 900 million)
Market Stability Reserve feed
Market Stability Reserve feed in/out depending on market surplus

10
3.1.2. Free allocation
Although since phase 3 auctioning accounts in principle for the distribution of 57% of the
total volume allowances, a significant volume of allowances is allocated for free to address
the risk of carbon leakage (when activites move to non-EU countries with less ambitious
climate policies on GHG emissions, which may lead to an overall increase in emissions).
Electricity production was not eligible for free allowances, and the free allocation to industry
was based on performance benchmarks to strengthen the incentives to reduce GHG emissions
and increase innovation.
At the start of phase 3, the New Entrants' Reserve (NER) was created in the EU ETS to
provide additional free allocations to new industrial installations and installations with a
significantly increasing capacity, equivalent to 5% of the total volume of allowances for this
period. The sectors and sub-sectors deemed to be exposed to a significant risk of carbon
leakage, and thereby awarded a higher share of free allocation, were placed on a carbon
leakage list.26 As demand for free allocation exceeded the supply available, the allocation was
reduced for all installations by the same percentage by applying the cross-sectoral correction
factor27, which was revised28 in 2017. The values of the cross-sectoral correction factor are
presented in Table 3.1 of Appendix 3 to the accompanying staff working document.
The initial Reserve held 480.2 million allowances, after deducting 300 million allowances for
the NER 300 programme supporting innovation (See Chapter 3.1.5). As at June 2021, 178.3
million allowances were reserved for 1 392 installations for the entirety of phase 3.
Therefore, 301.9 million allowances remain in the Reserve. Of this amount, 200 million
allowances will be placed in the Reserve for phase 4 and the rest will be placed in the MSR.
As at June 2021, the originally approved volume of free allocation for phase 3 has been
reduced by around 585 million out of 6.5 billion allowances, due to installations closing
down or reducing their production or production capacity. Table 2 summarises free
allocations to industry in phase 3.
26 Commission Decision of 27 October 2014 determining, pursuant to Directive 2003/87/EC of the European Parliament and
of the Council, a list of sectors and subsectors which are deemed to be exposed to a significant risk of carbon leakage, for the
period 2015 to 2019, OJ L 308, 29.10.2014, p. 114 27 Commission Decision 2013/448/EU of 5 September 2013 concerning national implementation measures for the
transitional free allocation of greenhouse gas emission allowances in accordance with Article 11(3) of Directive 2003/87/EC
of the European Parliament and of the Council, OJ L 240, 7.9.2013, p. 27 28 Commission Decision 2017/126/EU of 24 January 2017 amending Decision 2013/448/EU as regards the establishment of
a uniform cross-sectoral correction factor in accordance with Article 10a of Directive 2003/87/EC of the European
Parliament and of the Council, OJ L 19, 25.1.2017, p. 93
11
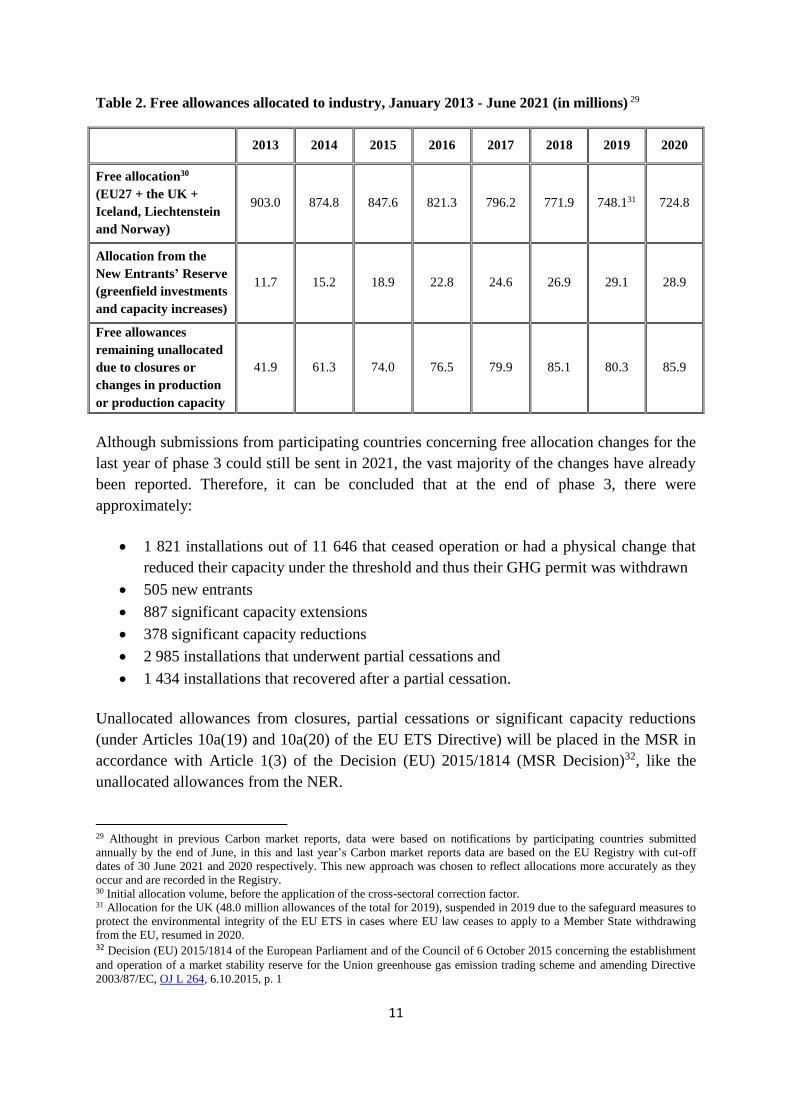
Table 2. Free allowances allocated to industry, January 2013 - June 2021 (in millions) 29
2013 2014 2015 2016 2017 2018 2019 2020
Free allocation30
(EU27 + the UK +
Iceland, Liechtenstein
and Norway)
903.0 874.8 847.6 821.3 796.2 771.9 748.131 724.8
Allocation from the
New Entrants’ Reserve
(greenfield investments
and capacity increases)
11.7 15.2 18.9 22.8 24.6 26.9 29.1 28.9
Free allowances
remaining unallocated
due to closures or
changes in production
or production capacity
41.9 61.3 74.0 76.5 79.9 85.1 80.3 85.9
Although submissions from participating countries concerning free allocation changes for the
last year of phase 3 could still be sent in 2021, the vast majority of the changes have already
been reported. Therefore, it can be concluded that at the end of phase 3, there were
approximately:
1 821 installations out of 11 646 that ceased operation or had a physical change that
reduced their capacity under the threshold and thus their GHG permit was withdrawn
505 new entrants
887 significant capacity extensions
378 significant capacity reductions
2 985 installations that underwent partial cessations and
1 434 installations that recovered after a partial cessation.
Unallocated allowances from closures, partial cessations or significant capacity reductions
(under Articles 10a(19) and 10a(20) of the EU ETS Directive) will be placed in the MSR in
accordance with Article 1(3) of the Decision (EU) 2015/1814 (MSR Decision)32, like the
unallocated allowances from the NER.
29 Althought in previous Carbon market reports, data were based on notifications by participating countries submitted
annually by the end of June, in this and last year’s Carbon market reports data are based on the EU Registry with cut-off
dates of 30 June 2021 and 2020 respectively. This new approach was chosen to reflect allocations more accurately as they
occur and are recorded in the Registry. 30 Initial allocation volume, before the application of the cross-sectoral correction factor. 31 Allocation for the UK (48.0 million allowances of the total for 2019), suspended in 2019 due to the safeguard measures to
protect the environmental integrity of the EU ETS in cases where EU law ceases to apply to a Member State withdrawing
from the EU, resumed in 2020. 32 Decision (EU) 2015/1814 of the European Parliament and of the Council of 6 October 2015 concerning the establishment
and operation of a market stability reserve for the Union greenhouse gas emission trading scheme and amending Directive
2003/87/EC, OJ L 264, 6.10.2015, p. 1

12
To prevent the risk of carbon leakage, free allocation continues in phase 4, based on updated
benchmark values derived from the performance of the 10% most efficient installations in the
EU. After the political agreement reached on the revised EU ETS Directive in November
2017, the Commission adopted legislation for the implementation of free allocation to
industry in phase 4. The adopted legal acts are listed in Table 4.1 of Appendix 4 to the
accompanying staff working document.
3.1.3. Auctioning of allowances
As of phase 3, auctioning is the primary method of distributing allowances in the EU ETS,
accounting for 57% of the total volume. The auctioning is governed by the Commission
Regulation (EU) 1031/201033 (Auctioning Regulation), which specifies the timing,
administration and other aspects of how auctions should take place to ensure an open,
transparent, harmonised and non-discriminatory process.
In phase 3, auctions took place through the following auction platforms:
European Energy Exchange AG (EEX), auctioning as the common auction platform
for 25 Member States participating in a joint procurement procedure. It also auctions
for Poland (which opted-out from the joint procurement procedure but has not yet
appointed its own auction platform), and, since June 2019, for Iceland, Liechtenstein
and Norway (after the EEA Agreement was amended to allow Iceland, Liechtenstein
and Norway to participate in the Joint Procurement Agreement for the common
auction platform)
EEX, auctioning for Germany as the 'opt-out' auction platform
ICE Futures Europe (ICE), auctioning for the UK as the 'opt-out' auction platform
until the end of 2020.
The EEX was reappointed as the common auction platform as from 2021, without major
changes to the participation in auctions.
Over 1 800 auctions were held in phase 3, and by 30 June 2021, this figure was well over 1
900. Table 3 provides an overview of the volumes of allowances34 auctioned by the EEX and
ICE platforms up to 30 June 2021, including early auctions35 of general allowances.
33 Commission Regulation (EU) No 1031/2010 of 12 November 2010 on the timing, administration and other aspects of
auctioning of greenhouse gas emission allowances pursuant to Directive 2003/87/EC of the European Parliament and of the
Council establishing a scheme for greenhouse gas emission allowances trading within the Community, OJ L 302,
18.11.2010, p.1 34 The volumes of general allowances have been determined taking into account Decision 1359/2013/EU. The volumes of
aviation allowances have been determined taking into account Decision No 377/2013/EU and Regulation (EU) No 421/2014. 35 Early auctions of allowances in phase 3 were performed in 2012 in view of the widespread commercial practice in the
electricity sector of selling electricity on a forward basis and purchasing the required inputs (including allowances) when
they sell their output.

13
Table 3. Total auctioned volumes of phase 3 allowances, January 2012 - 30 June 202136
Year General allowances Aviation allowances
2012 89 701 500 2 500 000
2013 808 146 500 0
2014 528 399 500 9 278 000
2015 632 725 500 16 390 500
2016 715 289 500 5 997 500
2017 951 195 500 4 730 500
2018 915 750 000 5 601 500
2019 588 540 000 5 502 500
2020 778 505 000 7 505 000
2021 (until 30 June 2021) 308 326 000 1 343 000
Source: EEX
When the MSR became operational in January 2019, it has substantially lowered the supply
of allowances available for auction. Generally, the auctions were conducted smoothly and the
auction clearing prices were closely aligned with secondary market prices.
In phase 3, a total of 15 auctions out of over 1 800 were cancelled either because the reserve
price was not met or because the total bid volume fell short of the auctioned volume, in line
with the rules of the Auctioning Regulation. Figure 2 gives an overview of the auction
clearing prices in the EU carbon market since 2013.
36 The table includes auction volumes for EU27 + the UK + Iceland, Liechtenstein and Norway (except for 2021, which does
not include data on the UK).
14
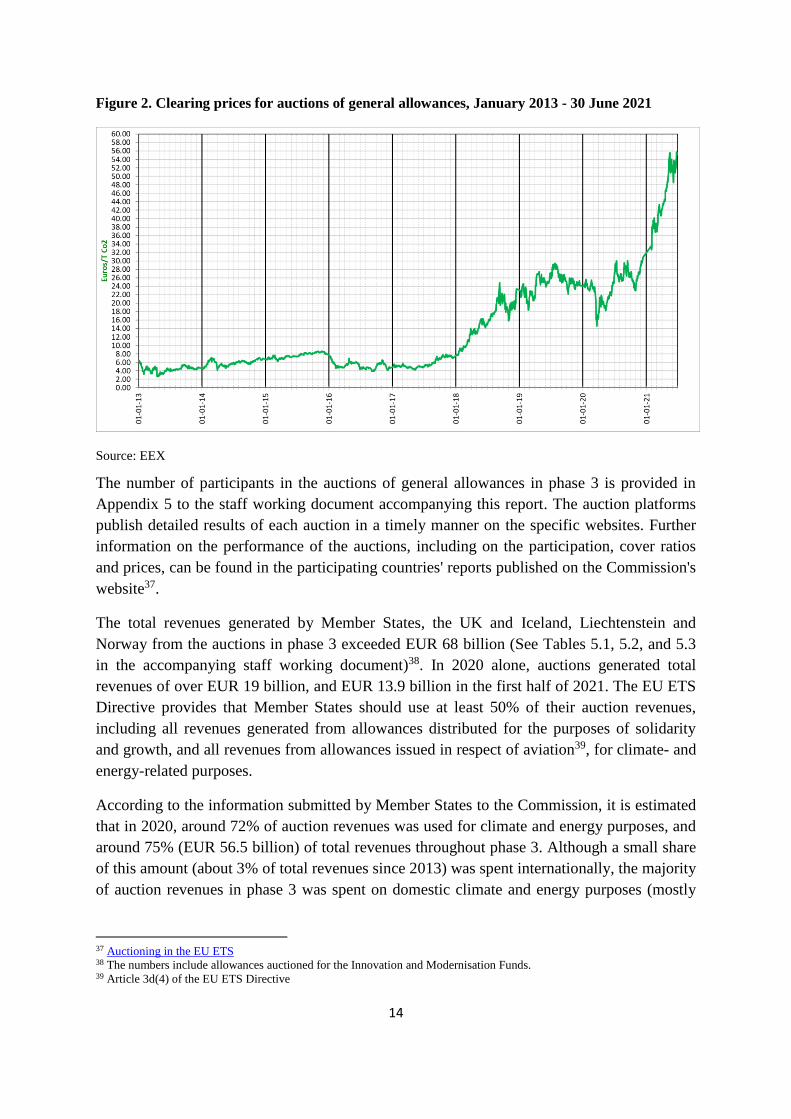
Figure 2. Clearing prices for auctions of general allowances, January 2013 - 30 June 2021
Source: EEX
The number of participants in the auctions of general allowances in phase 3 is provided in
Appendix 5 to the staff working document accompanying this report. The auction platforms
publish detailed results of each auction in a timely manner on the specific websites. Further
information on the performance of the auctions, including on the participation, cover ratios
and prices, can be found in the participating countries' reports published on the Commission's
website37.
The total revenues generated by Member States, the UK and Iceland, Liechtenstein and
Norway from the auctions in phase 3 exceeded EUR 68 billion (See Tables 5.1, 5.2, and 5.3
in the accompanying staff working document)38. In 2020 alone, auctions generated total
revenues of over EUR 19 billion, and EUR 13.9 billion in the first half of 2021. The EU ETS
Directive provides that Member States should use at least 50% of their auction revenues,
including all revenues generated from allowances distributed for the purposes of solidarity
and growth, and all revenues from allowances issued in respect of aviation39, for climate- and
energy-related purposes.
According to the information submitted by Member States to the Commission, it is estimated
that in 2020, around 72% of auction revenues was used for climate and energy purposes, and
around 75% (EUR 56.5 billion) of total revenues throughout phase 3. Although a small share
of this amount (about 3% of total revenues since 2013) was spent internationally, the majority
of auction revenues in phase 3 was spent on domestic climate and energy purposes (mostly
37 Auctioning in the EU ETS 38 The numbers include allowances auctioned for the Innovation and Modernisation Funds. 39 Article 3d(4) of the EU ETS Directive
15
on renewable energy, energy efficiency, and research and development). In practice, Member
States spend more on climate- and energy-related purposes than their auctioning revenues.40
3.1.4. Derogation from full auctioning for electricity and heat production
In phase 3, Article 10c of the EU ETS Directive derogated from the general rule to auction
allowances in order to support investments in modernising the electricity sector in several
lower income Member States.41 The free allowances under Article 10c were deducted from
the quantity that the Member State would otherwise auction. As the free allocation of
allowances to electricity generators under Article 10c involved State aid, the national
schemes set up to implement the Article 10c derogation were cleared under State aid rules
and were subject to the requirements of the State aid Guidelines.42
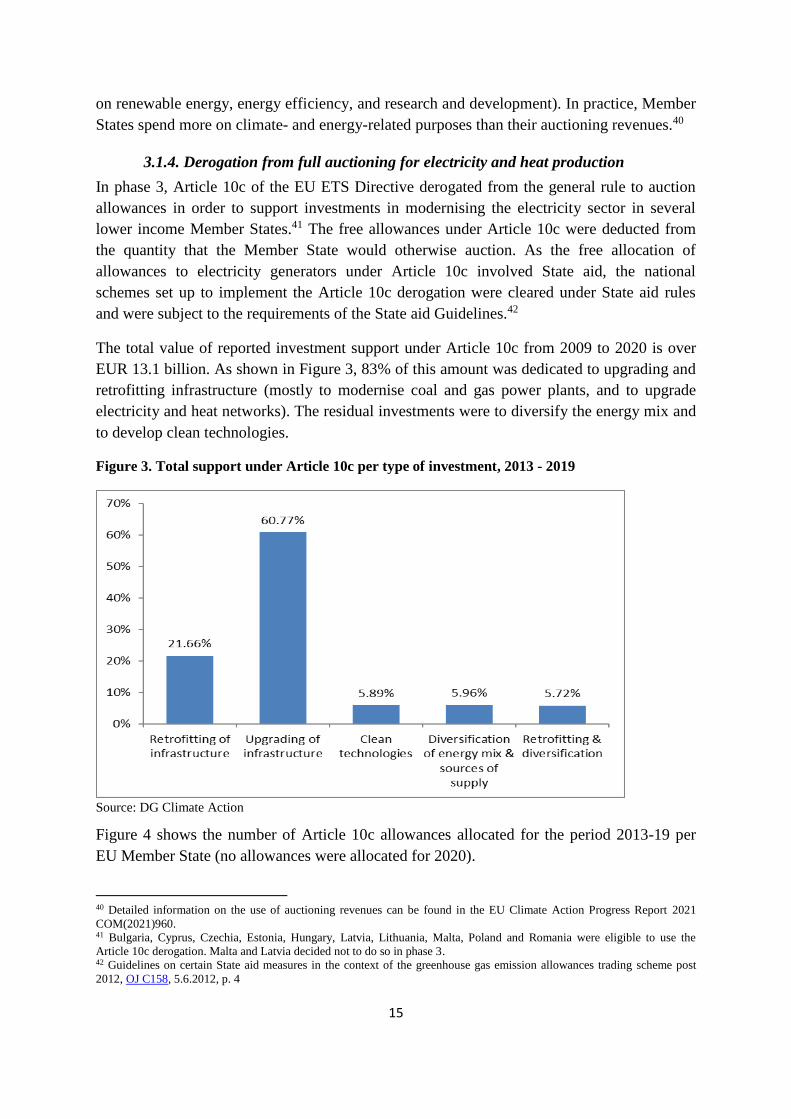
The total value of reported investment support under Article 10c from 2009 to 2020 is over
EUR 13.1 billion. As shown in Figure 3, 83% of this amount was dedicated to upgrading and
retrofitting infrastructure (mostly to modernise coal and gas power plants, and to upgrade
electricity and heat networks). The residual investments were to diversify the energy mix and
to develop clean technologies.
Figure 3. Total support under Article 10c per type of investment, 2013 - 2019
Source: DG Climate Action
Figure 4 shows the number of Article 10c allowances allocated for the period 2013-19 per
EU Member State (no allowances were allocated for 2020).
40 Detailed information on the use of auctioning revenues can be found in the EU Climate Action Progress Report 2021
COM(2021)960. 41 Bulgaria, Cyprus, Czechia, Estonia, Hungary, Latvia, Lithuania, Malta, Poland and Romania were eligible to use the
Article 10c derogation. Malta and Latvia decided not to do so in phase 3. 42 Guidelines on certain State aid measures in the context of the greenhouse gas emission allowances trading scheme post
2012, OJ C158, 5.6.2012, p. 4
16
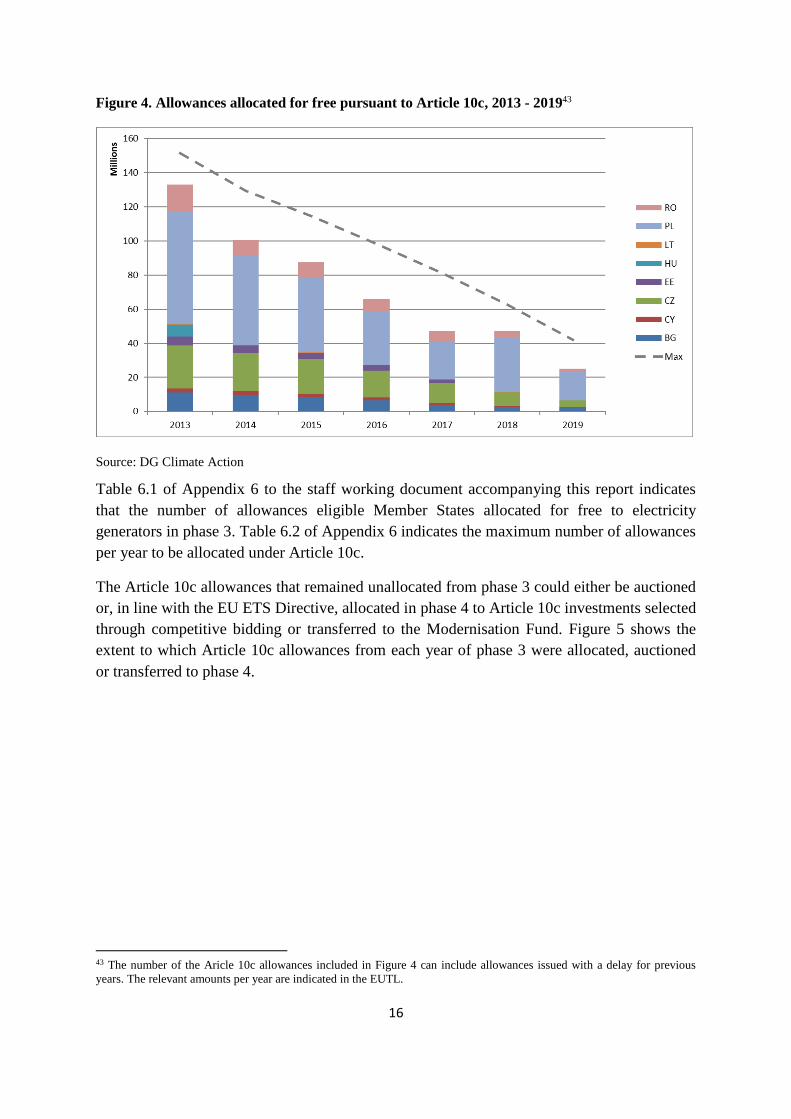
Figure 4. Allowances allocated for free pursuant to Article 10c, 2013 - 201943
Source: DG Climate Action
Table 6.1 of Appendix 6 to the staff working document accompanying this report indicates
that the number of allowances eligible Member States allocated for free to electricity
generators in phase 3. Table 6.2 of Appendix 6 indicates the maximum number of allowances
per year to be allocated under Article 10c.
The Article 10c allowances that remained unallocated from phase 3 could either be auctioned
or, in line with the EU ETS Directive, allocated in phase 4 to Article 10c investments selected
through competitive bidding or transferred to the Modernisation Fund. Figure 5 shows the
extent to which Article 10c allowances from each year of phase 3 were allocated, auctioned
or transferred to phase 4.
43 The number of the Aricle 10c allowances included in Figure 4 can include allowances issued with a delay for previous
years. The relevant amounts per year are indicated in the EUTL.

17
Figure 5. Distribution of the residual Article 10c allowances (allocated, auctioned, transferred to
phase 4) 44
Source: DG Climate Action
Overall, around 74% of available Article 10c allowances were allocated between 2013 and
2019. Most of the remaining allowances were auctioned, with only a small amount (about
0.5%) transferred to phase 4. The number of unallocated allowances auctioned (or planned
for auction) by Member State under the Article 10c derogation in phase 3 is indicated in
Table 6.3 of Appendix 6 to the accompanying staff working document.
Transitional free allocation under Article 10c of the EU ETS Directive continues to be
available in phase 4, but with stronger provisions on transparency and with the option for
eligible Member States to use all or part of their Article 10c allocation to support investments
within the framework of the Modernisation Fund. Bulgaria, Romania and Hungary opted to
continue to use Article 10c in phase 445, and are in the process of drawing up national
frameworks to implement this provision. These need to be cleared by the Commission under
State aid rules46. Other eligible Member States47 chose to either auction their phase 4
44 Figure 5 includes volumes to auction, up to and including the 2021 auctioning calendar. The allowances transferred from
2013 to phase 4 (912 630) were originally meant to be allocated to five Hungarian installations, which in 2014 were
determinded ineligible to receive the allocation. On 27 September 2019, pursuant to Articles 10c(5) and 10d(4) of the
revised EU ETS Directive, Hungary informed the Commission of its intention to use all 912 630 Article 10c allowances,
which had not been allocated by 2020, for implementing the Article 10c derogation in phase 4. 45 In line with Article 10c(2), any Member State intending to make use of optional transitional free allocation for the
modernisation of the energy sector in phase 4 had to publish, by 30 June 2019, a detailed national framework and/or a list of
small projects to be supported. Only Bulgaria, Hungary and Romania did so. In line with Article 10c(5), Member States
could decide by 30 September 2019 to use unallocated free allocation from phase 3 for the optional transitional free
allocation in phase 4 or to auction these allowances (see Table 6.3 of Appendix 6 to the accompanying staff working
document). 46 Guidelines on certain State aid measures in the context of the system for greenhouse gas emission allowance trading post
2021, OJ C 317, 25.9.2020, p. 5 47 In phase 4, Bulgaria, Croatia, Czechia, Estonia, Hungary, Latvia, Lithuania, Poland, Slovakia and Romania are eligible to
use the Article 10c derogation.
18
allowances or transfer them to the Modernisation Fund. The number of phase 4 allowances to
be used under the Article 10c derogation, transferred to the Modernisation Fund, or auctioned
is included in Table 6.4 of Appendix 6 to the staff working document accompanying this
report.
3.1.5 NER 300 programme
In phase 3, the NER 300 was a large-scale funding programme for innovative low-carbon
energy demonstration projects. The aim was to demonstrate environmentally safe carbon
capture and storage and innovative renewable energy technologies on a commercial scale in
the EU. The NER 300 was funded from the monetisation of 300 million allowances from the
New Entrants’ Rerserve (NER). Funding was awarded to projects selected following two
rounds of call for proposals in December 2012 and July 2014.
In total, 38 renewable energy projects and one carbon capture and storage project in 20
Member States were awarded support from the NER 300, amounting to EUR 2.1 billion. By
30 June 2021, eight projects had become operational: the bioenergy project Verbiostraw in
Germany, the onshore wind project Windpark Handalm in Austria, offshore wind projects
Veja Mate and Nordsee One in Germany, the smart grid project Puglia Active Network in
Italy, floating offshore wind projects Vertimed in France and Windfloat in Portugal, as well
as the concentrated solar power project Minos in Greece. Two projects, the Italian bioenergy
BEST and Swedish onshore wind project Windpark Blaiken, are considered completed48.
A further four projects selected following the second call for proposals are advancing in their
preparations. However, due to the COVID-19 pandemic, their launch dates were amended49.
Given the difficulties to co-finance under the NER300 requirements together with a
challenging economic and policy context, 23 projects were unable to raise sufficient
additional funding and were withdrawn from the programme, releasing a total of almost
EUR 1.5 billion.
In 2017, the amended NER 300 Decision50 authorised the re-investment of the funds released
from the projects cancelled under the first call for proposals (EUR 708.7 million) to projects
supported under the existing financial instruments - the InnovFin Energy Demonstration
Projects and the Connecting Europe Facility Debt Instrument, both managed by the
European Investment Bank. These projects and their related pipelines are successfully
demonstrating that the blending mechanism put in place is working efficiently. The full
allocation of NER 300 undisbursed funds is expected by the end of 2022.
48 Operational projects have entered into operation and are being implemented, while completed projects have finished
operation. 49 Commission Implementing Decision C(2021)1712 amending Implementing Decisions C(2012)9432 and C(2014)4493 as
regards certain projects under the NER 300 funding programme, in particular those affected by the COVID-19 pandemic 50 Commission Decision (EU) 2017/2172 of 20 November 2017 amending Decision 2010/670/EU as regards the deployment
of non-disbursed revenues from the first round of calls for proposals, OJ L 306, 22.11.2017, p. 24
19
The remaining unspent funds from the second round of calls for proposals will be channelled
to the Innovation Fund. So far, EUR 746.6 million has been transferred to the Innovation
Fund.
Appendix 7 to the accompanying staff working document contains more information on the
NER300.
3.1.6. Innovation Fund
The Innovation Fund under the EU ETS pools at least EUR 20 billion51 for the period 2020-
30, from the auctioning of 450 million allowances. This makes it one of the largest
programmes in the world that aims to finance the commercial demonstration of innovative
low-carbon technologies and industrial solutions to decarbonise Europe’s energy-intensive
industries, innovative renewables, energy storage, and carbon capture use and storage.
The Commission, together with the European Climate, Infrastructure and Environment
Executive Agency, launched the first calls for proposals under the Innovation Fund in 2020.
The calls attracted significant interest from companies of all sizes looking for funding for
their innovative clean technology projects, across a variety of sectors and in all Member
States, plus Iceland and Norway. Under the call for large-scale projects52, the best-ranked 70
projects (out of 311 applications) were invited to submit a full proposal for the second stage
by 23 June 2021. 66 full proposals were received, requesting about EUR 6 billion of support,
against the total available funding under this call of EUR 1 billion. The results of the
evaluation will be available in the fourth quarter of 2021.
The call for small-scale projects53 closed on 10 March 2021 with 232 submissions received.
32 small-scale projects were selected for funding and invited to the grant preparation phase in
July 2021, for a total volume of EUR 118 million. Successful projects are located in 12
Member States plus Iceland and Norway, and will reduce GHG emissions in both energy and
industry sectors.
15 large-scale projects were selected for Project Development Assistance under the
Innovation Fund for a total amount of EUR 4 million.
3.1.7. Modernisation Fund
The Modernisation Fund is the key funding instrument under the EU ETS set up with a view
to supporting decarbonisation in central and eastern Member States54. It pools an approximate
of EUR 25 billion55, from the auctioning of over 643 million allowances56 in phase 4.
51 The amount depends on the carbon price; the carbon price used here is EUR 40. In the package to deliver on the European
Green Deal, the Commission proposes to increase substantially the volume of the Innovation Fund. 52 Innovation Fund: call for large-scale projects 53 Innovation Fund: call for small-scale projects 54 The beneficiary Member States are Bulgaria, Croatia, Czechia, Estonia, Hungary, Latvia, Lithuania, Poland, Romania and
Slovakia. 55 The amount depends on the carbon price; the carbon price used here is EUR 40. In the package to deliver on the European
Green Deal, the Commission proposes to increase the volume of the Modernisation Fund by an additional 2.5% of the cap.
20
The Modernisation Fund became operational in January 2021. In the first bi-annual
dibursement cycle, six multiannual schemes were confirmed in Hungary, Poland and Czechia
for a total volume of EUR 304 million. The schemes include investments in renewable
energy, energy efficiency, smart grids, and developing power grids and energy communities.
Table 7.3 of Appendix 7 to the accompanying staff working document shows the total
number of allowances per beneficiary Member State in phase 4.
3.1.8. Compensation of indirect carbon costs
In addition to free allocation covering direct emissions, Member States can grant State aid to
compensate some electro-intensive industries for carbon costs arising from indirect
emissions, i.e. from higher electricity prices due to power generators passing on the costs of
buying allowances to consumers. To ensure a harmonised application of indirect carbon cost
compensation between Member States and to minimise competition distortions in the internal
market, the Commission adopted the EU ETS State aid Guidelines. The first edition of these
Guidelines applied to the indirect costs incurred from 2013 to 202057. It was subsequently
revised to cover the period 2021-3058.
This report details Member States’ expenditure in 2020 for indirect costs incurred in 2019,
under the first edition of the Guidelines. Data on the compensation for indirect costs incurred
in 2020 is not available yet. Member States that choose to start or continue compensating for
indirect costs incurred in 2021 and beyond, under the revised Guidelines, must notify their
schemes to the Commission.
A growing number of Member States have started compensating for indirect costs. To date,
the Commission has approved 16 schemes in 15 Member States. In 2020, Poland and
Romania have started compensating indirect costs for the first time. The Commission
approved a new Czech scheme59 in November 2020 and a new Italian scheme60 in July 2021.
Both Czechia and Italy will start compensating indirect costs in 2021 (for costs incurred in
2020).
The EU ETS Directive specifies that within three months of the end of each year, Member
States that have an indirect cost compensation scheme in place should make available to the
public, in an easily accessible form, the total amount of compensation provided and a
breakdown per recipient sector and subsector. Table 4 below presents a summary of the data
published by the Member States for compensation paid out in 2020 for indirect costs incurred
in 2019. These are compared to the auction revenues in 2019.
56 This volume includes transfers made to the Modernisation Fund by Member States from the pools of allowances under
Articles 10(2b) and 10c of the EU ETS Directive. The intial volume of the Modernisation Fund amounts to nearly 276
million allowances (See Table 7.3 of Appendix 7 to the accompanying staff working document). 57 Guidelines on certain State aid measures in the context of the greenhouse gas emission allowances trading scheme post
2012, OJ C158, 5.6.2012, p. 4 58 Guidelines on certain State aid measures in the context of the system for greenhouse gas emission allowance trading post
2021, OJ C 317, 25.9.2020, p. 5 59 SA.58608 60 SA.60787

21
Table 4. Indirect carbon cost compensation paid out by EU Member States and the UK in 202061
Member
State
Compensation disbursed in
2020 for indirect costs
incurred in 2019 (in million
euros)
Number of
beneficiaries
(installations)
Auction revenues
in 2019 (excl.
aviation
allowances, in
million euros)
Percentage of auction
revenues spent on
indirect cost
compensation
DE 546 902 3146.1 17.4%
BE (FL) 89.4 108 353.5 30.9%
BE (WL) 20 31
NL 110.1 93 435.6 25.3%
EL 42.2 48 503.3 8.3%
LT 0.66 1 83.7 0.7%
SK 4 10 244.4 4.1%
FR 266.4 302 711.6 37.4%
FI 74.6 61 217.4 34.3%
ES 61 204 1225.2 5.0%
LU 10.6 4 16.8 63.0%
PL 76.6 (340.9 PLN) 25 2545.9 3%
RO N.A. 44 747.9 N.A.
UK 57.25 (50.9 GBP) 61 N.A. N.A.
The total indirect cost compensation paid out by 13 Member States in 2020 for costs incurred
in 2019 amounted to at least EUR 1.358 million - more than double the amount paid out in
2019 (for costs incurred in 2018). This sizable increase was primarily related to the increase
in carbon prices. The majority of schemes do not have a fixed budget but compensate based
on actual indirect costs incurred. Moreover, the formula to calculate compensation laid down
in the State aid Guidelines specifies that Member States must use the average allowance
forward price of year t-1 when calculating disbursed compensation. This means that forward
prices from 2018 are used to calculate the compensation for indirect costs incurred in 2019.
Between 2018 and 2019, the carbon price used as basis for the compensation rose from
around EUR 6 to around EUR 16.
One of the transparency provisions in the EU ETS Directive specifies that Member States
spending more than 25% of their auction revenues on indirect cost compensation in any year
must publish a report setting out the reasons why this amount was exceeded. In 2020, at least
five Member States exceeded the 25% limit, while in 2019 no Member State had done so.
Moreover, the average share of total compensation compared to total auction revenues
increased significantly: up to 13.7% in 2020 against 7.9% in 2019.
61 The Commission did not receive full data on indirect cost compensation for Romania. As for the UK, no auction revenues
are included since no allowances were auctioned in 2019 on behalf of the UK in accordance with the safeguard measures
adopted to protect the environmental integrity of the EU ETS in cases where EU law ceases to apply to a Member State
withdrawing from the EU.
22
As carbon prices rise, both auction revenues and indirect cost compensation increase;
therefore, the relative share should remain similar. In 2019, however, higher carbon prices
did not translate into higher auction revenues, because it was the first year that the MSR
reduced the volume of auctioned allowances. Some 30% fewer allowances were auctioned in
2019 than in 2018. When comparing indirect costs incurred in 2019 and 2018 (compensation
paid out in 2020 and 2019 respectively), it is thus important to take into account the fact that
future carbon prices are used to determine compensation amounts. Since the average t-1 price
rose stronger than the auction revenues, the relative share of compensation compared to
auction revenues increased as well.
The reduction of auction revenues is the main reason quoted by Member States to explain the
higher share of auction revenues spent on indirect carbon cost compensation in 2020.
Comparing the auction revenues of the 10 Member States that granted compensation in both
2019 and 2020 (for the costs incurred in 2018 and 2019 respectively) shows that the revenues
decreased by around 4.2% due to the MSR reducing auction volumes. Another reason is that
some Member States have a relatively high share of electro-intensive industries, and hence a
relatively high amount of indirect cost compensation. As these industries are not direct
emitters of CO2, they do not play a role in the division of auction revenues between Member
States, which is based on historical emissions. Last, Member States with historically low
emissions due to a relatively low-carbon energy mix have a tendency to show relatively
elevated shares of auction revenues used for indirect cost compensation.
It can therefore be concluded that the higher compensation amounts in 2020 are linked to
increasing carbon prices. The fact that compensation shares increased can be explained by the
use of the forward carbon price to determine compensation and by auction revenues
decreasing due to the MSR reducing auction volumes.
3.1.9. International credits
In phase 3, participants in the EU ETS could use international credits from the Kyoto
Protocol's Clean Development Mechanism and Joint Implementation towards fulfilling part
of their EU ETS obligation. These credits are financial instruments that should represent a
tonne of CO2 removed or reduced from the atmosphere as a result of an emissions reduction
project. Participants could use international credits until the end of the 2020 compliance
cycle62, subject to qualitative and quantitative standards. Credits were not surrendered
directly, but exchanged for EU ETS allowances.
At the start of phase 3, market analysts estimated that the quantity of international credit
entitlements used over phases 2 and 3 (2008-2020) would amount to approximately 1.6
billion credits. As of 1 May 202163, the total number of international credits used or
exchanged amounted to around 1.57 billion, almost 98% of the estimated maximum. The
62 Clean Development Mechanism and Joint Implementation projects generate Kyoto carbon credits: Certified Emission
Reductions and Emission Reduction Units respectively. 63 The exchange of international credits was possible until the end of April 2021, i.e. the end of the 2020 compliance cycle.
23
total number of international credits exchanged throughout phase 3 only amounted to
approximately 506 million.
For a full overview of the international credits surrenders and exchange, see Tables 8.1, 8.2
and 8.3 of Appendix 8 to the staff working document accompanying this report.
In line with the EU ETS Directive, international credits may no longer be used for EU ETS
compliance as of the 2021 compliance cycle. This ensures that emissions are reduced
domestically, safeguarding the environmental integrity of the system and that over-supply is
curbed preserving its cost-efficiency.
3.2. Demand: allowances taken out of circulation
3.2.1. Emissions reductions
Since the start of phase 3 in 2013, emissions from stationary installations covered by the EU
ETS (power plants and manufacturing installations) fell by almost 29% contributing to the
overall decrease of around 43% since the system was set up in 2005.
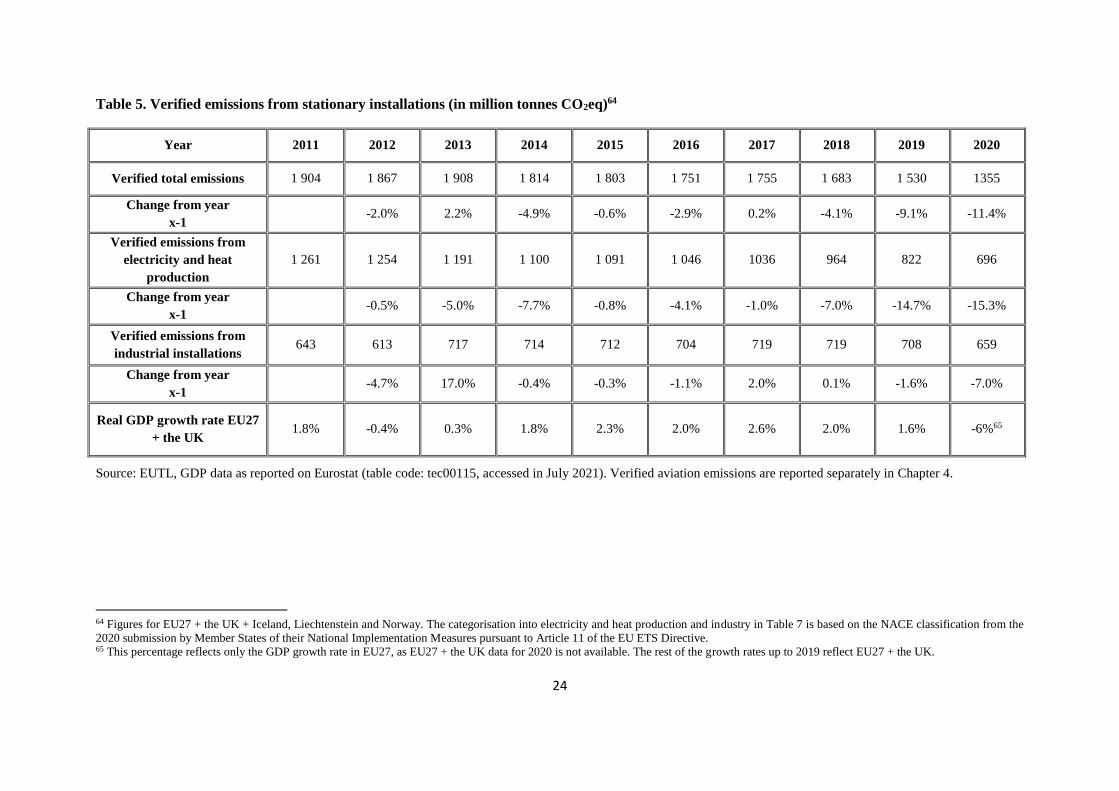
In 2020, verified emissions from stationary installations amounted to 1.355 million tonnes of
CO2eq, a decrease of 11.4% compared to 2019, based on the information recorded in the EU
Registry. As demonstrated in Table 5, the decrease in emissions was driven mostly by
electricity and heat production, where emissions fell by over 15% compared to 2019,
reflecting both reduced electricity consumption due to the COVID-19 pandemic and the
previously observed decarbonisation trends. These include both a switch from coal to natural
gas-fired power generation, and a replacement of fossil fuels by renewable energy sources.
Emissions from industrial installations decreased by 7%, which was the largest single
decrease since the beginning of phase 3, and GDP in EU27 decreased by 6% due to
pandemic.
24
Table 5. Verified emissions from stationary installations (in million tonnes CO2eq)64
Year 2011 2012 2013 2014 2015 2016 2017 2018 2019 2020
Verified total emissions 1 904 1 867 1 908 1 814 1 803 1 751 1 755 1 683 1 530 1355
Change from year
x-1 -2.0% 2.2% -4.9% -0.6% -2.9% 0.2% -4.1% -9.1% -11.4%
Verified emissions from
electricity and heat
production
1 261 1 254 1 191 1 100 1 091 1 046 1036 964 822 696
Change from year
x-1 -0.5% -5.0% -7.7% -0.8% -4.1% -1.0% -7.0% -14.7% -15.3%
Verified emissions from
industrial installations 643 613 717 714 712 704 719 719 708 659
Change from year
x-1 -4.7% 17.0% -0.4% -0.3% -1.1% 2.0% 0.1% -1.6% -7.0%
Real GDP growth rate EU27
+ the UK 1.8% -0.4% 0.3% 1.8% 2.3% 2.0% 2.6% 2.0% 1.6% -6%65
Source: EUTL, GDP data as reported on Eurostat (table code: tec00115, accessed in July 2021). Verified aviation emissions are reported separately in Chapter 4.
64 Figures for EU27 + the UK + Iceland, Liechtenstein and Norway. The categorisation into electricity and heat production and industry in Table 7 is based on the NACE classification from the
2020 submission by Member States of their National Implementation Measures pursuant to Article 11 of the EU ETS Directive. 65 This percentage reflects only the GDP growth rate in EU27, as EU27 + the UK data for 2020 is not available. The rest of the growth rates up to 2019 reflect EU27 + the UK.
25
Lower emissions in 2020, also reflecting the effect of COVID-19 pandemic, lowered the
demand for allowances, which had an impact on the overall surplus of allowances in the EU
carbon market, leading to a slight increase in comparison to 2019 (See Chapter 3.2.2).
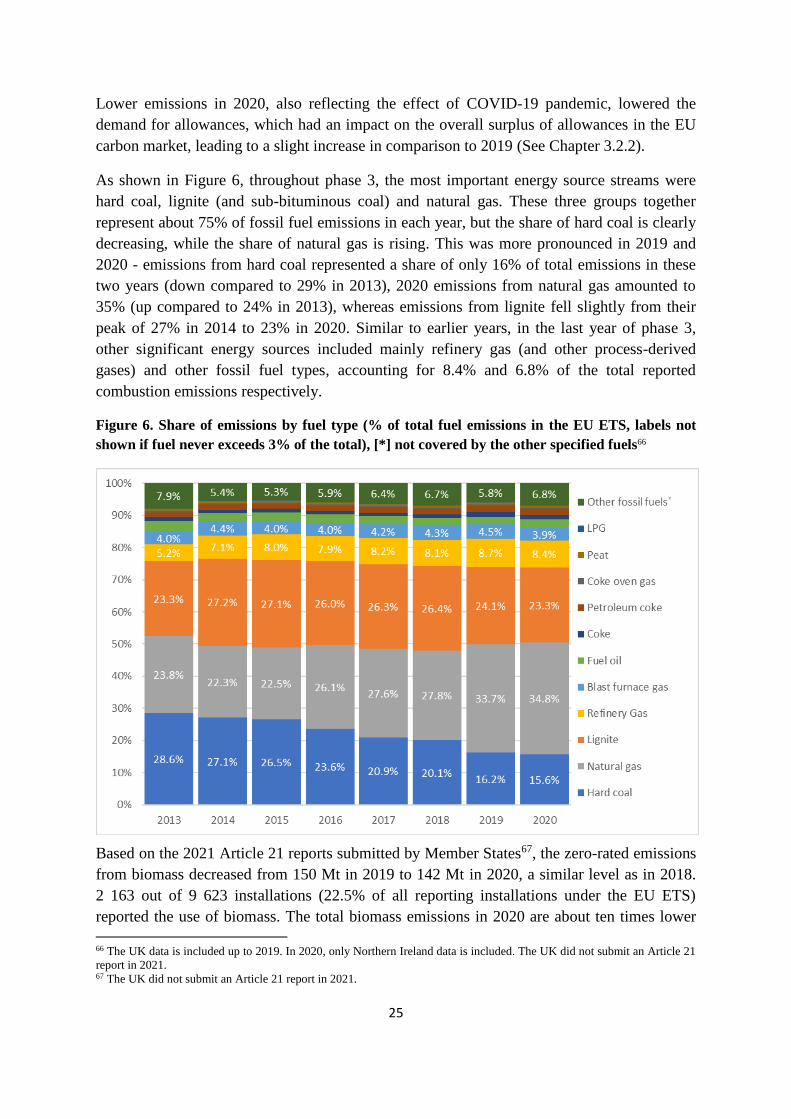
As shown in Figure 6, throughout phase 3, the most important energy source streams were
hard coal, lignite (and sub-bituminous coal) and natural gas. These three groups together
represent about 75% of fossil fuel emissions in each year, but the share of hard coal is clearly
decreasing, while the share of natural gas is rising. This was more pronounced in 2019 and
2020 - emissions from hard coal represented a share of only 16% of total emissions in these
two years (down compared to 29% in 2013), 2020 emissions from natural gas amounted to
35% (up compared to 24% in 2013), whereas emissions from lignite fell slightly from their
peak of 27% in 2014 to 23% in 2020. Similar to earlier years, in the last year of phase 3,
other significant energy sources included mainly refinery gas (and other process-derived
gases) and other fossil fuel types, accounting for 8.4% and 6.8% of the total reported
combustion emissions respectively.
Figure 6. Share of emissions by fuel type (% of total fuel emissions in the EU ETS, labels not
shown if fuel never exceeds 3% of the total), [*] not covered by the other specified fuels66
Based on the 2021 Article 21 reports submitted by Member States67, the zero-rated emissions
from biomass decreased from 150 Mt in 2019 to 142 Mt in 2020, a similar level as in 2018.
2 163 out of 9 623 installations (22.5% of all reporting installations under the EU ETS)
reported the use of biomass. The total biomass emissions in 2020 are about ten times lower
66 The UK data is included up to 2019. In 2020, only Northern Ireland data is included. The UK did not submit an Article 21
report in 2021. 67 The UK did not submit an Article 21 report in 2021.
26
than the fossil fuels emissions of EU ETS sectors. Emissions from non-zero-rated biomass
are still minimal, at about 0.9 Mt CO2eq and accounting for less than 0.1% of total EU ETS
emissions.
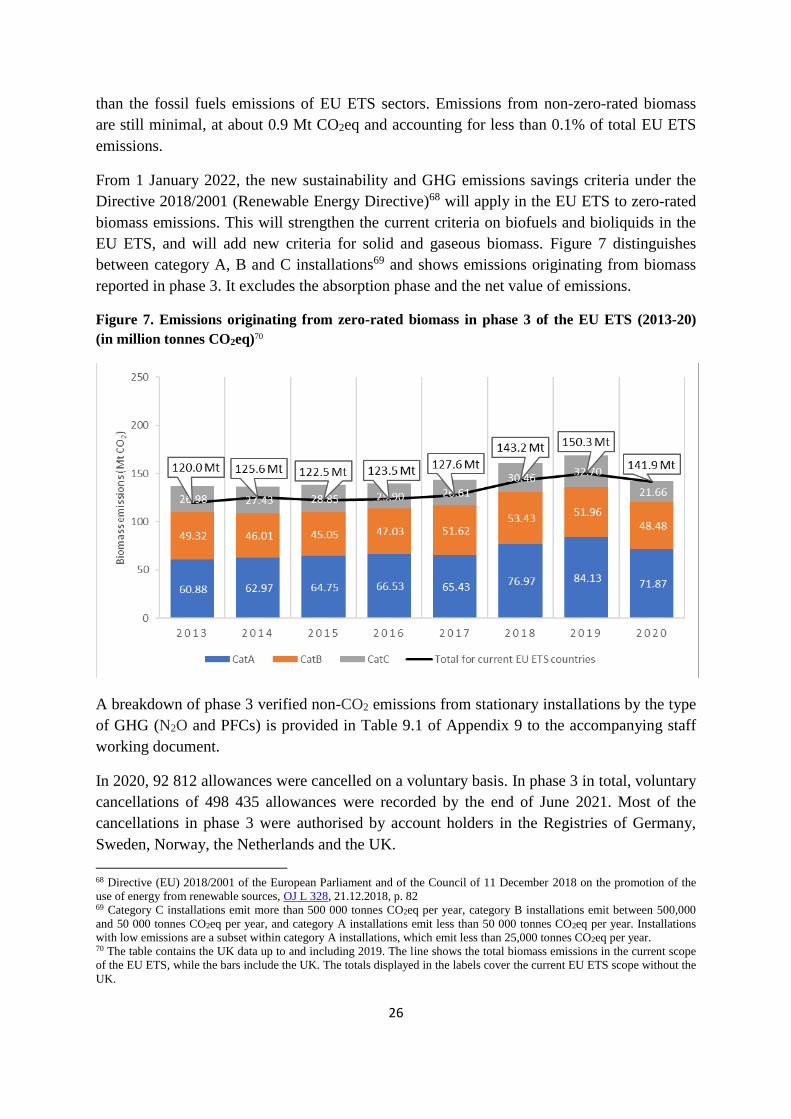
From 1 January 2022, the new sustainability and GHG emissions savings criteria under the
Directive 2018/2001 (Renewable Energy Directive)68 will apply in the EU ETS to zero-rated
biomass emissions. This will strengthen the current criteria on biofuels and bioliquids in the
EU ETS, and will add new criteria for solid and gaseous biomass. Figure 7 distinguishes
between category A, B and C installations69 and shows emissions originating from biomass
reported in phase 3. It excludes the absorption phase and the net value of emissions.
Figure 7. Emissions originating from zero-rated biomass in phase 3 of the EU ETS (2013-20)
(in million tonnes CO2eq)70
A breakdown of phase 3 verified non-CO2 emissions from stationary installations by the type
of GHG (N2O and PFCs) is provided in Table 9.1 of Appendix 9 to the accompanying staff
working document.
In 2020, 92 812 allowances were cancelled on a voluntary basis. In phase 3 in total, voluntary
cancellations of 498 435 allowances were recorded by the end of June 2021. Most of the
cancellations in phase 3 were authorised by account holders in the Registries of Germany,
Sweden, Norway, the Netherlands and the UK.
68 Directive (EU) 2018/2001 of the European Parliament and of the Council of 11 December 2018 on the promotion of the
use of energy from renewable sources, OJ L 328, 21.12.2018, p. 82 69 Category C installations emit more than 500 000 tonnes CO2eq per year, category B installations emit between 500,000
and 50 000 tonnes CO2eq per year, and category A installations emit less than 50 000 tonnes CO2eq per year. Installations
with low emissions are a subset within category A installations, which emit less than 25,000 tonnes CO2eq per year. 70 The table contains the UK data up to and including 2019. The line shows the total biomass emissions in the current scope
of the EU ETS, while the bars include the UK. The totals displayed in the labels cover the current EU ETS scope without the
UK.

27
3.2.2. Balancing supply and demand
At the start of phase 3, the EU ETS had a high structural imbalance between the supply and
demand of allowances, equalling 2.1 billion allowances. To address this imbalance, as a
short-term measure, in 2014 the Commission postponed the auctioning of 900 million
allowances from 2014, 2015, and 2016 to 2019-2020, and as a long-term solution created the
MSR in 201571. The MSR adjusts auction volumes according to predefined thresholds of the
total number of allowances in circulation (TNAC) so as to maintain the carbon market in
balance.
From 2018 to 2019, when the MSR began operating, the surplus fell significantly from 1.65
billion to around 1.385 billion allowances. In 2020, due to lower demand, the surplus
increased to 1.579 billion allowances. The additional 2020 surplus is expected to be absorbed
over the next two to four years. Figure 8 presents the development of the surplus in the
European carbon market until 2020.
Figure 8. Surplus of allowances in phase 3 of the EU ETS (2013-20)
Source: DG Climate Action
When the EU ETS was revised in 201872, major changes were made to the functioning of the
MSR, as shown in Figure 10.1 of Appendix 10 to the staff working document accompanying
this report.
71 Decision (EU) 2015/1814 of the European Parliament and of the Council of 6 October 2015 concerning the establishment
and operation of a market stability reserve for the Union greenhouse gas emission trading scheme and amending Directive
2003/87/EC, OJ L 264, 9.10.2015, p. 1. 72 Directive (EU) 2018/410 of the European Parliament and of the Council of 14 March 2018 amending Directive
2003/87/EC to enhance cost-effective emission reductions and low-carbon investments and Decision (EU) 2015/1814, OJ L
76, 19.3.2018, p. 3
2,085 2,093
1,8181,685 1,655 1,655
1,3851,579
0,0
0,5
1,0
1,5
2,0
2,5
2013 2014 2015 2016 2017 2018 2019 2020
Bill
ion
s
28
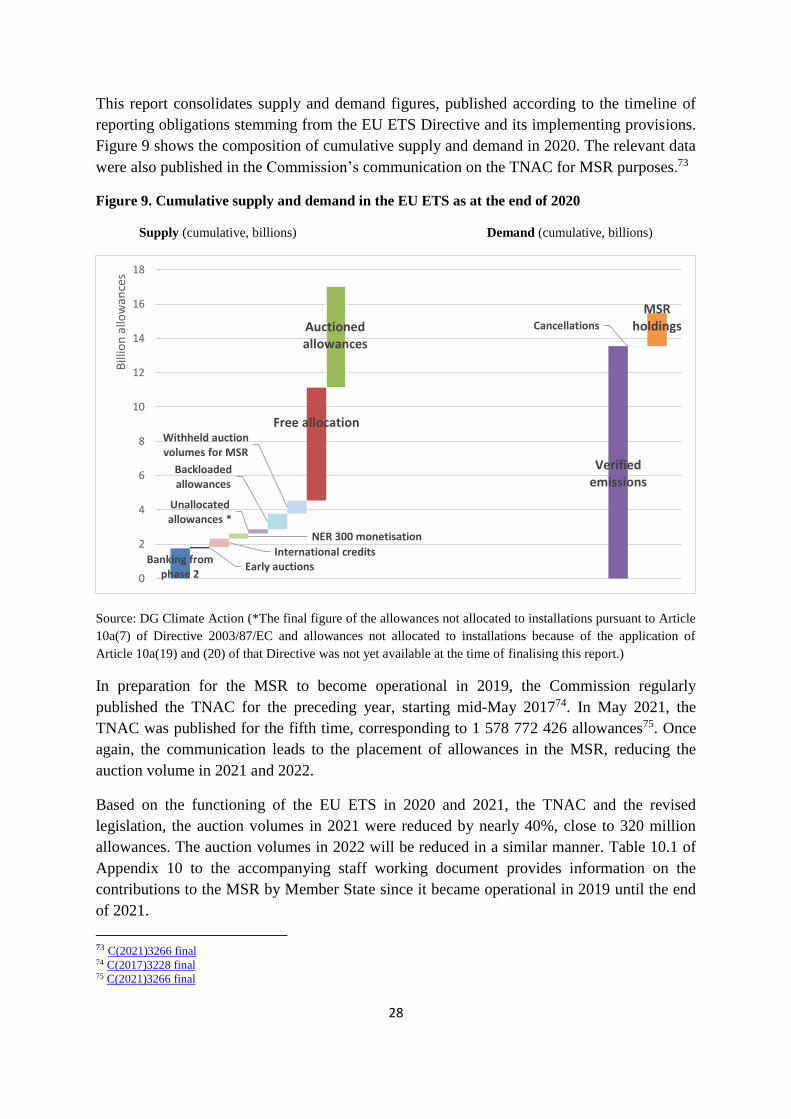
This report consolidates supply and demand figures, published according to the timeline of
reporting obligations stemming from the EU ETS Directive and its implementing provisions.
Figure 9 shows the composition of cumulative supply and demand in 2020. The relevant data
were also published in the Commission’s communication on the TNAC for MSR purposes.73
Figure 9. Cumulative supply and demand in the EU ETS as at the end of 2020
Supply (cumulative, billions) Demand (cumulative, billions)
Source: DG Climate Action (*The final figure of the allowances not allocated to installations pursuant to Article
10a(7) of Directive 2003/87/EC and allowances not allocated to installations because of the application of
Article 10a(19) and (20) of that Directive was not yet available at the time of finalising this report.)
In preparation for the MSR to become operational in 2019, the Commission regularly
published the TNAC for the preceding year, starting mid-May 201774. In May 2021, the
TNAC was published for the fifth time, corresponding to 1 578 772 426 allowances75. Once
again, the communication leads to the placement of allowances in the MSR, reducing the
auction volume in 2021 and 2022.
Based on the functioning of the EU ETS in 2020 and 2021, the TNAC and the revised
legislation, the auction volumes in 2021 were reduced by nearly 40%, close to 320 million
allowances. The auction volumes in 2022 will be reduced in a similar manner. Table 10.1 of
Appendix 10 to the accompanying staff working document provides information on the
contributions to the MSR by Member State since it became operational in 2019 until the end
of 2021.
73 C(2021)3266 final 74 C(2017)3228 final 75 C(2021)3266 final
Banking from phase 2
Early auctionsInternational credits
NER 300 monetisation
Unallocated allowances *
Backloaded allowances
Withheld auction volumes for MSR
Free allocation
Auctioned allowances
Verified emissions
Cancellations
MSR holdings
0
2
4
6
8
10
12
14
16
18
Bill
ion
allo
wan
ces

29
In 2021, the Commission carried out the first review of the MSR76, as part of the broader
initiative to strengthen the EU ETS.77 It showed that the MSR has been fulfilling its purpose
to reduce the surplus of allowances and stabilise the EU carbon market, even during the
COVID-19 pandemic.
The MSR has begun to address historical imbalances in 2019, leading to intakes of nearly 1
billion allowances. This includes an adjustment of 264 million allowances withdrawn from
auction volumes in 2019, 397 million allowances withdrawn from auction volumes over
2019-2020, and over 300 million allowances to be withdrawn from auction volumes over
2020-2021, representing 24% of the previous year’s surplus in each case. Reduced emissions
in 2020 due to the COVID-19 crisis will result in a higher MSR intake over the period 2021-
2022, of 379 million allowances.
Intakes to the MSR are expected to continue reducing the auction supply in the coming years,
with the surplus remaining above the upper threshold and the aftermath of the COVID-19
pandemic affecting the demand. The MSR will thus continue to address the historical
imbalance built up in the EU carbon market over phases 2 and 3 while simultaneously
responding to the impact of the demand shock caused by the pandemic.
4. AVIATION
The aviation sector has been part of the EU ETS since 2012. The original legislation covered
all flights outgoing and incoming to the EEA. However, the EU temporarily limited ETS
obligations to flights within the EEA operated by all nationalities of airlines, in order to
support the development of a global market-based measure by the International Civil
Aviation Organisation (ICAO) to reduce aviation emissions.
In October 2016, the ICAO Assembly agreed on a resolution on CORSIA, to start in 2021.
CORSIA is a carbon offsetting scheme with the objective of stabilising net emissions from
international aviation at fixed levels through the purchase and cancellation of international
credits. In light of this agreement, the EU ETS Directive was amended in 2017 to extend the
intra-EEA scope of the EU ETS for aviation until the end of 2023.
As a result of the Agreement between the EU and Switzerland to link their respective carbon
markets (See Chapter 7), from 1 January 2020 the aviation scope of the EU ETS is extended
to all departing flights from the EEA to Switzerland. Switzerland in turn applies its ETS to all
flights departing to EEA airports. This ensures a level playing field on both directions of
routes.
76 The Impact Assessment can be found in Annex 7 of SWD(2021)601 final. 77 Proposal for a Directive of the European Parliament and of the Council amending Directive 2003/87/EC establishing a
system for greenhouse gas emission allowance trading within the Union, Decision (EU) 2015/1814 concerning the
establishment and operation of a market stability reserve for the Union greenhouse gas emission trading scheme and
Regulation (EU) 2015/757, COM/2021/551 final and Proposal for a Decision of the European Parliament and of the Council
amending Decision (EU) 2015/1814 as regards the amount of allowances to be placed in the market stability reserve for the
Union greenhouse gas emission trading scheme until 2030, COM/2021/571 final
30
Based on the Trade and Cooperation Agreement between the EU and the UK, reached in
December 2020 and applicable as of 1 January 2021, the EU ETS also continues to apply to
flights from the EEA to the UK, while the new UK ETS applies to flights departing from the
UK to the EEA.
In 2020, allowances were issued in line with the intra-EEA scope of the EU ETS for aviation,
extended to Switzerland. The free allocation amounted to slightly over 32.5 million
allowances. This includes the free allocation (slightly over 31.7 million allowances) and
nearly 0.8 million free allowances allocated from the special reserve for new entrants and fast
growing operators. In addition, aircraft operators administered by national administrators in
the EEA received about 0.5 million Swiss aviation allowances for free under the Swiss ETS.
The volume of aviation allowances auctioned in 2020 was approximately 9.2 million.
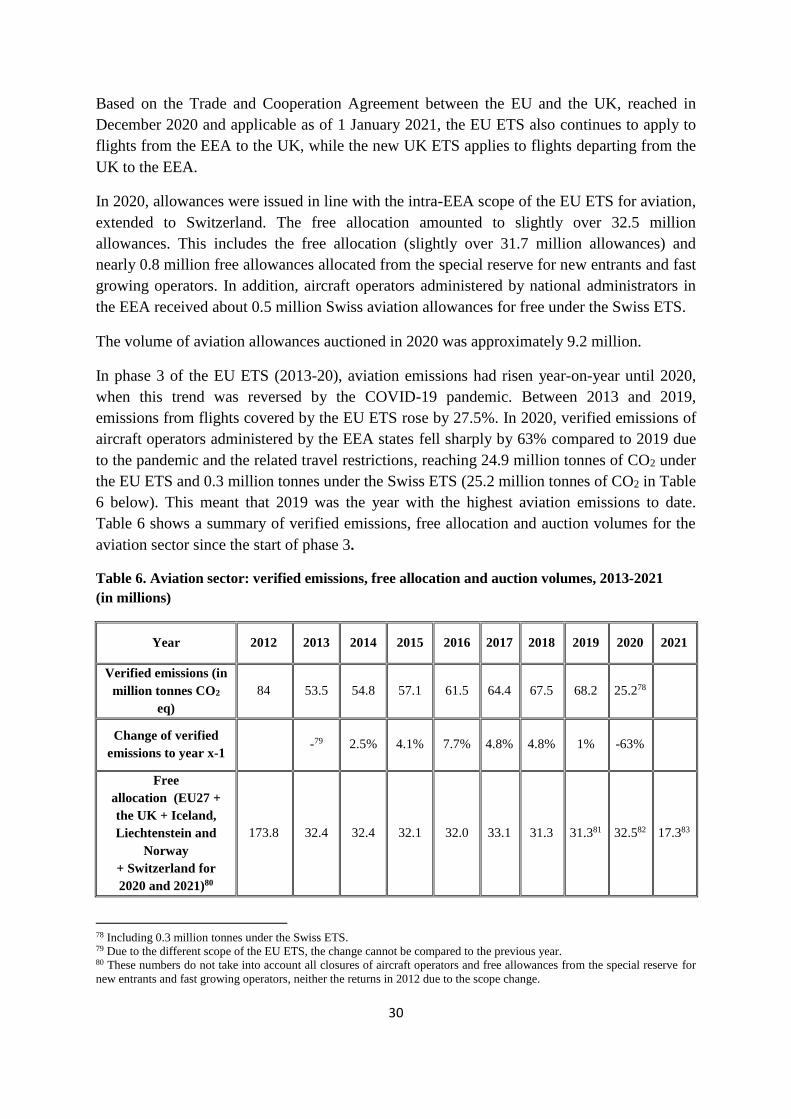
In phase 3 of the EU ETS (2013-20), aviation emissions had risen year-on-year until 2020,
when this trend was reversed by the COVID-19 pandemic. Between 2013 and 2019,
emissions from flights covered by the EU ETS rose by 27.5%. In 2020, verified emissions of
aircraft operators administered by the EEA states fell sharply by 63% compared to 2019 due
to the pandemic and the related travel restrictions, reaching 24.9 million tonnes of CO2 under
the EU ETS and 0.3 million tonnes under the Swiss ETS (25.2 million tonnes of CO2 in Table
6 below). This meant that 2019 was the year with the highest aviation emissions to date.
Table 6 shows a summary of verified emissions, free allocation and auction volumes for the
aviation sector since the start of phase 3.
Table 6. Aviation sector: verified emissions, free allocation and auction volumes, 2013-2021
(in millions)
Year 2012 2013 2014 2015 2016 2017 2018 2019 2020 2021
Verified emissions (in
million tonnes CO2
eq)
84 53.5 54.8 57.1 61.5 64.4 67.5 68.2 25.278
Change of verified
emissions to year x-1 -79 2.5% 4.1% 7.7% 4.8% 4.8% 1% -63%
Free
allocation (EU27 +
the UK + Iceland,
Liechtenstein and
Norway
+ Switzerland for
2020 and 2021)80
173.8 32.4 32.4 32.1 32.0 33.1 31.3 31.381 32.582 17.383
78 Including 0.3 million tonnes under the Swiss ETS. 79 Due to the different scope of the EU ETS, the change cannot be compared to the previous year. 80 These numbers do not take into account all closures of aircraft operators and free allowances from the special reserve for
new entrants and fast growing operators, neither the returns in 2012 due to the scope change.

31
Free allocation from
special reserve for
new entrants and fast
growing operators
0 0 0 0 0 1.1 1.1 1.0 0.8 0.3
Volumes of
allowances auctioned 2.5 0 9.3 16.4 6.0 4.7 5.6 5.5 9.2 1.384
Sources: EUTL, DG Climate Action
The volumes of aviation allowances auctioned over the period 2013-2015 reflect the 2014 co-
legislators’ decision to ‘stop the clock’85 and limit climate obligations only to flights within
the EEA. Compliance for the aviation sector was postponed for 201386. For aviation
emissions from 2013 and 2014, compliance took place between January and April 2015.
Including the aviation sector in the EU ETS had a significant impact on the environmental
performance of the system as a whole in phase 3. By 2020, aircraft operators had surrendered
308 million aviation allowances and 139 million general allowances. The latter figure shows
that the aviation sector had to buy high volumes of allowances from stationary installations,
thus contributing to the overall stringency and ambition of the EU ETS.
The significant impact of COVID-19 on international aviation also had repercussions on
CORSIA. Global aviation emissions in 2020 fell to below 54% of 2019 levels.87 In light of
this impact, the aviation industry, supported by numerous ICAO participating countries,
successfully requested adjusting CORSIA’s baseline from the original 2019-20 average of
emissions to 2019 emissions for the pilot phase (years 2021-23). Since the aviation industry
is not expected to recover before 202388 (return to 2019 traffic levels), there would likely be
no or few offsetting obligations for airlines during the CORSIA pilot phase.
The EU ETS Directive requires the Commission to report to the European Parliament and to
the Council on the general ambition and overall environmental integrity of CORSIA. Article
3d of the Directive requires the Commission also to ‘study the ability of the aviation sector to
pass on the cost of CO2 to its customers with the intention to propose to increase the
percentage of auctioning’.
81 Taking into account the numbers withheld due to closures of aircraft operators, the real allocation for 2019 would be 4
million below the presented figure (see footnote 8 in Notice C/2020/8643, OJ C 428, 11.12.2020, p. 1). Allocation for the
UK (4.31 million allowances of the total for 2019) suspended in 2019 due to the safeguard measures adopted by the
Commission to protect the environmental integrity of the EU ETS in cases where EU law ceases to apply to a Member State
withdrawing from the EU, resumed in 2020. 82 This number takes into account departing flights from EEA to Switzerland, and between the EEA and the UK, in
accordance with the Withdrawal Agreement. 83 This number does not take into account the departing flights from EEA to the UK yet, which are part of the EU ETS in
accordance with the Trade and Cooperation Agreement between the EU and the UK. 84 Until the end of June 2021. 85 Decision No 377/2013/EU of the European Parliament and of the Council of 24 April 2013 derogating temporarily from
Directive 2003/87/EC establishing a scheme for greenhouse gas emission allowance trading within the Community, OJ L
113, 25.4.2013, p. 1 86 Regulation (EU) No 421/2014 of the European Parliament and of the Council of 16 April 2014, OJ L 129, 30.4.2014, p. 1 87 ICAO, C-WP/15209 of May 2021 88 Eurocontrol, COVID-19 impact on the European air traffic network of September 2021
32
As part of the broader package to deliver on the European Green Deal published on 14 July
2021, and based on the EU ETS Directive as amended in 201789, the Commission proposed
to amend the EU ETS for aviation90. This proposal, in its accompanying impact assessment91,
includes a report on the CORSIA assessment and the cost-pass through study. It seeks to
implement CORSIA into EU law in a way that is consistent with the EU’s 2030 climate
objective.
5. MARKET OVERSIGHT
During phase 3 of the EU ETS (2013-20), a robust legal framework has been put in place to
oversee the EU carbon market. Derivatives in emission allowances were classified as
financial instruments from the start of the EU ETS. However, since January 2018, spot92
emission allowances are also classified as financial instruments under the Directive on
Markets in Financial Instruments93 (MiFID). The classification of emission allowances has
been reflected in a number of secondary legislation acts, including the Auctioning
Regulation94, to oversee the primary market (auctions). Therefore, all trading in emission
allowances is effectively subject to the same regime applicable to EU financial markets.
The main financial market rules that apply to the trading of emission allowances are:
Markets in Financial Instruments Directive and Regulation (MIFID II/MIFIR),
which sets out authorisation requirements for trading venues and financial
intermediaries (investment firms), important reporting and transparency requirements
to avoid market abuse and rules on supervision and cooperation between national
competent authorities.
Market Abuse Regulation95, which is the EU’s rulebook that prohibits different
kinds of market abuse, such as insider dealing or market manipulation through
practices like spreading false information or rumours. The Market Abuse Regulation
applies to all market participants, irrespective of whether the abuse takes place in the
EU or outside the EU.
89 Regulation (EU) 2017/2392 of the European Parliament and of the Council of 13 December 2017 amending Directive
2003/87/EC to continue current limitations of scope for aviation activities and to prepare to implement a global market-based
measure from 2021, OJ L 350, 29.12.2017, p. 7 90 Proposal for a Directive of the European Parliament and of the Council amending Directive 2003/87/EC as regards
aviation's contribution to the Union’s economy-wide emission reduction target and appropriately implementing a global
market-based measure, COM/2021/552 final 91 The Impact Assessment can be found in SWD(2021)603 final. 92 Contracts under which the delivery of allowances takes place (almost) immediately. 93 Directive 2014/65/EU of the European Parliament and of the Council of 15 May 2014 on markets in financial instruments
and amending Directive 2002/92/EC and Directive 2011/61/EU, OJ L 173, 12.6.2014, p. 349 94 Commission Regulation (EU) No 1031/2010 of 12 November 2010 on the timing, administration and other aspects of
auctioning of greenhouse gas emission allowances pursuant to Directive 2003/87/EC of the European Parliament and of the
Council establishing a scheme for greenhouse gas emission allowances trading within the Community, OJ L 302,
18.11.2010, p. 1 95 Regulation (EU) No 596/2014 of the European Parliament and of the Council of 16 April 2014 on market abuse (the
Market Abuse Regulation) and repealing Directive 2003/6/EC of the European Parliament and of the Council and
Commission Directives 2003/124/EC, 2003/125/EC and 2004/72/EC, OJ L 173, 12.6.2014, p. 1
33
Anti-Money Laundering Directive96, which lays down important safeguards against
money laundering and terrorist financing.
The market is supervised by the financial authorities of 27 Member States97, under the
coordination of the European regulator, the European Securities and Markets Authority
(ESMA). In line with financial market rules, trading venues and investment firms are subject
to robust reporting and transparency requirements. This enables the competent authorities in
Member States to monitor the trading behavior of market participants. In addition, the Market
Abuse Regulation obliges market participants to report suspicious orders and transactions
without delay. The national authorities have the power to impose remedial action or penalties
when they decide that certain behaviours give rise to market abuse.
Financial market rules are an important safeguard of the integrity and transparency of the EU
carbon market. So far, the established framework has worked well and it is essential to ensure
that the rules are implemented properly.
Every year, ESMA publishes an estimate of the size of different European markets, including
the carbon market. In the most recent estimate for 2020, ESMA calculated the overall trading
activity in emission allowances at around EUR 687 billion98. Of this total, derivatives of
emission allowances represent by far the largest share of the market. Most transactions take
place on trading venues (approx. 95%), with only a small share conducted over-the-counter
(OTC).
Derivatives play a crucial role as they provide ETS operators with flexible ways to manage
their carbon price risk. These contracts are offered by exchanges and financial intermediaries,
which are free to ‘package’ emission allowances in different financial products, subject to
market preferences and the established legal framework.
As in all markets, the EU carbon market also felt the effects of the COVID-19 pandemic in
2020. In the wake of the crisis, the price of emission allowances dipped to EUR 14.71 from
the average level of EUR 24.84 in 201999. Nevertheless, carbon prices rebounded swiftly.
Market analysts have pointed out that the Market Stability Reserve (MSR) significantly
improved the resilience of the market to major demand shocks, such as the shock caused by
the global pandemic.
There are many factors that can influence the price of emission allowances100. In particular,
leading market analysts point out the MSR, which is absorbing the market surplus, and long-
96 Directive (EU) 2015/849 of the European Parliament and of the Council of 20 May 2015 on the prevention of the use of
the financial system for the purposes of money laundering or terrorist financing, amending Regulation (EU) No 648/2012 of
the European Parliament and of the Council, and repealing Directive 2005/60/EC of the European Parliament and of the
Council and Commission Directive 2006/70/EC, OJ L 141, 5.6.2015, p. 73 97 The list of national competent authorities responsible under the Market Abuse Regulation can be found on ESMA’s
webpage. 98 ESMA’s opinion on ancillary activity – market size calculation – update for the year 2020. 99 Price on 23 March 2020 (EUR 14.71). 100 Some short-term factors are gas and oil prices, weather conditions, renewable energy generation, scheduling of auctions
and free allocation, etc.

34
term policy expectations of market players. The carbon market is forward-looking and
anticipates future legislative changes. The increased 2030 climate ambition, enshrined in the
European Climate Law, requires a lower EU ETS emissions cap, which would reduce the
supply of allowances. According to analysts, market participants are already factoring in this
expected change.
ETS compliance entities remain the dominant category on both the primary and secondary
market. The number of bidders eligible for the auctions at the common auction platform
increased slightly to reach 90 participants as of December 2020. The vast majority of
participants were operators (72%), while the remainder were investment firms and credit
institutions (18%), as well as persons exempt from MiFID requirements (10%)101.
On the secondary market, MiFID rules require trading venues and investment firms to report
to competent authorities the positions held in emission allowances. The aggregate
breakdowns of positions in emission allowances held by different market participants,
including investment firms, are also publicly available and published on a weekly basis on
the webpages of ESMA102. These reports provide a good indication of the distribution of the
volumes between market participants and show that investment funds, which can be
associated with speculative behaviour, currently hold a small share of the total positions on
the market.
The start of the phase 4 was marked by a significant change on the secondary market.
Historically, the major share of secondary market trading took place on the UK-based
exchange platform ICE Futures Europe. On 7 June 2021, ICE London moved the trading in
EU emission allowances (both spot and derivatives) to its subsidiary in the Netherlands, ICE
Endex. Trading on ICE Endex is subject to the supervision of the Dutch Authority for the
Financial Markets.
The increase in energy prices in 2021 has renewed the interest in carbon prices and the
oversight regime of the EU carbon market. There is common agreement that the main cause
of the increase are the record global prices of gas, while the increased price of carbon has a
much smaller effect. The Commission’s communication of 13 October 2021103 demonstrates
that the effect of the gas price increase on the electricity price is nine times bigger than the
effect of the carbon price increase. Fair price formation and integrity of the EU carbon market
is guaranteed by a robust oversight regime also applicable to other financial markets.
Nevetheless, the Commission announced that it will ask ESMA to further enhance the
monitoring of developments in the EU carbon market.
101 This concerns a separate category defined in MiFID, for companies that deal in financial instruments, but on an ancillary
basis (as minor part of their overall business activity). 102 Commodities Derivatives Weekly Position Reporting System 103 Communication from the Commission to the European Parliament, the European Council, the European Economic and
Social Committee and the Committee of the Regions, Tackling rising energy prices, a toolbox for action and support,
COM/2021/660 final

35
6. MONITORING, REPORTING AND VERIFICATION OF EMISSIONS
For phase 3 (2013-20) and beyond, the monitoring, reporting, verification and accreditation
requirements of the EU ETS are harmonised in the Monitoring and Reporting Regulation
(MRR)104 and the Accreditation and Verification Regulation (AVR)105.
The monitoring system in the EU ETS is designed as a building block approach, which gives
operators a high degree of flexibility to ensure cost-efficiency, while achieving a high
reliability of the emissions data monitored. For this purpose, operators may use several
monitoring methods ('calculation-based' or 'measurement-based' as well as, by exception,
'fall-back approaches'), including a combination of methods for individual parts of an
installation. For aircraft operators, only calculation-based approaches are allowed, with fuel
consumption being the central parameter to be calculated for the flights covered by the EU
ETS. The requirement for installations and aircraft operators to have a monitoring plan
approved by the relevant competent authority on the basis of the MRR prevents them from
making an arbitrary selection of monitoring methods and temporal variations (For a detailed
overview of the monitoring applied in the EU ETS participating countries, see Chapter 11.1
of Appendix 11 of the accompanying staff working document).
The AVR put in place an EU-wide harmonised approach to the accreditation of verifiers.
Verifiers must be accredited by a National Accreditation Body in order to carry out
verifications in compliance with the AVR. This uniform accreditation system allows verifiers
to operate with mutual recognition across all participating countries, thereby taking full
advantage of the internal market and ensuring sufficient availability across the EU (For a
detailed overview of AVR implementation in the EU ETS participating countries, see
Chapter 11.2 of Appendix 11 to the accompanying staff working document).
Following the first update of the MRR and the AVR in 2018 to improve, clarify and simplify
the monitoring, reporting, verification and accreditation rules and improve the efficiency of
the system, a second update of the two regulations started in February 2019. The aim was to
address outstanding issues such as the implementation of the recast of the Renewable Energy
Directive. This resulted in the adoption of the Commission Implementing Regulation
2020/2085 amending the MRR106 and the Commission Implementing Regulation 2020/2084
amending the AVR107 on 14 December 2020.
104 Commission Implementing Regulation (EU) 2018/2066 of 19 December 2018 on the monitoring and reporting of
greenhouse gas emissions pursuant to Directive 2003/87/EC of the European Parliament and of the Council and amending
Commission Regulation (EU) No 601/2012, OJ L 334, 31.12.2018, p. 1 105 Commission Implementing Regulation (EU) 2018/2067 of 19 December 2018 on the verification of data and on the
accreditation of verifiers pursuant to Directive 2003/87/EC of the European Parliament and of the Council, OJ L 334,
31.12.2018, p. 94 106 Commission Implementing Regulation (EU) 2020/2085 of 14 December 2020 amending and correcting Implementing
Regulation (EU) 2018/2066 on the monitoring and reporting of greenhouse gas emissions pursuant to Directive 2003/87/EC
of the European Parliament and the Council, OJ L 423,15.12.2020, p. 37 107 Commission Implementing Regulation (EU) 2020/2084 of 14 December 2020 amending and correcting Implementing
Regulation (EU) 2018/2067 on the verification of data and on the accreditation of verifiers pursuant to Directive 2003/87/EC
of the European Parliament and the Council, OJ L 423, 15.12.2020, p. 23
36
Countries participating in the EU ETS take different approaches to the competent authorities
in charge of implementation. In some countries, several local authorities are involved, while
in others, implementation is more centralised (For a detailed overview of administrative
arrangements in the EU ETS participating countries, see Chapter 11.3 of Appendix 11 to the
accompanying staff working document). Overall, the organisation of the EU ETS
administration in the participating countries has proven largely effective throughout phase 3.
Regarding compliance measures, the EU ETS Directive provides for a EUR 100 penalty
(indexed to inflation) for each tonne of CO2 emitted for which no allowance has been
surrendered in due time, in addition to the price of surrendering. Other penalties applicable
to infringements in implementing the EU ETS are based on national provisions set by each
concerned country (For a detailed overview of the EU ETS compliance in participating
countries, see Chapter 11.4 of Appendix 11 to the accompanying staff working document).
The efficiency of the compliance system has improved since the MRR allowed countries to
make electronic reporting mandatory. Throughout phase 3, more than half of the EU ETS
participating countries reported the use of electronic templates for monitoring plans,
emissions reports, verification reports and/or improvement reports. The other half reported
that they use some form of automated IT system for EU ETS reporting.
Throughout phase 3, and despite the difficult economic situation due to the COVID-19 crisis
affecting the 2020 and 2021 compliance cycles, the level of compliance with the EU ETS
remained consistently very high. Operators responsible for over 99% of emissions from
stationary installations and aviation in most years, met their legal obligations.
7. LINK OF THE EU ETS AND THE SWISS ETS
The negotiations on linking the EU ETS with the carbon market of Switzerland were
concluded during the 21st Conference of the Parties to the UNFCCC in December 2015.
Based on Council Decision (EU) 2017/2240108, the Linking Agreement109 was signed,
provisionally applied from 23 November 2017 and approved on behalf of the EU by Council
Decision (EU) 2018/219110. The EU and the Swiss Confederation exchanged the instruments
of ratification on 6 December 2019, after the Swiss Confederation extended its ETS to
aviation via Decision 2/2019 on 5 December 2019111. Consequently, the Linking Agreement
108 Council Decision (EU) 2017/2240 of 10 November 2017 on the signing on behalf of the Union, and provisional
application of the Agreement between the European Union and the Swiss Confederation on the linking of their greenhouse
gas emissions trading systems, OJ L 322, 7.12.2017, p. 1 109 Agreement between the European Union and the Swiss Confederation on the linking of their greenhouse gas emissions
trading systems, OJ L 322, 7.12.2017, p. 3 110 Council Decision (EU) 2018/219 of 23 January 2018 on the conclusion of the Agreement between the European Union
and the Swiss Confederation on the linking of their greenhouse gas emissions trading systems, OJ L 43, 16.2.2018, p. 1 111 Decision No 2/2019 of the Joint Committee established by the Agreement between the European Union and the Swiss
Confederation on the linking of their greenhouse gas emissions trading systems of 5 December 2019 amending Annexes I
and II to the Agreement between the European Union and the Swiss Confederation on the linking of their greenhouse gas
emissions trading systems, OJ L 314, 29.9.2020, p. 68

37
entered into force on 1 January 2020112. Since then, emissions in 2020 in the EU ETS and the
Swiss ETS are covered by the linked systems.
The Linking Agreement does not affect the independent character of the EU and the Swiss
ETS. Both systems remain independent, unlike the systems of Iceland, Liechtenstein and
Norway, which are fully integrated into the EU ETS by means of the mechanisms laid down
in the EEA Agreement. The Linking Agreement defines the conditions and requirements
under which the two systems are linked and establishes the mechanism needed to ensure that
the linking conditions of Article 25 of the EU ETS Directive113 are met.
Including aviation in the Linking Agreement was a crucial requirement for the EU. Based on
Article 6 of the Agreement, Switzerland applies the same approach to coverage, cap and
allocation of allowances as the EU ETS. Swiss domestic flights and flights from Switzerland
to the EEA are covered by the Swiss ETS, while flights from the EEA to Switzerland fall
under the EU ETS. This enables the Linking Agreement to contribute to the environmental
integrity of both the EU ETS and the ETS of Switzerland.
As shown in Table 7, compatibility of the two systems is not a matter of size, but a matter of
qualitative requirements and considerations to safeguard the integrity of the linked carbon
markets and the level playing field for operators.
Table 7. Comparison of the EU ETS and the Swiss ETS
EU ETS Swiss ETS
Number of general allowances
auctioned in 2020 778 505 000
265 000 (out of which 175 000
auctioned in 2021 due to cancellation
of auctions in 2020)
Number of aviation allowances
auctioned in 2020 9 174 000 196 500
Number of general allowances
allocated for free in 2020 66 775 8544 4 391 331
Number of aviation allowances
allocated for free in 2020 to
operators
EU aviation
allowances for
EU ETS
Swiss aviation
allowances for
Swiss ETS
Swiss aviation
allowances for
Swiss ETS
EU aviation
allowances for
EU ETS
32 486 017 501 278 570 696 473 521
Verified emissions of
stationary installations in 2020 1 355 141 953 4 874 278
Verified emissions of aviation
operators in 2020114
EU ETS Swiss ETS Swiss ETS EU ETS
24 917 481 299 610 283 329 366 102
Number of stationary
installations in 2020 10 437115 51
112 Notice concerning the entry into force of the Agreement between the European Union and the Swiss Confederation on the
linking of their greenhouse gas emissions trading systems, OJ L 330,20.12.2019, p. 1 113 In accordance with Article 25 of the EU ETS Directive, the EU ETS can be linked to ‘compatible mandatory greenhouse
gas emissions trading systems with absolute emissions caps’. 114 Some aviation operators face compliance obligations under both systems. 115 Operators not excluded in 2020 based on the EU Registry; the number of operators which reported emissions is 10 317.
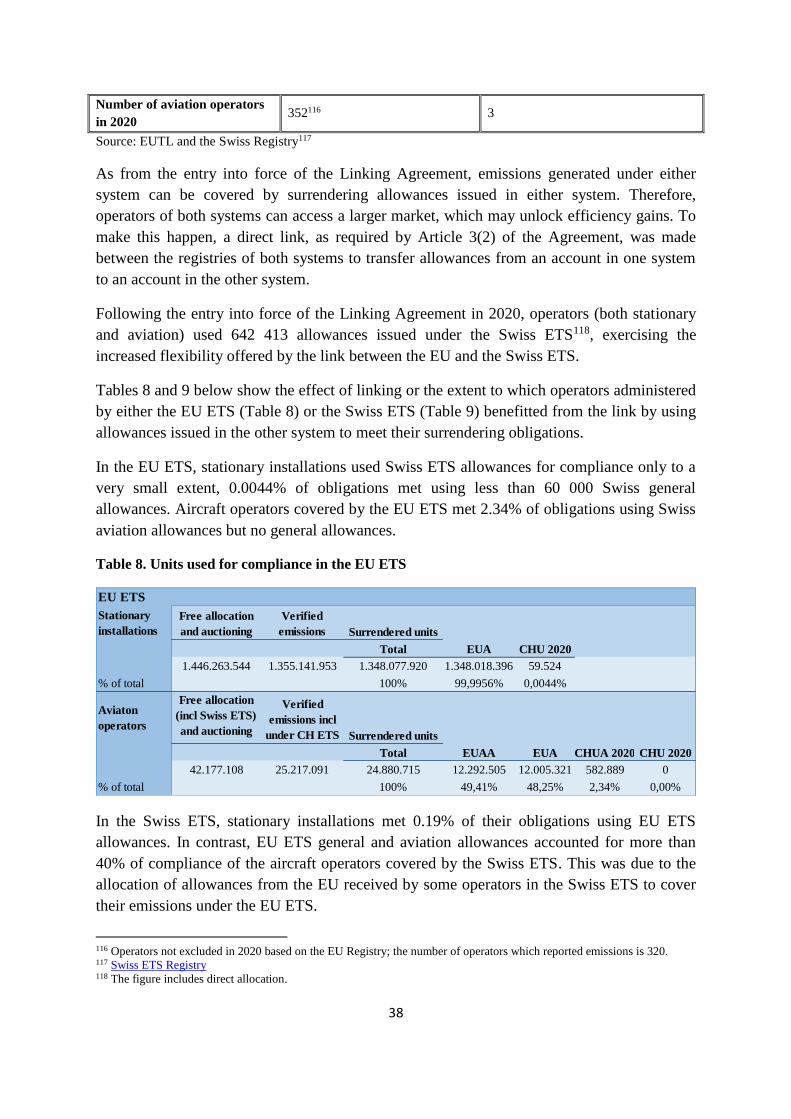
38
Number of aviation operators
in 2020 352116 3
Source: EUTL and the Swiss Registry117
As from the entry into force of the Linking Agreement, emissions generated under either
system can be covered by surrendering allowances issued in either system. Therefore,
operators of both systems can access a larger market, which may unlock efficiency gains. To
make this happen, a direct link, as required by Article 3(2) of the Agreement, was made
between the registries of both systems to transfer allowances from an account in one system
to an account in the other system.
Following the entry into force of the Linking Agreement in 2020, operators (both stationary
and aviation) used 642 413 allowances issued under the Swiss ETS118, exercising the
increased flexibility offered by the link between the EU and the Swiss ETS.
Tables 8 and 9 below show the effect of linking or the extent to which operators administered
by either the EU ETS (Table 8) or the Swiss ETS (Table 9) benefitted from the link by using
allowances issued in the other system to meet their surrendering obligations.
In the EU ETS, stationary installations used Swiss ETS allowances for compliance only to a
very small extent, 0.0044% of obligations met using less than 60 000 Swiss general
allowances. Aircraft operators covered by the EU ETS met 2.34% of obligations using Swiss
aviation allowances but no general allowances.
Table 8. Units used for compliance in the EU ETS
In the Swiss ETS, stationary installations met 0.19% of their obligations using EU ETS
allowances. In contrast, EU ETS general and aviation allowances accounted for more than
40% of compliance of the aircraft operators covered by the Swiss ETS. This was due to the
allocation of allowances from the EU received by some operators in the Swiss ETS to cover
their emissions under the EU ETS.
116 Operators not excluded in 2020 based on the EU Registry; the number of operators which reported emissions is 320. 117 Swiss ETS Registry 118 The figure includes direct allocation.
EU ETS
Stationary
installations
Free allocation
and auctioning
Verified
emissions Surrendered units
Total EUA CHU 2020
1.446.263.544 1.355.141.953 1.348.077.920 1.348.018.396 59.524
% of total 100% 99,9956% 0,0044%
Aviaton
operators
Free allocation
(incl Swiss ETS)
and auctioning
Verified
emissions incl
under CH ETS Surrendered units
Total EUAA EUA CHUA 2020 CHU 2020
42.177.108 25.217.091 24.880.715 12.292.505 12.005.321 582.889 0
% of total 100% 49,41% 48,25% 2,34% 0,00%
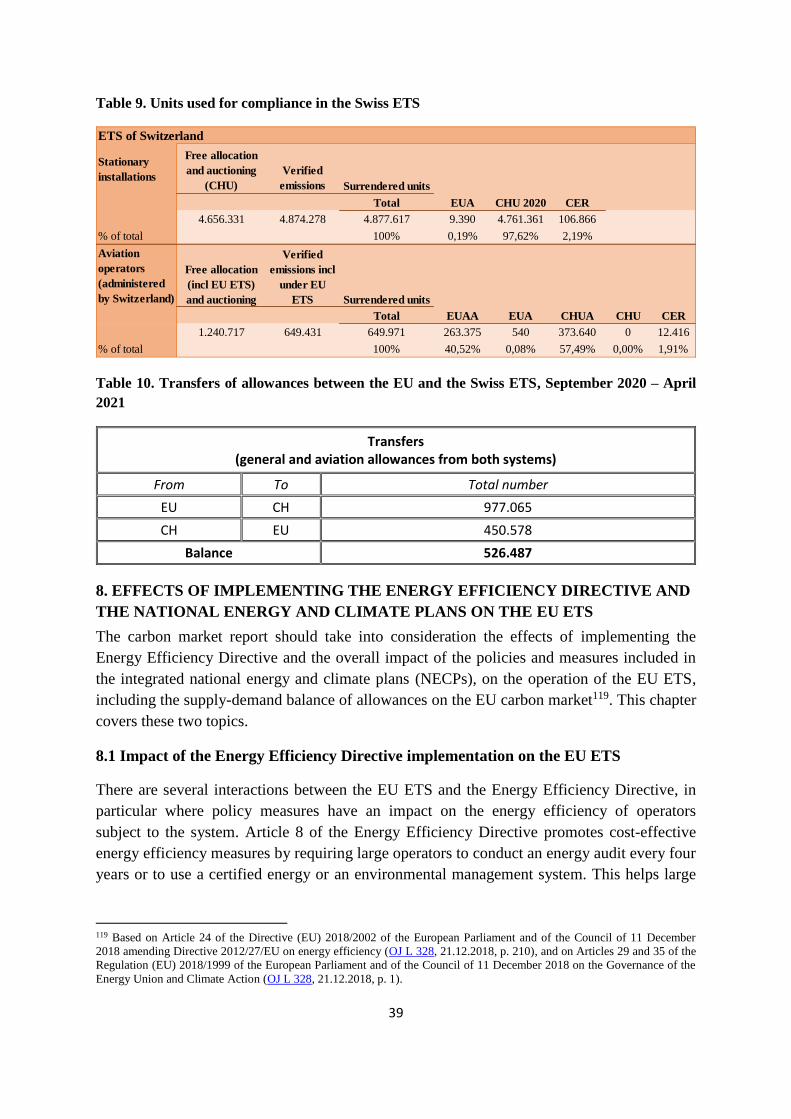
39
Table 9. Units used for compliance in the Swiss ETS
Table 10. Transfers of allowances between the EU and the Swiss ETS, September 2020 – April
2021
Transfers (general and aviation allowances from both systems)
From To Total number
EU CH 977.065
CH EU 450.578
Balance 526.487
8. EFFECTS OF IMPLEMENTING THE ENERGY EFFICIENCY DIRECTIVE AND
THE NATIONAL ENERGY AND CLIMATE PLANS ON THE EU ETS
The carbon market report should take into consideration the effects of implementing the
Energy Efficiency Directive and the overall impact of the policies and measures included in
the integrated national energy and climate plans (NECPs), on the operation of the EU ETS,
including the supply-demand balance of allowances on the EU carbon market119. This chapter
covers these two topics.
8.1 Impact of the Energy Efficiency Directive implementation on the EU ETS
There are several interactions between the EU ETS and the Energy Efficiency Directive, in
particular where policy measures have an impact on the energy efficiency of operators
subject to the system. Article 8 of the Energy Efficiency Directive promotes cost-effective
energy efficiency measures by requiring large operators to conduct an energy audit every four
years or to use a certified energy or an environmental management system. This helps large
119 Based on Article 24 of the Directive (EU) 2018/2002 of the European Parliament and of the Council of 11 December
2018 amending Directive 2012/27/EU on energy efficiency (OJ L 328, 21.12.2018, p. 210), and on Articles 29 and 35 of the
Regulation (EU) 2018/1999 of the European Parliament and of the Council of 11 December 2018 on the Governance of the
Energy Union and Climate Action (OJ L 328, 21.12.2018, p. 1).
ETS of Switzerland
Stationary
installations
Free allocation
and auctioning
(CHU)
Verified
emissions Surrendered units
Total EUA CHU 2020 CER
4.656.331 4.874.278 4.877.617 9.390 4.761.361 106.866
% of total 100% 0,19% 97,62% 2,19%
Aviation
operators
(administered
by Switzerland)
Free allocation
(incl EU ETS)
and auctioning
Verified
emissions incl
under EU
ETS Surrendered units
Total EUAA EUA CHUA CHU CER
1.240.717 649.431 649.971 263.375 540 373.640 0 12.416
% of total 100% 40,52% 0,08% 57,49% 0,00% 1,91%

40
operators identify energy losses, the energy savings’ potential and cost-effective measures to
reduce their energy consumption.
A central provision of the Energy Efficiency Directive aimed directly at producing energy
savings is Article 7, which requires Member States to take policy measures to achieve energy
savings120. Since Member States have a choice as to which sectors to focus on, these
measures might interact with obligations under the EU ETS. As concerns potential impacts
on EU ETS sectors, Member State measures can be classified into four categories:
Energy efficiency policy measures implemented in sectors outside of the scope of the
EU ETS that have no direct interactions with the system, such as replacing an old
coal stove with a more efficient biomass-fired boiler.
Energy efficiency measures targeting a reduced consumption of energy supplied from
ETS sectors, such as electricity, district heating and refineries providing fuel for
transport and heating. These include insulating buildings supplied by district heating,
replacing electric appliances and transport fuel efficiency measures. While the
relevant decisions lie outside of installations covered by the EU ETS, the carbon
price signal may incentivise action by market actors, predominantly consumers.
Policy measures promoting actions leading to a change of energy carrier, such as
replacing an electric heater with a solar heater (leading to reduced energy
consumption in an ETS sector) or replacing of a gas boiler with a heat pump (leading
to increased energy consumption in an ETS sector).
Policy measures promoting energy efficiency of the core processes of installations
subject to the EU ETS.
The latter measures interact directly with the EU ETS. In the 2014-20 period, Belgium, the
Netherlands and Romania121 reported Article 7 policy measures focused on ETS installations
- voluntary agreements (in the case of Belgium and the Netherlands) or equivalent (for
Romania)122. These measures accounted for a high share of the cumulative energy savings
reported by these countries for 2014-2018: 61% for Belgium, 20% for the Netherlands and
44% for Romania123. While the voluntary agreements stipulate that operators should commit
to energy efficiency or energy savings targets, these targets are not limited to the energy
consumption subject to the EU ETS. In practice, most energy savings are likely to come from
energy efficiency improvements in the industrial processes falling under the EU ETS, but part
of the savings may come from the energy consumption outside of the system (e.g. fuel
120 Commission Recommendation on the transposition of the energy savings obligation, C(2019) 6621 final 121 Member States had an obligation to report annually until 30 April 2020. The final report covering the whole obligation
period is due by March 2022. These are the three Member States that have designed a measure to specifically address the
industries in the EU ETS. There are significantly more measures targeting industries in general (those could cover industries
in the scope of EU ETS and outside). The ODYSSEE-MURE database on energy efficiency measures in EU lists more than
200 measures addressed to industries in Member States. 122 Voluntary agreements and equivalent measures are both alternative measures in the meaning of Article 7(b) of the Energy
Efficiency Directive. The original iteration of the Directive, adopted in 2012, had included a non-exhaustive list of
alternative measures but after its revision in 2018 the list was removed.) 123 These numbers originate from annual reports submitted by Member States in line with Article 24(1) of the Energy
Efficiency Directive. The shares are expressed in relation to Article 7 cumulative savings reported for years 2014-18.
41
efficiency in transport, energy efficiency in offices). Although most Member States include at
least one policy measure targeting industries also covered by the EU ETS in their action
scope, the Article 7 reported data do not distinguish between the share of savings from ETS
industries and savings from other (sub-)sectors.
For the period 2014 – June 2020, provisions of Article 7(4) of the Energy Efficiency
Directive addressed interactions with the EU ETS.
Article 7(4)(b) referred to an option that Member States could use when calculating
the required amount of energy savings for the period 2014-20. They could exclude
from the calculation all or part of the sales of energy used in industrial sites covered
by the EU ETS. The option was used by 15 Member States.124
Article 7(4)(c) made it possible for Member States to report energy savings from
measures promoting energy efficiency on the supply side towards the amount of
energy savings calculated in accordance with Article 7(2) and (3). This option has
only been used by three Member States125.
Energy savings from energy efficiency policy measures in the ETS reduce the demand for
allowances. The impact on GHG emissions is more complex, since the ETS caps the
aggregate emissions of all covered entities, and the MSR takes care of supply-demand
imbalances. Energy savings in the sectors directly included in or indirectly linked with the
ETS may hence contribute to reducing emissions or to lowering of carbon prices. Also, to the
extent that energy efficiency policy measures tackle market failures and barriers to the uptake
of cost-effective energy-saving measures, and have additional benefits, they also enable
participants to reduce emissions at lower costs. In turn, the carbon price incentive of the EU
ETS contributes to achieving the EU targets and the indicative national energy efficiency
targets under Article 3.
8.2 Impact of national energy and climate plans’ implementation on the EU ETS
27 national energy and climate plans (NECPs) finalised in 2019 give an overview of how EU
Member States approach the first phase of their transition towards climate neutrality from
2021 to 2030.
The Commission’s assessment of the NECPs126 showed that under existing and planned
measures, Member States plan to reduce emissions by 41% below 1990 levels, surpassing the
EU’s previous 2030 reduction target of 40%. The plans also indicate that almost all Member
124 This option cannot be used for 2021-30, as for this obligation period, the options in Article 7(4) of the Energy Efficiency
Directive do not reduce the minimum amount of cumulative savings required, cf. Article 7(5) of the Directive. 125 Denmark (energy savings related to district heating as part of the EEOS), Romania (set of 5 measures dealing with
efficiency in power plants, high-efficiency cogeneration, efficiency in transmission and distribution networks and efficiency
in district heating) and Slovenia (3 measures related to efficiency in district heating). 126 The assessment of the cumulative impact of the NECPs (COM(2020) 564 final), is available here: https://eur-
lex.europa.eu/legal-content/EN/TXT/PDF/?uri=CELEX:52020DC0564&from=EN
The Commission’s individual assessments of each NECP can be found here: https://ec.europa.eu/energy/topics/energy-
strategy/national-energy-climate-plans/individual-assessments_en
42
States that use coal to generate electricity are phasing it out or have set phase-out dates. A
total of 21 Member States are either already coal-free in terms of electricity production127, or
have committed to phasing-out coal (including lignite and peat), indicating specific dates in
their NECPs. In this context, the NECPs project the use of coal to decrease by 70% by 2030
compared to 2015, with renewable electricity set to reach 60% of electricity produced by
2030. These developments would directly affect the EU ETS, potentially leading to a
substantial decrease in emissions from the power sector, and a subsequent fall in demand for
emission allowances. To the extent these policy-driven phase-outs accelerate carbon-market
driven coal phase-outs and those impacts are not neutralised by the Market Stability Reserve,
they could lower carbon prices in the ETS.
The Commission’s assessment also showed that the share of renewable energy at EU level
under existing and planned measures could reach 33.1-33.7% by 2030, exceeding the 2030
target of at least 32%. Further investments and reforms in renewable energy identified in
NECPs have the potential to push this share higher still. With regard to energy efficiency,
more ambition is needed to reach the 2030 target.128 Although the final plans and measures
planned at EU level show a heightened awareness of the issue, there are still significant
efforts to be made to close the gap. In as much as these developments would affect the sectors
directly included in or indirectly linked with the EU ETS, they may drive down demand for
allowances. In turn, the carbon price incentive of the EU ETS contributes to achieving the
national renewable energy and energy efficiency targets set in the NECPs.
Since the Commission’s assessment of the final NECPs in October 2020, some Member
States have made changes and adaptations to their plans. More detailed information on the
implications thereof is available in the EU Climate Action Progress Report 2021129. All
Member States are due to submit updates of their NECPs in June 2023 (in draft form) and
2024 (final plans). These should reflect the increased ambition in line with the EU target to
reduce net GHG emissions by 2030 by at least 55% relative to 1990, including potentially
taking into account the higher 2030 energy efficiency (savings of 36-39% of final and
primary energy consumption) and renewable energy (40% share of renewables in the EU’s
energy mix) targets proposed by the Commission with the legislative package on deliver on
the European Green Deal. The Commission will assess all updated draft plans by the end of
2023 and the final plans by the end of 2024.
9. CONCLUSIONS AND OUTLOOK
In phase 3 of the EU ETS (2013-20), GHG emissions from electricity production and
industrial installations covered by the system fell by almost 29%130, contributing to the
overall decrease of around 43% since the system was set up in 2005. Although the significant
decrease of emissions by 11.4% in 2020 undoubtedly can be attributed to a large extent to the
127 Belgium, Cyprus, Estonia, Latvia, Lithuania, Luxembourg and Malta 128 The gap stands at 2.8 percentage points for primary energy consumption and 3.1 percentage points for final energy
consumption, compared to the target to increase energy efficiency by at least 32.5% by 2030. 129 Climate Action Progress Report 2021, COM(2021)951 final 130 Between 2013 and 2020
43
effects of the COVID-19 pandemic, it marked another year in an almost uninterrupted trend
of emissions falling year-on-year in phase 3. This reflects the decarbonisation trends
identified mainly in electricity and heat production. Confirming this trend, pre-pandemic
2019 emissions fell by more than 9% compared to 2018.
In aviation, ETS-covered GHG emissions rose by 27.5% between 2013 and 2019, increasing
every year until 2020, when the trend was reversed by the pandemic and verified emissions
fell sharply by 63% compared to 2019. This meant that 2019 was the year with the highest
aviation emissions to date.
The legislative changes agreed in phase 3 to reinforce the EU ETS and address the surplus of
allowances yielded positive results. From 2018 to 2019, when the Market Stability Reserve
began operating, the surplus fell significantly from 1.65 billion to around 1.39 billion
allowances. Although in 2020 the surplus increased due to lower demand, the additional
surplus is expected to be absorbed over the next two to four years, thus contributing to the
proper functioning of the market. Moreover, on the basis of the published surplus indicator
and the EU ETS legislation for phase 4 (2021-30), auction volumes in 2021 were reduced by
nearly 40% and volumes in 2022 will be reduced in a similar manner.
The end of phase 3, after the Market Stability Reserve had become operational, was marked
by an increase in confidence of market participants, reflected in a stronger carbon price
signal. In 2020 and 2021 when, despite the difficult economic situation for industry and
aviation due to the COVID-19 crisis, the carbon price signal remained stable in 2020 and rose
considerably in 2021, influenced by high gas prices and market anticipation of the
implications of the increased 2030 climate ambition.
The higher price of emission allowances led to a substantial increase in total revenues from
auctioning generated by the EU ETS participating countries. Between 2012 and 30 June
2021, these revenues exceeded EUR 83.5 billion, with more than EUR 19 billion generated in
2020 and close to EUR 14 billion in the first half of 2021.131 In phase 3 overall, a high share
(75%) of these revenues was used for climate– and energy-related purposes.
Throughout phase 3, and despite the difficult economic situation due to the COVID-19 crisis
in the 2020 and 2021 compliance cycles, the level of compliance in the EU ETS remained
consistently very high. Operators responsible for over 99% of emissions from both stationary
installations and aviation in most years, had complied with their legal obligations. The EU
ETS architecture remained robust and the administrative organisation put in place across
participating countries has proven to be effective.
The first agreement to link arethe EU ETS with another system – the Swiss ETS, in the last
year of phase 3, fosters increased flexibility and efficiency in both carbon markets, by
enabling operators of both systems to reap the benefits of a larger market.
131 The 2020 figure includes EU27, Iceland, Liechtenstein and Norway, and the UK, while the 2021 figure includes EU27
plus Iceland, Liechtenstein and Norway only.

44
For the following years, as part of the package to deliver on the European Green Deal
adopted in July 2021, the Commission proposed to reinforce and expand the role of carbon
pricing to enable the EU to meet its heightened climate ambitions. The EU ETS remains a
key pillar of EU climate policy. The next carbon market report, due for publication in late
2022, will provide an overview of the operation of the EU ETS in the first year of phase 4.