On the effect of added impurity on crystal purity of urea ... · PDF fileOn the effect of...
21
Heriot-Watt University Research Gateway Heriot-Watt University On the effect of added impurity on crystal purity of urea in an oscillatory baffled crystallizer and a stirred tank crystallizer McLachlan, Hannah; Ni, Xiongwei Published in: Journal of Crystal Growth DOI: 10.1016/j.jcrysgro.2016.03.001 Publication date: 2016 Document Version Peer reviewed version Link to publication in Heriot-Watt University Research Gateway Citation for published version (APA): McLachlan, H., & Ni, X. (2016). On the effect of added impurity on crystal purity of urea in an oscillatory baffled crystallizer and a stirred tank crystallizer. Journal of Crystal Growth, 442, 81–88. DOI: 10.1016/j.jcrysgro.2016.03.001
Transcript of On the effect of added impurity on crystal purity of urea ... · PDF fileOn the effect of...
Heriot-Watt University Research Gateway
Heriot-Watt University
On the effect of added impurity on crystal purity of urea in an oscillatory baffled crystallizerand a stirred tank crystallizerMcLachlan, Hannah; Ni, Xiongwei
Published in:Journal of Crystal Growth
DOI:10.1016/j.jcrysgro.2016.03.001
Publication date:2016
Document VersionPeer reviewed version
Link to publication in Heriot-Watt University Research Gateway
Citation for published version (APA):McLachlan, H., & Ni, X. (2016). On the effect of added impurity on crystal purity of urea in an oscillatory baffledcrystallizer and a stirred tank crystallizer. Journal of Crystal Growth, 442, 81–88. DOI:10.1016/j.jcrysgro.2016.03.001

General rightsCopyright and moral rights for the publications made accessible in the public portal are retained by the authors and/or other copyright ownersand it is a condition of accessing publications that users recognise and abide by the legal requirements associated with these rights.
If you believe that this document breaches copyright please contact us providing details, and we will remove access to the work immediatelyand investigate your claim.
Download date: 07. May. 2018

Author’s Accepted Manuscript
On the effect of added impurity on crystal purity ofurea in an oscillatory baffled crystallizer and astirred tank crystallizer
Hannah McLachlan, Xiong-Wei Ni
PII: S0022-0248(16)30073-2DOI: http://dx.doi.org/10.1016/j.jcrysgro.2016.03.001Reference: CRYS23227
To appear in: Journal of Crystal Growth
Received date: 12 October 2015Revised date: 29 February 2016Accepted date: 3 March 2016
Cite this article as: Hannah McLachlan and Xiong-Wei Ni, On the effect ofadded impurity on crystal purity of urea in an oscillatory baffled crystallizer anda stirred tank crystallizer, Journal of Crystal Growth,http://dx.doi.org/10.1016/j.jcrysgro.2016.03.001
This is a PDF file of an unedited manuscript that has been accepted forpublication. As a service to our customers we are providing this early version ofthe manuscript. The manuscript will undergo copyediting, typesetting, andreview of the resulting galley proof before it is published in its final citable form.Please note that during the production process errors may be discovered whichcould affect the content, and all legal disclaimers that apply to the journal pertain.
www.elsevier.com/locate/jcrysgro
1
On the effect of added impurity on crystal purity of urea in an oscillatory baffled crystallizer
and a stirred tank crystallizer
Hannah McLachlan and Xiong-Wei Ni*
EPSRC Centre for Continuous Manufacturing and Crystallization (CMAC), Centre for Oscillatory
Baffled Reactor Applications (COBRA), School of Engineering and Physical Science, Heriot-Watt
University, Edinburgh, EH14 4AS, UK
*the corresponding author, tel: +441314513781; fax: + 441314513129; email:[email protected]
Abstract
Previous work has indicated that crystals produced in oscillatory baffled crystallisers (OBC) from a
relatively ‘pure’ starting environment gave statistically higher purities than that in stirred tank
crystallisers (STC) under comparable conditions. In this work, a known amount of biuret (the
impurity) was added to the ‘pure’ urea system and the results show that the OBC still produced
higher purity crystals than the STC, although these purity values were statistically lower than from
the ‘pure’ environment in both vessels. By evaluating crystallisation rates of both urea and biuret,
we noticed that these rates are higher in the STC than in the OBC, which would have led to small
crystals in the former vessel. The CSD data however gave the opposite result where the CSD is wider
with more, large crystals in the STC than in the OBC, in particular in the presence of added impurity.
These larger crystals are likely formed due to agglomeration coupled with incorporation of impurity,
which leads to a lower purity.
Keywords: Crystallization; Purity; Impurity; Cooling; Mixing; Oscillatory baffled crystallizers; Stirred
tank crystallizers
Introduction
Crystallization is an important purification tool in pharmaceutical and chemical industries [1, 2], as
any unwanted impurity can cause defect in product quality or side effects in patients [3, 4],
consequently the production of high purity crystals is paramount. Cooling crystallization is one of the
more popular forms of crystallization and involves lowering the solution temperature beyond its
saturation point to induce nucleation [5]. Generally a decrease in crystal purity is attributed to
either mother liquor entrapped between agglomerating single crystals or specific impurity being
included in the growing crystals [6].
A stirred tank crystallizer (STC) is often used to carry out crystallizations in the pharmaceutical
industry and generally consists of a large jacketed vessel fitted with an impeller to mix the contents.
This is a well understood process with Regulatory approval and has advantages of optimized
2
productivity and flexibility of processing multiple drugs. The STC is however prone to poor mixing
and heat transfer [7], depending on the type of impeller used, leading to problematic scale up and
inconsistent crystal qualities. Efficient mixing and heat transfer leading to better temperature
control are key parameters in cooling crystallisation and can be achieved in the oscillatory baffled
crystallizer (OBC) [8-10] which has attracted increasing attention from the pharmaceutical industry.
Previous investigations [11] have shown that higher purity crystals were obtained in the OBC under
all comparable conditions. This was likely caused by the combination of a higher supersaturation
level obtained in the STC with a lower temperature required to induce nucleation. This allowed less
time for crystal growth and subsequently smaller single crystals that were more likely to
agglomerate when mixing became poorer due to increased solid loading upon further cooling in the
STC [12]. The aim of this work is to extend the previous research by investigating the effect of an
impure starting environment on the final crystal purity at different cooling rates and mixing
intensities.
Experimental Set-Up, Calibration and Procedures
Experimental system
The OBC consists of a glass column 76 mm in diameter and 1 L in volume, with a working volume of
0.5 L. Two stainless steel orifice baffles are connected by metal rods to form a baffle string; these
are attached to a linear actuator above the OBC vessel. Different oscillation amplitudes and
frequencies can be delivered by the actuator via a control box, therefore providing the oscillatory
motion within the column. The outer diameter, orifice diameter and spacing of the baffles are 72
mm, 35 mm and 52 mm respectively, giving the overall surface area of the baffle string as 13320
mm2. The temperature within the column was achieved by controlling the jacket temperature using
a water bath (Grant Instruments GP 200/R2), thus enabling different linear cooling rates to be
operated.
Figure 1 – Schematic illustration of STC and OBC set-up
The STC is a jacketed glass vessel, 90 mm in diameter, with a total volume of 1 L and a working
volume of 0.6 L. A stainless steel two-blade flat-paddle impeller, 60 mm in diameter, was used to
generate mixing and was centrally aligned within the vessel. The impeller was attached to an
overhead stirrer to control the rotation speeds. Four stainless steel wall-baffle inserts were added
into the system to aid mixing. The total surface area of the impeller and wall baffles in contact with
the solution is 3070 mm2. Temperature control was identical to that used in the OBC. The schematic
illustration of both STC and OBC is given in Figure 1.
3
To ensure comparable experimental conditions, the power density or dissipation rate was kept
approximately equal. The determinations of power density are well documented for both the STC
[13] and OBC [9]. The mixing conditions for each crystallizer are outlined in Table 1.
Table 1 – Mixing conditions and corresponding mixing intensities
Experimental compound
Urea was the model compound and its chemical structure is shown in Figure 2. This compound was
selected as it is relatively safe, highly soluble in water, stable and has only one known polymorph
under normal process conditions. Technical grade urea was sourced from VWR with an average
initial purity of 95 %.
Figure 2 – Chemical structure of urea
For the ‘impure’ tests, specific amounts of impurity (biuret with an average purity of 97 % from
Acros Organics) were added into both vessels to investigate its effect on crystal purity. Biuret is a
main condensation product of two urea molecules [14] and its structure (Figure 3) is similar to that
of urea.
Figure 3 – Chemical structure of biuret
When urea crystallizes as a pure compound it forms long, needle-like crystals. This habit is
distorted when impurity is present within the crystal [14], becoming a more cubic shape as the
incorporation of biuret increases towards 5 wt. %. This change in habit can be used to verify
whether any impurity is being incorporated into the product crystal.
Procedure
For each experimental run, a certain amount of technical grade urea was weighed using an
electronic balance and was poured into the vessel using a funnel to minimise loss. To this the
required volume of distilled water was added, as indicated by the previously confirmed solubility
curve. The base amount of urea was kept the same in the all runs, however in the added impurity
(AI) experiments specific amounts of biuret were mixed into the solutions to achieve the impurity
level of 5 wt. % (5 % AI). The solution was then heated to 40 °C until all the solid had dissolved and
was held at this temperature for one hour under the required mixing. The solution was then cooled
at a given linear rate to a final temperature. Once the final temperature had been reached, the
4
solution temperature was held under mixing for a further 30 minutes to allow the crystals to grow.
The solution conditions and components added to each system are shown in Table 2.
Table 2 – Components added to the systems and operating temperatures
From Table 2 it can be seen that the final temperature of crystallization was lowered in the
impure system. This is related to the effect that the impurity has on the nucleation and crystal
growth of the system [15, 16], as the presence of impurity has been shown to suppress growth by
blocking the addition sites on some crystal surfaces [15]. This can lead to an increase in the
induction time of the system and a reduction in the noted nucleation temperature. Prior to
experiments, trials were undertaken in-house to understand the effect of the final temperature on
the system at each impurity level. The effect of lowering the final temperature to 20 °C at the 0 % AI
level was an increase in the overall yield with a minimal drop in purity, due to the increased amount
of crystallized solids observed within each vessel. The downside of this is poorer mixing over time
due to the excessive solids leading to more agglomeration and ultimately the slightly lower purity.
In contrast to the case of 0 % AI, nucleation did not universally occur when cooling was stopped at
24 °C for the 5 % AI, e.g. it never occurred in the STC and it only took place at certain conditions in
the OBC even then it did not always lead to crystal growth. This is related to the aforementioned
effect of impurity on the nucleation and crystal growth of the system [16]. As a consequence of this,
the final temperature was lowered to 20 °C for the 5 % AI system to ensure that crystallization had
occurred in both vessels to a level which can be analysed.
Following completion of each experimental run, the crystallizer was dismantled with the flow in
the jacket left on in order to maintain the final temperature. The slurry was then poured into a pre-
warmed beaker and taken immediately to a special ‘temperature controlled box’. This box was built
so that the temperature can precisely be controlled and maintained throughout the filtration and
washing process, therefore minimising any additional crystallization which may occur due to
potential lower room temperature during these downstream separation processes. Within the box,
the slurry was filtered using a Büchner filter attached to a vacuum pump and two washes of
isopropanol (2 x 50 ml) were then applied to remove any remaining mother liquor from crystal
surfaces. Isopropanol was selected as the wash liquor based on multiple washing trials carried out
to establish the best filtration-washing medium and methodology that removes mother liquor
without causing any further nucleation by means of anti-solvent crystallisation or possible
dissolution of crystals in the wash liquor. In addition, isopropanol is relatively safe and has a low
urea solubility [17] compared with other possible wash solvents. The samples were then transferred
into a dish and dried in an oven overnight to give consistent drying conditions for all batches. Once
dried, the solids were weighed to obtain the yields and then transferred into sample bottles before
being analysed further.
Calibration for purity measurement
5
To quantify the purity of the crystals produced, off-line Fourier Transform Infra-Red (FTIR)
spectroscopy with the Shimadzu Bench-top ATR-FTIR Prestige-21 was used. Prior to the analysis, a
calibration curve was established by dissolving high purity urea (99.5% pure) in distilled water to
form a series of solutions with known concentrations. A small amount of the sample was placed on
the analysis plate of the SPECAC® module fitted into the FTIR and peak absorbance measurements
were taken at the specific wave-number of the ‘urea’ peak, around 1460 cm-1. This peak was the
clearest indication of urea concentration in various solution and solid samples, and relates to the N-
C-N asymmetric bond stretching of the urea molecule [18]. Following these measurements and using
the in-built Shimadzu quantification package, the off-line calibration curve shown in Figure 4 (open
squares) was produced.
Once the calibration curve has been established, each individual sample can be analysed. The
procedure for determining purity for each run is as follows: a specific amount of dry sample was
accurately weighed (to 4 decimal places) and recorded before the specific volume of distilled water
was added. Following dissolution, 0.5 ml of the solution was placed on top of the diamond
embedded in the off-line plate and the peak height registered. The corresponding urea
concentration was then determined using the calibration curve. To ensure repeatability, two
repeats for each sample were performed; with the plate and the diamond being thoroughly cleaned
between each run. A background scan was also taken between runs to ensure that any residue
present from previous samples was accounted for and did not affect the calculated concentration of
the sample. The purity can then be evaluated by the ratio of the measured concentration from the
sample divided by the theoretical concentration of the samples. The latter is calculated from the
solid added into the sample, assuming that the initial solid collected from the experiment was 100 %
pure.
Figure 4 – Off-line and on-line calibration curve of peak height vs. urea concentration
Calibration for solution concentration measurement
An advantage of the off-line FTIR system is that it has a relatively short signal path length, minimizing
the loss of IR signals which are consequently strong with little interference [19]. There are
disadvantages however, one of these is that the sample plate is not temperature controlled and can
only be operated at room temperature. This limits the range of concentrations which can be
analysed, as higher concentrations need corresponding high temperatures to ensure that the entire
solid added is dissolved and the reading is accurate, particularly when impurity is present within the
system. The other main disadvantage of the off-line system is that in order to follow the
concentration of the system during crystallization, samples would need to be removed from the
vessel constantly and then analysed [2]. This could cause issues with the reliability of the data as the
continued removal could affect the system, possibly causing nucleation of the supersaturated
solution [20] or invalid results due to the variations of local room temperature as the measurement
6
is strongly temperature dependent [21, 22]. To overcome these limitations an in-situ ATR-FTIR
probe was used.
To minimise potential errors [23], a second calibration curve must be produced under the new
instrumental conditions. This has to account for several additional factors including the probe
having a much longer path length, the higher concentration range used, any possible solution
temperature effects [24] and high temperature signal drift [25]. Due to this longer path length the IR
output is likely to be low compared to that of the off-line system, therefore an external MCT
(mercury cadmium telluride) detector is used which has a much higher sensitivity level than the
DLaTGS (deuterated L-alanine doped triglycine sulfate) detector used in the off-line system [26]. The
calibration is carried out in a similar manner to the off-line system, and each sample is analysed
using the on-line probe at various set temperatures. The on-line calibration curve shown in Figure 4
(filled squares) was then produced using MATLAB® and the partial least squares (PLS) function. Note
that the angle and bend-radius of the FTIR probe can also have an effect on the signal obtained [27]
and a standardisation procedure was performed by taking the raw data obtained from the peak
trace and plotting it onto a Microsoft Excel® spreadsheet. By analysing the graph produced, any high
temperature signal drift noted was removed from the raw data. The resulting curve was then
normalised to the peak height corresponding to the actual recorded solution concentration. Once
the initial concentration of the solution as the start point had been fixed, any alteration in signal
intensity was applied to the remaining points of the peak trace. The calibration correlation was
subsequently used to convert the peak traces to concentrations, from which concentration and
supersaturation curves can be constructed.
Experimental Results and Discussions
The results from the added impurity work are analysed in two different ways: initially purity data
with the presence of impurity are compared between the OBC and STC, this is to investigate whether
the trends obtained in the ‘pure’ system are still valid in an impure starting environment. Secondly
purity data with and without the addition of impurity are compared in each vessel to gain
understanding of how the added impurity has affected the overall purity.
Comparisons between vessels
Before the effect of impurity can be examined it is important to present the baseline data without
biuret, i.e. the 0 % AI system; this is tabulated in Table 3 for three cooling rates at a fixed mixing
intensity and three different mixing intensities at a fixed cooling rate. Statistical analysis was
performed for each condition using the non-parametric Kolmogorov-Smirnov Statistical test [28]
which calculates a statistical probability value (P), giving an indication of whether the data pairs are
similar. For data to be statistically different, the P value should be less than 0.1.

7
Table 3 – Purity results for the ‘pure’ system (0 % AI)
For the ‘pure’ system, the OBC produced crystals with a statistically higher purity than the STC at
almost all investigated conditions. It is also noted in Table 3 that the crystal purity decreased in both
vessels as the cooling rate increased. This was in line with previous work by Givand et. Al [29], who
indicated that this purity drop was related to an increased rate of supersaturation generation
causing more crystal inclusions [6]. Furthermore, the purity in Table 3 increased as the mixing
intensity was increased, this is probably due to a decrease in the size of agglomerates [30] with the
increased probability of crystal attrition at faster mixing.
Table 4 – Supersaturation level upon nucleation for the ‘pure’ system (0 % AI)
Analysis of the level of supersaturation at nucleation (Table 4) and the corresponding nucleation
temperature (Table 5) has indicated that the combination of a higher supersaturation level and a
lower nucleation temperature in the STC gave the crystals less time to grow. This consequently led
to small crystals that were more likely to agglomerate when the increased amount of solids in the
vessel resulted in poorer mixing [12]. The inclusion of mother liquor in the said agglomeration is the
main mechanism for the purity differences.
Table 5 – Nucleation temperatures for the ‘pure’ system (0 % AI)
The same line of approach was adopted for the added impurity experiments with the purity data
given in Table 6, supersaturation level at nucleation in Table 7 and the associated nucleation
temperatures at Table 8.
Table 6 – Purity results for the ‘impure’ system (5 % AI)
Table 7 – Supersaturation level upon nucleation for the ‘impure’ system (5 % AI)
Table 8 – Nucleation temperatures for the ‘impure’ system (5 % AI)
8
The purity values in Table 6 still show higher final crystal purities in the OBC than in the STC at
every condition, with similar trends for the supersaturation at nucleation, as well as the nucleation
temperature. However, almost all the data pairs between the OBC and STC are statistically similar,
indicating that the results evaluated in Tables 7 & 8 cannot explain the differences in purity noted in
Table 6.
Comparison between impurity levels
For simplicity only one condition (a cooling rate of 0.75 °C/min and a mixing intensity of 750 W/m3)
is used for the comparison and is representative of all five conditions outlined in the previous
section. It has been proposed that a faster urea crystallization rate is related to an increased
amount of urea being crystallized with more small single crystals. Similarly an increased
crystallization rate for the biuret is linked to more biuret leaving the solution and being incorporated
into growing urea crystals. In order to establish the parameters responsible for the observed trends,
crystallisation rates of urea and biuret were determined directly from the concentration profiles
measured by FTIR. The crystallisation rate (combining both nucleation and growth for simplicity) is
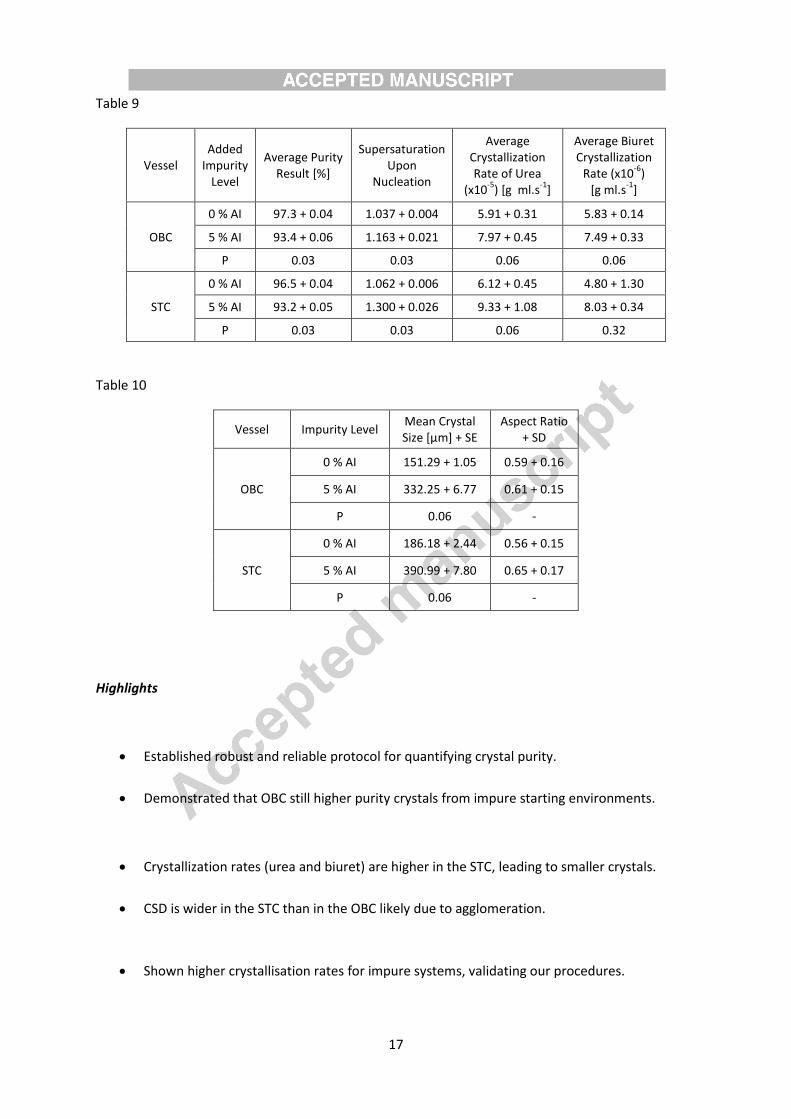
taken as the inverse rate of the decreasing solute concentration. Table 9 summarizes all
aforementioned parameters with the standard error value and the corresponding statistical
probability factor (P). It should be noted that due to trace amounts of biuret in the ‘pure’ urea, a
crystallization rate for the biuret is obtained at the 0 % level.
From these results in Table 9, we see that the purity and the supersaturation level upon
nucleation are statistically different between the two impurity levels. Furthermore, there are
marked differences in the crystallization rates between the two impurity levels with much faster rate
for the 5 % AI than for the ‘pure’ system. It is interesting that the crystallisation rates of both urea
and biuret are faster in the STC than these in the OBC, suggesting smaller crystal sizes in the former
than in the latter. The crystal size distributions (CSD) obtained from the Mastersizer in Figure 5 show
that there are longer tails in the size distributions of the STC than the OBC; indicating that there are
more larger crystals in this vessel than in the OBC, particularly at 5% Al. The mean sizes listed in
Table 10 confirm the finding for both starting impurity levels. The larger sizes of crystals are most
likely formed due to a number of possible mechanisms: the change of crystal habit due to the
incorporation of biuret that inhibits crystal growth in certain phases while promoting other sides or
the increased agglomeration that traps mother liquor containing impurity or the combination of
both.
Table 9 –Results for both the ‘pure’ (0 % AI) and ‘impure’ system (5 % AI)
Furthermore, the CSDs in the OBC are narrower than that in the STC, particularly for 5% Al; this
would indicate that there is increased crystal attrition due to more uniform mixing in the former

9
than in the latter, preventing some agglomeration from taking place and minimizing the activities of
inclusion of mother liquor containing biuret.
Figure 5 – CSD for both ‘pure’ (0 % AI) and ‘impure’ (5 % AI) systems in OBC and STC
Table 10 – Mean crystal size and shape factors for OBC and STC at both impurity levels
Figure 6 – Microscopy images of crystals with 0 % AI and 5 % AI in both OBC and STC
The microscopic images of crystals obtained at both impurity levels in Figure 6 show that the
images of the crystals in the OBC are similar in length between the 0 and 5 % level (Fig. 5 a & b), but
much wider for crystals of the latter. This increase in crystal width is likely due to the increasing
incorporation of the biuret, which decreases growth along certain faces causing the production of
more block-like or cubic crystals [31]. Using the Malvern Morphologi G3, the aspect ratio of a crystal
can be determined, quantifying the ratio between the width and the length of the crystals [32],
where the value of 1 indicates a fully cubic crystal. The increased aspect ratio at 5% Al (Table 10) is in
good agreement with the images presented in Figure 6.
Unlike the ‘block’ like crystals produced in the OBC, the crystal images of the STC at 5 % AI are
more cubic in nature (Figure 6 (d)). These broader crystals are an indicator of a change in crystal
habit due to more impurity incorporation at this condition. The larger aspect ratio in the STC in
Table 10 also supports our discussion.
Conclusion
In our previous publication, we verified confidential industrial trials that crystal purities obtained in
the OBC are higher than in the STC at comparable operational conditions in a “pure” starting
environment. We demonstrated that the combination of a higher supersaturation level and a lower
nucleation temperature in the STC was the possible reason for the measured outcomes, as these led
to small crystals that are prone to agglomerate, which traps solvent or impurity in the crystal cluster.
In this work, we extend our effort to an “impure” starting environment with the addition of a known
amount of biuret. The results show that the purity of the crystals produced in the OBC is still higher
than that in the STC, albeit not statistically. By evaluating the crystallisation (nucleation) rates (taking
it as the inverse rate of the decreasing solute concentration at nucleation temperature) of both urea
and biuret, we notice that these rates are higher in the STC than in the OBC, which would have led to
small crystals in the former vessel. The CSD data however gave the opposite result where the CSD is
wider with more and larger crystals in the STC than in the OBC, in particular in the presence of
biuret. These larger crystals are likely due to either the change of crystal habits upon incorporation
of biuret or the enhanced agglomeration that traps mother liquor containing impurity or both,

10
leading to lower purity of crystals. In addition, higher crystallisation rates are obtained for the
impure system than for the pure system, this validates our methodology and experimental
procedures.
Acknowledgement
The authors would like to thank EPSRC and the Centre for Innovative Manufacturing in Continuous
Manufacturing and Crystallization for their support and funding.
Nomenclature
f = Frequency of Oscillation [Hz]
NS = Agitator Speed [s-1]
xo = Centre-to-Peak Oscillation Amplitude [m]
ω = Angular Frequency [rad s-1]
% AI = Percentage Added Impurity
SE = Standard Error
SD = Standard Deviation
References
1. Takiyama, H., Supersaturation operation for quality control of crystalline particles in solution crystallization. Advanced Powder Technology, 2012. 23(3): p. 273-278.
2. Dunuwila, D.D. and K.A. Berglund, ATR FTIR spectroscopy for in situ measurement of supersaturation. Journal of Crystal Growth, 1997. 179(1-2): p. 185-193.
3. Myerson, A.S., Handbook of Industrial Crystallization. Second ed. 2002: Butterworth-Heinemann.
4. Bari, S.B., et al., Impurity profile: Significance in Active Pharmaceutical Ingredient. Eurasian Journal of Analytical Chemistry, 2007. 2(1): p. 32.
5. Davey, R. and J. Garside, From Molecules to Crystallizers: An Introduction to Crystallization. First ed. Oxford Chemistry Primers. Vol. 86. 2000, Oxford: Oxford University Press. 79.
6. Saito, N., et al., Liquid inclusions in crystals produced in suspension crystallization. Chemical Engineering Journal, 2000. 79(1): p. 53-59.
7. Amanullah, A., et al., The Influence of Impeller Type in Pilot Scale Xanthan Fermentations. BIOTECHNOLOGY AND BIOENGINEERING, 1998. 57(1): p. 95-108.
8. Ni, X., et al., Review Paper: Mixing Through Oscillations and Pulsations—A Guide to Achieving Process Enhancements in the Chemical and Process Industries. Chemical Engineering Research and Design, 2003. 81: p. 373-383.
9. Baird, M.H.I. and P. Stonestreet, Energy Dissipation in Oscillatory Flow within a Baffled Tube. CHEMICAL ENGINEERING RESEARCH AND DESIGN, 1995. 73(5): p. 503.
10. Mackley, M.R., G.M. Tweddle, and I.D. Wyatt, Experimental heat transfer measurements for pulsatile flow in baffled tubes. Chemical Engineering Science, 1990. 45(5): p. 1237-1242.
11. McLachlan, H.R. and X. Ni, An investigation into parameters affecting crystal purity of urea in a stirred tank and an oscillatory baffled crystallizer. Chemical Engineering Communications, 2016.

11
12. Brunsteiner, M., et al., Toward a Molecular Understanding of Crystal Agglomeration. Crystal Growth & Design, 2004. 5(1): p. 3-16.
13. Nagata, S., Mixing: principles and applications. 1975: Kodansha/Wiley, 1975. 14. Scott, C. and S. Black, In-Line Analysis of Impurity Effects on Crystallisation. ORGANIC
PROCESS RESEARCH AND DEVELOPMENT, 2005. 9(6): p. 890-893. 15. Mullin, J.W., Crystallization - Thrid Eddition. 3 ed. 1997, Oxford: Butterworth-Heinimann.
521. 16. Ulrich, J. and C. Strege, Some aspects of the importance of metastable zone width and
nucleation in industrial crystallizers. Journal of Crystal Growth, 2002. 237–239, Part 3: p. 2130-2135.
17. Lee, F.-M. and L.E. Lahti, Solubility of urea in water-alcohol mixtures. Journal of Chemical & Engineering Data, 1972. 17(3): p. 304-306.
18. Rajalakshmi, T., et al., Characterization of urea single crystals. Materials Science and Engineering: B, 1996. 39(2): p. 111-115.
19. Van Overbeke, A., W. Baeyens, and W. Van den Bossche, Quantitative Fourier transform infrared/attenuated total reflectance analysis of ketoprofen in some pharmaceutical formulations. Vibrational Spectroscopy, 1995. 9(2): p. 121-130.
20. Nasr-El-Din, H.A., R.S. Mac Taggart, and J.H. Masliyah, Local solids concentration measurement in a slurry mixing tank. Chemical Engineering Science, 1996. 51(8): p. 1209-1220.
21. Hlozny, L., A. Sato, and N. Kubota, (Short Communications) On-Line Measurement of Supersaturation during Batch Cooling Crystallization of Ammonium Alum. JOURNAL OF CHEMICAL ENGINEERING OF JAPAN, 1992. 25(5): p. 604.
22. Togkalidou, T., et al., Solute concentration prediction using chemometrics and ATR-FTIR spectroscopy. Journal of Crystal Growth, 2001. 231(4): p. 534-543.
23. Christian, Analytical chemistry. 1994: Wiley, 1994.
5th ed. 24. Groen, et al., An Examination of the Crystallization of Urea from Supersaturated Aqueous
and Aqueous-Methanol Solutions as Monitored In-Process Using ATR FTIR Spectroscopy. Crystal Growth & Design, 2004. 4(5): p. 930-936.
25. Wülfert, F., W.T. Kok, and A.K. Smilde, Influence of Temperature on Vibrational Spectra and Consequences for the Predictive Ability of Multivariate Models. Analytical Chemistry, 1998. 70(9): p. 1761-1767.
26. Scientific, T. Application Note: 50730 - HIgh-Speed, High-Sensitivity Detectors for Use in the Mid-Infrared Spectral Range. Application Note 2007 [cited 2014 03-12-2014]; Types of IR Dectors Explanation]. Available from: http://mmrc.caltech.edu/FTIR/Nicolet/Nicolet%20Tech%20Notes/MCT%20detector%20Thermo.pdf.
27. Heigl, N., et al., Quantitative on-line vs. off-line NIR analysis of fluidized bed drying with consideration of the spectral background. European Journal of Pharmaceutics and Biopharmaceutics, 2013. 85(3, Part B): p. 1064-1074.
28. Physics, D.o. Kolmogorov-Smirnov Test. 2015 [cited 2015 28/01/2015]; Available from: http://www.physics.csbsju.edu/stats/KS-test.html.
29. Givand, J.C., A.S. Teja, and R. W. Rousseau, Manipulating crystallization variables to enhance crystal purity. Journal of Crystal Growth, 1999. 198-199, Part 2(0): p. 1340-1344.
30. Charmolue, H. and R.W. Rousseau, L-serine obtained by methanol addition in batch crystallization. AIChE Journal, 1991. 37(8): p. 1121-1128.
31. Davey, R., W. Fila, and J. Garside, The influence of biuret on the growth kinetics of urea crystals from aqueous solutions. Journal of Crystal Growth, 1986. 79(1-3, Part 2): p. 607-613.
32. Instruments, M., Morphologi G3 User Manual. 5 ed. MAN0410 Issue 5.0 September 2013. Vol. 5. 2013. 1 - 284.

12
Overhead
Driver
Stirrer
Guide
Stirred Tank
Vessel
Water Bath
Impellor
Linear Motor
Moving Baffle
OBC
Water Bath
Baffles
Figures and Tables
Figure 1
Figure 2
Figure 3

13
0
2
4
6
8
10
12
0 500 1000 1500 2000 2500 3000 3500
Vo
lum
e D
ensi
ty (
%)
Size Classes (μm)
0 % AI OBC
5 % AI OBC
0 % AI STC
5 % AI STC
Figure 4
Figure 5
y = 0.3581x + 0.0467 R² = 0.986
y = 0.4795x + 0.1115 R² = 0.9914
0
0.1
0.2
0.3
0.4
0.5
0.6
0.7
0.8
0.9
1
0 0.5 1 1.5 2
Pe
ak H
eigh
t (A
bs)
Concentration (g ml-1)
Off-Line
On-Line

14
Figure 6
Table 1
Mixing
Intensity
(W m-3
)
OBC STC
Frequency
[f] (Hz)
Angular Frequency
[ω] (Hz)
Centre-to-Peak
Amplitude
[xo] (mm)
Stirrer Speed
[Ns]
(RPM)
20 0.6 3.77 10 104
170 1.2 7.54 10 201
750 2 12.57 10.5 351

15
Table 2
System
Weight
Urea
Added
(g)
Volume
Distilled
Water
Added (ml)
Urea
Concentration
(g/ml)
Weight
Biuret
Added
(g)
Added
Impurity
(wt. %)
Initial
Temperature
(°C)
Final
Temperature
(°C)
OBC
(0 % AI) 332.5 250 1.33 0 0 40 24
STC
(0 % AI) 399 300 1.33 0 0 40 24
OBC
(5 % AI) 332.5 250 1.33 15.8 5 40 20
STC
(5 % AI) 399 300 1.33 19 5 40 20
Table 3
0 % AI Cooling Rate [°C min-1
]
% Average Purity + SE
0.25 0.50 0.75
OBC STC P OBC STC P OBC STC P
Mixing Intensity [W m
-3]
20 96.1 + 0.13
95.8 + 0.07
0.32
170 96.8 + 0.03
96.3 + 0.08
0.03 96.4 + 0.07
95.9 + 0.07
0.06 96.2 + 0.05
95.5 + 0.14
0.06
750 97.3 + 0.04
96.5 + 0.04
0.03
Table 4
0 % AI Cooling Rate [°C min-1
]
Supersaturation level + SE
0.25 0.50 0.75
OBC STC P OBC STC P OBC STC P
Mixing Intensity [W m
-3]
20 1.059 + 0.005
1.100 + 0.003
0.03
170 1.080 + 0.004
1.153 + 0.017
0.06 1.074 + 0.003
1.103 + 0.001
0.03 1.035 + 0.014
1.040 + 0.004
0.32
750 1.037 + 0.004
1.062 + 0.006
0.03

16
Table 5
0 % AI Cooling Rate [°C min-1
]
Nucleation Temperature
+ SE (°C)
0.25 0.50 0.75
OBC STC P OBC STC P OBC STC P
Mixing Intensity [W m
-3]
20 28.44 +
0.24 28.20 +
0.09 0.98
170 30.39 +
0.13 29.63 +
0.27 0.15
29.55 + 0.26
28.81 + 0.29
0.32 28.59 +
0.09 29.34 +
0.12 0.03
750 29.83 +
0.05 29.48 +
0.14 0.32
Table 6
5 % AI Cooling Rate [°C min-1
]
% Average Purity + SE
0.25 0.50 0.75
OBC STC P OBC STC P OBC STC P
Mixing Intensity [W m
-3]
20 95.0 + 0.06
94.8 + 0.23
0.32
170 93.1 + 0.26
92.6 + 0.14
0.32 94.0 + 0.04
93.4 + 0.16
0.32 93.5 + 0.10
93.2 + 0.05
0.32
750 93.4 + 0.06
93.2 + 0.05
0.32
Table 7
5 % AI Cooling Rate [°C min-1
]
Supersaturation level + SE
0.25 0.50 0.75
OBC STC P OBC STC P OBC STC P
Mixing Intensity [W m
-3]
20 1.138 + 0.012
1.195 + 0.030
0.32
170 1.191 + 0.014
1.202 + 0.039
0.32 1.103 + 0.020
1.176 + 0.015
0.32 1.130 + 0.017
1.198 + 0.004
0.32
750 1.163 + 0.021
1.300 + 0.026
0.32
Table 8
5 % AI Cooling Rate [°C min-1
]
Nucleation Temperature
+ SE (°C)
0.25 0.50 0.75
OBC STC P OBC STC P OBC STC P
Mixing Intensity [W m
-3]
20 22.77 +
0.23 21.78 +
0.08 0.03
170 24.13 +
0.10 23.18 +
0.20 0.32
25.77 + 0.02
22.68 + 0.38
0.03 24.06 +
0.48 23.61 +
0.15 0.32
750 22.57 +
0.15 21.72 +
0.04 0.03
17
Table 9
Vessel Added
Impurity Level
Average Purity Result [%]
Supersaturation Upon
Nucleation
Average Crystallization Rate of Urea
(x10-5
) [g ml.s-1
]
Average Biuret Crystallization
Rate (x10-6
) [g ml.s
-1]
OBC
0 % AI 97.3 + 0.04 1.037 + 0.004 5.91 + 0.31 5.83 + 0.14
5 % AI 93.4 + 0.06 1.163 + 0.021 7.97 + 0.45 7.49 + 0.33
P 0.03 0.03 0.06 0.06
STC
0 % AI 96.5 + 0.04 1.062 + 0.006 6.12 + 0.45 4.80 + 1.30
5 % AI 93.2 + 0.05 1.300 + 0.026 9.33 + 1.08 8.03 + 0.34
P 0.03 0.03 0.06 0.32
Table 10
Vessel Impurity Level Mean Crystal Size [µm] + SE
Aspect Ratio + SD
OBC
0 % AI 151.29 + 1.05 0.59 + 0.16
5 % AI 332.25 + 6.77 0.61 + 0.15
P 0.06 -
STC
0 % AI 186.18 + 2.44 0.56 + 0.15
5 % AI 390.99 + 7.80 0.65 + 0.17
P 0.06 -
Highlights
Established robust and reliable protocol for quantifying crystal purity.
Demonstrated that OBC still higher purity crystals from impure starting environments.
Crystallization rates (urea and biuret) are higher in the STC, leading to smaller crystals.
CSD is wider in the STC than in the OBC likely due to agglomeration.
Shown higher crystallisation rates for impure systems, validating our procedures.

18