Overview of NEMS infrastructre Mark Iredell NEMS-NMMB tutorial February 18, 2014 1.
On the Development of Global Aerosol Assimilation at the NCEP and the Use of Satellite-derived Hourly Global Biomass Burning Emissions Product as Source
Function in Forecast Model
Ho-Chun Huang, Sarah Lu (NCEP/EMC)
and
Xiaoyang Zhang, Shobha Kondragunta (NESDIS/STAR)
JCSDA 9th Workshop, College Park, Maryland, 2011
Acknowledgement
• Youhua Tang, Marina Tsidulko, Caterina Tassone, Jianping Huang,
Jeff McQueen, Jeff Whiting, Dennis Keyser, Jun Wang, Shrinivas
Moorthi, John Derber, Geoff DiMego, Mark Iredell, John Ward,
William Lapenta, and Stephen Lord (NCEP/EMC)
• Arlindo da Silva, Mian Chin, and Dongchul Kim (NASA/GSFC)
• Quanhua (Mark) Liu, Paul van Delst, Fuzhong Weng, Jessica Ram
(NEDSIS/STAR), Yi Song (NESDIS)
• Thomas Diehl (UMBC)
Outline
• Motivation
• The development of NCEP GSI global aerosol data assimilation
• The development of NESDIS Global Biomass Burning Emissions Product
• Future tasks
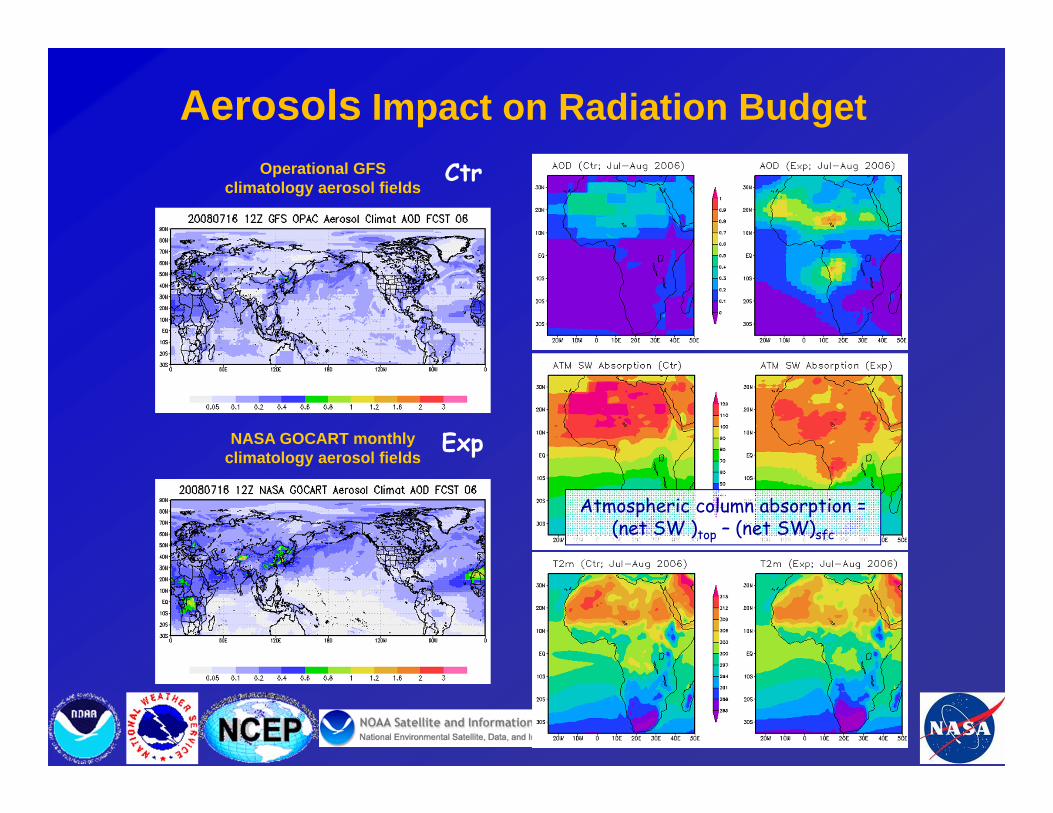
Operational GFSclimatology aerosol fields
NASA GOCART monthly climatology aerosol fields
Aerosols Impact on Radiation BudgetCtr
Exp
Atmospheric column absorption = (net SW )top – (net SW)sfc

The Forward Modelof NCEP GSI Global Aerosol DA
• The National Environment ModelingSystem (NEMS); Mark Iredell (NCEP)
– ESMF Based
– Various physic and dynamic cores fromNOAA models (GFS, FIM, NMMB) areavailable for “select and mix” modelingthrough the “coupler”
– Chemical core is based on NASAGOCART and interacted with GFSdynamic and physic cores (NEMS/GFS-GOCART)
• The inline NEMS/GFS-GOCART dust-only simulation produced a good spatialpattern as compared to observedMODIS AOD but the intensity isunderestimated

Goals for NCEP GSI Aerosol DA
• To improve the global aerosol fields simulated byNEMS/GFS-GOCART
– To improve the performance of NCEP operational weather forecastingsystems
– To improve the performance of NCEP operational National Air QualityForecasting Capability (NAQFC) on particulate matters (PM)forecasting
• To provide a pathway to study aerosol impacts on radianceretrievals in CRTM (within GSI)

Development of GSI Global Aerosol DA Capabilities
• Add MODIS AOD products in NCEP NCO dataflow– MODIS AOD is now operationally pulled by
NCEP NCO to NCEP BUFR Tank
• Modify the NCEP GSI to ingest satellite aerosol products – Create GSI data structures for aerosol DA
– Add read-in modules for MODIS AOD fields
• Modify the NCEP GSI to include the model first guess fields (background)– Based on NEMS/GFS-GOCART aerosol field
output (Sarah Lu)
– Add NEMS I/O modules for meteorology and aerosol first guess and analysis fields

“Good data assimilation needs good forward model”
The Uncertainty of Biomass Burning Source Function
• Fires occur randomly and can be of short duration (e.g.,agricultural fires induced for land clearing) or long duration(e.g., forest fires).
• The intensity and location of fire can change with timeaccording to environmental conditions as well.
• Therefore, it is difficult to estimate and prescribe the fireemissions both in spatial and temporal scale.
• Satellite observations provide a choice of “near-real time”and global fire emissions dataset for operationalforecasting.

Global Biomass Burning Emissions Product (GBBEP) for Operational Use in NCEP GFS-GOCART
• Based on satellite observed Fire Radiative Power (FRP), biomass combustion rate , and emissions factors.
• FRP observed from a constellation of geostationary satellites(GOES, MetoSAT, and MTSAT) that covers most of the globe at a time scale of 15-30 minutes.
• GBBEP hourly average emissions.
Experiments
• From July 01 to September 30 2010• Emissions: hourly/daily observed aggregated to 1°x1° gridded
emissions – NOAA/NESDIS GBBEP hourly emissions– NASA QFED v1 daily value with diurnal profile
NASA Quick Fire Emission Dataset (QFEDv1)• Based on MODIS fire counts onboard Aqua and Terra.• Correlation between MODIS fire counts and Global Fire Emissions
Data (GFED) is used to derive near-real-time daily averaged fire emissions.
• Daily average values with option of using diurnal profile.

NCEP Global Aerosol Modeling Systems
• In-line NEMS/GFS-GOCART is used as the forward model for GSIglobal aerosol data assimilation development.
• Off-line GFS-GOCART is driven by present operational GFS forreal-time dust-only testing since December 2009. It is used inbiomass burning simulations for JSDI.
GOCART : NASA Goddard Chemistry Aerosol Radiation and Transport ModelGFS : NCEP Global Forecast SystemNEMS : NOAA Environmental Modeling System

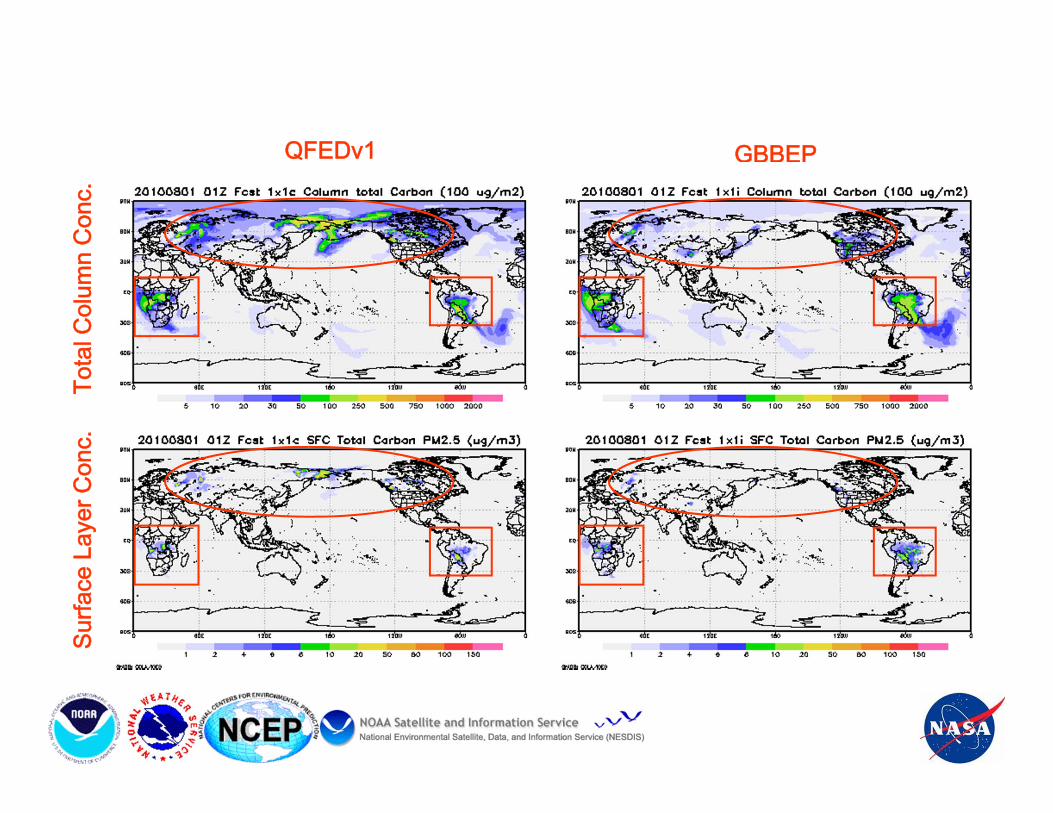
Total Carbon Emissions for GBBEP & QFED (JUL-SEP 2010)
GBBEP
QFED
QFED and GBBEP produced similarspatial patterns and monthlyvariation in total carbon (black +organic carbons) emissions. Duringthe simulated period, both the SouthAmerica and the Africa had frequentfire activities.
In general, QFED has smaller area ofdetected fires but with strongercarbon emissions while GBBEP haslarger area of detected fires withweaker carbon emissions.
There is a limited spatial coverage forgeostationary satellites at highlatitudes. Thus, QFED detectedmore fires in the Russia, theSiberia, and the Canadian Borealforest.

0
200
400
600
800
1000
1200
1400
1600
1800
2000
South America Africa Canada Borial
x 10
^6 K
gC
QFEDGBBEP
July 2010
0
200
400
600
800
1000
1200
1400
1600
1800
2000
South America Africa Canada Boreal
x 10
^6 K
gC
QFEDGBBEP
AUG 2010
0
200
400
600
800
1000
1200
1400
1600
1800
2000
South America Africa Canada Boreal
x 10
^6 K
gC
QFEDGBBEP
Sept 2010
0
500
1000
1500
2000
2500
3000
3500
4000
South America Africa Canada Boreal
x 10
^6 K
gC
QFEDGBBEP
July-Sept 20101.30
0.38
1.06 Canadian Boreal
South AmericaAfrica
Selected regions for comparison
• The GBBEP total carbon emissions were about 30%(in the South America) and 6% (in the Africa) morethan that of QFED during the simulated period.
• GBBEP only produced 38% of QFED total carbonemissions in the Canadian Boreal area.
Comparison between GBBEP and QFED
QFEDv1 GBBEP
Tota
l Col
umn
Con
c.Su
rface
Lay
er C
onc.

The comparison between observed and modeled AOD
CUIABA-MIRANDA 201009
AO
D
3.0 2.4 1.8 1.2 .6 .0
0 5 10 15 20 25 30DAY
CUIABA-MIRANDA 201009
AO
D
3.0 2.4 1.8 1.2 .6 .0
0 5 10 15 20 25 30DAY
CUIABA-MIRANDA 201009
AO
D
3.0 2.4 1.8 1.2 .6 .0
0 5 10 15 20 25 30DAY
Campo_Grande_SONDA 201008
AO
D
3.0 2.4 1.8 1.2 .6 .0
0 5 10 16 21 26 31DAY
Campo_Grande_SONDA 201008
AO
D
3.0 2.4 1.8 1.2 .6 .0
0 5 10 16 21 26 31DAY
Campo_Grande_SONDA 201008
AO
D
3.0 2.4 1.8 1.2 .6 .0
0 5 10 16 21 26 31DAY
AERONET L1.5GBBEPQFED
1. Both model-derived AOD using GBBEP and QFED were much smaller than AERONET observed AOD
2. It is because satellite detected fire appeared only in a small viewing area (e.g., 1 km2), and the derived carbon emissions were quickly diluted in a model grid that has a much larger area (global 1°x1°).
3. Reid et al. (JSTARS, 2010) and Yang et al. (JGR, 2011) found that biomass burning emissions have to be scaled by a factor of 3 in the models.
4. The occurrences of fire event match well with the jump of observed AOD.

Future Tasks
• GSI Global Aerosol Data Assimilation– Obtain the statistics for error covariance matrix of aerosols– Develop capability to assimilate aerosol observations (AOD) – Conduct global aerosol data assimilation – Study impact of aerosol assimilation on NAQFC aerosol forecast– Study impact of aerosol assimilation on global weather forecast
• Global Biomass Burning Emissions Product (GBBEP)– Run in-line NEMS/GFS-GOCART and compare the results with offline
GFS-GOCART simulations– Run NAQFC with forecasted NEMS/GFS-GOCART dust and biomass
burning aerosols LBC and evaluate the runs

Acknowledgement
All PIs of NASA AERONET and MODIS project for theirs effort in establishing and maintaining sites.
Support Operational CONUS Air Quality Forecasting Efforts at NCEP

Sahara dust intrusion Episodes in July 2010; impact on the Gulf Coast and South Atlantic Coast states.
The GFS-GOCART aerosol simulations provide dynamic LBCs toNational Air Quality Forecast Capability (AQFC) to identify theintrusion due to long range transport.
Offline GFS-GOCART dust simulation during 2006 TEXAQSwith LBC coupling CMAQ shows that the timing of dust episode iswell simulated and the improvement of CMAQ PM forecast issignificant.
Corpus Christi - Nat, TX 2006Observed
CO
NC
(ug/
m3)
60
50
40
30
20
10
0
Corpus Christi - Nat, TX 2006
CMAQ base run
CO
NC
(ug/
m3)
60
50
40
30
20
10
0
Corpus Christi - Nat, TX 2006
CMAQ+GFS-GOCART LBC
CO
NC
(ug/
m3)
60
50
40
30
20
10
002AUG 06AUG 10AUG29JUL 02AUG 06AUG 10AUG29JUL 02AUG 06AUG 10AUG
Sahara Dust Intrusion to CONUS During Summertime

Long-Range Transport impact on CONUS PM Forecasting
Mexican FireCanadian Boreal Fire