ON THE DETERMINATION OF THE pH OF THE BLOOD. · PDF fileON THE DETERMINATION OF THE pH OF THE...
18
ON THE DETERMINATION OF THE pH OF THE BLOOD. I. THE ACCURACY OF THE QTJINHYDRONE ELECTRODE FOR DETERMINING THE pH OF BLOOD PLASMA OR SERUM. BY GLENN E. CULLEN AND IMOGENE P. EARLE. (From the Department of Biochemistry, Vanderbilt University School of Medicine, Nashville.) (,Reoeived for publication, December 6, 1927.) INTRODUCTION. The method of measuring hydrogen ion concentration with the quinhydrone electrode, introduced largely through the work of Biilmann and his colleagues (l), has become of great value for a variety of purposes. Its simplicity and especially its economy of material makeit of especial value for biological and clinical work whenever it is possible to use it. Unfortunately, certain conditions which operate against its accuracy are inherent in many body fluids. The conditions which interfere most in studies of body fluid are the slight alkalinity, the presence of proteins, and the oxidation-reduction systems. The influence of these conditions upon the biological application of the quinhydrone electrode has been studied by several workers. La Mer and Parsons (2) determined that it was accurate in buffer mixtures more acid than pH 8. Splrensen,Sldrensen, and Linder- str@m-Lang (3) determined both the reason for, and the quantita- tive relations of the salt error. Fortunately this error is usually negligible in body fluids. Kolthoff (4) has shown that quinhy- drone electrode potentials are unstable in buffer-poor solutions with alkaline reactions, and his experience is in agreement with other workers. He also showed that protein introduced a large error. The protein error has been studied more systematically by Linderstrplm-Lang (5) who has found that it is related to the nature of the protein and to the pH itself. The reports of different workers with blood are at present in 565 by guest on April 27, 2018 http://www.jbc.org/ Downloaded from
Transcript of ON THE DETERMINATION OF THE pH OF THE BLOOD. · PDF fileON THE DETERMINATION OF THE pH OF THE...
ON THE DETERMINATION OF THE pH OF THE BLOOD.
I. THE ACCURACY OF THE QTJINHYDRONE ELECTRODE FOR DETERMINING THE pH OF BLOOD PLASMA OR SERUM.
BY GLENN E. CULLEN AND IMOGENE P. EARLE.
(From the Department of Biochemistry, Vanderbilt University School of Medicine, Nashville.)
(,Reoeived for publication, December 6, 1927.)
INTRODUCTION.
The method of measuring hydrogen ion concentration with the quinhydrone electrode, introduced largely through the work of Biilmann and his colleagues (l), has become of great value for a variety of purposes. Its simplicity and especially its economy of material makeit of especial value for biological and clinical work whenever it is possible to use it.
Unfortunately, certain conditions which operate against its accuracy are inherent in many body fluids. The conditions which interfere most in studies of body fluid are the slight alkalinity, the presence of proteins, and the oxidation-reduction systems. The influence of these conditions upon the biological application of the quinhydrone electrode has been studied by several workers. La Mer and Parsons (2) determined that it was accurate in buffer mixtures more acid than pH 8. Splrensen, Sldrensen, and Linder- str@m-Lang (3) determined both the reason for, and the quantita- tive relations of the salt error. Fortunately this error is usually negligible in body fluids. Kolthoff (4) has shown that quinhy- drone electrode potentials are unstable in buffer-poor solutions with alkaline reactions, and his experience is in agreement with other workers. He also showed that protein introduced a large error. The protein error has been studied more systematically by Linderstrplm-Lang (5) who has found that it is related to the nature of the protein and to the pH itself.
The reports of different workers with blood are at present in 565
by guest on April 27, 2018
http://ww
w.jbc.org/
Dow
nloaded from
566 pH of Serum
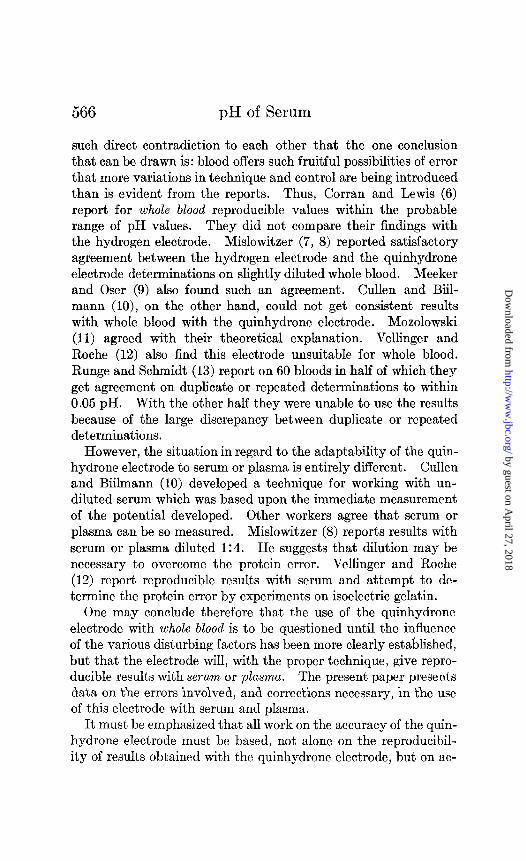
such direct contradiction to each other that the one conclusion that can be drawn is: blood offers such fruitful possibilities of error that more variations in technique and control are being introduced than is evident from the reports. Thus, Corran and Lewis (6) report for whole blood reproducible values within the probable range of pH values. They did not compare their findings with the hydrogen electrode. Mislowitzer (7, 8) reported satisfactory agreement between the hydrogen electrode and the quinhydrone electrode determinations on slightly diluted whole blood. Meeker and Oser (9) also found such an agreement. Cullen and Biil- mann (lo), on the other hand, could not. get consistent results with whole blood with the quinhydrone electrode. Mozolowski (11) agreed with their theoretical explanation. Vellinger and Roche (12) also find this electrode unsuitable for whole blood. Runge and Schmidt (13) report on 60 bloods in half of which they get agreement on duplicate or repeated determinations to within 0.05 pH. With the other half they were unable to use the results because of the large discrepancy between duplicate or repeated determinations.
However, the situation in regard to the adaptability of the quin- hydrone electrode to serum or plasma is entirely different. Cullen and Biilmann (10) developed a technique for working with un- diluted serum which was based upon the immediate measurement of the potential developed. Other workers agree that serum or plasma can be so measured. Mislowitzer (8) reports results with serum or plasma diluted 1: 4. He suggests that dilution may be necessary to overcome the protein error. Vellinger and Roche (12) report reproducible results with serum and attempt to de- termine the protein error by experiments on isoelectric gelat,in.
One may conclude therefore that the use of the quinhydrone electrode with whole blood is to be questioned until the influence of the various disturbing factors has been more clearly established, but that the electrode will, with the proper technique, give repro- ducible results with serum or plasma. The present paper presents data on the errors involved, and corrections necessary, in the use of this electrode with serum and plasma.
It must be emphasized that all work on the accuracy of the quin- hydrone electrode must be based, not alone on the reproducibil- ity of results obtained with the quinhydrone elect,rode, but on ac-
by guest on April 27, 2018
http://ww
w.jbc.org/
Dow
nloaded from
G. E. Cullen and I. P. Earle 567
curate control determinations of the pH by means of the hydrogen electrode.
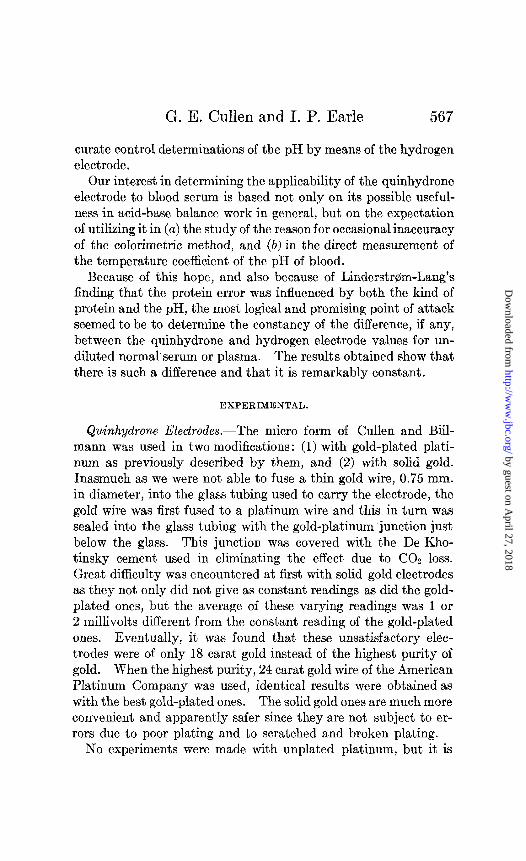
Our interest in determining the applicability of the quinhydrone electrode to blood serum is based not only on its possible useful- ness in acid-base balance work in general, but on the expectation of utilizing it in (a) the study of the reason for occasional inaccuracy of the calorimetric method, and (b) in the direct measurement of the temperature coefficient of the pH of blood.
Because of this hope, and also because of Linderstrem-Lang’s finding that the protein error was influenced by both the kind of protein and the pH, the most logical and promising point of attack seemed to be to determine the constancy of the difference, if any, between the quinhydrone and hydrogen electrode values for un- diluted normal’serum or plasma. The results obtained show that there is such a difference and that it is remarkably constant.
EXPERIMENTAL.
Quinhydrone Electrodes.-The micro form of Cullen and Biil- mann was used in two modifications: (1) with gold-plated plati- num as previously described by them, and (2) with solid gold. Inasmuch as we were not able to fuse a thin gold wire, 0.75 mm. in diameter, into the glass tubing used to carry the electrode, the gold wire was first fused to a platinum wire and this in turn was sealed into the glass tubing with the gold-platinum junction just below the glass. This junction was covered with the De Kho- tinsky cement used in eliminating the effect due to CO, loss. Great difficulty was encountered at first with solid gold electrodes as they not only did not give as constant readings as did the gold- plated ones, but the average of these varying readings was 1 or 2 millivolts different from the constant reading of the gold-plated ones. Eventually, it was found that these unsatisfactory elec- trodes were of only 18 carat gold instead of the highest purity of gold. When the highest purity, 24 carat gold wire of the American Platinum Company was used, identical results were obtained as with the best gold-plated ones. The solid gold ones are much more convenient and apparently safer since they are not subject to er- rors due to poor plating and to scratched and broken plating.
No experiments were made with unplated platinum, but it is
by guest on April 27, 2018
http://ww
w.jbc.org/
Dow
nloaded from
568 pH of Serum
certain that, with the platinum used here, when the gold plating had been cut through, the electrode gave unreliable results. Since some workers appear able to use bare platinum while others are not, it may well be that impurities in the platinum are the cause of the difficulties just as in the case of the gold electrodes.
In cleaning the electrodes, the cement covering the gold-plati- num-glass junction was removed with ether and the electrodes soaked in cleaning mixture (made of highest purity acid and K&&O,) for several hours and in distilled water overnight. The De Khotinsky cement is most easily applied with the aid of a small (radio) electric soldering iron.
Two lots of quinhydrone were used with identical results. One lot was the same as that used by Cullen and Biihnann. The other was obtained from the Eastman Kodak Company.
COz Analysis.-The pC02 was determined with a Haldane- Henderson gas analysis apparatus.
Hydrogen Electrodes.-The hydrogen electrode vessels were the 1% to 2 cc. Clark-Cullen electrodes (14) with thermometer. The whole set-up was in a constant temperature room f 1”. The saturated calomel electrodes also contained thermometers. The platinum electrodes were controlled with the same precaution previously reported (Cullen (15)).
Two refinements were introduced. First, the arm leading to the saturated KC1 bridge was filled with KCl-agar (3 per cent in saturated KCl) to prevent any diffusion into the cell after the first reading. All readings were made with open stop-cocks. Second, all mercury as connecting medium to the lead-off wire to the po- tentiometer was eliminated. The experience in this laboratory has been that this Hg is a constant source of danger to the elec- trodes through contamination of the electrodes, of the plating solutions, and of the cleaning mixture. In our present practice, a copper wire is fused to the platinum connecting wire before fus- ing the platinum wire into the glass. This is an old trick, easily done in the blast lam?& but the majority of platinum electrodes are still shown with Hg connections.
Xtandard Solutions.-All standard solutions including the ~/15 phosphates (S#rensen’s) and the standard reference acid solution were made with water redistilled from KMn04 and Ca(OH)z. For this work it is necessary to remove any traces of Cl2 which are
by guest on April 27, 2018
http://ww
w.jbc.org/
Dow
nloaded from
G. E. Cullen and I. P. Earle 569
present in distilled water, due to occasional overchlorination of the city water. O‘ur final standard is 0.01 N HCl + 0.09 N KCl, made from constant boiling acid and used with the value pH 2.05 (16). The phosphate standards were standardized against this in the hydrogen electrode.
Calculation.-The principle reported before (15, 10) was utilized in calculating the pH values for both electrode systems. That is, the electrode system is set up with a M/15 PO4 solution of known pH, approximately that of the serum to be used later.
From this known pH and from the total potential of the chain, the term e is calculated. e includes the summation of potentials of the reference electrode, liquid junctions, etc. The actual value of the reference electrode is immaterial so long as it is constant. Any idiosyncrasy of an individual electrode is automatically cor- rected. The importance of determining e with a solution of pH approximately that of the unknown has been overlooked. One gain is the elimination of the error due to acid absorbed by the platinum black.
The form&e used were:
(1) Hydrogen electrode, pH = 3z.w.~. - eHr
o.oF&31 at 20”
(2) Quinhydrone electrode, pH = E.M.F. + eQ
0.0581
where en2 and eQ are the E.M.F. values obtained by calculation, the experimental E.M.F. and known pH value of the standard solutions being used. At 20” with our saturated calomel elec- trodes the en2 was constant at 0.2478 volts and the eQ, for solid gold, at 0.4540.
The sign of eQ in (2) is arbitrarily based on the fact that in our practice the two chains
Hg 1 HgCl 1 Saturated KC1 1 Solution 1 Hz
Hg 1 HgCl 1 Saturated KC1 1 Solution + quinhydrone ] Au
are set up with the same reference calomel electrode and are meas- ured with the same potentiometer and galvanometer. Below pH about 7.8 the Hg pole changes its sign when switched from one to
by guest on April 27, 2018
http://ww
w.jbc.org/
Dow
nloaded from
X0 pH of Serum
the other half-electrode. If the quinhydrone electrode were al- ways negative, it would be unnecessary in practice to pay any attention to the change in sign, but with the saturated KC1 refer- ence cell one must record the sign since it changes at about pH 7.8. If this convention is used, increase in the numerical value of the quinhydrone system means decreased acidity. Thus, in Table III and in Fig. 1 the drift is toward an increased hydrogen ion concentration, i.e. lowered pH.
All values with hydrogen electrode are corrected for vapor pressure (aut,omatically included in the eHn), for barometric pres- sure, and for pCO2 to 1 atmosphere of dry hydrogen. This was usually 0.8 to 1.2 millivolts.’
The formula? are in terms of volts, as is usual, but for ease in comparing the E.M.F. values in the tables they are given in milli- volts.
Preparation of Serum and Technique of Electrode Determination.
Sera from both human and dog blood were used in these experi- ments. The human blood samples, usually 20 to 40 cc., were obtained from arm veins, the same technique previously reported for obtaining blood for pH studies being used. The dog blood was obtained by heart puncture and was usuaIly arterial blood.
With human blood the samples were all centrifuged at once, without transfer or defibrination, under solid paraffin for 30 to 45 minutes. The dog blood, taken in larger tubes, 50 cc. to 75 cc. samples, was defibrinated by Gram’s (18) stirring method and then centrifuged under solid paraffin. In either case the serum was not used if at all hemolyzed.
The equilibration of the serum with CO, was carried out with the same tonometers and manifold previously described (Austin et al. (19)) and with the sampling technique of Cullen, Keeler, and Robinson (16).
This equilibration and electrode technique described in detail below insure (1) that the serum contains practically no dissolved 02, and (2) that the equilibration and analysis are both made with
1 Mislowiteer’s (8) criticism of Cullen and Biilmann’s correction (which was the same as used here and which is the accepted standard (Clark (17)) is in error. He mistook the quinhydrone electrode reading for the correc- tion vaIue.
by guest on April 27, 2018
http://ww
w.jbc.org/
Dow
nloaded from
G. E. Cullen and I. P. Earle 571
the same C02-H2 mixture. This is a change from the procedure in the previous work reported by one of us, where the COZ-Hz mixtures for the hydrogen electrode were made separately from those used in the equilibrations. The present method eliminates any possibility of error involved in this extra step and has all of the advantages of Warburg’s (20) modification of Hasselbalch’s (21) original method, while retaining the use of the more convenient Clark cell.
The 200 cc. tonometer was alternately evacuated and filled with hydrogen at least five times, the process ending with a partial vacuum. COZ was then run in to approximately the desired CO, tension and was measured on a manometer (Van Slyke, Wu, and McLean (22)). The serum was drawn up to the 2-way stop-cock, the cock turned, and the serum drawn into the tonometer by the vacuum. No air was admitted. Hydrogen was then run in to about 40 mm. excess pressure. This was to insure no admission of air into the tonometer during adjustment of pressure in the bath. The room temperature in summer here runs about 30’. The tonom- eter was placed in a water bath at 20” and rotated for about 5 minutes, then brought to the surface, and the pressure allowed to equalize to that of the atmosphere. The rotation was then con- tinued for + t,o 1 hour.
Without removal of the tonometer from the bath the serum was transferred to a Pyrex sampling tube containing mercury. This sampling tube was at once placed in the constant temperature room.
The 200 cc. tonometer was removed from the bath, a 25 to 30 cc. gas sample removed for analysis, and the tonometer trans- ferred at once to the 20” constant temperature room where it was connected by its single stop-cock to a 800 cc. tonometer con- taining about 300 cc. of distilled water which had been equilibrated at 20” at approximately t,he same tension of COS. The tonometer was placed in an upright position and connected in series with two Clark-Cullen electrode vessels. The connecting tubes and electrodes were thoroughly rinsed with Hz and the stop-cocks were then so turned that the distilled water displaced about 150 cc. of the C02-HZ mixture through the electrode vessels. The water flowed in quietly.
Water was used here instead of mercury for displacing the gas
by guest on April 27, 2018
http://ww
w.jbc.org/
Dow
nloaded from
572 pH of Serum
mixture because of its convenience and because it was felt that there was less danger of contaminating the electrodes with mer- cury. However, this danger remains, due to the droplets of mercury in the double stop-cock left there during the serum transfer. Mercury is theoretically to be preferred to water.
A 5 cc. pipette containing paraffin oil was then inserted into the rubber connection of the sampling tube from which a few drops of serum were always wasted just prior to this insertion, and serum forced (not sucked) (16) up into the pipette by manipula- tion of the leveling bulb. This pipette was then transferred to the Clark-Cullen cell and the serum allowed to displace about three- fourths of the COrH2 mixture present in the cell.
After 15 minutes shaking the E.M.F. readings were made and fresh portions of serum run in under the same COZ-Hz (Hasselbalch principle). The second reading after the second shaking was usually about 0.5 millivolt higher than the first. The results reported are these second readings.
By use of a pipette and the same technique given above, about 2 cc. of serum were transferred to a small Pyrex tube containing parafFin oil. The gold wire of the quinhydrone electrode was wet in redistilled water, rolled in quinhydrone, and inserted into a capillary electrode vessel until the end of the wire was about 1 cm. from the tip of the capillary tube. These electrode vessels were always dried previously, after thoroughly cleaning, by rinsing with acid-free alcohol and ether followed by suction. The complete electrode was then plunged through the oil to the very bottom of the tube and serum drawn up into the vessel by withdrawal of the plunger carrying the wire until the serum was over the lower end of the cement. A stop-watch was started simultaneously and the electrode suspended in the KC1 bridge vessel. The readings were made at exactly 30, 60, and 90 seconds. At least two different gold electrodes were used for each serum.
Several precautions are necessary. (1) This small amount of serum must not stand too long (8 to 10 minutes) before being used or CO2 is lost in the oil. Further, the last 0.5 cc. must not be used for the same reason. This is shown clearly in the successive readings on a 0.5 cc. sample of serum which is given below under the discussion of CO2 loss. (2) The level of the serum should be Slightly above that of the KCl. Otherwise KC1 is forced into the
by guest on April 27, 2018
http://ww
w.jbc.org/
Dow
nloaded from
G. E. Cullen and I. P. Earle 573
tube and diffusion occurs. (3) The rubber sleeve holding the electrode tube in its place must be gas-tight to hold the serum firmly in place.
Resz6.h.
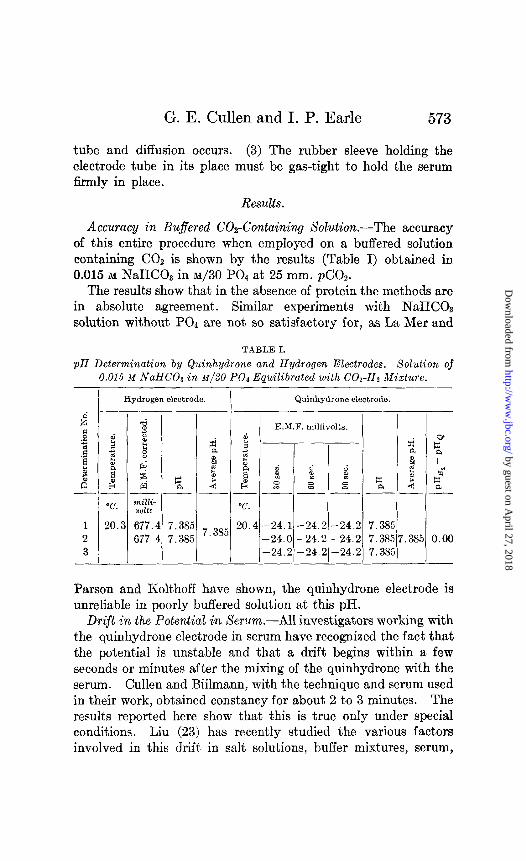
Accuracy in Bufered COz-Containing Solution.-The accuracy of this entire procedure when employed on a buffered solution containing CO2 is shown by the results (Table I) obtained in 0.015 M NaHC03 in ~/30 PO4 at 25 mm. pCOz.
The results show that in the absence of protein the methods are in absolute agreement. Similar experiments with NaHCO$ solution without PO4 are not so satisfactory for, as La Mer and
TABLE I.
pH Determination by Quinhydrone and Hydrogen Electrodes. Solution of 0.015 M NaHCOz in M/SO PO4 Equilibrated with COz-HZ Mixture.
I Hydrogen electrode. I Quinhydrone electrode. I 1 I E.M.F. millivolts.
v. milli- volts
1 20.3 677.4 7.385 2 677 4 7.385 3
7,385 20.4 -24.1-24.2 -24.2 7.385 -24.0 -24.2 -24.2 7.3857.385 -24.2 -24.2 -24.2 7.385
0.00
Parson and Kolthoff have shown, the quinhydrone electrode is unreliable in poorly buffered solution at this pH.
Drift in the Potential in Serum.-All investigators working with the quinhydrone electrode in serum have recognized the fact that the potential is unstable and that a drift begins within a few seconds or minutes after the mixing of the quinhydrone with the serum. Cullen and Biilmann, with the technique and serum used in their work, obtained constancy for about 2 to 3 minutes. The results reported here show that t,his is true only under special conditions. Liu (23) has recently studied the various factors involved in this drift in salt solutions, buffer mixtures, serum,
by guest on April 27, 2018
http://ww
w.jbc.org/
Dow
nloaded from
574 pH of Serum
whole blood, hemoglobin solution, etc. His results are in agree- ment with general experience for buffered mixture, i.e. no drift below pH 8, but immediate and continuing drift in serum. He shows that dilution always increases the drift and thinks that it is due to a change in pH itself, and that the initial potential is the potential representing the actual pH. He does not compare his blood and serum values with the hydrogen electrode. He also points out the error which may be introduced by the slow solu- bility of the quinhydrone. Mislowitzer studied serum and plasma diluted 1:4, and showed that the E.M.F. fell regularly. His drifts were towards a decreased pH. He obtained reproducible results and states that one can either extrapolate to zero time (as Corran and Lewis did for blood) or can use the 15 second value. With the 15 second value, his quinhydrone and hydrogen
TABLE II.
Effect Due to Loss of COz.
I 30 Bee. I
60 WC.
mizzioozts mizzivozts Wdkdt8 mizzivozts 13.0 14.1 15.2 11.9 12.5 13.5 14.8 11.5 12.0 12.9 14.3 11.1 11.2 12.0 13.2 10.2 11.0 11.9 13.2 10.2
90 880. ’ Extrapolation to 0 time.
electrode values checked within 0 to 3 millivolts, equivalent to 0.00 to 0.05 pH, with the value obtained with the quinhydrone electrode the higher, i.e. more alkaline.
Velhnger and Roche also extrapolated to zero time. The experience of these authors, together with the results given in the present paper, shows that extrapolation to zero time is necessary in measuring the pH of serum with the quinhydrone electrode. Typical examples of this drift are shown in Fig. 1 representing the maximum and minimum drift encountered with human sera. Undoubtedly, increase in pH tends to increase the drift. Other results, not given here, with sera at about 6.5 show no drift. However, sufficient data are not yet available for fuller discussion of this factor.
Fig. 1 also illustrates the accuracy of repeated measurement.
by guest on April 27, 2018
http://ww
w.jbc.org/
Dow
nloaded from

G. E. Cullen and I. P. Earle 575
It is rare for the zero values of the multiple curves of one sample to vary over a range greater than 0.01 pH.
Influence of Saturation with H2 on the Drift.--The agreement of the zero points and the slopes of the curves are practically the same
v/l’ I-
L
0 30 60 90 se c 0 tru!s
FICA 1.
in unequilibrated serum as in equilibrated. The following paper (24) reports on a series of sera which were not equilibrated. The curves constructed for these sera are similar to those given in Fig. 1.
Loss of CO* from Sample.-As stated above in discussing the details of the measurement with the quinhydrone electrode, when too little serum is present in the small test-tube from which the
by guest on April 27, 2018
http://ww
w.jbc.org/
Dow
nloaded from
TABL
E III
.
pH
Dete
rmina
tion
by
&uinh
@ro
ne
and
Hydr
ogen
El
ectro
des,
Seru
m
Equil
ibrat
ed
with
CO
%-H
Z M
ixtur
es.
Hydr
ogen
ele
ctrod
e.
Quinh
ydro
ne
electr
ode.
cn
2 D$
er-
E.M
.F.,
milli
volts
. Da
te.
Subj
ect.
“t;:;-
Te
rn-
E.M
.F.
Aver
- Te
m-
NO.
pera
- (c
m-
pH
we
pelT
a-
Ex-
pH
ture
. re
cted)
. PH
. tu
re.
30
WC.
60
s~~.
90
s.~.
l;;
;r;o
I I
I
A,“g
” Hi
s Q
pH.
.
0%X.
1327
July
18
July
21
July
20
July
22
July
28
Aug.
1
l-a,
G.
C.
1 2 3
l-b,
G.
C.
NaF
1 ad
ded
to
blood
. 2 3
2,
I. E.
Na
F 1
adde
d to
se
rum
. 2 3
3,M.W
. Na
F 1
adde
d to
blo
od.
2 3
20.7
19.7
-7
Norm
al se
ra.
mizz
i- vo
lts
“C.
680.
2 7.
442
679.
9 7.
437
7’440
1g
.5
---~ Fg
:; ‘7
::;
7.42
0 21
’4
____
___-
67
9.0
7.42
0 67
9.4
7.42
6 7’4
23
20’2
---__
676.
8 7.
382
677.
0 7.
385
7’334
20
’5
---- ;;I”
7 ;I;
; 7.
389
20’g
---- 67
6.0
7.37
0 67
6.0
7.37
0 7’
3’o
1g’7
-25.
8 -2
5.8
-26.
1-25
.8
7.37
9 -2
5.3
-25.
5 -2
5.8
-25.
2 7.
391
7.38
6 0.
066
w -2
5.8
-26.
4 -2
6.9
-25.
5 7.
386
x ---
---
-24.
8 -2
5.0
-25.
3 -2
4.6
7.35
3 E1
, -2
5.4-
26.1
-27.
0-24
.7
7.35
2 7.
364
0.08
8 ?3
-2
4.8
-25.
3 -2
6.0
-24.
3 7.
358
E ~-
---~-
-2
5.8
-26.
0 -2
6.5
-25.
7 7.
364
-25.
8 -2
5.8
-26.
0 -2
5.8
7.36
2 7.
363
0.08
0 -2
6.0
-26.
3 -2
6.8
-25.
8 7.
362
------
- -2
7.7
-28.
3 -2
9.0
-27.
0 7.
335
-27.
9 -2
8.8
-29.
4-27
.0
7.33
5 7.
334
0.06
0 -2
8.0
-28.
8 -2
9.2
-27.
1 7.
333
~---~
-- -2
7.2
-27.
5 -2
8.0
-27.
0 7.
322
-27.
5 -2
8.0
-28.
8 -2
7.0
7.32
2 7.
323
0.06
6 -2
7.3
-28.
0 -2
9.1
-26.
9 7.
324
------
- -2
9.5
-29.
5 -3
0.0
-29.
5 7.
311
-29.
6 -2
9.8
-30.
3 -2
9.5
7.31
1 7.
311
0.06
9 -2
9.7
-29.
9 -3
0.2
-29.
5 7.
311
by guest on April 27, 2018
http://ww
w.jbc.org/
Dow
nloaded from
Aug.
1
Aug.
4
Aug.
4
July
12
July
14
6,
H.
R.
3 --
7,
I. E.
1
19.2
2 3
--
8,
0.
c.
1 19
.1
2 3 __
_-
9-a,
N.
1
20
Conv
alesc
ing
sea-
2
bies
. 3
____
__
9-b,
N.
1
20
2 3
669.
2 7.
250
7’260
20
.1
-36.
3 -3
6.3
-36.
8 -3
6.3
7.18
6 66
9.2
‘7.25
0 -3
6.2-
36.2
-36.
8-36
.2
7.18
5 7.
189
0.06
1 -3
5.8
-36.
0 -3
6.2
-35.
6 7.
197
~~--~
-___
__---
67
6.8
7.39
0 67
7.0
7.39
3 7’3
g2
19.6
-2
9.2
-29.
3 -2
9.8
-29.
1 7.
319
-29.
2 -2
9.2
-30.
0 -2
9.2
7.31
7 7.
317
0.07
6 -2
9.5
-29.
7 -3
0.1-
29.3
7.
315
---p--
-y---
673.
0 7.
323
7.32
3 19
.7
-32.
1-32
.2
-32.
7 -3
2.0
7.26
8 -3
2.0
-32.
0 -3
2.2
-32.
0 7.
268
7.26
6 0.
066
-32.
1 -3
2.2
-33.
0 -3
2.1
7.26
7 p-
----p
----
z::;
;‘;;;
7.46
6 19
.6
-24.
3 -2
4.3-
24.5
-25.
1-23
.9
-24.
8 -2
5.3
-23.
8 7.
409
7.40
7 7.
410
0.04
6 -2
4.0
-24.
5 -2
5.1-
23.5
7.
414
----~
-___
----
680.
5 7.
445
‘.*’
19.9
-2
4.9
-25.
4 -2
6.0
-24.
5 7.
392
680.
7 7.
449
-24.
9 -2
5.1-
35.8
-2
4.8
7.38
7 7.
390
0.06
7 -2
4.7
-24.
9 -2
5.1
-24.
5 7.
392
Aver
age.
O.C6
? .F
? M
-- Ab
norm
al se
ra.
P 2 Ju
ne
28
10.
1 20
.9
642.
0 6.
772
21.3
-6
2 3
-62.
2 -6
2.2
CD
2 64
1.0
6.75
5 6.
763
-61.
6-61
.7
-61.
7
-62.
3 6.
708
Neph
ritis.
-6
1.5
6.72
2 6.
716
0.04
7 Ac
idos
is.
3 -6
1.7
-61.
7 -6
1.5
-61.
7 6.
718
------
---
P-F-
Ju
ly 8
11.
1 19
.8
671.
0 7.
284
19.6
-3
0.4
-30.
2 -3
0.2
-30.
5 7.
297
Cyan
osis.
2
671.
7 7.
297
7.2g
-2
9.9
-29.
9 -3
0.1
-29.
9 7.
305
7.30
3 -0
.013
3
-30.
0 -2
9.9
-30.
0 -3
0.0
7.30
7
by guest on April 27, 2018
http://ww
w.jbc.org/
Dow
nloaded from
578 pH of Serum
serum is drawn into the electrode vessel and the ratio of surface to volume is high, the loss to the oil may be relatively great. This is shown well in Table II which gives five successive readings made at 2.5 minute intervals on about 0.5 cc. of serum contained in a test-tube 11.5 mm. in diameter.
Incidentally this steady decrease in E.M.F. which would occur in a system where CO2 loss is not nrevented might mask the serum drift which results in an increase in E.M.F.
DISCUSSION.
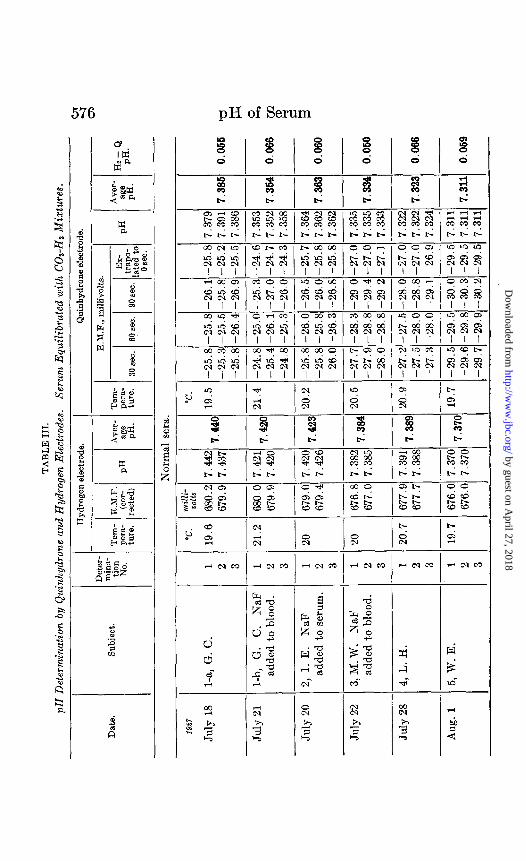
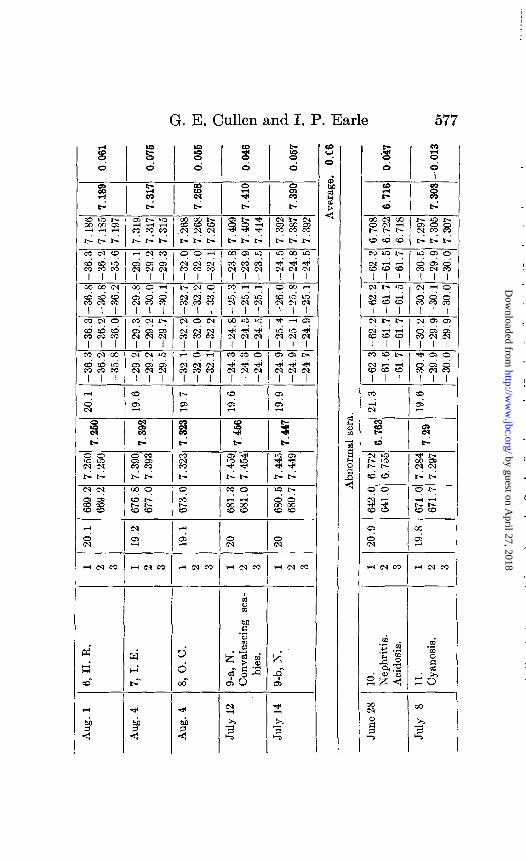
Relation between Quinhydrone and Hydrogen Electrode.-The values obtained in equilibrated sera are given in Table III. Data for patient N, convalescing from scabies, are included in the normal human sera. In addition to these determinations on normal human sera the data for two abnormal human sera are included. Refractometric protein determinations were made on several of the sera which gave normal values.
Normal Sera.-The number of sera equilibrated is not great but the agreement for the series is so clean cut that it seems logical to conclude that in normal human serum, at normal pH, the quin- hydrone electrode at 20” gives results reproducible to within 0.01 pH, which are constantly more acid by 0.06 pH than the actual pH as determined by the hydrogen electrode at 20”, i.e. at 20”
PHaotud = pHq -f- 0.06
The correction factor for dog serum is somewhat higher, 0.09. We have many determinations showing the drift and repro- ducibility of dog serum but only two carefully equilibrated sera which give 0.09 and 0.088. The drift and reproducibility with unequilibrated sera are apparently the same as for human serum but in view of the discrepancies of the coIorimetric method which occur with dog serum, it is advisable to accumulate much more data before accepting the correction 0.09 for the quinhydrone method as more than tentative.
Sodium Fluoride.-NaF added either to the blood or to the serum does not affect the results.
Pathological Sera.-For the two cases which we report now, the correction is much less. This perhaps explains the agreement
by guest on April 27, 2018
http://ww
w.jbc.org/
Dow
nloaded from
G. E. Cullen and I. P. Earle 579
which Cullen and Biilmann found in Copenhagen since they were using sera from hospital patients.
It is to be noted that Mislowitzer’s diluted sera give differences from 0 to 0.05 with the quinhydrone value more alkaline. He does not give the origin of his blood but if we may assume it to be from patients, the difference between his results and ours with pathological sera is not great. On the other hand, Mislowitzer found that with both serum and blood the quinhydrone electrode is more alkaline than the hydrogen electrode. This is contrary to the experience of other workers with protein solutions as well as to ours.
The value of 0.09 for dog serum is not far from the correction value which may be calculated from Vellinger and Roche’s paper by averaging the four values for the one dog plasma,
PHH, - pHQ = 0.11 pH
Incidentally, Vellinger and Roche used the Hasselbalch type of electrode for their hydrogen electrode.
Our difference of 0.06 is, however, much less than the difference which Kolthoff found for blood serum diluted with NaCl at the same pH, but it is in agreement with his average value of 0.06 f 3 for serum diluted with phosphate buffer mixture. The close agreement of this correction value, Q, (using Linderstrom-Lang’s notation) obtained on undiluted serum at pH 7.20 to 7.4 with Linderstrom-Lang’s value for serum albumin at 4.7, on the one hand, and Kolthoff’s value for diluted plasma, on the other hand, is surprising in view of Linderstrom-Lang’s finding that both pH and type of protein influence it. It probably indicates that the value 0.06 is the resultant of a number of factors. It also supports the logic of determining the correction value, for use in blood serum studies, on the undiluted serum as drawn.
Application of Results to Clinical Studies.
Until further data have been accumulated as to the influence of various pathological conditions on the correction factor of + 0.06 for normal serum, the interpretation of determinations on the serum of patients may be subject to an error up to 0.06 pH. One may argue that the correction for any given serum will lie between
by guest on April 27, 2018
http://ww
w.jbc.org/
Dow
nloaded from
pH of Serum
0 and 0.06, and therefore be reasonably certain that the corrected value represents the actual pH at 20” to within f 0.03. This neglects the possibility that some abnormal sera may require a negative correction.
Another possibility that is being studied is that of making parallel quinhydrone and calorimetric determinations. The rela- tive constancy of these two determinations is discussed in the accompanying report (24).
SUMMARY.
Parallel determinations of hydrogen ion concentration at 20” have been made by the hydrogen electrode and by the quinhydrone electrode on normal sera and on a few abnormal sera.
In normal human sera the quinhydrone method gives accurately reproducible values that are constantly 0.06 pH more acid than the values given by the hydrogen electrode.
The method used is given in detail.
BIBLIOGRAPHT.
1. Biilmann, E., Ann. chim., 1921, xv, series 9,109; Tr. Faraday Sot., 1923, xix, 676.
2. La Mer, V. K., and Parsons, T. R., J. Biol. Chem., 1923, lvii, 613. 3. Sorensen, S. P. L., S#rensen, M., and Linderstram-Lang, K., Compt.
rend. trav. Lab. Curlsberg, 1921, xiv, No. 14. 4. Kolthoff, I. M., 2. physiol. Chem., 1925, cxliv, 259. 5. Linderstrdm-Lang, K., Compt. rend. trav. Lab. Carlsberg, 1925, xvi,
No. 1. 6. Corran, J. W., and Lewis, W. C. M., Biochem. J., 1924, xviii, 1358. 7. Mislowitzer, E., Biochem. Z., 1925, clix, 77. 8. Mislowitzer, E., K&in. Woch., 1926, ii, 1863. 9. Meeker, G. H., and Oser, B. L., J. Biol. Chem., 1926, Ixvii, 307.
10. Cullen, G. E., and Biilmann, E., J. Biol. Chem., 1925, lxiv, 727. 11. Mozolowski, W., and Parnas, J. K., Biochem. Z., 1926, clxix, 352. 12. Vellinger, E., and Roche, J., Bull. Sot. chim. biol., 1925, vii, 1004. 13. Runge, H., and Schmidt, O., Deutsch. med. Woch., 1925, Iii, 2077. 14. Cullen, G. E., J. Biol. Chem., 1922, Iii, 521. 15. Cullen, G. E., J. Biol. Chem., 1922, lii, 501. 16. Cullen, G. E., Keeler, H. R., and Robinson, H. W., J. Biol. Chem.,
1925, Ixvi, 301. 17. Clark, W. M., The determination of hydrogen ions, Baltimore, 2nd
edition, 1922, 22.
by guest on April 27, 2018
http://ww
w.jbc.org/
Dow
nloaded from
G. E. Cullen and I. P. Earle 581
18. Austin, J. H., and Gram, H. C., J. Biol. Chem., 1924, lix, 535. 19. Austin, J. H., Cullen, G. E., Hastings, A. B., McLean, F. C., Peters,
J. P., and Van Slyke, D. D., J. Biol. Chem., 1922, liv, 121. 20. Warburg, E., Biochem. J., 1922, xvi, 153. 21. Hasselbalch, K. A., Biochem. Z., 1910, xxx,‘317. 22. Van Slyke, D. D., Wu, H., and McLean, F. C., J. Biol. Chem., 1923,
Ivi, 765. 23. Liu, S.-K., Biochem. Z., 1927, clxxxv, 242. 24. Earle, I., and Cullen, G. E., J. Biol. Chem., 1928, lxxvi, 583.
by guest on April 27, 2018
http://ww
w.jbc.org/
Dow
nloaded from
Glenn E. Cullen and Imogene P. EarlePLASMA OR SERUM
DETERMINING THE pH OF BLOOD FORTHE QUINHYDRONE ELECTRODE
OFOF THE BLOOD: I. THE ACCURACY ON THE DETERMINATION OF THE pH
1928, 76:565-581.J. Biol. Chem.
http://www.jbc.org/content/76/2/565.citation
Access the most updated version of this article at
Alerts:
When a correction for this article is posted•
When this article is cited•
alerts to choose from all of JBC's e-mailClick here
ml#ref-list-1
http://www.jbc.org/content/76/2/565.citation.full.htaccessed free atThis article cites 0 references, 0 of which can be
by guest on April 27, 2018
http://ww
w.jbc.org/
Dow
nloaded from

![General Information: - Web viewDefine Ka , Kb . Determination of Ka from pH and % dissociation. Determination of [H + ], pH for weak acid with/without quadratic formula, polyprotic](https://static.fdocuments.in/doc/165x107/5a706bd87f8b9ab1538bef84/general-information-mchsapchemistrycomwwwmchsapchemistrycom7715124mchs2010sdoc.jpg)