On the Association between Corporate Governance and...
36
Electronic copy available at: http://ssrn.com/abstract=1014243 On the Association between Corporate Governance and Earnings Quality ∗ K. Sivaramakrishnan † University of Houston [email protected] Shaokun Carol Yu Northern Illinois University [email protected] April 10, 2008 Abstract This study investigates whether accrual quality, earnings persistence and earnings predictive ability are affected by the adequacy rather than the strength of corporate governance. Under the premise that firms that have consistently outperformed their industry counterparts in the past have less residual agency problem, we use past industry-adjusted performance as a measure of the adequacy of corporate governance in place. We use Gompers’ index as a measure of the strength of corporate governance. We find that reporting/earnings quality - accrual quality, earnings persistence, and earnings predictability - is higher for firms that have consistently outperformed their industry counterparts in the past regardless of whether the corporate governance levels were strong or weak. We also find that reporting/earnings quality is higher for such firms after controlling for the strength of corporate governance. ∗ We thank Ramji Balakrishnan, Jeff Chen, George Drymiotes, Gerald Lobo, Scott Whisenant, and participants at the 2008 Financial Accounting and Reporting Section Meetings, for many helpful discussions and suggestions. † Address to the corresponding author at C. T. Bauer College of Business, University of Houston, 334 Melcher Hall, Houston, TX 77204-6021. Tel: (713) 743-4630, Fax: (713) 743-4828.
Transcript of On the Association between Corporate Governance and...

Electronic copy available at: http://ssrn.com/abstract=1014243
On the Association between Corporate Governance and Earnings
Quality∗
K. Sivaramakrishnan†
University of Houston
Shaokun Carol Yu
Northern Illinois University
April 10, 2008
Abstract
This study investigates whether accrual quality, earnings persistence and earnings predictive
ability are affected by the adequacy rather than the strength of corporate governance. Under the
premise that firms that have consistently outperformed their industry counterparts in the past
have less residual agency problem, we use past industry-adjusted performance as a measure of the
adequacy of corporate governance in place. We use Gompers’ index as a measure of the strength
of corporate governance. We find that reporting/earnings quality - accrual quality, earnings
persistence, and earnings predictability - is higher for firms that have consistently outperformed
their industry counterparts in the past regardless of whether the corporate governance levels
were strong or weak. We also find that reporting/earnings quality is higher for such firms after
controlling for the strength of corporate governance.
∗We thank Ramji Balakrishnan, Jeff Chen, George Drymiotes, Gerald Lobo, Scott Whisenant, and participantsat the 2008 Financial Accounting and Reporting Section Meetings, for many helpful discussions and suggestions.
†Address to the corresponding author at C. T. Bauer College of Business, University of Houston, 334 MelcherHall, Houston, TX 77204-6021. Tel: (713) 743-4630, Fax: (713) 743-4828.

Electronic copy available at: http://ssrn.com/abstract=1014243
On the Association between Corporate Governance and Earnings Quality
Abstract
This study investigates whether accrual quality, earnings persistence and earnings predictive
ability are affected by the adequacy rather than the strength of corporate governance. Under
the premise that firms that have consistently outperformed their industry counterparts in the
past have less residual agency problem, we use past industry-adjusted performance as a measure
of the adequacy of corporate governance in place. We use Gompers’ index as a measure of the
strength of corporate governance. We find that reporting/earnings quality - accrual quality, earnings
persistence, and earnings predictability - is higher for firms that have consistently outperformed
their industry counterparts in the past regardless of whether the corporate governance levels were
strong or weak. We also find that reporting/earnings quality is higher for such firms after controlling
for the strength of corporate governance.

On the Association between Corporate Governance and Earnings Quality
1 Introduction
A wave of corporate scandals has brought financial reporting practices of public companies under
considerable scrutiny in recent years. Legislative actions such as the Sarbanes-Oxley (SOX) Act of
2002 have sought to improve the quality of financial reporting by requiring chief executives to certify
what they report, and by strengthening corporate governance and improving auditor independence.
Whether and to what extent these measures have been effective has been the subject of much
research recently (e.g., Cohen, Dey, and Lys [2008], Li, Pincus, and Rego [2005], Zhang [2005]).
For instance, Lobo and Zhou [2005] provide evidence that SOX has resulted in firms becoming
more conservative in their reporting behavior. Cohen, Dey, and Lys [2008] provide evidence that
firms have turned away from accounting earnings management to real earnings management after
the passage of SOX.
More generally, these events raise a larger issue relating to the nature of the association between
corporate governance and earnings quality.1 Does weak corporate governance necessarily lead to
low earnings quality? Does weak corporate governance necessarily result in higher levels of earnings
management? Answers to these questions can help us understand how the stipulations of SOXmight
differentially impact the reporting quality of firms. In this paper, we draw on agency theory to
develop an empirical framework for examining the link between corporate governance and financial
reporting behavior of firms. We use this framework to formulate and test specific hypotheses on
the association between measures of earnings quality and corporate governance.
Agency theory provides a natural backdrop for our analysis because financial reporting concerns
arise when there is a conflict of interests between managers and owners (shareholders) coupled with
information asymmetries (e.g., Beatty and Harris [1998], Kim and Yi [2006], Richardson [2000]).
Absent this agency problem, reporting quality is a non-issue because managers do not have any
incentive to misreport or hide information (keeping aside reporting incentives that might arise
from strategic product market considerations). The purpose of corporate governance in its various
forms is to reduce this agency problem, suggesting a natural link between corporate governance
and financial reporting. All else equal, effective corporate governance should result in high re-
porting/earnings quality. Indeed, Chtourou, Bédard, and Courteau [2001] provide evidence that
effective boards and audit committees constrain earnings management activities.
Corporate governance mechanisms evolve over time. Some firms have strong corporate gover-
1 In this paper, we use the terms earnings quality and reporting quality synonymously. Our empirical analysisfocus narrowly on specific measures of earnings quality.
3

nance mechanisms in place as reflected, for example, in the number of independent members on
the board, presence of large institutional shareholders, and absence of CEO duality. Other firms
have weaker corporate governance. If markets are efficient, one could argue that in equilibrium, the
evolved level of corporate governance in a firm is effective given the degree of the agency problem
in the firm. And, if corporate governance mechanisms naturally evolve to their effective levels,
reporting quality should not be an issue. Yet, many recent reporting scandals, such as Enron
and WorldCom, have been attributed to corporate governance failures, raising the possibility that
the degree of effectiveness of corporate governance mechanisms likely varies across firms. That is,
corporate governance is likely to be more adequate for some firms than for others.
In this paper, we develop a framework which distinguishes between the strength of corporate
governance and its adequacy. We view strength (or weakness) as reflecting the degree of corpo-
rate governance. A firm that has a greater number of independent directors in its board, large
institutional shareholders, and absence of CEO duality, is viewed as having stronger corporate
governance.
In contrast, corporate governance is adequate if it is effective in reducing the agency cost.
Corporate governance can be weak but adequate if the agency problem is low to begin with.
We would expect earnings quality to be less of an issue for such firms. Corporate governance
can be strong but inadequate; for these firms, earnings quality is likely to be an issue despite
strong corporate governance. Earnings quality is also likely to be an issue for firms with weak and
inadequate governance.
Classifying firms along these two dimensions of corporate governance (i.e., strength and ade-
quacy) allows us to generate an interesting set of hypotheses with respect to its impact on earnings
quality. In particular, we hypothesize that firms with more adequate corporate governance will have
higher earnings quality, regardless of the strength of corporate governance– it is the adequacy of
corporate governance that has the first order effect on earnings quality. And, if the adequacy of
corporate governance is the primary driver of earnings quality, it should be the case that its strength
should not incrementally affect earnings quality. Accordingly, we test the null hypothesis that there
is no difference in earnings quality between firms that have strong and weak corporate governance
as long as it is adequate. On the other hand, it is possible that the strength of corporate governance
might have an effect on earnings quality among firms with inadequate governance. That is, firms
with strong but inadequate corporate governance and firms with weak but inadequate corporate
governance may exhibit different levels of earnings quality, although it is difficult to offer definite
directional predictions (as we describe later).
Following the literature, we use Gompers’ index as a measure of the strength of corporate
4

governance. Gompers, Ishii, and Metrick [2003] construct a corporate governance index for each
firm in their sample by adding one point for every provision that reduces shareholder rights: the
larger the value of the score, the weaker is the corporate governance. Many studies use this score
to proxy for corporate governance (e.g., Core, Guay, and Rusticusi [2006], Gompers, Ishii, and
Metrick [2003], Zhang [2005]).
The notion of adequacy is difficult to quantify. One approach to developing a construct for
adequacy is to measure the level of the residual agency problem–the agency problem that remains
despite whatever corporate governance is in place. The premise underlying this approach is that
more adequate or effective is the corporate governance in place, the lower will be the residual
agency problem. Indeed, Core, Holthausen, and Larcker [1999] provide evidence that firms with
greater agency problems perform worse. Accordingly, we use past industry-adjusted performance as
a measure of the residual agency problem, and therefore of the adequacy of corporate governance.
Intuitively, if a firm is outperforming other firms in its industry on a consistent basis, the residual
agency problem in the firm is likely low. The corporate governance in place, whether strong or
weak, is more likely to be adequate for this firm than another firm that does not have a similar
consistent performance record. That is, the corporate boards are likely more effective in their
contracting and monitoring roles, managerial incentives are likely better aligned with shareholder
interests, and these aspects are reflected in their superior performance. We provide a more detailed
discussion of this measure in Section 3.
Overall, the empirical results strongly support our hypotheses. In particular, reporting/earnings
quality (accrual quality, earnings persistence, and earnings predictability) is higher for firms that
have consistently outperformed their industry counterparts in the past relative to other firms that
have not been able to do so. Specifically, reporting/earnings quality is higher regardless of whether
the corporate governance levels were strong or weak.
Our results indicate that it is the adequacy of corporate governance, and not just its strength,
that determines the quality of financial reports. Recent reforms, including the Sarbanes-Oxley Act,
have for the most part emphasized the strengthening of various corporate governance mechanisms
to improve informativeness of financial reports and to reduce agency problems. But, at least
from a financial reporting perspective, our results indicate that not factoring in the adequacy of
existing levels of corporate governance in requiring firms to institute these reforms can be costly to
shareholders and to society. To our best knowledge, this paper is among the first to develop the
notion of adequacy of corporate governance (as opposed to its strength), and to propose and test
an empirical framework to examine its impact on reporting quality
As noted above, we measure adequacy of corporate governance based on the premise that firms
5

that consistently outperform other firms in their respective industries have less residual agency
problems. Although Core, Holthausen, and Larcker [1999] provide some empirical basis for this
premise, consistent past performance is admittedly an imperfect measure of the adequacy of cor-
porate governance. However, even the evidence of a systematic association between consistent past
performance and measures of earnings quality that are widely used in the literature is interesting
in its own right, because it establishes past performance as a significant determinant of earnings
quality.
The paper proceeds as follows. In the next section, we present our motivation and develop
hypotheses. In Section 3, we present our methodology and discuss measurement issues. In Section
4, we discuss data and sample selection procedures. We present our results in Section 5. Finally,
we provide a conclusion in Section 6.
2 Motivation and Hypotheses
2.1 Framework
Reporting quality refers to the extent to which financial reports of a company communicate
its underlying economic state and its performance during the period of measurement in a repre-
sentationally faithful manner (where representational faithfulness is as defined in FASB Concept
Statement No. 2). In this paper, we focus narrowly on earnings quality, an aspect of reporting
quality that is defined by Schipper and Vincent [2003] as the extent to which reported earnings
measure the Hicksian notion of income.
A basic premise underlying our research is that in the absence of agency conflict between
preparers of financial statements (managers) and users of financial statements (shareholders and
outsiders), reporting quality is not a concern. There is no incentive for managers to misrepresent
the state of the company to shareholders if their incentives are completely aligned or if there is
no conflict of interest.2 In the presence of an agency conflict, informational asymmetries and
unobservability of managerial actions can give rise to adverse reporting incentives (in addition to
distortions in investment and operational decisions).
Most organizations use a combination of incentive and monitoring mechanisms to address this
agency problem, including performance-contingent incentive schemes, formal and informal moni-
toring systems, corporate governance by a board of directors, independent verification of financial
statements by auditors. To the extent that these mechanisms are successful in aligning incentives,
2We keep aside incentives with respect to strategic disclosure of information that arise from competition in productmarkets. Essentially, we are assuming information disclosed in financial statements is too aggregate that theirrepresentational faithfulness does not handicap the company in a competitive product market.
6

we would expect the reporting quality to improve. It seems reasonable to expect that some compa-
nies have more effective corporate governance than others. As a first step in developing framework,
we explicate this crucial link between adequacy of corporate governance and the notion of residual
agency problem next.
2.2 Corporate Governance and the Residual Agency Problem
Corporate governance encompasses many different aspects — the contracting and monitoring
roles of the board of directors (BoD),3 the role of independent external auditors to authenticate
financial reports, monitoring presence of large and institutional shareholders. A measure of ade-
quacy of these mechanisms is how effective they are in reducing the agency conflict between capital
providers and managers. As recent reporting scandals and routine SEC investigations into reporting
practices of some firms suggest, incentive and governance mechanisms can sometimes be woefully
inadequate.
We refer to the agency conflict that remains, despite the various corporate governance mecha-
nisms in place, as the residual agency problem. More effective corporate governance is in reducing
the agency conflict, the less pronounced will be the residual agency problem, and, from a share-
holder perspective, firm performance is likely to be better and earnings quality will be less of an
issue. A central purpose of the Sarbanes-Oxley Act enacted in 2002, is to require corporations to
implement more stringent controls, and make corporate boards and audit committees more inde-
pendent. In essence, these stipulations are intended to strengthen corporate governance, which, in
turn, will likely improve earnings quality.
We note that given firm-specific costs and benefits of corporate governance, there is likely to
be a variation in the extent of the residual agency problem across firms. In other words, optimal
corporate governance levels need not entail the same low levels of residual agency problem for
all firms. Thus, it is possible that the residual agency problem is relatively more pronounced in
some firms than in others despite optimal corporate governance. But it is less likely that corporate
governance is sub-optimal when residual agency problems are low. For this reason, we focus more
on the notion of adequacy of corporate governance, rather than optimality, to identify firms for
which corporate governance has effectively reduced agency problems to low levels.
It is important, however, to distinguish between the strength of corporate governance, and
its adequacy. If the extent of the agency problem is small to begin with, strongly independent
3Many recent corporate scandals have been attributed to the failure of corporate boards to protect shareholderinterests (Bebchuk and Fried [2003], Morgensen [2005]). Recent trends in practice and research reflect a recognitionof the need to align directors incentives with shareholder interests in discharging their corporate governance duties(Gabrielle [2001]; Kumar and Sivaramakrishnan [2008]).
7

corporate boards and stringent monitoring mechanisms may not be necessary. In other words,
weaker corporate governance with fewer monitoring mechanisms may well be adequate. On the
other hand, if the extent of the agency problem is large, strong corporate governance may be
warranted. Indeed, Gompers, Ishii, and Metrick [2003] do not find significant underperformance in
firms with weak governance. Larcker, Richardson and Tuna [2005] only find a weaker relationship
between governance and future firm performance. It actually implies that the typical measures
of governance used in academic research and institutional rating services have limited ability to
explain managerial behavior and organizational performance. In other words, the strength of
corporate governance can not guarantee firm performance.
Strong corporate governance can be inadequate, and weak corporate governance can be ade-
quate.4 Thus, strong corporate governance does not necessarily imply high earnings quality, and
weak corporate governance does not necessarily imply low earnings quality. However, we can say
that firms with adequate corporate governance, whether weak or strong, will have higher earnings
quality than firms with inadequate corporate governance, whether weak or strong. Specifically, we
have the following hypotheses:
Hypothesis 1 Firms with adequate corporate governance will have higher earnings quality relative
to firms with inadequate corporate governance, regardless of the strength of corporate governance.
Hypothesis 2 Firms with adequate corporate governance will have higher earnings quality rela-
tive to firms with inadequate corporate governance, after controlling for the strength of corporate
governance.
Furthermore, as long as corporate governance is adequate, its strength should not make a
difference in terms of earnings quality. Therefore, we state the following hypothesis in its null form:
Hypothesis 3 There is no difference in earnings quality between firms with strong corporate gover-
nance and firms with weak corporate governance, as long as the corporate governance is adequate.
3 Measurement and Research Design
In this section, we discuss issues relating to the measurement of our main variables of interest —
strength of corporate governance, adequacy of corporate governance, and earnings quality, and the
proxies we use for these variables. We restate our hypotheses in terms of the measured constructs
of these variables and describe our research design.
4A good analogy is crime deterrence. Whether the current police force is effective or adequate in a county can bedetermined by the number of crimes in that county. Thus, even if there is only a small or large police force, as longas the crime rate is minimal, surveillance is adequate in the county. We thank Scott Whisenant for this analogy.
8

3.1 Strength and Adequacy of Corporate Governance
3.1.1 Strength of Corporate Governance
Following the empirical literature on corporate governance, we use Gompers’ Index, GINDEX,
as a measure of the level or the strength of corporate governance. Briefly, Gompers’ index is
a composite ordinal measure that captures many different dimensions of corporate governance.
The larger the GINDEX, the weaker is the corporate governance. The use of a composite index
has several advantages over the use of measures of individual components that make up this index.
First, we are interested in overall strength of corporate governance, and not in the relative strengths
along individual dimensions. Second, these individual aspects of corporate governance structure are
likely interrelated, ignoring which can lead to spurious inferences (Bhagat and Jefferris [2002]).5
Nevertheless, we check the robustness of our results to a few selected dimensions of corporate
governance making up the Gompers’ index that are likely to have a direct bearing on earnings
quality.
Corporate governance can systematically vary from industry to industry, making it difficult
to assess its relative strength across a broad sample of firms. For this reason, we define a firm as
having weak corporate governance in a specific year if its Gompers’ Index is greater than or equal to
the industry median score consistently over the rolling ten-years window. Let ADJGINDEX_AVG
be the average of the firms’ yearly industry-adjusted governance index over the rolling ten-years
window. Specifically, in period t, equation (1) is estimated using all available data from t− 9 untilyear t. Then, for firm i at time t,
ADJGINDEX_AVGi,t=
NXτ=1
¡GINDEXA
i,τ −MEDIAN¡GINDEXA
τ
¢¢N
(1)
where N represents the total number of observations for each firm over the rolling ten-years window
(N=10); A represents the industry to which the firm belongs; t ∈ (1990− 2003); τ ∈ (1981− 2003).For example, when t = 1990, τ ∈ (1981 − 1990); when t = 1991, τ ∈ (1982 − 1991). A high
ADJGINDEX_AVG value indicates that, on average, firms have weaker corporate governance
relative to the industry.
As an alternate measure, we use the frequency with which a firm’s Gompers’ Index falls above
or below the industry median score over the rolling ten-years window. This measure is not affected
5Agrawal and Knoeber [1996] provide direct empirical evidence of interdependence among seven attributes ofcorporate governance (shareholdings of insiders, institutions, and large blockholders, use of outside directors, debtpolicy, the managerial labor market, the market for corporate control).
9

by the magnitude of the industry adjusted index. Specifically, let ADJGINDEXD_FREQ be the
number of years in which the firms’ yearly industry-adjusted governance index, ADJGINDEX, is
greater than or equal to zero over the rolling ten-years window:
ADJGINDEXD_FREQi,t=YEARS
¡GINDEXA
i,τ ≥MEDIAN¡GINDEXA
τ
¢¢N
, (2)
where N represents the total number of observations for each firm over the rolling ten-years window
(N=10); A represents the industry to which the firm belongs; t ∈ (1990− 2003); τ ∈ (1981− 2003).Specifically, to measure the strength of corporate governance in period t, equation (2) is estimated
using all available data from t − 9 until year t. That is, when t = 1990, τ ∈ (1981 − 1990); whent = 1991, τ ∈ (1982− 1991); and so on.6 A higher value of ADJGINDEXD_FREQ would indicatethat the firm has consistently weaker corporate governance compared to other firms in its industry.
3.1.2 Adequacy of Corporate Governance
As we noted at the outset, measuring the adequacy of corporate governance is a difficult task
because it essentially requires the measurement of the residual agency cost. Recall that we define
corporate governance as being adequate if the residual agency cost is minimal. All else equal,
we would expect managers’ interests to be more aligned with shareholder interests for firms with
more effective corporate governance. Consequently, they will take investment and operational
actions that are more likely to maximize shareholder value. We would expect such firms to perform
consistently better than firms with less adequate governance, all else equal. In other words, more
effective governance must translate into greater value for shareholders.
Therefore, we use the firm’s over-time profitability relative to the industry as an inverse measure
of the extent of the residual agency problem. We can restate our hypotheses in terms of this measure
as follows:
Hypothesis 1a Firms with consistently superior profitability relative to the industry will have
higher earnings quality relative to firms that are not doing as well, regardless of the strength of
corporate governance.
Hypothesis 2a Firms with consistently superior profitability relative to the industry will have
higher earnings quality relative to firms that are not doing as well, after controlling for the strength
of corporate governance.
Hypothesis 3a There is no difference in earnings quality between firms with strong corporate gov-6We will address issues regarding the availability of the Gompers’ index data to compute ADJGINDEXD_FREQ
using the rolling ten-year window later in the data section.
10

ernance and firms with weak corporate governance, as long as firms are consistently outperforming
other firms in the industry.
Our use of firm performance to assess residual or unresolved agency problem has some empirical
support from prior literature. Core, Holthausen, and Larcker [1999] provide evidence that firms
with greater agency problems perform worse. In addition, Berger and Patti [2006] observe that
the best-practice firm is the closest approximation to how a firm would behave if agency costs
were minimized. Brown and Caylor [2004] use firm performance as a benchmark to determine the
effectiveness of corporate governance.
A drawback of this measure is that consistently superior firm performance (relative to the in-
dustry) may simply be indicative of managerial talent, and not necessarily of adequate corporate
governance. That is, substantial agency problems might still exist despite observed superior per-
formance arising from managerial talent. However, in this case, there is no reason to expect a
systematic association between firm performance and earnings quality.
We use return on equity (ROE) as the measure of firm performance. Lambert and Larcker
[1987] argues that ROE “has a natural interpretation as a measure of the firm’s performance from
the perspective of shareholders.” ROE is widely used to measure the firm overall performance (i.e.,
Ittner, Larcker, and Rajan [1997], Indjejikian and Nanda [2002], Cheng [2004]). We compute ROE
as income before extraordinary items over average total equity.
We define firms with ROE consistently greater than or equal to industry median ROE, as firms
with low agency costs. This implies that firms with consistent good performance have adequate
corporate governance. ROE_AVG is the average of a firm’s ROE over the rolling ten-years window,
while ADJROE_AVG is the average of the firm’s yearly industry-adjusted ROE (ADJROE) over
the same period:
ADJROE_AVGi,t =
NXτ=1
¡ROEAi,τ −MEDIAN
¡ROEAτ
¢¢N
, (3)
where N represents the total number of observations for each firm over the rolling ten-years win-
dow (N=10); A represents the industry to which the firm belongs. A high ADJROE_AVG value
indicates that, on average, the firm has better performance relative to the industry. Alternatively,
we also use a frequency measure. ADJROED_FREQ is the number of years in which the firm’s
yearly industry-adjusted ROE, ADJROE, is greater than or equal to zero over the rolling ten-years
window:
ADJROED_FREQi,t =YEARS
¡ROEAi,τ ≥MEDIAN
¡ROEAτ
¢¢N
, (4)
11

where N represents the total number of observations for each firm over the rolling ten-years window
(N=10); A represents the industry to which the firm belongs. Specifically, to measure the adequacy
of corporate governance in period t, equation (4) is estimated using all available data from t − 9until year t. That is, for t = 1990, τ ∈ (1981− 1990); for t = 1991, τ ∈ (1982− 1991); and so on.A high ADJROED_FREQ value is indicative of the adequacy of corporate governance.
3.1.3 Earnings Quality
We use three alternate proxies for earnings quality widely used in the accounting literature:
accrual quality, persistence, and predictability (Francis, LaFond, Olsson, and Schipper [2004]). As
Schipper and Vincent [2003] note, each of these constructs is affected by the firm’s business model,
industry conditions and economic environment, as well as the choice of reporting policies and
procedures by its management. Our interest lies in the latter — the impact of managerial reporting
behavior on earnings quality. Consequently, these constructs measure earnings quality with error.
However, we do not have any a priori reason to believe that this measurement error will bias our
tests in any systematic way.
Following Dechow and Dichev [2002], we develop the accrual quality from the model regressing
current accruals to lagged, current, and future cash flows from operations:
TACCi,t
ASSETSi,t= β0,i + β1,i
CFOi,t−1ASSETSi,t−1
+ β2,iCFOi,t
ASSETSi,t+ β3,i
CFOi,t+1
ASSETSi,t+1+ νi,t, (5)
where TACC is the total current accruals scaled by total assets,
TACC = ∆CA−∆CL−∆Cash+∆STDEBT. (6)
Cash flow from operations, CFO, is calculated as net income before extraordinary items (COMPU-
STAT #18) less total accruals (ACCBS):
ACCBS = ∆CA−∆CL−∆Cash+∆STDEBT −DEPN , (7)
where ∆CA is firm’s change in current assets (COMPUSTAT #4); ∆CL is the change in current
liabilities (COMPUSTAT #5); ∆Cash is the change in cash (COMPUSTAT #1); ∆STDEBT
is the change in debt in current liabilities (COMPUSTAT #34); and DEPN is depreciation and
amortization expense (COMPUSTAT #14). For each firm-year, we estimate equation (5) using
rolling ten-year windows. We define the standard deviation of firm j’s estimated residuals as the
inverse of accrual quality, INV ACCQ = σ(bνit). Large values of INV ACCQ represent poor accrual
12

quality.
Following Francis, LaFond, Olsson, and Schipper [2004], we develop the earnings persistence
and predictability from estimating equation (8) below. Earnings persistence is the AR(1) slope
coefficient estimate. EARN is measured as firm’s net income before extraordinary items in year t
divided by the weighted average number of outstanding shares during year t (COMPUSTAT #18
over average #25).
EARNi,t = λ0,i + λ1,iEARNi,t−1 + i,t. (8)
For each firm-year, we estimate equation (8) using maximum likelihood estimation and rolling
ten-year windows. This procedure yields firm- and year- specific estimates of λ, which captures the
persistence of earnings. Values close to one imply persistent earnings, while values close to zero
imply highly transitory earnings. To be consistent with other measures of earnings quality in a
directional sense, we define an inverse of persistence, INV PERS = −λ, the negative of the AR(1)parameter, so that larger values of INV PER represents less persistent earnings.
By the same token, we define an inverse of predictability as the square root of the error variance
estimated from equation (8), INV PRED = σ(bi,t). Large values of INV PRED imply less pre-
dictable earnings. Thus, the higher values of INV ACCQ, INV PERS, and INV PRED indicate
poor earnings quality.
3.1.4 Research Design
Our hypotheses relate to the association between the two dimensions of corporate governance —
strength and adequacy — and earnings quality. To examine the association between each dimension
of corporate governance while controlling for the other, we use a simple two-by-two design to
classify sample observations along the two corporate governance dimensions.7 Figure 1 illustrates
this classification.
(Insert figure 1 about here)
To classify firms into high or low adequacy groups, we use the frequency measure of consistent
profitability performance, ADJROED_FREQ, defined in equation (4). ADJROED_FREQ is the
number of years in which the firm’s yearly industry-adjusted ROE, ADJROE, is greater than
or equal to zero. A high ADJROED_FREQ value is indicative of the adequacy of corporate
governance. Consequently, over the sample period, if a firm’s ADJROED_FREQ is ranked in the
7The underlying assumption of the two-by-two design is the independence of strength and adequacy of corporategovernance. Assuming the strength and adequacy are dependent, there would be cell(s) without any observations.However, we did not observe such a pattern.
13

top 50% of the sample, we classify that firm as having adequate governance (referred as good-
performance firms); otherwise we classify it as having (relatively) inadequate corporate governance
(referred as bad-performance firms).
Similarly, we use the frequency measure of governance index, ADJGINDEXD_FREQ, defined
in equation (2), to classify firms into strong- or weak- governance firms. Higher value of ADJGIN-
DEXD_FREQ would indicate that the firm has consistently weaker governance compared to other
firms in its industry. Therefore, over the sample period, if a firm’s ADJGINDEXD_FREQ is ranked
in the top 50% of the sample, we classify that firm as having weak governance (hereafter weak-
governance firms); otherwise we classify it as having strong governance (hereafter strong-governance
firms).
This structure allows us to test our hypotheses by making intergroup comparisons of earn-
ings quality. Referring to Figure 1, Group 1 comprises firms with adequate but weak gover-
nance (hereafter ‘good-performance/weak-governance firms’). Relatively speaking, weak gover-
nance is adequate in controlling the agency problem for these firms, because they have low mon-
itoring needs. Group 2 denotes the firms with adequate but strong governance (hereafter ‘good-
performance/strong-governance firms’). Thus, by design, firms in both Group 1 and Group 2 have
adequate governance, although they have different levels of governance.
Firms in Group 3 have inadequate weak governance (hereafter ‘bad-performance/weak-governance
firms’). For these firms, strengthening governance is arguably beneficial from a shareholder perspec-
tive. Finally, firms in Group 4 have inadequate strong governance (hereafter ‘bad-performance/strong-
governance firms’). For these firms, prevailing governance levels (despite being strong) are likely
to be less adequate (relatively speaking).
4 Data
4.1 Sample
To construct our sample, we start with the entire time period for which financial data are
available in Annual COMPUSTAT database (1950-2005).8 Given that we estimate earnings quality
measures using rolling ten-year windows, we include a firm in year t sample if data are available for
years t−9 to t. We require that the firm should have the relevant financial information in Standard& Poor’s Annual COMPUSTATMerged Industrial Research File for the sample period. We exclude
firm-year observations affected by mergers and/or acquisitions in order to mitigate the impact of
8To maximize the sample size, the sample period starts in year of 1950, which is the earliest year covered inCompustat. The sample period ends in year of 2005, since there is no available value of future cash flow in year of2006 or afterwards.
14
these activities on firm performance. Finally, we delete firms in the financial sector because they
have different financial reporting characteristics. We winsorize the financial variables at the one
percent and ninty-nine percent level. We also require a minimum of ten sample observations in each
year within each industry in order to enable industry-level estimations. These steps yield a sample
of 3, 060 unique firms and 49, 506 firm-year observations (hereafter, the ‘full sample’). Panel A of
table 1 provides a summary of the sample selection procedure for this full sample.
(Insert table 1 about here)
We obtain data regarding corporate governance index from the Investor Responsibility Research
Center’s (IRRC) corporate governance file. To be included in the sample, we require that a firm have
Governance Index value in one of the years for which IRRC provides this index (1990, 1993, 1995,
1998, 2000, or 2002), and relevant financial information in the Annual COMPUSTAT database
described above. Following other studies in the literature that have employed Gompers’ index, we
replace the missing values of GINDEX by the value of the most recently reported GINDEX in
IRRC.9
This index sample period spans 23 years from 1981 to 2003. The index sample period commences
in 1981 because we require ten years of GINDEX data to compute ADJGINDEXD_FREQ on a
rolling basis, and the earliest year covered in IRRC dataset is the year of 1990. We are limited
in our ability to compute ADJGINDEXD_FREQ on a rolling basis because of GINDEX is only
available in discrete intervals after 1990. For instance, since GINDEX is only available from 1990
onward, calculation of ADJGINDEXD_FREQ for 1990 is based only on one year of data and so on.
Finally, GINDEX data is also available for year of 2004 and 2006. However, due to the unknown
impact of SOX on corporate governance, we did not use GINDEX in 2004 or 2006. Therefore, the
index sample period ends in 2003.
Our final sample for which we have GINDEX data consists of 409 firms with 5, 806 firm-year
observations (hereafter, the ‘index sample’). Panel B of table 1 provides a summary of the sample
selection procedure for this index sample.
4.2 Classification
As described in Section 3, we first classify firms by ADJROED_FREQ. Table 2 presents key
descriptive statistics for the full sample. Panel A provides the statistics for the entire sample,
and panel B characterizes subsamples consisting of good- or bad-performance firms. As we can9We first replace the missing values of GINDEX by the value of the most recently reported GINDEX in previous
periods. If there are still some remaining missing values, then we replace them by the first non-missing value in thefollowing periods.
15

see from panel B, these two groups have distinctly different characteristics. By design, good-
performance firms have higher values of ROE_AVG, ADJROE_AVG, and ADJROED_FREQ
than bad-performance firms. Note that good-performance firms are also larger in size (LOGSIZE),
price-to-earnings ratio (PE), market-to-book ratio (M/B) and leverage (LEVERAGE) than bad-
performance firms. The differences in values of the above variables are statistically significant.
These distinct profiles suggest that partitioning the sample based on consistent past performance
appears to result in groups that differ in the extent of the residual agency problem.
(Insert table 2 about here)
Our research design involves classifying firms into four groups and making inter-group com-
parisons: Group 1 — good-performance /weak-governance firms, Group 2 — good-performance
/strong-governance firms, Group 3 — bad-performance /weak-governance firms, and Group 4 —
bad-performance /strong-governance firms.
We use cross-sectional median values of ADJGINDEXD_FREQ, defined in equation (2), to
classify firms into strong governance (below the median) and weak governance (above or equal to
the median); and ADJROED_FREQ, defined in equation (4), to classify firms into bad performance
(below the median) and good-performance firms (above or equal to the median).
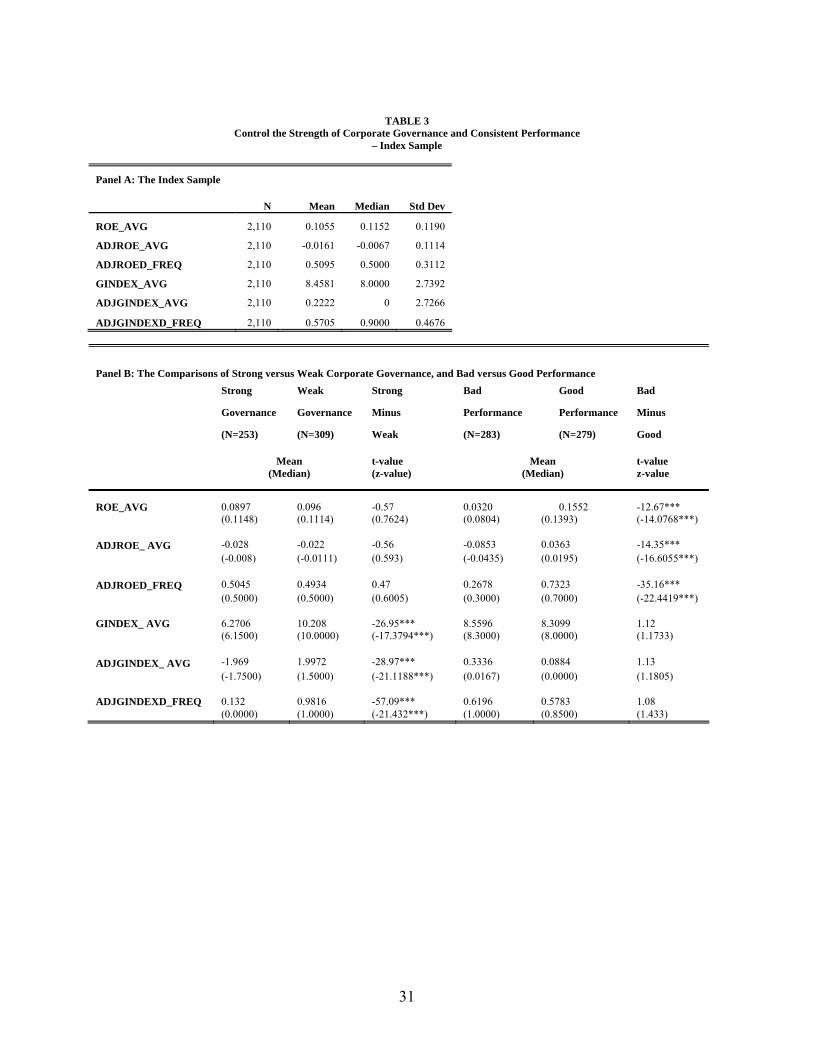
(Insert Table 3 about here)
Panel A of table 3 reports the descriptive statistics for the overall index sample. The results
reported in panel B, table 3 indicate that strong- or weak- governance firms and good- or bad-
performance firms have distinct profiles.
Testing Hypotheses 2a requires that there be no significant difference in the strength of corporate
governance between Group 1 and Group 3 (given weak governance) and between Group 2 and Group
4 (given strong governance). Referring to panel C of table 3, notice that the mean (median) values
of GINDEX_AVG, ADJGINDEX_AVG, and ADJGINDEXD_FREQ do not differ statistically
across Groups 1 and 3.10 Panel C of table 3 also reports that, on average, GINDEX_AVG,
ADJGINDEX_AVG, and ADJGINDEXD_FREQ values do not differ statistically between Groups
2 and 4.
Similarly, tests involving comparisons of Groups 1 and 2 require that there be no significant dif-
ference in consistent past performance between these two groups (i.e., tests of Hypothesis 3a). Refer-
ring to panel C of table 3, the differences in ROE_AVG, ADJROE_AVG and ADJROED_FREQ
across these two groups are not statistically significant.10 In computing these means (medians), we first compute the over-time mean (median) for each firm in the group,
and then compute the cross-sectional mean (median) value for the group.
16

5 Results
5.1 Past Performance and Earnings Quality
In Hypothesis 1a, we posited that earnings quality should be higher for good-performance firms
than for bad-performance firms. Table 4 reports the results relating to this hypothesis.
(Insert table 4 about here)
In panel A, we report estimates of the inverses of accrual quality (INV ACCQ), earnings per-
sistence (INV PERS), and earnings predictive ability (INV PRED) for the full sample. These
estimates are comparable in magnitude to the corresponding estimates presented in Francis, La-
Fond, Olsson, and Schipper [2004], although our estimates of INV PRED is little on the higher
side. Panel B reports that good-performance firms have lower values of INV ACCQ, INV PERS,
and INV PRED relative to bad-performance firms. In particular, the mean value of INV ACCQ
is 0.0294 for good performance firms which is significantly lower than the mean value of 0.0414 for
bad performance firms (t-statistic for difference (bad-good) = 20.75, p < 0.01). The mean value of
INV PERS for good performance firms is −0.4380 which is significantly lower than the mean value−0.3589 for bad performance firms (t-statistic for difference (bad-good) = 14.78, p < 0.01). Finally,the mean value of INV PRED for good performance firms is 0.9592, which is also significantly
lower than the mean value of 1.1722 for bad performance firms (t-statistic for difference (bad-good)
= 8.89, p < 0.01).11 Since lower values of these variables indicate high reporting/earnings quality,
these results support Hypothesis 1a. Further, to the extent that consistent past performance re-
flects the residual agency problem, these results suggest that earnings quality is higher for firms
with adequate corporate governance.
5.2 Governance Strength, Past Performance, and Earnings Quality
5.2.1 Univariate Analysis
Table 5 presents descriptive statistics on the three inverse measures of earnings quality: IN-
VACCQ, INVPERS, INVPRED. Panel A, table 5 reports the statistics for the index sample. These
values are somewhat different from the statistics for the full sample reported in panel A of table 4.
One reason for this difference between the index sample and the full sample is that the index sample
consists of S&P 1500 firms because the IRRC dataset only covers these firms. Since S&P 1500 firms
tend to be larger and better performing firms, Hypothesis 1a would imply that the earnings quality
would be better for these firms. Indeed, the values of INV ACCQ and INV PRED reported in11The results of the median tests follow the same pattern as those of the mean tests.
17

panel A, table 5 are lower than those reported in panel A, table 4, indicating that earnings quality
is on average higher for firms in the index sample relative to firms in the full sample. However, the
INV PERS measure does not support this inference because the value of INV PERS reported in
panel A of table 5 is higher than that reported in panel A of table 4.
(Insert table 5 about here)
Referring to panel B of table 5, the mean value of INVPRED is 0.7799 for strong-governance
firms, which is lower than the mean value 0.8778 for weak-governance firms. However, the mean
values of INV ACCQ and INV PERS for firms with strong-governance firms are not significantly
different from the mean values for weak-governance firms. Surprisingly, the median value of IN-
VACCQ is 0.0153 for strong-governance firms, which is statistically significantly higher than the
mean value 0.0140 for weak-governance firms. The mixed results in fact suggest that strong-
governance firms do not necessarily have high earnings quality relative to weak-governance firms,
since the higher values of INV ACCQ, INV PERS, INV PRED indicate low earnings quality.
Bad-performance firms have significantly higher values of INVACCQ, INVPERS, and INVPRED
than good-performance firms. Because the higher values of these variables indicate low earnings
quality, this result implies that good-performance firms have higher earnings quality than bad-
performance firms. Coupled with results in panel B of table 4, the results support our Hypothesis
1a, and therefore Hypothesis 1. That is, firms with adequate governance, or firms with consistently
superior profitability relative to the industry, are associated with higher earnings quality relative
to firms that are not doing as well, regardless of the strength of governance.
Hypotheses 2a states that earnings quality should be higher for good-performance firms rela-
tive to bad-performance firms, controlling for the strength of corporate governance. Panel C of
table 5 shows that there is a statistically significant negative difference in INV PRED between
good-performance/weak-governance firms (Group 1) and bad-performance/weak-governance firms
(Group 3) (t = −7.20, p-value< 0.001), and between good-performance/strong-governance firms
(Group 2) and bad-performance/strong-governance firms (Group 4) (t = −6.37, p-value< 0.001)
(see table 5, panel C). The results are similar with INV ACCQ and INV PERS measures as well,
and support Hypothesis 2a.
Hypothesis 3a implies that as long as firms are consistently outperforming other firms in their
respective industries (i.e., the governance is adequate), there is no reason to expect earnings quality
to be different between weak-governance firms and strong-governance firms. Referring to panel C of
table 5, the mean value of INVACCQ is 0.0171 for good performance /weak-governance firms, which
is significantly lower than the man vlaue 0.0192 for good performance /strong governance firms.
18

Meanwhile, the mean vlaue of INVPRED is 0.7117 for good performance /weak-governance firms,
which is marginally significantly higher than the man value 0.6380 for good performance/strong
governance firms. Again, the mixed results indicate that firms with weak governance may not
necessarily have low earnings quality relative to firms with strong governance.
Overall, the results reported in table 5 support the conclusion that it is the adequacy rather than
the strength of governance that is associated with earnings quality. In the next section, we perform
a multivariate analysis to ascertain that these results hold after controlling for other determinants
of earnings quality and firm performance.
5.2.2 Multivariate Analysis
A multitude of factors are likely to influence the association between earnings quality and
corporate governance. In this section, we perform a multivariate analysis to control for the effects
of some of these factors in investigating the impact of the strength and the adequacy of governance
on earnings quality. Specifically, as shown in equation (9), we control for the impact of firm size
(LOGSIZE), firm capital structure (LEVERAGE), the extent of firm growth (M/B) and industry
effect (IND) on our results. We consider these variables for two reasons. First, as shown in table 2,
there are significant differences in these variables between firms with good and bad consistent past
performance.12 Second, these variables are identified in prior literature (Burgstahler and Dichev
[1997], Hodgson and Stevenson-Clarke [2000], Lee, Li and Yue [2005]) as being associated with
the extent of earnings management and earnings quality. Specifically, we estimate the following
regression model:
INV EQi,t = θ0 +Xj=1
θ1,jINDj + θ2GROUPi,t +
θ3LOGSIZEi,t + θ4LEV ERAGEi,t + θ5M/Bi,t + i,t, (9)
where INV EQ: represents the inverse of earnings quality– INVACCQ, INVPERS, or INVPRED;
IND variables are industry dummy variables which assumes a value of one if a firm belongs to a
specific industry (we follow the industry classification used in Barth, Cram and Nelson [2001]), zero
otherwise; GROUP : is the dummy variable which takes on a value of one (and zero otherwise) if
(i) the firm belongs to Group 2 or Group 3 when the comparisons are between Groups 1 and 2,
or Groups 1 and 3; (ii) the firm belongs to Group 4 when the comparisons are between Groups
2 and 4, or Groups 3 and 4; LOGSIZE: represents firm size, calculated as the natural log of
12 In the untabulated descriptive statistics of the index sample, there are significant differences in these variablesbetween good performance/weak governance firms and bad performance/weak governance firms.
19

lagged assets (COMPUSTAT #6); LEV ERAGE: represents firm leverage ratio, calculated as the
long-term debt (COMPUSTAT #9) over total assets (COMPUSTAT #6); M/B: represents firm’s
market-to-book ratio, calculated as market value (COMPUSTAT #199 × #25) over book value
(COMPUSTAT #60).
Evidence in Burgstahler and Dichev [1997] indicates that medium and large firms exhibit more
pronounced earnings management. Thus, we expect the coefficient of LOGSIZE to be positive,
θ3 > 0. The positive θ3 indicates low earnings quality or more earnings management as firm size
increases. Hodgson and Stevenson-Clarke [2000] provide evidence that the likelihood of earnings
management increases as the proximity to debt covenants increases. Thus, we expect the coefficient
of LEVERAGE to be positive, θ4 > 0. The positive θ4 indicates low earnings quality or high
earnings management as LEV ERAGE increases. Lee, Li and Yue [2005] indicate that growth
firms have low earnings quality. Using M/B as a proxy for growth, we expect its coefficient to be
positive, θ5 > 0.
(Insert table 6 about here)
Table 6 reports the multivariate regression results and highlights several key points. First,
Hypothesis 2a predicts a positive coefficient for GROUP (θ2) in equation (9) when we com-
pare Groups 1 and 3 (good-performance/weak-governance firms versus bad-performance/weak-
governance firms). The results reported in table 6 support this prediction. For example, the
null hypothesis that θ2 = 0 is rejected at conventional levels of significance when dependent vari-
ables are INV ACCQ (t = 3.99, p < .0001), INV PERS (t = 4.31, p < .0001), and INV PRED
(t = 6.78, p < .0001).
Second, Hypothesis 2a also predicts a positive coefficient for GROUP (θ2) in equation (9) when
the comparison is Group 2 versus Group 4 (good-performance/strong-governance firms versus bad-
performance/strong-governance firms). Again, the results in table 6 provide strong support to this
prediction; the null hypothesis that θ2 = 0 is rejected at conventional levels of significance when
dependent variables are INV ACCQ (t = 3.24, p = 0.0012), INV PERS (t = 2.46, p < 0.0141) ,
and INV PRED (t = 6.23, p < .0001).
Finally, there is indeed no statistically significant difference in INV PERS and INV PRED be-
tween Groups 1 and 2 (good-performance/weak-governance firms versus good-performance/strong-
governance firms). We fail to reject the null that earnings quality is not different between these
two groups using INV PERS and INV PRED. Although there is a significant difference between
these two groups in INVACCQ, the accrual quality of good-performance/strong governance firms
is lower than that of good-performance/weak governance firms. Such results is contrary to our
20

intuition that strong governance associates with high earnings quality.
As reported in table 6, θ3 is positive as indicated in prior literature. The positive θ3 indicates
more earnings management or low earnings quality as firm size increases. However, θ3 is nega-
tive when we use INV ACCQ as dependent variable. Turning to LEV ERAGE, the sign of θ4 is
positive as predicted when we use INVPRED as dependent variable. While, θ4 is negative when
we use INV ACCQ (INV PERS) as the dependent variable and compare bad-performance/weak-
governance firms and bad-performance /strong-governance firms (good-performance /weak-governance
firms and bad-performance /weak-governance firms). As reported in table 6, the signs of θ5 are
mixed. We are not able to offer a good explanation for these results with respect to M/B.13
6 Sensitivity Tests
6.1 Alternative Corporate Governance Measures
In the main tests, we use GINDEX as a measure of the strength of corporate governance. As
a robustness check, we use two components of GINDEX to measure the strength of corporate
governance; namely, the percentage of the independent board members, PCTONBD; the board
size, BBSIZE.
6.1.1 Percentage of Independent Board
The percentage of independent board members is widely used by researchers interested in the
association between governance and earnings management. For example, Beasley [1996] show that
no-fraud firms have boards with significantly higher percentages of outside members than fraud
firms. Peasnell, Pope and Young [2005] provide evidence that the incidence of earnings management
depends on the proportion of outsiders on the board, using UK firms.
We use the frequency with which a firm’s PTCONBD fall above or below the industry median
score over the sample period. We define ADJPCTONBD_FREQ be the number of years in which
the firms’ yearly industry-adjusted PCTONBD, ADJPCTONBD, is greater than or equal to zero:
ADJPCTONBD_FREQi,t=YEARS
¡PCTONBDA
i,τ ≥MEDIAN¡PCTONBDA
τ
¢¢N
, (10)
where N represents the total number of observations for each firm over the rolling ten-years window
(N=10); A represents the industry to which the firm belongs; t ∈ (1990 − 2003); τ ∈ (1981 −13 In the untabulated descriptive statistics of the index sample, the average values of M/B are higher in good-
performance firms than in bad-performance firms, regardless of (or controlling) the strength of corporate governance.
21
2003). Specifically, to measure the strength of corporate governance in period t, equation (10) is
estimated using all available data from t − 9 until year t. That is, when t = 1990, τ ∈ (1981 −1990);when t = 1991, τ ∈ (1982 − 1991); and so on. A higher value of ADJPCTONBD_FREQ
would indicate that the firm has consistently stronger corporate governance compared to other
firms in its industry. Over the sample period, if a firm’s ADJPCTONBD_FREQ is ranked in the
top 50% of the sample, we classify that firm as having strong governance; otherwise we classify it
as having weak governance.
(Insert table 7 about here)
As shown in panels A of table 7, the results are again consistent with our main results: the
mean values of INV ACCQ, INV PERS and INV PRED for good-performance/weak-governance
firms are significantly lower than the mean values for bad-performance/weak-governance firms. The
mean values of the inverse of earnings quality, except for INVACCQ, for good-performance/strong-
governance firms are significantly lower than the mean values for bad-performance/strong-governance
firms. The results imply that given same level of governance, the earnings quality is a function of
consistent past performance - the adequacy of governance. Also, as before, we are not able to reject
the null hypothesis that Groups 1 and 2 have the same reporting/earnings quality, except for the
earnings predictability.
6.1.2 Board Size
The size of the board of director is the other factor popularly used by researchers to proxy the
strength of corporate governance (Denis [2001], Wilkinson and Clements [2006]). Thus, we use the
board size as an alternative measure of the strength of corporate governance in our robustness test.
We define ADJBDSIZE_FREQ be the number of years in which the firms’ yearly industry-
adjusted BDSIZE, ADJBDSIZE, is greater than or equal to zero:
ADJBDSIZE_FREQi,t=YEARS
¡BDSIZEAi,τ ≥MEDIAN
¡BDSIZEAτ
¢¢N
, (11)
where N represents the total number of observations for each firm over the rolling ten-years win-
dow (N=10); A represents the industry to which the firm belongs. A higher value of ADJBD-
SIZE_FREQ would indicate that the firm has consistently stronger corporate governance compared
to other firms in its industry. Again, over the sample period, if a firm’s ADJBDSIZE_FREQ is
ranked in the top 50% of the sample, we classify that firm as having strong governance; otherwise
we classify it as having weak governance.
22

As shown in panel B of table 7, the mean values of INVACCQ, INVPERS and INVPRED
for good-performance /strong-governance firms are significantly lower than the mean values for
bad-performance/strong-governance firms (Group 2 versus Group 4). Although the mean value
of INV PRED for good-performance/weak governance firms is significantly lower than the mean
value for bad-performance /weak-governance firms (Group 1 versus Group 3), the mean values of
INV ACCQ and INV PERS for these two groups are not significantly different. Interestingly, the
mean values of the inverse of earnings quality, INV ACCQ, for good-performance/weak governance
firms are significantly higher than the mean values for good-performance /strong governance firms
(Group 1 versus Group 2). However, the mean values of INV PRED for good-performance/weak-
governance firms are significantly lower than the mean values for good-performance/strong gover-
nance firms (Group 1 versus Group 2). The mixed results indicate that we can not reject the null
hypothesis 3(a) in one of the directions.
Many studies argue that the notion that larger board size represents strong governance may be
misplaced. On one hand, the costs of coordination and free riding are less for smaller boards. Many
studies also indicate lower earnings management as board size decreases. On the other hand, many
studies argue for larger size boards in firms. For example, Adams and Mehran [2005] documents
that banking firms with larger boards do not underperform their peers in terms of Tobin’s Q.
Consequently, given good performance, the comparison of weak and strong governance could be
affected by classification errors. However, such classification errors only affect our ability to control
for the strength of governance. Therefore, the results involving comparisons of Groups 1 and 3,
and Groups 2 and 4 should still hold.
7 Conclusion
In this paper, we provide evidence on the link between firm’s report/earnings quality and
corporate governance. Specifically, we investigate whether accrual quality, earnings persistence and
earnings predictive ability are affected by the adequacy rather than the strength of governance. A
key aspect of our study is the distinction that we draw between the adequacy of governance and
the strength of governance (as measured by Gompers’ Index). Based on agency theory, we treat
existing levels of corporate governance in firms as being more adequate, if residual agency problems
are less.
Our results can be summarized as follows. First, regardless of strength of corporate governance,
we find firms that have consistently outperform their industry rivals have high accrual quality, high
earnings persistence, and high earnings predictive ability. Our results suggest that as the corporate
23

governance is adequate, regardless of the strength of governance, earnings quality is high.
Second, we find that firms with adequate governance tend to have high accrual quality, high
earnings persistence, and high earnings predictive ability, given the same level of corporate gover-
nance. This suggests that weak governance can be adequate some times in controlling the agency
problem, such as when firms have low monitoring needs or less of an agency problem to begin with.
Thus, our results suggest adequacy of corporate governance is a significant determinant of earnings
quality. These results appear robust to alternative proxies for strength of governance.
Finally, an important aspect of our analysis is the use of past industry-adjusted performance as
a measure of the residual agency problem, and therefore of the adequacy of corporate governance.
We choose this measure based on the finding in Core, Holthausen, and Larcker [1999] that firms
with greater agency problems perform worse. Our purpose here has been to offer a first step
in proposing and testing an empirical framework linking adequacy of corporate governance and
reporting quality. Clearly, an avenue for future research is to explore ways in which to refine the
adequacy measure.
24

References
Adams, R. B. and Mehran, H. “Corporate Performance, Board Structure and its Determi-
nants in the Banking Industry.” Working paper, 2005.
Agrawal, A. and Knoeber, C. R. “Firm Performance and Mechanisms to Control Agency
Problems between Managers and Shareholders.” Journal of Financial & Quantitative
Analysis 31 (1996): 377.
Barth, M.; Cram, D. C.; and Nelson, K. K. “Accruals and the Prediction of Future
Cash Flows.” The Accounting Review 76 (2001): 27—58.
Beasley, M. S. “An Empirical Analysis of the Relation between the Board of Director
Composition and Financial Statement Fraud.” The Accounting Review 71 (1996): 443—
465.
Beatty, A. and Harris, D. G. “The Effects of Taxes, Agency Costs and INformation
Asymmetry on Earnings Management: A Comparison of Public and Private Firms.” Review
of Accounting Studies 3 (1998): 299—326.
Bebchuk, L. and Fried, J. “Executive Compensation as an Agency Problem.” Journal of
Economic Perspectives 17 (2003): 71—92.
Berger, A. N. and di Patti, E. B. “Capital Structure and Firm Performance: A New
Approach to Testing Agency Theory and an Application to the Banking Idustry.” Journal
of Banking & Finance 30 (2006): 1065—1102.
Bhagat, S. and Jefferris., R. The Econometrics of Corporate Governance Studies. MIT
Press, 2002.
Brown, L. D. and Caylor, M. L. “Corporate Governance and Firm Performance.” Working
paper, 2004.
Burgstahler, D. and Dichev, I. “Earnings Management to Avoid Earnings Decreases and
Losses.” Journal of Accounting and Economics 24 (1997): 99—126.
Cheng, S. “R&D Expenditures and CEO Compensation.” The Accounting Review 79 (2004):
305—328.
Chtourou, S. M.; Bedard, J.; and Courteau, L. “Corporate Governance and Earnings
Management.” Working paper, 2001.
Cohen, D. A.; Dey, A.; and Lys, T. Z. “Real and Accrual-based Earnings Management in
the Pre- and Post-Sarbanes Oxley Periods.” The Accounting Review (2008):. Forthcoming.
25

Core, J. E.; Guay, W. R.; and Rusticus, T. “Does Weak Governance Cause Weak Stock
Returns? An Examination of Firm Operating Performance and Investors’ Expectations.”
Journal of Finance 61 (2006): 655—687.
Core, J. E.; Holthausen, R.; and Larcker, D. “Corporate Governance, Chief Executive
Officer Compensation, and Firm Performance.” Journal of Financial Economics 51 (1999):
371—406.
Dechow, P. M. and Dichev, I. D. “The Quality of Accruals and Earnings: The Role of
Accrual Estimation Errors.” Accounting Review 77 (2002): 35—59.
Denis, D. K. “Twenty-five Years of Corporate Governance Research . . . and Counting.”
Review of Financial Economics 10 (2001): 191—212.
Francis, J.; LaFond, R.; Olsson, P. M.; and Schipper, K. “Costs of Equity and
Earnings Attributes.” The Accounting Review 79 (2004): 967—1010.
Gabrielle, M. “Outside Board Members Earning Record Sums.” In “CFO Magazine,” 2001.
Gompers, P.; Ishii, J.; and Metrick, A. “Corporate Governance and Equity Prices.”
Quarterly Journal of Economics 118 (2003): 107—155.
Hodgson, A. and Stevenson-Clarke, P. “Accounting Variables and Stock Returns: The
Impact of Leverage.” Pacific Accounting Review 12 (2000): 37—65.
Indjejikian, R. J. and Nanda, D. D. “Executive Target Bonuses and What They Imply
about Performance Standards.” The Accounting Review (2002): 793—819.
Ittner, C. D.; Lacker, D. F.; and Rajan, M. V. “The Choice of Performance Measures
in Annual Bonus contracts.” The Accounting Review (1997): 231—255.
Kim, J. and Yi, C. H. “Ownership Structure, Business Group Affiliation, Listing Status,
and Earnings Management: Evidence from Korea.” Contemporary Accounting Research 23
(2006): 427—64.
Kumar, P. and Sivaramakrishnan, K. “Who Monitors the Monitor? The Effect of Board
Independence on Executive Compensation and Firm Value.” Review of Financial Studies
(2008): Forthcoming.
Lambert, R. A. and Larcker, D. F. “An Analysis of the Use of Accounting and Market
Measures of Performance in Executive Compensation Contracts.” Journal of Accounting
Research (1987): 85—125.
Larcker, D.; Richardson, S. A.; and Tuna, A. I. “How Important is Corporate Gover-
nance?” Working paper, 2005.
26

Lee, C.; Li, L. Y.; and Yue, H. “Performance, Growth and Earnings Management.” Work-
ing paper, 2005.
Li, H.; Pincus, M.; and Rego, S. O. “Market Reaction to Events Surrounding the Sarbanes-
Oxley Act of 2002.” Working paper, 2004.
Lobo, G. J. and Zhou, J. “Did Conservatism in Financial Reporting Increase after the
Sarbanes-Oxley Act? Initial Evidence.” Accounting Horizons (2006): 57—73.
Morgensen, G. “Charity Begins at the Board...” In “New York Tiimes,” 2005.
Peasnell, K.; Pope, P.; and Young, S. “Board Monitoring and Earnings Management:
Do Outside Directors Influence Abnormal Accruals?” Journal of Business Finance & Ac-
counting. 32 (2005): 1311—1346.
Schipper, K. and Vincent, L. “Earnings Quality.” Accounting Horizons 17 (2003): 97—110.
Wilkinson, B. R. and Clements, C. E. “Corporate governance mechanisms and the early-
filing of CEO certification.” Journal of Accounting and Public Policy 25 (2006): 121—139.
Zhang, I. X. Economic Consequences of the Sarbanes-Oxley Act of 2002. Ph.D. thesis, 2005.
27

Group 4Inadequate Strong Corporate
Governance
Group 2Adequate Strong Corporate
Governance
Group 3Inadequate Weak Corporate
Governance
Group 1Adequate Weak Corporate Governance
Group 4Inadequate Strong Corporate
Governance
Group 2Adequate Strong Corporate
Governance
Group 3Inadequate Weak Corporate
Governance
Group 1Adequate Weak Corporate Governance
Adequacy
Low High
Stre
ngth
Hig
hLo
w
Figure 1: Classification of firms based on strength and adequacy of corporate governance
28

29
TABLE 1 Sample Selection Procedures
Panel A: The Full Sample
Firm Year Firms
Firm year observations in COMPUSTAT for years 1950-2006 788,304 26,945
Firm year observations after deleting firm year observations with mergers and acquisitions 744,871 26,945
Firm year observations after deleting financial industries and other industry 582,394 20,701
Firm year observations without missing financial variables 124,953 15,248
Firm year observations after deleting firms without 10 continuous firm year observations 49,813 3,077
Firm year observations after deleting industries with less than 10 observations in each year from 1950 to 2005 49,506 3,060
Total 49,506 3,060
Panel B: The Index Sample
Firm Year Firms
Firms year observations in IRRC datasets with Governance Index for years 1990, 1993, 1995, 1998, 2000, 2002 10,120 3,180
Firms year observations in IRRC datasets with the size of board of directors and the percentage of independent board of directors for years 1997-2003 except for year 2001
8,379
2,654
Firm year observations in IRRC with either Governance Index for years 1990, 1993, 1995, 1998, 2000, 2002 or the information for board of directors for years 1997-2003 except for year 2001 14,364 3,180
Firm year observations covered in IRRC, and COMPUSTAT (1950-2004) 59,307 2,682
Firm year observations after deleting firm year observations with mergers and acquisitions 48,048 2,667
Firm year observations after deleting financial industries and other industry 41,392 2,229
Firm year observations without missing financial variables 23,463 1,977
Firm year observations after deleting firms without 10 continuous firm year observations 13,456 626
Firm year observations after deleting observations before 1990 6,547 456
Firm year observations after deleting industries with less than 10 observations in each year from 1990 to 2003 5,806 409
Total 5,806 409

30
TABLE 2 The Descriptive Statistics of the Sample – Full Sample
Panel A: The Full Sample
N Mean Median Std
ROE_AVG 21,111 0.0528 0.1003 0.2252
ADJROE_AVG 21,111 -0.0406 -0.0069 0.2141 ADJROED_FREQ 21,111 0.5040 0.5000 0.3053
ROA 21,111 0.0005 0.0413 0.2225
CFO 21,111 0.0372 0.0743 0.2512
EARN 21,111 2.8093 0.9188 8.2197
LEVERAGE 21,093 0.1810 0.1507 0.1777
M/B 17,626 1.9193 1.2893 3.6349 PE 17,407 11.4372 9.9057 32.1183
LOGSIZE 21,111 4.7024 4.5310 2.4552 Panel B: The Comparison of Firms with Good or Bad-Performance
Bad-Performance Good-Performance Bad Minus Good
N Mean Median N Mean Median t-value z-value
ROE_AVG 10,367 -0.0367 0.0477 10,744 0.1391 0.1345 -60.95*** -80.1576***
ADJROE_AVG 10,367 -0.1306 -0.0548 10,744 0.0462 0.0280 -65.24*** -103.6163***
ADJROED_FREQ 10,367 0.2408 0.3000 10,744 0.7579 0.7000 -231.65*** -138.2492***
ROA 10,367 -0.0449 0.0225 10,744 0.0444 0.0605 -29.6*** -52.3761***
CFO 10,367 -0.0033 0.0552 10,744 0.0762 0.0937 -23.12*** -35.3327***
EARN 10,367 2.2323 0.2944 10,744 3.3660 1.4648 -10.04*** -36.1312***
LEVERAGE 10,360 0.1985 0.1783 10,733 0.1641 0.1274 14.08*** 12.3746***
M/B 8,562 1.8050 1.0594 9,064 2.0272 1.4946 -4.01*** -27.5783***
PE 8,419 9.0517 7.2973 8,988 13.6717 11.6965 -9.44*** -23.9876*** LOGSIZE 10,367 4.3129 4.0050 10,744 5.0782 5.0083 -22.88*** -22.5296***
Table 2 reports descriptive statistics by performance. We also report results of univariate tests of differences between firms with good-
and bad-performance. ROE represents income before extraordinary items over average total equity (COMPUSTAT #18 over average #216). ROE_AVG is the average of a firm’s ROE over the ten-years rolling window, while ADJROE_AVG is the average of the firm’s yearly industry-adjusted ROE (ADJROE) over the ten-years rolling window. ADJROED_FREQ is the number of years in which the firm’s yearly industry-adjusted ROE, ADJROE, is greater than zero (divided by the number of firm observations). Over the ten-years rolling window, if a firm’s ADJROED_FREQ is ranked in the top 50% of the sample, it is assumed to have good performance and adequate corporate governance, whether weak or strong. ROA is the return on assets (COMPUSTAT #18 / average #6). CFO, cash flow from operations, is calculated as net income before extraordinary items (COMPUSTAT #18) less total accruals (ACCBS), where ACCBS= ΔCA - ΔCL - ΔCash + ΔSTDEBT - DEPN; ΔCA is firm's change in current assets (COMPUSTAT #4); ΔCL is firm’s change in current liabilities (COMPUSTAT #5); ΔCash is firm’s change in cash (COMPUSTAT #1); ΔSTDEBT is firm’s change in debt in current liabilities (COMPUSTAT #34); and DEPN is firm’s depreciation and amortization expense (COMPUSTAT #14). EARN is measured as firm’s net income before extraordinary items in year t divided by the average number of outstanding shares during year t (COMPUSTAT #18 over average #25). LEVERAGE is the leverage ratio, measured as long-term debt (COMPUSTAT #9) over total assets (COMPUSTAT #6). M/B is the market-to-book ratio, measured as market value (COMPUSTAT #199 * #25) over book value (COMPUSTAT #60). PE is the price-to-earnings ratio, measured as price (COMPUSTAT #199) over earnings per share (COMPUSTAT #58). LOGSIZE is the log of lagged total assets (COMPUSTAT #6). The t-value represents the t-statistic of the mean test. Z-value represents the z-statistic of the two-sided median test. *, **, and *** indicate significance at the 10%, 5%, and 1% levels, respectively.
31
TABLE 3 Control the Strength of Corporate Governance and Consistent Performance
– Index Sample
Panel A: The Index Sample
N Mean Median Std Dev
ROE_AVG 2,110 0.1055 0.1152 0.1190
ADJROE_AVG 2,110 -0.0161 -0.0067 0.1114
ADJROED_FREQ 2,110 0.5095 0.5000 0.3112
GINDEX_AVG 2,110 8.4581 8.0000 2.7392
ADJGINDEX_AVG 2,110 0.2222 0 2.7266
ADJGINDEXD_FREQ 2,110 0.5705 0.9000 0.4676
Panel B: The Comparisons of Strong versus Weak Corporate Governance, and Bad versus Good Performance
Strong Weak Strong Bad Good Bad
Governance Governance Minus Performance Performance Minus
(N=253) (N=309) Weak (N=283) (N=279) Good
Mean (Median)
t-value (z-value)
Mean (Median)
t-value z-value
ROE_AVG 0.0897 0.096 -0.57 0.0320 0.1552 -12.67*** (0.1148) (0.1114) (0.7624) (0.0804) (0.1393) (-14.0768***) ADJROE_ AVG -0.028 -0.022 -0.56 -0.0853 0.0363 -14.35*** (-0.008) (-0.0111) (0.593) (-0.0435) (0.0195) (-16.6055***) ADJROED_FREQ 0.5045 0.4934 0.47 0.2678 0.7323 -35.16*** (0.5000) (0.5000) (0.6005) (0.3000) (0.7000) (-22.4419***) GINDEX_ AVG 6.2706 10.208 -26.95*** 8.5596 8.3099 1.12 (6.1500) (10.0000) (-17.3794***) (8.3000) (8.0000) (1.1733) ADJGINDEX_ AVG -1.969 1.9972 -28.97*** 0.3336 0.0884 1.13 (-1.7500) (1.5000) (-21.1188***) (0.0167) (0.0000) (1.1805) ADJGINDEXD_FREQ 0.132 0.9816 -57.09*** 0.6196 0.5783 1.08 (0.0000) (1.0000) (-21.432***) (1.0000) (0.8500) (1.433)

32
Panel C: The Four Groups and Comparisons among Four Groups
Group 1 Group 1 Group 2 Group 3
Group 1 Group 2 Group 3 Group 4 Minus Minus Minus Minus
(N=148) (N=131) (N=161) (N=83) Group 2 Group 3 Group 4 Group 4
Mean Median
t-value p-value
ROE_ AVG 0.1575 0.1526 0.0395 0.0220 0.54 9.67*** 8.18*** 0.98
(0.1380) (0.1398) (0.0819) (0.0792) -0.176 10.2868*** 9.734*** 0.4276 ADJROE_ AVG 0.0413 0.0306 -0.0810 -0.0911 1.18 11*** 9.11*** 0.68 (0.0198) (0.0192) (-0.0436) (-0.0423) 0.303 12.3333*** 11.2408*** -0.2913
ADJROED_FREQ 0.7387 0.7252 0.2679 0.2676 0.68 25.66*** 23.99*** 0.02
(0.7000) (0.7000) (0.3000) (0.3000) 0.1292 16.5085*** 14.9922*** 0.0663 GINDEX_ AVG 10.1438 6.2381 10.2677 6.3054 19.01*** -0.55 -0.37 19.08*** (10.0000) (6.1300) (10.0000) (6.1750) 12.3013*** -0.9282 -0.0606 12.4098*** ADJGINDEX_ AVG 1.9699 -2.0373 2.0223 -1.8951 20.11*** -0.25 -0.82 20.96*** (1.6625) (-1.8000) (1.4250) (-1.7104) 15.3077*** 0.2818 -0.3117 13.8476*** ADJGINDEXD_ FREQ 0.9776 0.1273 0.9853 0.1371 39.67*** -0.98 -0.34 40.99*** (1.0000) (0.0000) (1.0000) (0.0000) 15.6867*** -1.1758 -0.4721 15.1978***
Table 3 reports the degree of corporate governance and the performance of the four groups. Specifically, we report the descriptive
statistics of strength of corporate governance and consistent performance for the index sample in panel A. In panel B, we report univariate test results regarding the differences between firms with different degree of corporate governance, and between firms with different levels of consistent performance. In panel C, we report univariate test results regarding differences among the four groups. Please note that Group 1 represents good-performance/weak-governance firms; Group 2 represents good-performance/strong-governance firms; Group 3 represents bad-performance/weak-governance firms; and Group 4 represents bad-performance/weak-governance firms. ROE represents income before extraordinary items over average total equity (COMPUSTAT #18 over average #216). ROE_AVG is the average of a firm’s ROE over the ten-years rolling window, while ADJROE_AVG is the average of the firm’s yearly industry-adjusted ROE (ADJROE) over the ten-years rolling window. ADJROED_FREQ is the number of years in which the firm’s yearly industry-adjusted ROE, ADJROE, is greater than zero (divided by the number of firm observations). Over the ten-years rolling window, if a firm’s ADJROED_FREQ is ranked in the top 50% of the sample, it is assumed to have good performance and adequate corporate governance, whether weak or strong. GINDEX_AVG represents the average of firms’ GINDEX over the ten-years rolling window, while ADJGINDEX_AVG is the average of the firms’ yearly industry-adjusted governance index (ADJGINDEX) over the ten-years rolling window. ADJGINDEXD_FREQ is the number of years in which the firms’ yearly industry-adjusted governance index, ADJGINDEX, is greater than zero (divided by the number of firm observations). Over the ten-years rolling window, if a firm’s ADJGINDEXD_FREQ is ranked in the top 50% of the sample, it is assumed to have weak corporate governance. In computing the mean (median) for each group, we first compute the overtime mean for each firm in the group, and then compute the cross sectional mean (median) value of the group. The t-value represents the t-statistic of the mean test. Z-value represents the z-statistic of the two-sided median test. *, **, and *** indicate significance at the 10%, 5%, and 1% levels, respectively.

33
TABLE 4
The Inverses of Accrual Quality, Earnings Persistence, and Earnings Predictive Ability – Full Sample
Panel A: The Full Sample
N Mean Median Std Dev
INVACCQ 21,111 0.0353 0.0202 0.0421
INVPERS 21,111 -0.3991 -0.4006 0.3903
INVPRED 21,111 1.0638 0.5506 1.7349 Panel B: The Comparison of Good and Bad-Performance
Bad Performance Good Performance Bad Minus Good
(N=10,367) (N=10,744)
Mean Median Mean Median t-value z-value
INVACCQ 0.0414 0.0248 0.0294 0.0174 20.75*** 18.9086*** INVPERS -0.3589 -0.3539 -0.4380 -0.4418 14.78*** 14.0627*** INVPRED 1.1722 0.5706 0.9592 0.5354 8.89*** 3.4622***
Table 4 reports the inverses of accrual quality, earnings persistence and earnings predictive ability of the full sample. Specifically, we
report the values of the above variables for the full sample in panel A. In panel B, we report univariate test results regarding the differences in above three earnings attributes between firms with different levels of performance. INVACCQ, INVPERS and INVPRED are the inverses of the accrual quality, earnings persistence, and earnings predictability. The t-value represents the t-statistic of the mean test. Z-value represents the z-statistic of the two-sided median test. *, **, and *** indicate significance at the 10%, 5%, and 1% levels, respectively.

34
TABLE 5 The Inverses of Accrual Quality, Earnings Persistence, and Earnings Predictive Ability
– Index Sample
Panel A: The Index Sample
N Mean Median Std Dev
INVACCQ 2,110 0.0209 0.0146 0.0192
INVPERS 2,110 -0.3842 -0.4074 0.3635
INVPRED 2,110 0.8319 0.5840 0.7658 Panel B: The Comparisons of Strong versus Weak Corporate Governance, and Bad versus Good Performance
Strong Weak Strong Bad Good
Governance Governance Minus Performance Performance
(N=988) (N=1,122) Weak (N=1,030) (N=1,080)
Bad Minus Good
Mean (Median)
t-value
(z-value) Mean
(Median) t-value
(z-value)
INVACCQ 0.0215 0.0204 1.33 0.0239 0.0182 6.85*** (0.0153) (0.0140) (2.0937**) (0.0161) (0.0133) (4.3542***) INVPERS -0.3854 -0.3831 -0.15 -0.3450 -0.4215 4.86*** (-0.4081) (-0.4055) (-0.1745) (-0.3511) (-0.4650) (5.9217***) INVPRED 0.7799 0.8778 -2.94*** 0.9966 0.6749 9.79*** (0.5301) (0.6468) (-3.7511***) (0.7438) (0.4663) (11.3209***) Panel C: The Four Groups and Comparisons among Four Groups
Group 1 Group 2 Group 3 Group 4 (N=540) (N=540) (N=582) (N=448)
Group 1 Minus
Group 2
Group 1 Minus
Group 3
Group 2 Minus
Group 4
Group 3 Minus
Group 4 Mean
(Median) t-value
(z-value)
INVACCQ 0.0171 0.0192 0.0235 0.0243 -2.27** -5.71*** -4.12*** -0.57 (0.0128) (0.0141) (0.0158) (0.0162) (-1.4599) (-3.3445***) (-1.6607*) (-0.3769) INVPERS -0.4217 -0.4214 -0.3473 -0.3421 -0.01 -3.4*** -3.46*** -0.22
(-0.4803) (-0.4509) (-0.3564) (-0.3414) (-0.7300) (-4.7779***) (-3.7047***) (-0.6282)
INVPRED 0.7117 0.6380 1.0318 0.9508 1.94* -7.2*** -6.37*** 1.49 (0.4788) (0.4512) (0.8028) (0.6723) (0.8516) (-8.1224***) (-7.6649***) (2.8898***)
Table 5 reports the inverses of accrual quality, earnings persistence and earnings predictive ability of the index sample. Specifically,
we report the values of the above variables for the whole index sample in panel A. In panel B, we report univariate test results regarding the differences in above three earnings attributes between firms with different levels of governance and performance. In panel C, we report the mean of the three variables for the four groups, and the test results of differences in above three earnings attributes among the four groups. Please note that Group 1 represents good-performance/weak-governance firms; Group 2 represents good-performance/strong-governance firms; Group 3 represents bad-performance/weak-governance firms; and Group 4 represents bad-performance/weak-governance firms. INVACCQ, INVPERS and INVPRED are the inverses of the accrual quality, earnings persistence, and earnings predictability. The T-value represents the t-statistic of the mean test. Z-value represents the z-statistic of the two-sided median test. *, **, and *** indicate significance at the 10%, 5%, and 1% levels, respectively.

35
TABLE 6 Multivariate Analysis of Earnings Quality
INVACCQ INVPERS INVPRED
Group No. 1 vs. 2 1 vs. 3 2 vs. 4 3 vs. 4 1 vs. 2 1 vs. 3 2 vs. 4 3 vs. 4 1 vs. 2 1 vs. 3 2 vs. 4 3 vs. 4
INTERCEPT 0.0267 0.0465 0.0324 0.0597 -0.8643 -0.8398 -0.7116 -0.6679 -0.2631 -0.5745 -0.7855 -1.0247 (θ0, ?) 4.59*** 6.41*** 5.02*** 7.85*** -5.28*** -5.04*** -4.32*** -3.92*** -1.03 -1.78* -2.54** -2.8***
GROUP 0.0016 0.0040 0.0030 0.00002 0.0259 0.0988 0.0584 0.0202 0.0190 0.3016 0.2769 0.0654 (θ2, +) 2.04** 3.99*** 3.24*** -0.02 1.18 4.31*** 2.46** 0.87 0.56 6.78*** 6.23*** 1.32
LOGSIZE -0.0027 -0.0044 -0.0041 -0.0065 0.0328 0.0205 0.0191 0.0086 0.1132 0.1474 0.1975 0.2475 (θ3, +) -9.48*** -12.5*** -11.97*** -15.72*** 4.16*** 2.54** 2.18** 0.93 9.24*** 9.43*** 12.06*** 12.5***
LEVERAGE 0.0153 0.0028 0.0098 -0.0029 0.1616 -0.0240 0.4020 0.1145 1.2113 0.7622 1.1065 0.6179 (θ4, +) 4.57*** 0.78 2.84*** -0.83 1.72* -0.3 4.58*** 1.44 8.29*** 4.83*** 6.73*** 3.62***
M/B 0.0003 0.0007 -0.0002 0.0000 0.0035 0.0097 -0.0030 0.0041 -0.0359 -0.0222 -0.0536 -0.0076 (θ5, +) 1.63 3.36*** -0.91 -0.09 0.76 2.11** -0.51 0.64 -4.94*** -2.48** -4.87*** -0.55
Adj R-Sq 0.3761 0.3774 0.4792 0.4701 0.0703 0.0828 0.071 0.0382 0.2561 0.2109 0.2732 0.2059 Table 6 reports the regression results using the inverses of accrual quality, earnings persistence and earnings predictive ability as dependent variables. The first line represents the
coefficients of the variables. The second line represents the t-value of the coefficients. Please note that Group 1 represents good-performance/weak-governance firms; Group 2 represents good-performance/strong-governance firms; Group 3 represents bad-performance/weak-governance firms; and Group 4 represents bad-performance/weak-governance firms. INVACCQ, INVPERS and INVPRED are the inverses of the accrual quality, earnings persistence, and earnings predictability.
GROUP: is defined as following • The dummy variable equals to 1 if firm belongs to Group 2 when the comparisons are Group 1 vs. Group 2, 0 otherwise; • The dummy variable equals to 1 if firm belongs to Group 3 when the comparisons are Group 1 vs. Group 3, 0 otherwise; • The dummy variable equals to 1 if firm belongs to Group 4 when the comparison is Group 2 vs. Group 4 and Group 3 vs. Group 4; 0 otherwise. LEVERAGE is the leverage ratio, measured as long-term debt (COMPUSTAT #9) over total assets (COMPUSTAT #6). M/B is the market-to-book ratio, measured as market value
(COMPUSTAT #199 * #25) over book value (COMPUSTAT #60). LOGSIZE is the log of lagged total assets (COMPUSTAT #6). Industry dummy variables included in the model are defined based on Barth, Cram, and Nelson [2001]. The industry dummy variables are omitted in the table. *, **, and *** indicate significance at the 10%, 5%, and 1% levels, respectively.

36
TABLE 7 Sensitivity Tests –Comparisons among Four Groups
Panel A: The Percentage of Independent Board Members on Board
Group 1 Group 1 Group 2 Group 3 Group 1 Group 2 Group 3 Group 4 Minus Minus Minus Minus (N=350) (N=488) (N=344) (N=446) Group 2 Group 3 Group 4 Group 4
Mean
(Median) t-value
(z-value)
INVACCQ 0.0169 0.0179 0.0220 0.0191 -1.02 -4.1*** -1.16 2.13**
(0.0130) (0.0134) (0.0148) (0.0138) (0.6909) (1.2632) (-0.2415) (0.9339)
INVPERS -0.4257 -0.4149 -0.3332 -0.3571 -0.44 -3.78*** -2.25** 0.92
(-0.4453) (-0.4664) (-0.3587) (-0.3570) (-0.6909) (3.2915***) (-3.6646***) (-0.0718)
INVPRED 0.5764 0.7212 0.9444 0.9916 -3.73*** -6.92*** -5.38*** -0.76
(0.4138) (0.5119) (0.7085) (0.6955) (4.0073***) (6.7685***) (-5.1708***) (0.2155)
Panel B: Board Size
Group 1 Group 1 Group 2 Group 3 Group 1 Group 2 Group 3 Group 4 Minus Minus Minus Minus (N=434) (N=404) (N=339) (N=451) Group 2 Group 3 Group 4 Group 4
Mean
(Median)
t-value
(z-value)
INVACCQ 0.0204 0.0152 0.0218 0.0192 5.27*** -1.04 -4.19*** 1.87*
(0.0165) (0.0120) (0.0148) (0.0140) (3.3602***) (-1.0621) (1.9642**) (0.7171) INVPERS -0.4017 -0.4340 -0.3701 -0.3289 1.33 -1.17 -4.48*** -1.57
(-0.4297) (-0.4786) (-0.3652) (-0.3543) (1.5401) (2.1243**) (4.4522***) (-0.5737) INVPRED 0.5563 0.7107 0.8040 1.1005 -4.09*** -5.28*** -7.48*** -5.01*** (0.4115) (0.4985) (0.6298) (0.8224) (-2.8001***) (5.9176***) (6.8092***) (-4.3027***)
Table 7 reports the results of the sensitivity tests. We use the percentage of the independent board members (PCTONBD) and the
board size (BBSIZE) to proxy the strength of corporate governance separately in the sensitivity tests. Please note that Group 1 represents good-performance/weak-governance firms; Group 2 represents good-performance/strong-governance firms; Group 3 represents bad-performance/weak-governance firms; and Group 4 represents bad-performance/weak-governance firms. INVACCQ, INVPERS and INVPRED are the inverses of the accrual quality, earnings persistence, and earnings predictability. The t-value represents the t-statistic of the mean test. Z-value represents the z-statistic of the two-sided median test. *, **, and *** indicate significance at the 10%, 5%, and 1% levels, respectively.


![Corporate Governance Manualpaisalo.in/pdf/corporate-governance-en.pdf · [ 1 ] DEFINITIONS Corporate Governance Corporate Governance is the system of internal controls and procedures](https://static.fdocuments.in/doc/165x107/60457b037dc32d128b177c66/corporate-governance-1-definitions-corporate-governance-corporate-governance.jpg)