The Complete Woodblock Prints of Kitagawa Utamaro: A Descriptive Catalogue

On the application of the Kitagawa–Takahashi diagramto foreign-object damage and high-cycle fatigue
J.O. Peters a,1, B.L. Boyce a,2, X. Chen b, J.M. McNaney a, J.W. Hutchinson b,R.O. Ritchie a,*
a Department of Materials Science and Engineering, University of California, Berkeley, CA 94720-1760, USAb Division of Applied Sciences, Harvard University, Cambridge, MA 02138, USA
Received 20 August 2001; received in revised form 22 November 2001; accepted 28 November 2001
Abstract
The role of foreign-object damage (FOD) and its effect on high-cycle fatigue (HGF) failures in a turbine engine Ti–
6Al–4V alloy is examined in the context of the use of the Kitagawa–Takahashi diagram to describe the limiting con-
ditions for such failures. Experimentally, FOD is simulated by firing 1 and 3.2 mm diameter steel spheres onto the flat
specimen surface of tensile fatigue specimens at velocities of 200 and 300 m/s. Such damage was found to markedly
reduce the fatigue strength of the alloy, primarily due to four factors: stress concentration, microcrack formation,
impact-induced plasticity and tensile residual stresses associated with the impact damage. Two groups of fatigue failures
could be identified. The first group initiated directly at the impact site, and can be readily described through the use of a
fatigue-crack growth threshold concept. Specifically, a Kitagawa–Takahashi approach is presented where the limiting
threshold conditions are defined by the stress-concentration corrected smooth-bar fatigue limit (at microstructurally
small crack sizes) and a ‘‘worst-case’’ fatigue-crack growth threshold (at larger crack sizes). The second group of
failures was caused by fatigue cracks that initiated at locations far from the impact site in regions of high tensile residual
stresses, the magnitude of which was computed numerically and measured experimentally using synchrotron X-ray
diffraction. Specifically, these failures could be rationalized due to the superposition of the residual stresses on the far-
field applied mean stress, leading to a locally elevated load ratio (ratio of minimum to maximum loads). The effects of
residual stress, stress concentration, and microstructurally small cracks are combined in a modified Kitagawa–
Takahashi approach to provide a mechanistic basis for evaluating the detrimental effect of FOD on HCF failures in Ti–
6Al–4V blade alloys. � 2002 Elsevier Science Ltd. All rights reserved.
Keywords: Ti–6Al–4V; Foreign-object damage; High-cycle fatigue; Residual stress; Fatigue-crack initiation; Fatigue-crack growth
threshold
Engineering Fracture Mechanics 69 (2002) 1425–1446
www.elsevier.com/locate/engfracmech
*Corresponding author. Tel.: +1-510-486-5798; fax: +1-510-486-4881.
E-mail address: [email protected] (R.O. Ritchie).1 Now with Department of Physical Metallurgy and Materials Technology, Technical University Hamburg-Harburg, 21071
Hamburg, Germany.2 Now with Sandia National Laboratories, P.O. Box 5800, MS 0899, Albuquerque, NM 87185-0899, USA.
0013-7944/02/$ - see front matter � 2002 Elsevier Science Ltd. All rights reserved.
PII: S0013-7944 (01 )00152-7

1. Introduction
High-cycle fatigue (HCF) of turbine engine disk and blade components represents one of the majorconcerns limiting the readiness and safety of military aircraft. Since in-flight HCF conditions invariablyinvolve high cyclic frequencies, small crack sizes and (in some airfoil locations) very high mean stress levels,a preferred fracture-mechanics based approach for design against HCF can be based on the concept of alimiting threshold for no fatigue-crack growth [1–7]. Foreign-object damage (FOD) by hard particles, suchas stones ingested into the compressor, has been identified as one of the key factors associated with suchHCF related failures in titanium alloy blades [1–4]. Specifically, FOD has been found to reduce the fatiguestrength of fan and compressor blades, principally by causing stress-raising notches [5,6] and microcracks[6] at impact sites; this, in association with the plastic deformation [4] and tensile residual stresses [4]resulting from such impacts, can lead to the early nucleation and growth of fatigue cracks.
Recent studies [8–10] on the HCF properties of an a þ b processed Ti–6Al–4V blade alloy, where FODwas simulated using high-velocity impacts of steel shot on a flat surface, have focused primarily on thedefinition of threshold conditions for crack initiation and growth during subsequent fatigue cycling. Themechanistic effect of FOD was considered in terms of (i) the possibility of microcrack formation inthe damage zone, (ii) the stress concentration associated with the shape of the impact crater, (iii) micro-structural damage from FOD-induced plastic deformation, and (iv) the presence of localized tensile residualhoop stresses in the vicinity of the impact site. Although all of these factors play an important role undercertain conditions, in the case of high impact velocities (300 m/s) the formation of damage-induced mi-crocracks appears to be the primary contributor to lifetime reduction. During subsequent cycling afterimpact, these microcracks, which are formed in the pile-up of material around the rim, can act as preferredsites for propagating fatigue cracks. When applied stresses are large compared to the impact-induced tensileresidual stresses, and in the presence of relatively large (�30–50 lm) impact-induced microcracks, HCFfailures (within 105–106 cycles) initiate directly at the impact site and lead to short fatigue lives. In contrast,at low-applied stresses relative to the residual stresses, HCF failures (after 107–108 cycles) initiate in lo-cations away from the impact site at regions of peak tensile residual stress, and the necessity for cracknucleation leads to longer fatigue lives.
In analyzing the high stress failures, it was found that FOD-initiated microcracks, together with thestress concentration of the indent, were the prime reasons that the HCF failures initiated at the FOD sites.The microcracks (some as small as 1 lm) grew at applied stress intensities as low as DK ¼ 1 MPa
pm,
which is well below the ‘‘worst-case’’ DKTH threshold in this material [11] of 1.9 MPapm based on the
propagation of large cracks (macroscopic ‘‘homogeneous continuum-sized’’ cracks which are considerablylarger than the scale of the microstructure). This worst-case threshold had previously been defined at el-evated mean loads (or load ratios, i.e., the ratio of minimum to maximum loads, in excess of R ¼ 0:9) in anattempt to eliminate effects of crack closure and to provide a lower-bound threshold for propagation [11].However, it is clear that this threshold is only relevant to cracks larger than the scale of the microstructure,i.e., �50–100 lm length in the current microstructure. Since the microcracks associated with impactdamage are more than an order-of-magnitude smaller than this, an alternative approach was proposed[9,10] to describe the threshold HCF conditions in the presence of FOD. This approach was based on aKitagawa–Takahashi diagram where the limiting conditions for failure in this case were defined in termsof the stress-concentration corrected smooth-bar fatigue limit (at microstructurally small cracks sizes) andthe ‘‘worst-case’’ threshold (at larger, ‘‘homogeneous continuum-sized’’ crack sizes).
In contrast to HCF failures under such high-applied stresses, at low-applied stress ranges failures werecaused by fatigue cracks that initiated at locations far from the impact site, specifically in regions of hightensile residual stresses. Accordingly, it is the primary purpose of this study to further examine the utility ofthe Kitagawa–Takahashi approach to provide a general description of HCF failures in impact damaged Ti–6Al–4V. Specifically, we investigate the role of the relative magnitudes of the applied and residual stresses in
1426 J.O. Peters et al. / Engineering Fracture Mechanics 69 (2002) 1425–1446

dictating the sites for the initiation of HCF failures, in order to provide a methodology to describe thelimiting threshold conditions for such failures at both low- and high-applied cyclic stresses. To achieve thisobjective, the magnitudes of the residual stresses in the vicinity of various damage sites are computednumerically [12] and measured experimentally using spatially resolved synchrotron X-ray diffraction (withspot sizes on the order of 300� 300 lm2) [13]. Such stresses are thought to alter the local mean stress (orload ratio) for subsequent fatigue cracking. The role of load ratio on fatigue life is evaluated by determiningsmooth-bar stress-life (S–N) curves over a wide range of load ratios from R ¼ �1 to 0.8. Using such results,a modified Kitagawa–Takahashi approach is presented to provide a phenomenological understanding ofthe effect of FOD on HCF failures in Ti–6Al–4V.
2. Experimental procedures
2.1. Material
The Ti–6Al–4V alloy under investigation was part of a set of forgings produced specifically for the U.S.Air Force sponsored National High-Cycle Fatigue Program, and is representative of material typically usedin the front compressor stages of the turbine engine. The chemical composition is given in Table 1. Thebimodal microstructure of the plate material, consisting of �60% primary a (grain size � 20 lm) within alamellar a þ b matrix, is shown in Fig. 1; this condition has also been termed ‘‘solution treated and ov-eraged’’ (STOA). Material and processing details are given in Refs. [8,14]. Uniaxial tensile properties, basedon tests parallel to the length of the plate, are listed in Table 2.
Table 1
Chemical composition of Ti–6Al–4V bar stock material in wt.% [14]
Ti Al V Fe O N H
Bal. 6.30 4.19 0.19 0.19 0.013 0.0041
Fig. 1. Optical micrograph of the bimodal (STOA) microstructure of forged Ti–6Al–4V plate material.
J.O. Peters et al. / Engineering Fracture Mechanics 69 (2002) 1425–1446 1427

2.2. Simulation of foreign-object damage
FOD was simulated by firing 1 or 3.2 mm diameter chrome-hardened steel spheres onto a flat specimensurface of tensile fatigue (so-called ‘‘KB’’) specimens at angles of 60� and 90� (see Fig. 2), and at velocities of200 and 300 m/s using a compressed-gas gun facility. Such impact velocities represent typical in-serviceimpact velocities on aircraft engine fan blades, with the 300 m/s velocities representing a worst-case. Theimpact damage craters are also of a size typical of those seen in service, with root radii similar to those ofactual damage sites [6].
2.3. Fatigue test methods
To evaluate the smooth-bar fatigue limit of the bimodal Ti–6Al–4V alloy, previous S–N data [15] havebeen complemented by 25 Hz tests (for shorter lives <106 cycles) and 1000 Hz tests (for longer lives >106
cycles) on hourglass specimens with minimum diameters of 3.0 mm (25 Hz) and 5.4 mm (1000 Hz). (Noeffect of frequency on near-threshold fatigue-crack propagation is apparent in this alloy between 50 and20,000 Hz for tests in ambient air environments [11].) Specifically, 1000 Hz tests were conducted on anautomated MTS servo-hydraulic testing machine, with a newly developed system using a voice-coil ser-vovalve (further details are described in Ref. [16]). To obtain a nominally stress-free surface, specimens werestress relieved in vacuo for 2 h at 705 �C prior to chemically milling in a solution of 50 ml HF, 500 ml HNO3
and 1500 ml H2O. For all tests, the loading direction of the specimen was parallel to the long axis of theforged plate.
KB specimens were used to study the effect of FOD on the fatigue strength of Ti–6Al–4V. These sampleshave a rectangular cross-section of 3:2� 7:2 mm2, a gauge length of 20 mm and cylindrical buttonheadends. As with the hourglass samples, they were prepared with a ‘‘stress-free’’ surface (in the gauge length)using stress relief and chemical-milling procedures. After impacting with the steel spheres to simulate FOD,the damaged regions were examined for the presence of potential crack initiation sites or microcracks in a
Table 2
Uniaxial tensile properties of bimodal Ti–6Al–4V
E (GPa) r0:2 (MPa) UTS (MPa) rf (MPa) Elong. (%) RA (%)
110 915 965 1310 19 45
E: Young’s modulus, r0:2: yield stress, UTS: ultimate tensile strength, rf : true fracture stress, Elong.: tensile elongation, RA: reduction
of area at fracture; strain rate 8� 10�4 s�1.
Fig. 2. Schematic illustration showing impact angles with respect to specimen geometry and loading axis for fatigue tests. In this study,
normal (90�) and inclined (60�) impact angles were chosen.
1428 J.O. Peters et al. / Engineering Fracture Mechanics 69 (2002) 1425–1446

high-resolution LEO 1550 field-emission scanning electron microscope (SEM), prior to cycling at maximumstress values between 225 and 500 MPa at R ¼ 0:1 and 0.5 (with a sinusoidal waveform). Throughoutfatigue testing, specimens were periodically removed from the test frame and the progress of crack initiationand growth at the surface of the impact site was examined in the SEM. The position of the crack frontduring crack extension, both on the surface and depthwise, was determined from two sets of measurements.The surface crack length was measured periodically during the fatigue test in the SEM; the crack depth wasestimated by subsequent fractography as the local crack front is oriented perpendicular to the ‘‘rivermarkings’’. For the bimodal Ti–6Al–4V alloy, growing fatigue cracks had an approximate crack depth, a,to surface crack length, 2c, ratio of a=2c � 0:45 [8]. After converting the surface crack length into crackdepth, the rate of crack extension caused by the fatigue loading was computed using standard finite-dif-ference procedures (with no smoothing routines) and expressed in terms of average crack extension percycle (da/dN).
To define stress-intensity values for the thresholds and early fatigue-crack growth conditions associatedwith microcracks at the impact site, the relationship of Luk�aa�ss [17] for small cracks at notches was utilized,which includes both indentation geometry and stress-concentration effects:
DK ¼ 0:7ktffiffiffiffiffiffiffiffiffiffiffiffiffiffiffiffiffiffiffiffiffiffiffiffiffiffi1þ 4:5ða=qÞ
p Drffiffiffiffiffiffipa
p: ð1Þ
In Eq. (1), kt is the elastic stress-concentration factor, Dr is the stress range, a is the crack depth, and q is theindentation radius. The factor of 0.7 is based on the stress-intensity boundary correction and the crack-shape correction factors for semi-elliptical surface cracks (a=2c � 0:45) [18].
Table 3 lists the impact site dimensions and the resulting elastic stress-concentration factors according tophotoelastic experiments [19]. The stress concentration is at a maximum at the base of the impact inden-tation sites, with values ranging from kt ¼ 1:8 (for 1 mm shot at 300 m/s) to kt ¼ 1:4 (for 3.2 mm shot at 200m/s). Corresponding values at the crater rim range from kt ¼ 1:3 (1 mm shot, 300 m/s) to kt ¼ 1:15 (3.2 mmshots, 200 m/s). These kt-values for the crater rim are identical to those computed recently by three-dimensional numerical analysis [12]; however, values for the indent base are �10% higher. Correspondingelastic stress-concentration factors for inclined impacts are also listed in Table 3.
It should be noted, that there might be some concern over the application of linear-elastic fracturemechanics to such microcracks where crack sizes may be comparable to the scale of the microstructure andcrack-tip plasticity. With respect to the scale of microstructure, it is known that misorientations betweenindividual a grains and the high density of grain boundaries in globular or bimodal titanium alloys
Table 3
Ti–6Al–4V, summary of impact conditions, fatigue loading and crack initiation sites
Impact
condition
Velocity
(m/s)
Crater
width
(mm)
Crater
depth
(mm)
kt (base) kt (rim) rmax,
R¼ 0.1
(MPa)
Crack initiation Cycles at failure
1 mm, 90� 300 0.93 0.26 1.8 1.30 500 Rim 3:2� 105
1 mm, 90� 300 0.93 0.26 1.8 1.30 325 Interior 1:3� 108
3.2 mm, 90� 300 2.67 0.67 1.6 1.25 500 Rim 3–6� 104
3.2 mm, 90� 300 2.67 0.67 1.6 1.25 325 Rim, interior, side 5� 105–1:7� 107
3.2 mm, 90� 200 2.14 0.43 1.4 1.15 500 Base 8� 104–1:4� 105
3.2 mm, 90� 200 2.14 0.43 1.4 1.15 325 Side 1:5� 107
3.2 mm, 60� 300 2.58 0.67 1.6 1.25 500 Rim 5� 104
3.2 mm, 60� 300 2.58 0.67 1.6 1.25 325 Rim 5� 105
3.2 mm, 60� 200 1.93 0.34 1.3 1.10 500 Rim 1:2� 105
3.2 mm, 60� 200 1.93 0.34 1.3 1.10 325 Interior 1:5� 108
* Side face of KB sample.
J.O. Peters et al. / Engineering Fracture Mechanics 69 (2002) 1425–1446 1429

significantly affect local driving forces and hence the crack-growth rates of microstructurally small cracks[15,20,21]. However, in case of FOD impacts, the resulting highly plastically deformed microstructure withits inherently high dislocation density [9] effectively tends to lessen this influence of the local orientation ofmicrostructural features. With respect to the corresponding scale of the plastic zone ahead of the crack tip,in the near-threshold regime of DK � 1–2 MPa
pm, computed maximum plastic zone sizes are only �0.2–1
lm for 1–10 lm sized cracks, and therefore such conditions are close to those of small-scale yielding.Furthermore, the contribution of the residual stresses is not included in the DK calculation in Eq. (1), sinceto the first approximation these stresses will not change the value of the stress-intensity range. They do,however, affect the mean stress and hence alter the local load ratio, as is specifically addressed in this paper.
3. Results and discussion
3.1. Smooth-bar fatigue: surface vs. subsurface initiation
To investigate the role of impact-induced tensile residual stresses acting as a mean stress superimposedon the applied fatigue stress range, smooth-bar S–N fatigue tests were performed over a wide range of meanstress values, i.e., over a range of load ratios from R ¼ �1 to 0.8. Resulting smooth-bar S–N fatigueproperties of the bimodal Ti–6Al–4V material are shown in Fig. 3(a) and (b) in terms of the cyclic maxi-
Fig. 3. Stress-life (S–N) curves for bimodal Ti–6Al–4V, determined using smooth-bar specimens at load ratios from R ¼ �1 to 0.8 in
terms of (a) maximum stress, rmax, and (b) stress range, Dr. Previously published results from Ref. [15] are complemented by 20 and
1000 Hz data. Also shown are S–N data (open symbols) of the same material published by Bellows et al. [22].
1430 J.O. Peters et al. / Engineering Fracture Mechanics 69 (2002) 1425–1446

mum stress and cyclic stress range, together with previously published fatigue results [15,22]. These dataindicate that an increase in mean stress, and hence load ratio, leads to an increase in the limiting value ofmaximum applied stress necessary to cause HCF failure (Fig. 3(a)); however, the corresponding limitingapplied stress range Dr is markedly decreased (Fig. 3(b)).
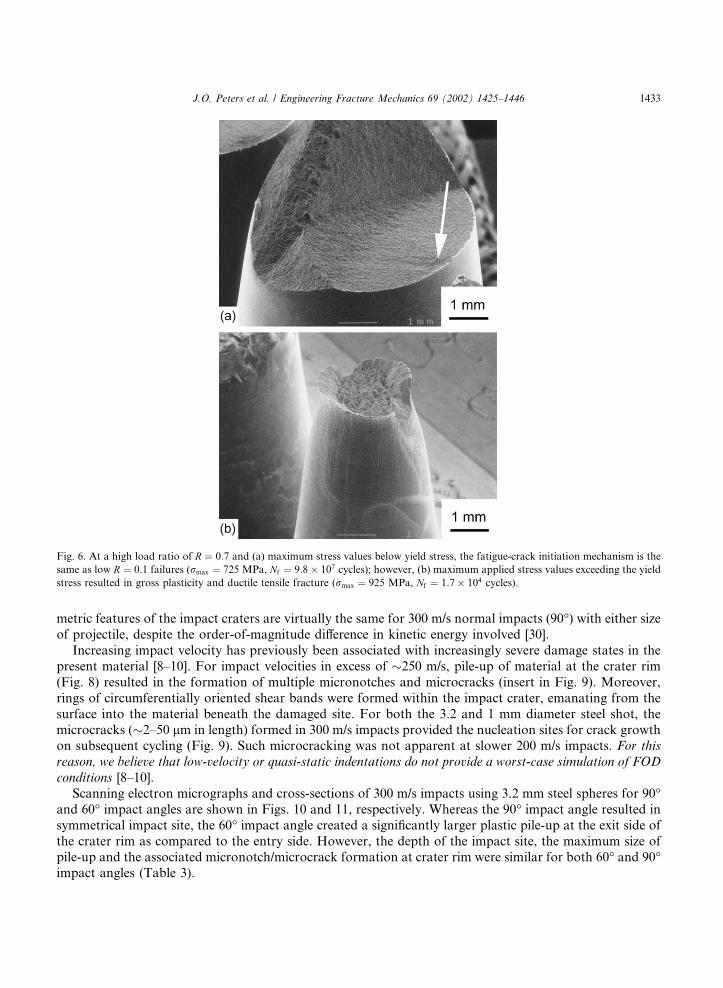
Crack initiation sites were examined as a function of the maximum and alternating stresses. Under fullyreversed loading (R ¼ �1), fatigue cracks were found to initiate at the specimen surface [15], whereas atpositive load ratios (R ¼ 0:1–0.8), initiation was generally subsurface. The occurrence of subsurface crackinitiation in smooth-bar test specimens can be best described in a plot of stress amplitude vs. maximumstress (Fig. 4). The resulting subsurface failure envelope displayed in Fig. 4 clearly shows that interplay ofboth relatively low stress amplitude and maximum stress level results in subsurface cracking in smooth-barsamples. In addition, it was found that the crack initiation site moved from regions close to the surface(�40–100 lm) to farther into the interior (�250–450 lm) with decreasing stress amplitude; this led to acorresponding increase in fatigue life at a given load ratio. Specifically, at fatigue lives greater than�5� 107 cycles, cracks initiated in regions 250–450 lm below the surface (cf. Fig. 5(a) and (b) forR ¼ 0:1). An example of such a high-R (¼ 0:7) fatigue-crack initiation farther in the interior is shown inFig. 6(a). As reported previously for Ti–6Al–4V [22,23], at even higher maximum applied stresses ex-ceeding the yield stress, fatigue failures occur entirely by ductile rupture, as shown for high-R loading inFig. 6(b).
Subsurface crack initiation is not common in fatigue, but has become increasingly reported of late forfatigue failures under very long life conditions, particularly in titanium alloys and steels [24–27]. Mosttraditional explanations for this phenomenon rely on the presence of processing-induced surface com-pressive residual stresses, i.e., due to heat treatment, case-hardening, or shot-peening procedures. Otherexplanations include the formation of compressive residual stresses due to preferential plastic deformationat the surface under tension–tension loading [28], or the larger volume of material contained in the interiorcompared to the surface and hence the higher probability of finding a stress-raising defect (e.g., inclusionsin steels) or a weak microstructural orientation (e.g., in titanium alloys). In the present experiments, the as-tested surfaces were nominally stress free (verified by X-ray diffraction), and therefore it is believed that thesubsurface initiation is the result of the latter effect. Indeed, Evans and Bache [29] have recently pointed outthe significance of such weak microstructural orientations, and the related stress redistribution betweenindividual grains as the cause of premature crack initiation in titanium alloys.
Fig. 4. Subsurface failure envelope for smooth-bar bimodal Ti–6Al–4V specimens, determined at load ratios ranging from R ¼ �2 to
0.7. The failure envelope indicates the occurrence of subsurface crack initiation with both decreasing stress amplitude, ra, and
maximum stress values, rmax.
J.O. Peters et al. / Engineering Fracture Mechanics 69 (2002) 1425–1446 1431

A typical subsurface HCF crack initiation site in the bimodal Ti–6Al–4V alloy is shown in Fig. 7(a).Higher magnification imaging (Fig. 7(b)) revealed a facet-type fracture surface, involving crack initiationand early growth along planar slip bands. The facets of fractured a grains, which were aligned perpen-dicular to stress axis, were of near-basal orientation, based on electron backscattered diffraction (EBSD)analysis.
3.2. Impact-induced damage state
A wide variety of impact conditions was investigated in this study. The flat surface of the rectangulargauge section of KB specimens was impacted at angles of 90� (normal impact) and 60� (Fig. 2) using impactvelocities of 200–300 m/s. Steel shot of 3.2 mm diameter was used for normal and inclined impacts; ad-ditionally, 1 mm steel shot was also used for 300 m/s normal impact experiments. All impact conditions andconsequent impact geometries used in this study are listed in Table 3. Examples of damage sites on the flatsurface of KB specimens, resulting from 300 m/s normal impacts (90�) with 1 and 3.2 mm steel shot, showsimilar features. From dimensional analysis, the indentation depth, crater diameter and plastic pile-up scalewith the size of the foreign object, and only depend on the impact velocity. Therefore, the resulting geo-
Fig. 5. At low load ratio of R ¼ 0:1, fatigue cracks initiated (a) close to the surface (rmax ¼ 525 MPa, Nf ¼ 4:8� 107 cycles), and (b) in
the interior away from the surface (rmax ¼ 500 MPa, Nf ¼ 9:6� 107 cycles).
1432 J.O. Peters et al. / Engineering Fracture Mechanics 69 (2002) 1425–1446
metric features of the impact craters are virtually the same for 300 m/s normal impacts (90�) with either sizeof projectile, despite the order-of-magnitude difference in kinetic energy involved [30].
Increasing impact velocity has previously been associated with increasingly severe damage states in thepresent material [8–10]. For impact velocities in excess of �250 m/s, pile-up of material at the crater rim(Fig. 8) resulted in the formation of multiple micronotches and microcracks (insert in Fig. 9). Moreover,rings of circumferentially oriented shear bands were formed within the impact crater, emanating from thesurface into the material beneath the damaged site. For both the 3.2 and 1 mm diameter steel shot, themicrocracks (�2–50 lm in length) formed in 300 m/s impacts provided the nucleation sites for crack growthon subsequent cycling (Fig. 9). Such microcracking was not apparent at slower 200 m/s impacts. For thisreason, we believe that low-velocity or quasi-static indentations do not provide a worst-case simulation of FODconditions [8–10].
Scanning electron micrographs and cross-sections of 300 m/s impacts using 3.2 mm steel spheres for 90�and 60� impact angles are shown in Figs. 10 and 11, respectively. Whereas the 90� impact angle resulted insymmetrical impact site, the 60� impact angle created a significantly larger plastic pile-up at the exit side ofthe crater rim as compared to the entry side. However, the depth of the impact site, the maximum size ofpile-up and the associated micronotch/microcrack formation at crater rim were similar for both 60� and 90�impact angles (Table 3).
Fig. 6. At a high load ratio of R ¼ 0:7 and (a) maximum stress values below yield stress, the fatigue-crack initiation mechanism is the
same as low R ¼ 0:1 failures (rmax ¼ 725 MPa, Nf ¼ 9:8� 107 cycles); however, (b) maximum applied stress values exceeding the yield
stress resulted in gross plasticity and ductile tensile fracture (rmax ¼ 925 MPa, Nf ¼ 1:7� 104 cycles).
J.O. Peters et al. / Engineering Fracture Mechanics 69 (2002) 1425–1446 1433

In addition to the formation of FOD-induced microcracks, the distribution of tensile residual stresses inthe KB specimens was also of importance for crack initiation. X-ray diffraction [13] revealed tensile residualstresses on the side surface of the rectangular gauge section. These tensile stresses, which are formed on theside faces of the tensile specimen due to the proximity of the side surface to the impact crater, proved to beimportant in the case of low stress, high-cycle behavior in the 107–108 cycles regime. Confirmed by nu-merical analysis [12,13], these tensile stresses counterbalance the compressive residual stress field directlybeneath the indentation. The numerically estimated distribution of these FOD-induced stresses in the KB
specimen are shown in Fig. 12(a) and (b) for 300 m/s normal impacts (90�) using 1 and 3.2 mm steel shot,respectively. The residual stress fields are calculated with the finite element method using the ABAQUS/Explicit code, which is based on the explicit time integration method [12]. The dynamic effects, such asinertia, strain rate sensitivity, and stress wave interactions, are included in the simulation. To make con-nection with experiments, the exact KB geometries are used, with a clamped–clamped boundary conditionprescribed. The substrate is assumed to be elastic-perfectly plastic with a Von Mises surface to specify yield.The yield stress does not vary with strain, but is a function of the strain rate [30]. The rigid contact surfaceoption is used to simulate the rigid projectile, and the option for finite deformation and strain is employed.Full details are given in Refs. [12,13,30].
Fig. 7. Fracture surfaces of an S–N sample tested at a high load ratio of R ¼ 0:7, rmax ¼ 725 MPa (Nf ¼ 9:8� 107 cycles), showing (a)
subsurface crack initiation site (350 lm below surface) and (b) crack initiation and early growth along planar slip bands leading to
facet-type fracture surface (specimen tilt: 70�). EBSD analysis of fractured a grains (numbered 1–3) revealed a near-basal orientation of
fracture plane.
1434 J.O. Peters et al. / Engineering Fracture Mechanics 69 (2002) 1425–1446

The residual stress distributions for normal impacts display an axis-symmetric stress field with tensileresidual stresses (in longitudinal direction) as high as �220 MPa (r33=ry ¼ 0:24) to 385 MPa (r33=ry ¼0:42), where ry is the yield stress, and r33 the residual stress in longitudinal direction. The magnitude ofthese tensile stresses was verified by X-ray diffraction. The corresponding residual stress distribution for aninclined (60�) impact is illustrated in Fig. 12(c) for the case of a 200 m/s, 3.2 mm projectile and shows ahighly asymmetric stress field, although the peak residual stresses are similar to those of normal impacts. Inparticular, the residual stress field on the exit side of the KB specimen is of same magnitude as the normalimpact at the same impact velocity, whereas residual stress field on the entry side corresponds to that oflower speed normal impacts [30]. Furthermore, the residual stresses at the base of the indents are also ofsimilar magnitude for both 90� and 60� impacts [30]. Such residual stresses can have a significant effect onthe initiation sites of fatigue cracks and on the value of the fatigue-crack growth thresholds, as discussedbelow.
3.3. FOD-affected fatigue properties
Stress-life (S–N) data in Fig. 13 clearly show the detrimental effect of FOD on fatigue strength. Thereduced lifetimes following impact damage were seen for both projectile sizes, at both low and moderate
Fig. 8. Gauge section of modified KB specimens for simulated FOD studies after high-velocity impacts using (a) 1 mm diameter steel
sphere and (b) 3.2 mm diameter steel sphere (normal impact angle).
J.O. Peters et al. / Engineering Fracture Mechanics 69 (2002) 1425–1446 1435

load ratios (R ¼ 0:1 and 0.5), and both impact angles (although only normal impact data are displayed). Asdiscussed previously [8–10], this detrimental effect of FOD can be considered in terms of premature fatigue-crack initiation resulting from four major factors: (i) the stress concentration of the indent, (ii) FOD-induced microcracking, (iii) plastically deformed microstructure and (iv) residual stresses associated withthe impact damage.
Two distinct groups of failures can be identified in Fig. 13, depending upon the magnitude of the appliedstresses relative to the tensile residual stresses. At high-applied stresses, HCF failures initiate directly at theimpact crater, either at the rim or the base of the crater. Under these conditions, the initiation of a growingfatigue crack is observed at the crater rim at 300 m/s due to the presence of microcracks; conversely, suchinitiation is observed at the base of the indent at 200 m/s due to the high local stress concentration and theabsence of microcracks elsewhere. In contrast, at low-applied stresses (and lower impact velocities), whereFOD-induced microcracks were not formed or were much smaller, fatigue cracks were found to initiateaway from the indent crater, in regions of substantial tensile residual stresses.
An example of fatigue-crack initiation at low-applied cyclic stresses (rmax ¼ 325 MPa, R ¼ 0:1) in re-gions away from the damage site in the interior of the specimen is shown in Fig. 14(a) and (b) for 300 m/simpacts by 1 and 3.2 mm diameter shot, respectively. A further example (at rmax ¼ 300 MPa, R ¼ 0:1),where initiation occurred close to surface at the side face of the specimen, is shown in Fig. 14(c). Similarly,fatigue-crack initiation remote from the damage site was observed to occur in the interior of a 60� inclinedimpacted specimen, as shown in Fig. 14(d) (rmax ¼ 325 MPa, R ¼ 0:1). In all cases, fatigue cracking ini-
Fig. 9. SEM micrograph of a fatigue crack that formed at a FOD-induced microcrack (small insert). 3.2 mm steel shot, 300 m/s impact
velocity. Nominally applied rmax ¼ 500 MPa, R ¼ 0:1, N ¼ 29,000 cycles.
1436 J.O. Peters et al. / Engineering Fracture Mechanics 69 (2002) 1425–1446

tiated in regions of the high tensile residual stresses away from the indent; specifically, these residual stresseswere on the order of 300 MPa, based on synchrotron X-ray diffraction measurements [13] and numericalcomputations [12,13] (Fig. 12).
As noted previously, such tensile residual stresses act to elevate the local mean stress (or load ratio),when simply superimposed on the applied far-field fatigue stresses. Based on FOD-related failures at ap-plied cyclic stresses of Dr ¼ 270–300 MPa at R ¼ 0:1 and 250 MPa at R ¼ 0:5, superimposing a tensileresidual stress of �300 MPa increases these R-ratios from 0.1 to �0.5 and from 0.5 to �0.7, assuming norelaxation (Table 4). The corresponding increase in the maximum stress by this superposition is marked byarrows in the S–N diagram shown in Fig. 13. From these S–N results, it is clear that simple superposition ofinitial tensile residual stress onto applied far-field stresses provides a significant contribution to the re-duction in fatigue life due to FOD.
3.4. FOD-affected fatigue thresholds and fatigue-crack propagation
Thresholds for fatigue-crack growth and the subsequent near-threshold fatigue-crack growth rates of allimpacted samples are compared to results for naturally initiated small cracks (�45–1000 lm) [15] andthrough-thickness large (>5 mm) [11,31] cracks in undamaged material in Fig. 15(a) (for R-ratios of 0.1 and0.5), in Fig. 15(b) (for projectile sizes of 1 and 3.2 mm), and in Fig. 15(c) (for impact angles of 90� and 60�).The FOD-initiated crack-growth rate data are shown as a function of surface crack length, 2c, and the
Fig. 10. (a) Scanning electron micrograph and (b) cross-section of impact site after 300 m/s normal (90�) impact using 3.2 mm steel
shot.
J.O. Peters et al. / Engineering Fracture Mechanics 69 (2002) 1425–1446 1437

approximate applied stress-intensity range (corrected for the stress concentration of the indent using Eq.(1)). Crack-growth rate data of the FOD-induced microcracks (2c � 5–100 lm), which are truly micro-structurally small cracks, fall into a single scatter band for all impact conditions under study (Fig. 15(a)–(c)). Specifically, comparable growth-rate data of microcracks at low (R ¼ 0:1) and moderate (R ¼ 0:5) loadratios indicate that mean stresses play little role in small-crack propagation (Fig. 15(a)). In general, thegrowth rates of the FOD-initiated small cracks were at least an order-of-magnitude faster than the cor-responding large-crack results at near-threshold levels. Such an effect is typical for cracks with dimensionscomparable to microstructural size-scales [e.g., 32–35]. However, the large and small-crack results tend tomerge above a DK of �10 MPa
pm, as the small cracks grow to dimensions substantially larger than the
microstructure, consistent with the development of crack closure associated with the progressively in-creasing wake of the small cracks. In addition, at these higher DK levels, the progressively increasing lengthof the crack front experiences a statistical sampling of a representative average of all microstructuralbarriers, similar to the large cracks.
An additional factor associated with the faster growth rates of the FOD-initiated microcracks is themicrostructural changes associated with impact-induced plasticity. This is evident from shot-peening ex-periments on Ti–6Al–4V where, by separating the effect of deformation from residual stresses, it has been
Fig. 11. (a) Scanning electron micrograph and (b) cross-section of impact site after 300 m/s inclined (60�) impact using 3.2 mm steel
shot.
1438 J.O. Peters et al. / Engineering Fracture Mechanics 69 (2002) 1425–1446

observed that the deformed microstructure, with its inherently high dislocation density, showed a reducedresistance to crack growth [26,27].
As discussed elsewhere [11,31], the large-crack thresholds shown in Fig. 15 were determined up to thehighest load ratios (R � 0:91–0.95) under constant-Kmax/increasing-Kmin loading conditions chosen tominimize the effect of crack closure. Accordingly, for the bimodal Ti–6Al–4V microstructure, the measuredthreshold of �1.9 MPa
pm at R ¼ 0:95 is considered to be a worst-case threshold for cracks of dimensions
large compared to the scale of the microstructure. However, observations show that the smallest FOD-initiated cracks, which have dimensions comparable with microstructural size-scales (�2–10 lm), canpropagate at stress intensities well below these worst-case thresholds, specifically at applied stress intensitiesas low as DK � 1 MPa
pm, presumably due to biased sampling of the ‘‘weak links’’ in the microstructure.
Based on the results shown in Fig. 15, it is clear that a concept of a worst-case threshold (determined under
Fig. 12. Residual stress distribution in plane perpendicular to longitudinal axis of KB specimen, after 300 m/s normal (90�) impact using
(a) 1 mm and (b) 3.2 mm diameter steel shot, or (c) 200 m/s inclined (60�) impact using 3.2 mm steel shot. After Chen and Hutchinson
[12]. rii ¼ normal residual stress, ry ¼ yield stress (915 MPa).
J.O. Peters et al. / Engineering Fracture Mechanics 69 (2002) 1425–1446 1439

R ! 1 conditions that minimize crack closure) applies strictly for homogeneous continuum-sized crackslarger than microstructural size-scales. This concept does not provide a lower-bound threshold stress in-
Fig. 13. S–N data showing reduced fatigue life due to simulated FOD (normal impact) as compared to smooth-bar specimens in
bimodal Ti–6Al–4V. 2ci is the surface crack length of FOD-induced microcracks. For failures at 107–108 cycles, the effect of local
tensile residual stress (�300 MPa) in increasing the local maximum stress (and hence the local load ratio) is illustrated by arrows and
open symbols.
Fig. 14. Lower stress fatigue loading after 300 m/s impact (90�) using 1 or 3.2 mm diameter steel shot caused crack initiation away from
the indent site (marked by arrows): (a) 1 mm steel shot, nominally applied rmax ¼ 325 MPa, R ¼ 0:1, Nf ¼ 1:3� 108 cycles, (b) 3.2 mm
steel shot (90�), nominally applied rmax ¼ 325 MPa, R ¼ 0:1, Nf ¼ 1:6� 107 cycles, and (c) nominally applied rmax ¼ 300 MPa,
R ¼ 0:1, Nf ¼ 1:3� 107 cycles. (d) 200 m/s inclined impact (60�) using 3.2 mm steel shot, nominally applied rmax ¼ 325 MPa, R ¼ 0:1,
Nf ¼ 1:5� 108 cycles.
1440 J.O. Peters et al. / Engineering Fracture Mechanics 69 (2002) 1425–1446

tensity for cracks on the scale of microstructural dimensions, as can be the case in the earliest stages ofFOD-induced fatigue failure.
The full quantitative effect of the FOD-induced residual stresses on fatigue failures at 105–106 cycleswhere fatigue cracks initiated directly at the impact site is still under study. Although simple superpositionof the residual and applied stresses was considered above for low-applied stresses (rmax ¼ 325 MPa,R ¼ 0:1), recent numerical modelling and in situ synchrotron X-ray diffraction results have indicated that athigh-applied stresses (rmax ¼ 500 MPa, R ¼ 0:1) during the first few fatigue cycles, significant relaxation ofboth the tensile and compressive residual stresses (by typically �30%), can occur [13].
What is interesting here is that due to plastic deformation (aided by the Bauschinger effect) at the FODindentation site when the high stresses (relative to the level of residual stresses) are applied, the compressivestresses at the base of the crater are partially relaxed, permitting crack initiation to occur there for lowimpact velocities due to the higher stress concentration [8,9]. The tensile residual stresses at the crater rimare also relaxed, but due to the presence of microcracks following 300 m/s impacts this still is the preferredsite for crack initiation at higher impact velocities. Thus, for subsequent fatigue cycling at high-appliedstresses, the FOD-induced residual stresses do not play a major role on the initial crack growth of FOD-induced microcracks (2c � 5–100 lm) due to their relaxation on cyclic loading.
There are conditions, however, where relaxation does not occur or substantial residual stresses are stableduring cycling. Most specifically, the rate and extent of relaxation is a function of the applied stresses.When the applied stresses are low enough, the residual stresses are stable and relaxation is not observed.Therefore, the regions closest to the indent exhibit the greatest degree of relaxation, due to the stressconcentrating effects of the indent on the applied stresses. It is thought that this explains the stability (andhence importance) of the tensile residual stresses far from the indent even under conditions where the re-sidual stresses near the indent show substantial relaxation.
Moreover, the stress field ahead of a propagating crack can potentially serve to further relax the residualstresses. This crack-driven relaxation becomes increasingly important as the crack grows to larger cracksizes under a fixed load amplitude, due to the increase in the DK field ahead of the tip. This may explain thefactor-of-six longer life exhibited by an indent formed by a 1 mm projectile compared to a 3.2 mm projectile(both formed at 300 m/s). In spite of the similar features (pile-up, microcracking, shear bands), and similaraspect ratio of the craters, the absolute proximity of the retarding compressive zone beneath the crater baseis different. As illustrated in Fig. 16, the rim-crack formed in the smaller indent is still quite small (2c � 0:7mm) by the time it reaches any mitigating residual compressive stresses beneath the base, whereas the rim-crack formed in the large indent has grown to a substantial size (2c � 2:5 mm) by the time it has reached thecompressive zone beneath the base. It is thought that the larger crack size results in more substantial re-laxation of any mitigating compressive residual stresses, thereby leading to a shorter propagation time.Moreover, larger impact indentation sites also lower the overall fatigue life due to initial crack size effects.Once a growing fatigue crack initiates, the effective initial crack size is larger in the case with larger in-dentation site, and hence it propagates initially faster.
Table 4
Superposition of initial tensile residual stress on nominally applied cyclic stress
Load ratio, R
(rmin=rmax)
rmin rmax rres rmin;eff
(rmin þ rres)
rmax;eff
(rmax þ rres)
Effective load ratio, Reff
(rmin;eff=rmax;eff )
0.1 30 300 300 330 600 0.55
0.1 33 325 300 333 633 0.53
0.5 250 500 300 550 850 0.69
rmin: applied minimum stress, rmax: applied maximum stress, rres: residual stress, rmin;eff : effective minimum stress, rmax;eff : effective
maximum stress. All stresses are in MPa.
J.O. Peters et al. / Engineering Fracture Mechanics 69 (2002) 1425–1446 1441

Fig. 15. Fatigue crack-growth rate data of FOD-induced small cracks emanating directly from FOD impacts as a function of (a) load
ratio (R ¼ 0:1 and 0.5), (b) projectile size (1 and 3.2 mm), and (c) impact angle (60� and 90�). FOD-initiated small-crack growth-rate
data are compared to (smooth-bar) naturally initiated small-crack [15] and through-thickness large-crack results in undamaged bi-
modal Ti–6Al–4V. Large-crack growth rates for R ¼ 0:1 and 0.8 were derived from constant load-ratio tests, whereas for R ¼ 0:95
constant-Kmax/increasing-Kmin testing was used [11,31].
1442 J.O. Peters et al. / Engineering Fracture Mechanics 69 (2002) 1425–1446

3.5. Threshold conditions based on the Kitagawa–Takahashi diagram
Previous work [9,10] has illustrated the utility of the Kitigawa–Takahashi diagram [36] in evaluating thelimiting conditions for FOD-induced HCF failures when the applied stress ranges are high (relative to themagnitude of the residual stress) and cracks are formed directly at the impact site. Here, the limitingthreshold conditions were defined by the stress-concentration corrected smooth-bar fatigue limit (at mi-crostructurally small crack sizes) and a ‘‘worst-case’’ fatigue-crack growth threshold (at larger ‘‘homoge-neous continuum-sized’’ crack sizes). A more favorable representation of the failure envelopes for the twoload ratios of 0.1 and 0.5 in Fig. 17 can be made using the El Haddad et al. [37] empirical quantification ofKitagawa–Takahashi approach; this approach introduces a constant, termed the intrinsic crack length, 2c0,such that the stress intensity is defined as DK ¼ YDr
ffiffiffiffiffiffiffiffiffiffiffiffiffiffiffiffiffiffiffiffiffiffiffiffipð2cþ 2c0Þ
p, where Y is the geometry factor.
It is now possible to extend the application of the Kitigawa–Takahashi diagram to include cracks formedfar from the indent by evaluating the effective R-ratio induced by the superposition of stable residualstresses. Using the fatigue failures plotted in Fig. 17 as data points at surface crack lengths of 2c ¼ 1 lm,and superimposing the measured tensile residual stress of �300 MPa, the R-ratios are increased from 0.1 to�0.5 and from 0.5 to �0.7 at far-field stress range of �300 MPa (Table 4). Accordingly, such failures atboth load ratios can still be described by the proposed Kitagawa–Takahashi approach, provided thelimiting conditions are given by the stress concentration and residual stress corrected smooth-bar fatiguelimit at small crack sizes and the ‘‘worst-case’’ threshold for larger crack sizes.
4. Conclusions
Based on a study of the role of FOD in affecting HCF failures in a turbine engine Ti–6Al–4V alloy with abimodal (STOA) microstructure, the following conclusions can be made:
Fig. 16. Schematic display of progressive positions of crack fronts and relative sizes of cracks at the point when the cracks encounter
the prominent compressive residual stress region beneath indentation site of (a) 1 mm and (b) 3.2 mm steel shot impacts.
J.O. Peters et al. / Engineering Fracture Mechanics 69 (2002) 1425–1446 1443

1. FOD, simulated by the high-velocity (200–300 m/s) impact of steel spheres (1 and 3.2 mm diameter) atimpact angles of 60� and 90� on a flat specimen surface, markedly reduced the fatigue performance. Theprincipal effect of FOD was to induce preferred sites for the premature initiation of fatigue cracks.
2. Premature crack initiation was caused by the interplay of a number of factors, specifically (i) the stressconcentration due to the FOD indentation, (ii) the creation (at highest impact velocities only) of micro-cracks at the crater rim of the damaged zone, (iii) microstructural damage from FOD-induced plasticdeformation, and (iv) the localized presence of tensile residual stresses around the indent.
3. Since such microcracking at the crater rim (and indeed the shear band formation) could only be de-tected at the sites of the higher velocity impacts, it is concluded that low-velocity or quasi-static inden-tations cannot provide a worst-case simulation of FOD.
4. The magnitudes of the residual stresses in the vicinity of the damage sites have been computed numer-ically and measured experimentally using synchrotron X-ray diffraction. Prior to fatigue cycling, peaktensile values of these residual stresses are on the order of 300 MPa and are located in the interior ad-jacent to the highly deformed region beneath the indentations.
5. Two groups of FOD-induced HCF failures could be identified. The first group involved the initiation ofgrowing fatigue cracks directly at the impact site and caused failures within 105–106 cycles. At stress-con-centration corrected stress ranges from 250 to 560 MPa, FOD-initiated microcracks (�2–10 lm in size)propagated from both 60� and 90� impact sites at applied stress intensities below a DK of 1 MPa
pm (at
both R ¼ 0:1 and 0.5) and showed no pronounced threshold behavior, i.e., small-crack growth occurredat driving forces well below the ‘‘worst-case’’ DKTH threshold of 1.9 MPa
pm for cracks larger than the
characteristic microstructural size-scales in this alloy. The proposed criterion for such failures has beendescribed by a modified Kitagawa–Takahashi approach, where the limiting threshold conditions are de-fined by the stress-concentration corrected smooth-bar fatigue limit (at microstructurally small cracksizes) and the ‘‘worst-case’’ DKTH threshold (at larger ‘‘homogeneous continuum-sized’’ crack sizes).
6. The second group of failures at 107–108 cycles initiated at locations remote from impact damage in re-gions of high tensile residual stresses. It was found that simple superposition of the initial tensile resid-ual stresses onto the applied stresses provided a significant contribution to the reduction in fatigue
Fig. 17. Modified Kitagawa–Takahashi diagram representing the limiting threshold crack-growth conditions (da=dN ¼ 10�11–10�10 m/
cycle) at R ¼ 0:1 and 0.5 for FOD-induced small cracks in bimodal Ti–6Al–4V. Plotted is the threshold stress range as a function of
surface crack length. The limiting conditions are defined by the worst-case DKTH threshold for ‘‘homogeneous continuum-sized’’ cracks
(at large crack sizes) and the smooth-bar fatigue limit, corrected for stress concentration and residual stresses (at smaller crack sizes).
Accordingly, data points are corrected for the stress concentration of the FOD indents.
1444 J.O. Peters et al. / Engineering Fracture Mechanics 69 (2002) 1425–1446

strength by affecting the local mean stress and load ratio. Accordingly, the modified Kitagawa–Takah-ashi approach proposed above must be additionally corrected for the presence of tensile residual stressesto account for such failures. With this correction, this approach provides a rational basis for the effect ofFOD on HCF failures in Ti–6Al–4V.
Acknowledgements
This work was supported by the Air Force Office of Science and Research, grant no. F49620-96-1-0478,under the auspices of the Multidisciplinary University Research Initiative on ‘‘High Cycle Fatigue’’ to theUniversity of California, Berkeley. Special thanks are due to Prof. W. Goldsmith (UCB) for providing thecompressed-gas gun facility, to J.D. Donovan, Y. Yanxia and H.-R. Wenk (UCB) for help with the EBSDanalysis, and to A.W. Thompson (UCB) for helpful discussions. BLB would also like to thank the HertzFoundation for financial support in the form of a fellowship for graduate study.
References
[1] Cowles BA. High cycle fatigue in aircraft gas turbines––an industry perspective. Int J Fract 1996;80:147–63.
[2] Nicholas T, Zuiker JR. On the use of the Goodman diagram for high cycle fatigue design. Int J Fract 1996;80:219–35.
[3] Larsen JR, Worth BD, Annis Jr CG, Haake FK. An assessment of the role of near-threshold crack growth in high cycle fatigue life
prediction of aerospace titanium alloys under turbine engine spectra. Int J Fract 1996;80:237–55.
[4] Nicholas T. Critical issues in high cycle fatigue. Int J Fatigue 1999;21:S221–31.
[5] Nicholas T, Barber JR, Bertke RS. Impact damage on titanium leading edges from small hard objects. Exp Mech
1980;October:357–64.
[6] Hudak SJ, Chan KS, McClung RC, Chell GG, Lee Y-D, Davidson DL. High Cycle Fatigue of Turbine Blade Materials, Final
technical report UDRI subcontract no. RI 40098X SwRI project no. 18-8653, 1999.
[7] Ritchie RO. Small cracks and high-cycle fatigue. In: Chang JCI, Coulter J, Brei D, Martinez WHG, Friedmann PP, editors.
Proceedings of the ASME Aerospace Division, AD-vol. 52. Warrendale, PA: ASME; 1996. p. 321–33.
[8] Peters JO, Roder O, Boyce BL, Thompson AW, Ritchie RO. Role of foreign-object damage on thresholds for high-cycle fatigue in
Ti–6Al–4V. Metall Mater Trans A 2000;31A:1571–83.
[9] Peters JO, Ritchie RO. Influence of foreign-object damage on crack initiation and early crack growth during high-cycle fatigue of
Ti–6Al–4V. Eng Fract Mech 2000;67:193–207.
[10] Peters JO, Ritchie RO. Foreign-object damage and high-cycle fatigue: role of microstructure in Ti–6Al–4V. Int J Fatigue
2001;23:S413–21.
[11] Ritchie RO, Davidson DL, Boyce BL, Campbell JP, Roder O. High-cycle fatigue of Ti–6Al–4V. Fatigue Fract Eng Mater Struct
1999;22:621–31.
[12] Chen X, Hutchinson JW. Foreign object damage and fatigue crack threshold: cracking outside shallow indents. Int J Fract
2001;107:31–51.
[13] Boyce BL, Chen X, Hutchinson JW, Ritchie RO. The residual stress state due to a spherical hard-body impact. Mech Mater
2001;33:441–54.
[14] Eylon D. Summary of the Available Information on the Processing of the Ti–6Al–4V HCF/LCF Program Plates, University of
Dayton Report, Dayton, OH, 1998.
[15] Hines JA, Peters JO, L€uutjering G. Microcrack propagation in Ti–6Al–4V alloys. In: Boyer RR, Eylon D, L€uutjering G, editors.
Fatigue behavior of titanium alloys. Warrendale, PA: TMS; 1999. p. 15–22.
[16] Morgan JM, Milligan WW. A 1 kHz servohydraulic fatigue testing system. In: Soboyejo WO, Srivatsan TS, editors. High cycle
fatigue of structural materials. Warrendale, PA: TMS; 1997. p. 305–12.
[17] Luk�aa�ss P. Stress intensity factor for small notch-emanating cracks. Eng Fract Mech 1987;26:471–3.
[18] Newman Jr JC, Raju IS. An empirical stress-intensity factor equation for the surface crack. Eng Fract Mech 1981;15:185–92.
[19] Nisida M, Kim P. Stress concentration caused by the presence of a spherical cavity or a spherical-surfaced hollow. In: Proceedings
of the Twelfth National Congress on Applied Mechanics, 1962. p. 69–74.
[20] Ravichandran KS, Li X-D. Fracture mechanical character of small cracks in polycrystalline materials: concept and numerical K
calculations. Acta Mater 2000;48:525–40.
J.O. Peters et al. / Engineering Fracture Mechanics 69 (2002) 1425–1446 1445

[21] Ravichandran KS. Three-dimensional crack-shape effects during the growth of small surface fatigue cracks in a titanium-base
alloy. Fatigue Fract Eng Mater Struct 1997;20:1423–42.
[22] Bellows RS, Muju S, Nicholas T. Validation of the step test method for generating Haigh diagrams for Ti–6Al–4V. Int J Fatigue
1999;21:687–97.
[23] Morrisey RJ, McDowell DL, Nicholas T. Frequency and stress ratio effects in high cycle fatigue of Ti–6Al–4V. Int J Fatigue
1999;21:679–85.
[24] Murakami Y, Nomoto T, Ueda T. Factors influencing the mechanism of superlong fatigue failure in steels. Fatigue Fract Eng
Mater Struct 1999;22:581–90.
[25] Murakami Y, Takada M, Toriyama T. Super-long life tension-compression fatigue properties of quenched and tempered 0.46%
carbon steel. Int J Fatigue 1998;16:661–7.
[26] Wagner L, L€uutjering G. Influence of shot peening parameters on the surface layer properties and the fatigue life of Ti–6Al–4V. In:
Fuchs HO, editor. Proceedings of the 2nd International Conference on Shot Peening. Paramus, NJ: American Shot Peening
Society; 1984. p. 194–200.
[27] Wagner L, L€uutjering G. Influence of a shot peening treatment on the fatigue limit of Ti–6Al–4V. In: Fuchs HO, editor.
Proceedings of the 2nd International Conference on Shot Peening. Paramus, NJ: American Shot Peening Society; 1984. p. 201–7.
[28] Adachi S, Wagner L, L€uutjering G. Influence of microstructure and mean stress on fatigue strength of Ti–6Al–4V. In: L€uutjering G,
Zwicker V, Bunk W, editors. Titanium science and technology Proceedings of the 5th International Conference on Titanium.
Oberursel, Germany: DGM; 1985. p. 21–39.
[29] Evans WJ, Bache MR. Dwell-sensitive fatigue under biaxial loads in the near-alpha titanium alloy IMI685. Int J Fatigue
1994;16:443–52.
[30] Chen X. Foreign-object damage and fatigue cracking. PhD thesis. Harvard University, Cambridge, 2001.
[31] Boyce BL, Ritchie RO. Effect of load ratio and maximum stress intensity on the fatigue threshold in Ti–6Al–4V. Eng Fract Mech
2001;68:129–47.
[32] Ritchie RO, Peters JO. Small fatigue cracks: mechanics, mechanisms and engineering applications. Mater Trans 2001;42:58–67.
[33] Suresh S, Ritchie RO. Propagation of short fatigue cracks. Int Metals Rev 1984;29:445–76.
[34] Miller KJ, de los Rios ER, editors. The behaviour of short fatigue cracks. London, UK: Mechanical Engineering Publication;
1986.
[35] Ritchie RO, Lankford J, editors. Small fatigue cracks. Warrendale, PA: TMS–AIME; 1986.
[36] Kitagawa H, Takahashi S. Applicability of fracture mechanics to very small cracks or the cracks in the early stage. In: Proceedings
of the Second International Conference on Mechanical Behavior of Materials. Metals Park, OH: ASM; 1976. p. 627–31.
[37] El Haddad MH, Topper TH, Smith KN. Prediction of non propagating cracks. Eng Fract Mech 1979;11:573–84.
1446 J.O. Peters et al. / Engineering Fracture Mechanics 69 (2002) 1425–1446