On the application of liquid-crystal thermography for the nondestructive detection of delamination...
6
On the Application of Liquid-Crystal Thermography for the Nondestructive Detection of Delamination in Composite Structures Akbar Afaghi Khatibi, Hadi Rezghi Maleki School of Mechanical Engineering, Faculty of Engineering, University of Tehran, 11365-4563 Tehran, Iran To prevent the catastrophic failure of composite struc- tures, several nondestructive testing methods have been developed. In this study, a new technique to eval- uate these structures by using thermochromic liquid crystal (TLC) thermography is presented. Temperature gradients produced by sensitive liquid-crystals are used to detect delamination in composite specimens. The effects of constituent materials and delamination size/location are investigated. The results from TLC thermography are compared to those from infrared thermography. Finally, advantages/disadvantages of the new method are discussed. On the basis of the results from this study, it could be concluded that the TLC thermography can be used as an inexpensive non- destructive testing method in inspection of composite structures. POLYM. COMPOS., 29:798–803, 2008. ª 2008 Society of Plastics Engineers INTRODUCTION Because of their high specific modulus and strength, composite materials have been widely used in aerospace, marine, chemical, and electrical/electronic industries as well as infrastructures and bio applications. Generally speaking, defects can be produced in any structure and component during manufacturing, handling, or under serv- ice conditions. To avoid catastrophic failure of composite structures, it is necessary to find appropriate inspection techniques to obtain information about the integrity of these structures. Nondestructive testing (NDT) can offer a solution in this regard. Among well known techniques in NDT field applied to composite structures are radiogra- phy, thermography, and ultrasound methods [1–6]. Delamination is one of the common defects in compos- ite components and could be detected by using ultrasound techniques. However, the necessity of having an interme- diate material in these techniques is putting a limitation on their usage. In addition, it is possible for the interme- diate media to penetrate into the structure and degrade or even destroy the interfacial bonding between fiber and matrix 7. Considering radiography, a long term usage of x- or g-radiation can reduce the life-time of resin 8. In addition, low contrast of images and high initial invest- ment for labs and dark rooms are some of the other disad- vantages of radiography techniques 9. Because of these limitations, other NDT methods such as low frequency or thermography techniques are mostly preferred in compos- ite industries. In this work, a new method of thermography by using thermochromic liquid crystals (TLC) to evaluate the in- tegrity of composite structures was developed. At the heart of TLC based thermography systems are TLC. These are materials that change their molecular and opti- cal properties with temperature 10. The liquid-crystals change from transparent at low temperatures, to red, yel- low, green, blue, and violet as the temperature is increased. At higher temperatures, the liquid-crystals return to the transparent state. On the basis of the sensi- tivity of TLC to acting temperature, it is possible to detect invisible defects including delamination in compos- ite structures. To investigate the capabilities of this new method and to study the effect of constitutive materials as well as size/location of delamination, several samples using different combination of fibers and resins with arti- ficial defects were manufactured and appropriate examina- tions were conducted. PRINCIPLES OF TLC THERMOGRAPHY Thermography provides a description of the surface temperature changes and consequently allows detection of defects or anomalies in the underlying material because of changes in the surface temperature. The difference between thermal coefficients of defects and the surround- ing materials influences the temperature distribution. Depending on how the thermal load is supplied to the sample, there are two types of thermography, the so called passive and active methods [7, 11]. The passive approach examines structures, which are naturally at Correspondence to: Akbar Afaghi Khatibi; e-mail: [email protected] DOI 10.1002/pc.20453 Published online in Wiley InterScience (www.interscience.wiley.com). V V C 2008 Society of Plastics Engineers POLYMERCOMPOSITES—-2008
-
Upload
akbar-afaghi-khatibi -
Category
Documents
-
view
214 -
download
0
Transcript of On the application of liquid-crystal thermography for the nondestructive detection of delamination...
On the Application of Liquid-Crystal Thermographyfor the Nondestructive Detection of Delaminationin Composite Structures
Akbar Afaghi Khatibi, Hadi Rezghi MalekiSchool of Mechanical Engineering, Faculty of Engineering, University of Tehran, 11365-4563 Tehran, Iran
To prevent the catastrophic failure of composite struc-tures, several nondestructive testing methods havebeen developed. In this study, a new technique to eval-uate these structures by using thermochromic liquidcrystal (TLC) thermography is presented. Temperaturegradients produced by sensitive liquid-crystals areused to detect delamination in composite specimens.The effects of constituent materials and delaminationsize/location are investigated. The results from TLCthermography are compared to those from infraredthermography. Finally, advantages/disadvantages ofthe new method are discussed. On the basis of theresults from this study, it could be concluded that theTLC thermography can be used as an inexpensive non-destructive testing method in inspection of compositestructures. POLYM. COMPOS., 29:798–803, 2008. ª 2008Society of Plastics Engineers
INTRODUCTION
Because of their high specific modulus and strength,
composite materials have been widely used in aerospace,
marine, chemical, and electrical/electronic industries as
well as infrastructures and bio applications. Generally
speaking, defects can be produced in any structure and
component during manufacturing, handling, or under serv-
ice conditions. To avoid catastrophic failure of composite
structures, it is necessary to find appropriate inspection
techniques to obtain information about the integrity of
these structures. Nondestructive testing (NDT) can offer a
solution in this regard. Among well known techniques in
NDT field applied to composite structures are radiogra-
phy, thermography, and ultrasound methods [1–6].
Delamination is one of the common defects in compos-
ite components and could be detected by using ultrasound
techniques. However, the necessity of having an interme-
diate material in these techniques is putting a limitation
on their usage. In addition, it is possible for the interme-
diate media to penetrate into the structure and degrade or
even destroy the interfacial bonding between fiber and
matrix 7. Considering radiography, a long term usage of
x- or g-radiation can reduce the life-time of resin 8. In
addition, low contrast of images and high initial invest-
ment for labs and dark rooms are some of the other disad-
vantages of radiography techniques 9. Because of these
limitations, other NDT methods such as low frequency or
thermography techniques are mostly preferred in compos-
ite industries.
In this work, a new method of thermography by using
thermochromic liquid crystals (TLC) to evaluate the in-
tegrity of composite structures was developed. At the
heart of TLC based thermography systems are TLC.
These are materials that change their molecular and opti-
cal properties with temperature 10. The liquid-crystals
change from transparent at low temperatures, to red, yel-
low, green, blue, and violet as the temperature is
increased. At higher temperatures, the liquid-crystals
return to the transparent state. On the basis of the sensi-
tivity of TLC to acting temperature, it is possible to
detect invisible defects including delamination in compos-
ite structures. To investigate the capabilities of this new
method and to study the effect of constitutive materials as
well as size/location of delamination, several samples
using different combination of fibers and resins with arti-
ficial defects were manufactured and appropriate examina-
tions were conducted.
PRINCIPLES OF TLC THERMOGRAPHY
Thermography provides a description of the surface
temperature changes and consequently allows detection of
defects or anomalies in the underlying material because
of changes in the surface temperature. The difference
between thermal coefficients of defects and the surround-
ing materials influences the temperature distribution.
Depending on how the thermal load is supplied to the
sample, there are two types of thermography, the so
called passive and active methods [7, 11]. The passive
approach examines structures, which are naturally at
Correspondence to: Akbar Afaghi Khatibi; e-mail: [email protected]
DOI 10.1002/pc.20453
Published online in Wiley InterScience (www.interscience.wiley.com).
VVC 2008 Society of Plastics Engineers
POLYMER COMPOSITES—-2008
different (often higher) temperature than ambient, while
in the case of the active approach, an external stimulus is
necessary to induce relevant thermal contrasts.
The development of liquid-crystal based thermography
over the past 30 years has provided researchers with a rel-
atively inexpensive technique for visualizing and meas-
uring surface temperature. Scientists have successfully
used TLC thermography to investigate various thermal
phenomena in a wide variety of applications [12–16].
Fundamentally, a liquid-crystal is a thermodynamic phase
that is between the pure solid and pure liquid phases of
matter and exists in some organic compounds under cer-
tain conditions. At temperatures below the liquid-crystal’s
event temperature, a TLC will be in the solid state and
will appear transparent. At its event temperature, the TLC
will reflect a unique wavelength of visible light (i.e.,
color) that can be readily captured by a color camera. As
the temperature rises through the TLC bandwidth, the
reflected color of the TLC will change to red, yellow,
green, blue, and violet. A simple, two color-temperature
designator typically describes this response. For example,
R40C10W, the TLC used in this study, is one of TLC for-
mulation. The R40C signifies that the red-start or event
temperature of the TLC is 408C. The 10W signifies that
the blue-start temperature is at 108C above the red start
temperature and this provides users with a crude estimate
of the formulation’s active bandwidth. These color
changes are repeatable and reversible as long as the TLC
is not physically or chemically damaged. Finally, when
the temperature exceeds the TLC clearing point tempera-
ture, the material will enter the pure liquid state and will
revert back to being transparent 10. TLC formulations
with activation temperatures ranging from �308C to
1208C and bandwidths ranging from 0.58C to 308C are
commercially available.
PREPARATION OF SAMPLES
The most common defect, in composite structures,
which can occur during manufacturing or under service
conditions, is delamination. In this study, samples with ar-
tificial defects to simulate delamination were manufac-
tured. Hand-layup method was used to fabricate compos-
ite laminates containing eight layers. E-glass, carbon and
Kevlar-49 fabric fiber with R440 epoxy, and/or polyester
resin were used in this work. Two layers of Kevlar/epoxy
were used as skin for hybrid composites with extra six
layers of glass/epoxy as their core. The dimensions of
samples with glass fibers as well as hybrid samples were
150 � 150 mm2 while specimens manufactured by carbon
fibers were 100 � 100 mm2. The final thickness of com-
posite laminates with glass and carbon fibers, containing
eight layers, was 4 mm while for hybrid samples with 10
layers, it was 6.5 mm. Using a piece of Mylar1
tape, an
artificial delamination was created in all samples. The
dimensions of artificial defect for glass and hybrid sam-
ples were 25 � 25 mm2 while a 20 � 20 mm2 defect size
was used for the specimens containing carbon fibers. All
samples were then cured at room temperature for 24 hr.
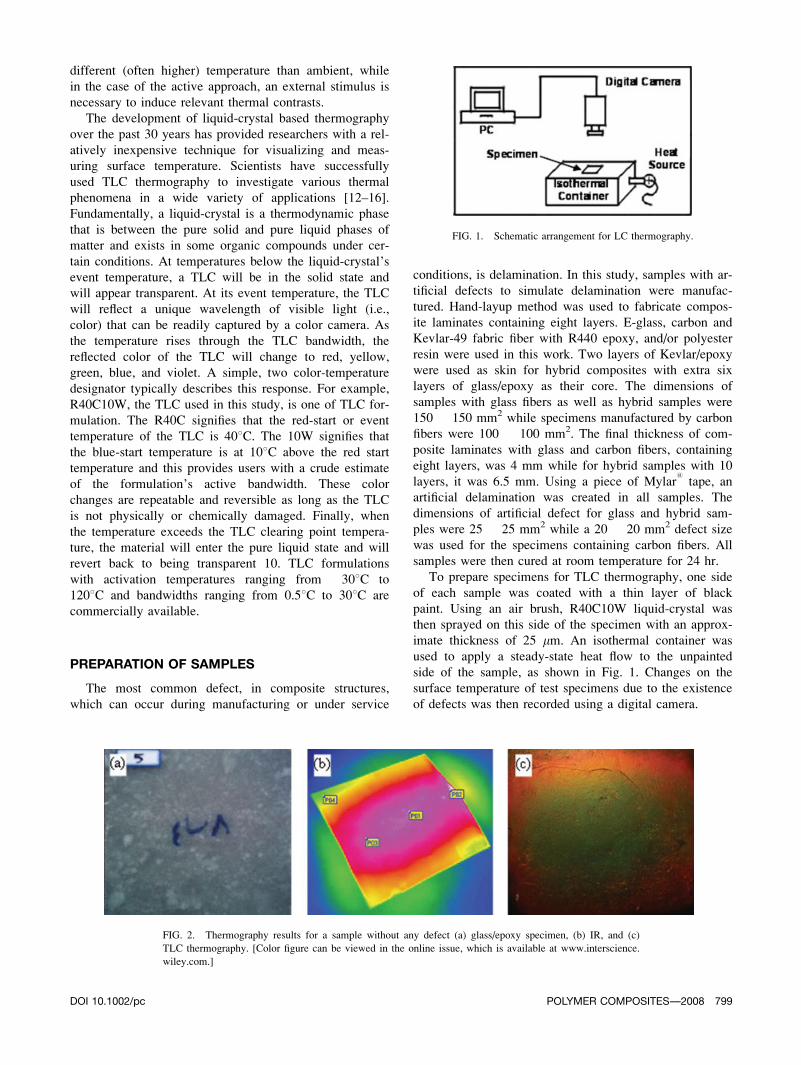
To prepare specimens for TLC thermography, one side
of each sample was coated with a thin layer of black
paint. Using an air brush, R40C10W liquid-crystal was
then sprayed on this side of the specimen with an approx-
imate thickness of 25 mm. An isothermal container was
used to apply a steady-state heat flow to the unpainted
side of the sample, as shown in Fig. 1. Changes on the
surface temperature of test specimens due to the existence
of defects was then recorded using a digital camera.
FIG. 1. Schematic arrangement for LC thermography.
FIG. 2. Thermography results for a sample without any defect (a) glass/epoxy specimen, (b) IR, and (c)
TLC thermography. [Color figure can be viewed in the online issue, which is available at www.interscience.
wiley.com.]
DOI 10.1002/pc POLYMER COMPOSITES—-2008 799
RESULTS AND DISCUSSION
To evaluate the results from TLC thermography, all
specimens were also examined by infrared (IR) thermog-
raphy. Figure 2 shows a typical result from both thermog-
raphy methods for a sample without any defect. It should
be noted that due to the existence of defects and conse-
quent differences in heat coefficients between composite
laminate and delaminated area (air), different behavior
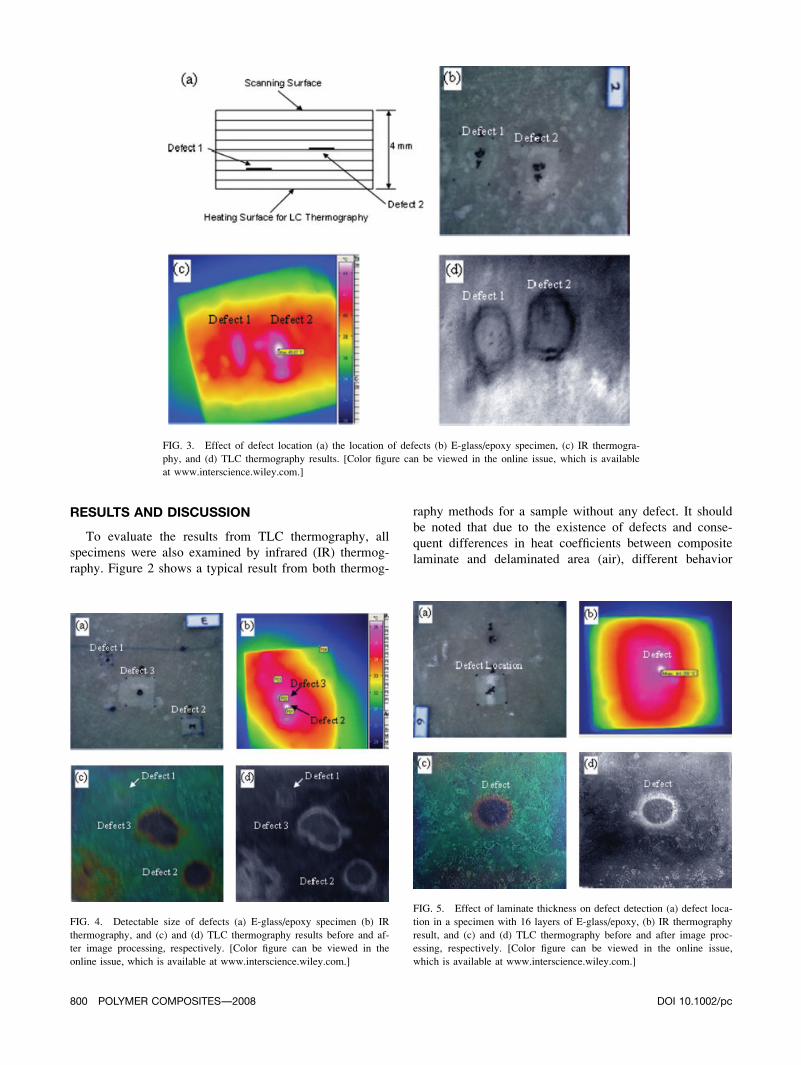
FIG. 3. Effect of defect location (a) the location of defects (b) E-glass/epoxy specimen, (c) IR thermogra-
phy, and (d) TLC thermography results. [Color figure can be viewed in the online issue, which is available
at www.interscience.wiley.com.]
FIG. 4. Detectable size of defects (a) E-glass/epoxy specimen (b) IR
thermography, and (c) and (d) TLC thermography results before and af-
ter image processing, respectively. [Color figure can be viewed in the
online issue, which is available at www.interscience.wiley.com.]
FIG. 5. Effect of laminate thickness on defect detection (a) defect loca-
tion in a specimen with 16 layers of E-glass/epoxy, (b) IR thermography
result, and (c) and (d) TLC thermography before and after image proc-
essing, respectively. [Color figure can be viewed in the online issue,
which is available at www.interscience.wiley.com.]
800 POLYMER COMPOSITES—-2008 DOI 10.1002/pc
was observed by IR and TLC thermography methods. In
the case of IR thermography, since the heated and
scanned surfaces of the laminate are same, therefore, the
surface temperature of delaminated area will be higher
than other parts of the laminate, i.e. the heat coefficient
of air is less than surrounding material. On the other
hand, in TLC thermography, the heated surface is not
same as the scanned one, i.e. the heat flow is coming
through the thickness, as shown in Fig. 1. For this reason,
the temperature of delaminated area should be less than
that of surrounding area without any defect.
To study the capabilities of new TLC thermography,
the effects of constitutive materials including fiber and
resin, laminate configuration, number of layers as well as
the location and size of delamination were studied.
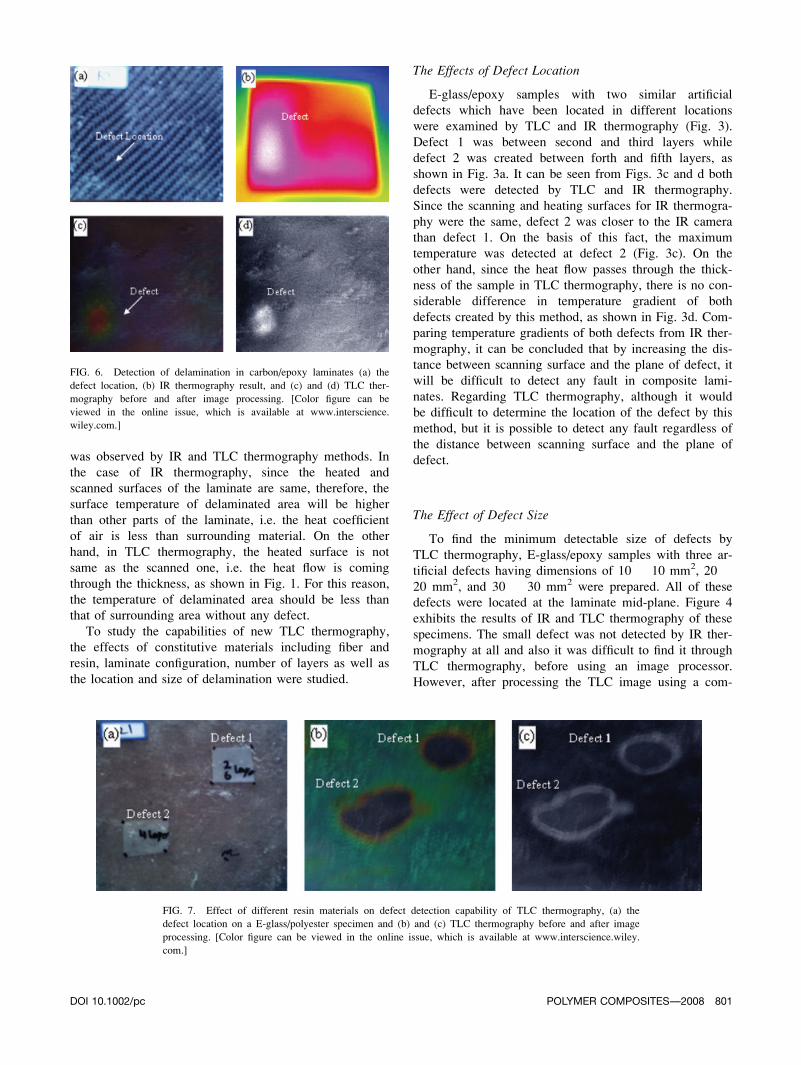
The Effects of Defect Location
E-glass/epoxy samples with two similar artificial
defects which have been located in different locations
were examined by TLC and IR thermography (Fig. 3).
Defect 1 was between second and third layers while
defect 2 was created between forth and fifth layers, as
shown in Fig. 3a. It can be seen from Figs. 3c and d both
defects were detected by TLC and IR thermography.
Since the scanning and heating surfaces for IR thermogra-
phy were the same, defect 2 was closer to the IR camera
than defect 1. On the basis of this fact, the maximum
temperature was detected at defect 2 (Fig. 3c). On the
other hand, since the heat flow passes through the thick-
ness of the sample in TLC thermography, there is no con-
siderable difference in temperature gradient of both
defects created by this method, as shown in Fig. 3d. Com-
paring temperature gradients of both defects from IR ther-
mography, it can be concluded that by increasing the dis-
tance between scanning surface and the plane of defect, it
will be difficult to detect any fault in composite lami-
nates. Regarding TLC thermography, although it would
be difficult to determine the location of the defect by this
method, but it is possible to detect any fault regardless of
the distance between scanning surface and the plane of
defect.
The Effect of Defect Size
To find the minimum detectable size of defects by
TLC thermography, E-glass/epoxy samples with three ar-
tificial defects having dimensions of 10 � 10 mm2, 20 �20 mm2, and 30 � 30 mm2 were prepared. All of these
defects were located at the laminate mid-plane. Figure 4
exhibits the results of IR and TLC thermography of these
specimens. The small defect was not detected by IR ther-
mography at all and also it was difficult to find it through
TLC thermography, before using an image processor.
However, after processing the TLC image using a com-
FIG. 6. Detection of delamination in carbon/epoxy laminates (a) the
defect location, (b) IR thermography result, and (c) and (d) TLC ther-
mography before and after image processing. [Color figure can be
viewed in the online issue, which is available at www.interscience.
wiley.com.]
FIG. 7. Effect of different resin materials on defect detection capability of TLC thermography, (a) the
defect location on a E-glass/polyester specimen and (b) and (c) TLC thermography before and after image
processing. [Color figure can be viewed in the online issue, which is available at www.interscience.wiley.
com.]
DOI 10.1002/pc POLYMER COMPOSITES—-2008 801
mercial software, as shown in Fig. 4d, the location of
defect 1 (10 � 10 mm2 defect) as well as the dimensions
of other defects were much clearer compared to the
results from IR thermography.
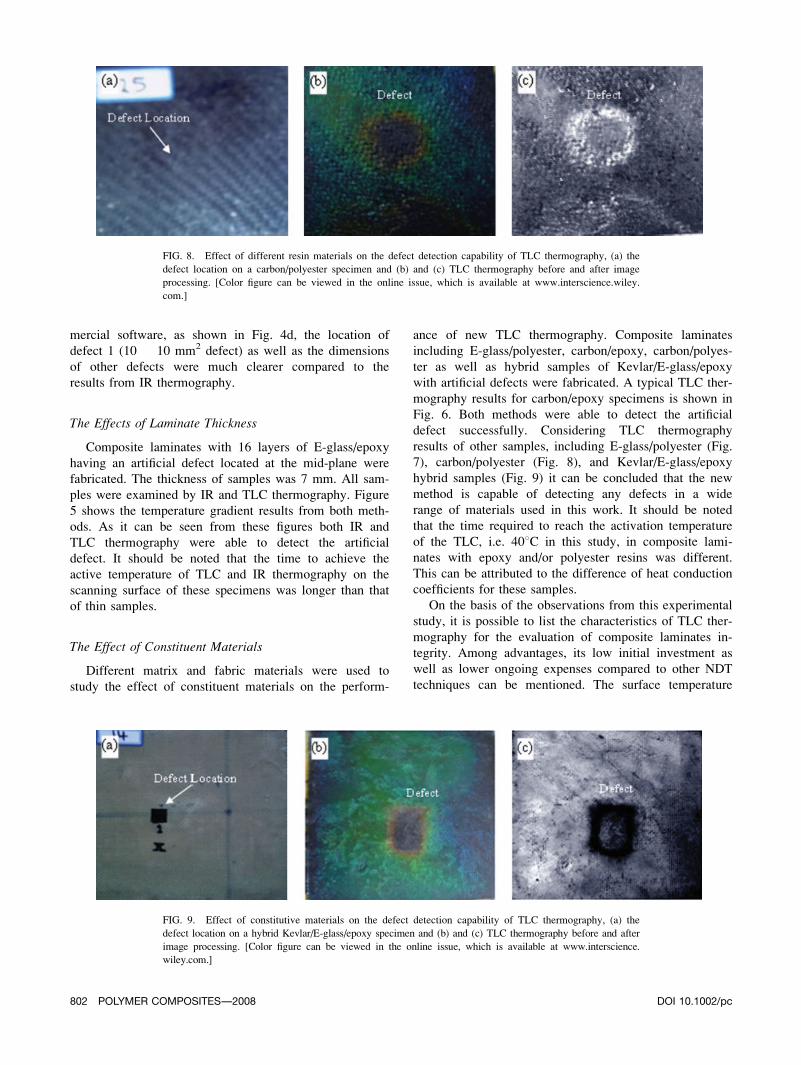
The Effects of Laminate Thickness
Composite laminates with 16 layers of E-glass/epoxy
having an artificial defect located at the mid-plane were
fabricated. The thickness of samples was 7 mm. All sam-
ples were examined by IR and TLC thermography. Figure
5 shows the temperature gradient results from both meth-
ods. As it can be seen from these figures both IR and
TLC thermography were able to detect the artificial
defect. It should be noted that the time to achieve the
active temperature of TLC and IR thermography on the
scanning surface of these specimens was longer than that
of thin samples.
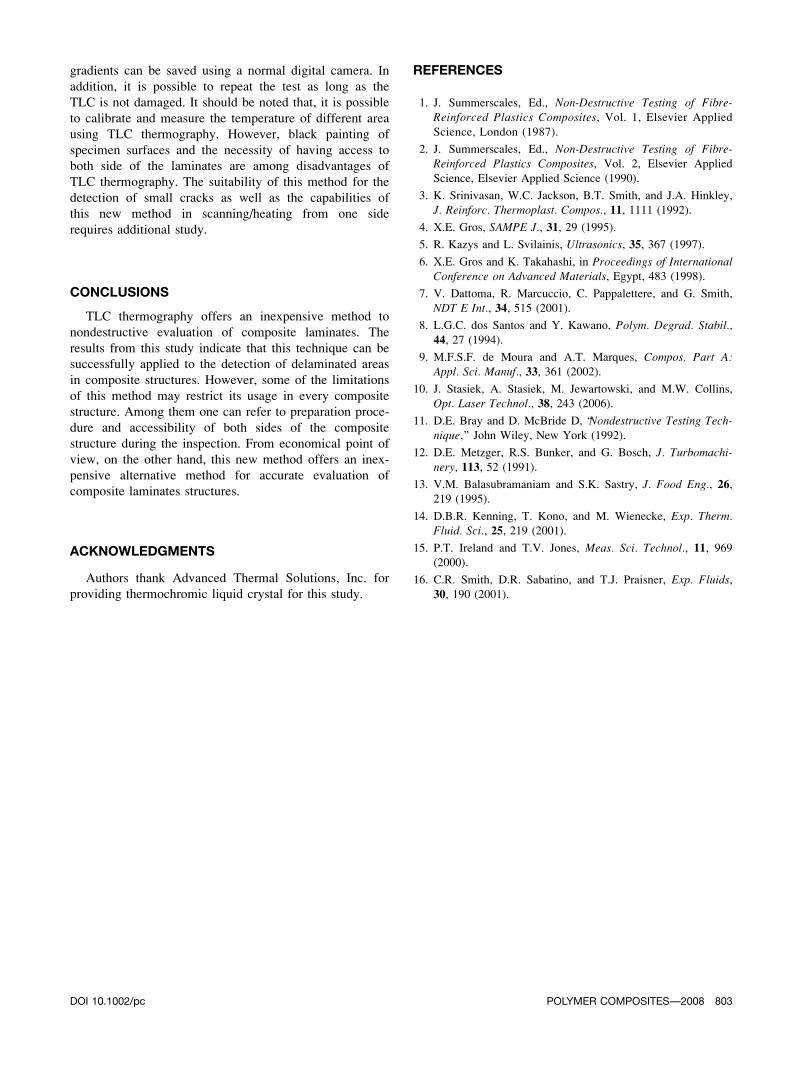
The Effect of Constituent Materials
Different matrix and fabric materials were used to
study the effect of constituent materials on the perform-
ance of new TLC thermography. Composite laminates
including E-glass/polyester, carbon/epoxy, carbon/polyes-
ter as well as hybrid samples of Kevlar/E-glass/epoxy
with artificial defects were fabricated. A typical TLC ther-
mography results for carbon/epoxy specimens is shown in
Fig. 6. Both methods were able to detect the artificial
defect successfully. Considering TLC thermography
results of other samples, including E-glass/polyester (Fig.
7), carbon/polyester (Fig. 8), and Kevlar/E-glass/epoxy
hybrid samples (Fig. 9) it can be concluded that the new
method is capable of detecting any defects in a wide
range of materials used in this work. It should be noted
that the time required to reach the activation temperature
of the TLC, i.e. 408C in this study, in composite lami-
nates with epoxy and/or polyester resins was different.
This can be attributed to the difference of heat conduction
coefficients for these samples.
On the basis of the observations from this experimental
study, it is possible to list the characteristics of TLC ther-
mography for the evaluation of composite laminates in-
tegrity. Among advantages, its low initial investment as
well as lower ongoing expenses compared to other NDT
techniques can be mentioned. The surface temperature
FIG. 8. Effect of different resin materials on the defect detection capability of TLC thermography, (a) the
defect location on a carbon/polyester specimen and (b) and (c) TLC thermography before and after image
processing. [Color figure can be viewed in the online issue, which is available at www.interscience.wiley.
com.]
FIG. 9. Effect of constitutive materials on the defect detection capability of TLC thermography, (a) the
defect location on a hybrid Kevlar/E-glass/epoxy specimen and (b) and (c) TLC thermography before and after
image processing. [Color figure can be viewed in the online issue, which is available at www.interscience.
wiley.com.]
802 POLYMER COMPOSITES—-2008 DOI 10.1002/pc
gradients can be saved using a normal digital camera. In
addition, it is possible to repeat the test as long as the
TLC is not damaged. It should be noted that, it is possible
to calibrate and measure the temperature of different area
using TLC thermography. However, black painting of
specimen surfaces and the necessity of having access to
both side of the laminates are among disadvantages of
TLC thermography. The suitability of this method for the
detection of small cracks as well as the capabilities of
this new method in scanning/heating from one side
requires additional study.
CONCLUSIONS
TLC thermography offers an inexpensive method to
nondestructive evaluation of composite laminates. The
results from this study indicate that this technique can be
successfully applied to the detection of delaminated areas
in composite structures. However, some of the limitations
of this method may restrict its usage in every composite
structure. Among them one can refer to preparation proce-
dure and accessibility of both sides of the composite
structure during the inspection. From economical point of
view, on the other hand, this new method offers an inex-
pensive alternative method for accurate evaluation of
composite laminates structures.
ACKNOWLEDGMENTS
Authors thank Advanced Thermal Solutions, Inc. for
providing thermochromic liquid crystal for this study.
REFERENCES
1. J. Summerscales, Ed., Non-Destructive Testing of Fibre-Reinforced Plastics Composites, Vol. 1, Elsevier Applied
Science, London (1987).
2. J. Summerscales, Ed., Non-Destructive Testing of Fibre-Reinforced Plastics Composites, Vol. 2, Elsevier Applied
Science, Elsevier Applied Science (1990).
3. K. Srinivasan, W.C. Jackson, B.T. Smith, and J.A. Hinkley,
J. Reinforc. Thermoplast. Compos., 11, 1111 (1992).
4. X.E. Gros, SAMPE J., 31, 29 (1995).
5. R. Kazys and L. Svilainis, Ultrasonics, 35, 367 (1997).
6. X.E. Gros and K. Takahashi, in Proceedings of InternationalConference on Advanced Materials, Egypt, 483 (1998).
7. V. Dattoma, R. Marcuccio, C. Pappalettere, and G. Smith,
NDT E Int., 34, 515 (2001).
8. L.G.C. dos Santos and Y. Kawano, Polym. Degrad. Stabil.,44, 27 (1994).
9. M.F.S.F. de Moura and A.T. Marques, Compos. Part A:Appl. Sci. Manuf., 33, 361 (2002).
10. J. Stasiek, A. Stasiek, M. Jewartowski, and M.W. Collins,
Opt. Laser Technol., 38, 243 (2006).
11. D.E. Bray and D. McBride D, ‘‘Nondestructive Testing Tech-nique,’’ John Wiley, New York (1992).
12. D.E. Metzger, R.S. Bunker, and G. Bosch, J. Turbomachi-nery, 113, 52 (1991).
13. V.M. Balasubramaniam and S.K. Sastry, J. Food Eng., 26,219 (1995).
14. D.B.R. Kenning, T. Kono, and M. Wienecke, Exp. Therm.Fluid. Sci., 25, 219 (2001).
15. P.T. Ireland and T.V. Jones, Meas. Sci. Technol., 11, 969(2000).
16. C.R. Smith, D.R. Sabatino, and T.J. Praisner, Exp. Fluids,30, 190 (2001).
DOI 10.1002/pc POLYMER COMPOSITES—-2008 803