On the Accurate Understanding of Mass Measurement Accuracy ...
10
WHITE PAPER C10G-E073 On the Accurate Understanding of Mass Measurement Accuracy in Q-TOF MS High-resolution, accurate-mass (HRAM) mass spectrometers (MS) are a class of MS instrumentation with capability to resolve complex sample matrix and to allow identification of compounds by measuring their accurate masses. In particular, those coupled to liquid chromatograph (HRAM LC/MS) have been used extensively for structural elucidation of unknown compounds primarily in chemical industry (impurity analysis) and biological researches (proteomics, metabolomics, lipidomics), but also increasingly in forensic science, food safety and environmental testing. The key performance attribute underlying all application fields is mass measurement accuracy (MMA) as it affords molecular specificity and reduction of false positive results. This white paper focuses on the fundamentals of MMA in terms of ion statistics. Various factors affecting the observed MMA will be explained, revealing the engineering rationale behind Shimadzu LCMS-9030 quadrupole time-of-flight (Q-TOF) mass spectrometer for stably achieving sub-ppm MMA. Keywords: Mass Spectrometry, MS; Quadrupole Time-of-flight, Q-TOF; Mass Measurement Accuracy, MMA; High-Resolution Accurate-Mass, HRAM; High-Resolution Mass Spectrometry, HR-MS. Mechanism of Q-TOF MS Quadrupole time-of-flight (Q-TOF) mass spectrometer (MS) uses a hybrid of technologies. Ions generated at the ion source are first focused into a ‘beam’ and transmitted through the quadrupole, using the proven technologies of the triple- quadrupole mass spectrometers. On the other end, the TOF technology analyzes the ions in ‘pulses’, measuring the time taken for the ions to travel through a high vacuum chamber called flight tube (Fig. 1) [1] . On entry into the flight tube, ions are accelerated by a high-voltage field oriented perpendicular to the vector of ion beam. This high-voltage field is applied transiently and repeatedly so that the ion beam in continuous flow can be segmented into small packets of pulses. The amount of kinetic energy gained by the ion packet in the field can be described by Equation 1. Assuming that all of the kinetic energy gained is converted into unidirectional velocity, time-of-flight can be described by Equation 2, which indicates that TOF is proportional to the squareroot of m/z for a constant flight path and acceleration voltage. Therefore, as a device, a TOF MS analyzer is a time recorder that synchronizes high-voltage pulse with ion detection to measure TOF. Mass Spectrometry Fundamentals LCMS Q-TOF https://www.shimadzu.com/an /lcms/9030/index.html Publish Date: 10 April 2019 Author: Atsuhiko Toyama, Ph.D. Marketing Innovation Centre, Singapore.
Transcript of On the Accurate Understanding of Mass Measurement Accuracy ...

WHITE PAPER
C10G-E073
On the Accurate Understanding of Mass Measurement Accuracy in Q-TOF MS
High-resolution, accurate-mass (HRAM) mass spectrometers (MS) are a class of MS instrumentation with capability to resolve complex sample matrix and to allow identification of compounds by measuring their accurate masses. In particular, those coupled to liquid chromatograph (HRAM LC/MS) have been used extensively for structural elucidation of unknown compounds primarily in chemical industry (impurity analysis) and biological researches (proteomics, metabolomics, lipidomics), but also increasingly in forensic science, food safety and environmental testing.
The key performance attribute underlying all application fields is mass measurement accuracy (MMA) as it affords molecular specificity and reduction of false positive results. This white paper focuses on the fundamentals of MMA in terms of ion statistics. Various factors affecting the observed MMA will be explained, revealing the engineering rationale behind Shimadzu LCMS-9030 quadrupole time-of-flight (Q-TOF) mass spectrometer for stably achieving sub-ppm MMA.
Keywords: Mass Spectrometry, MS; Quadrupole Time-of-flight, Q-TOF; Mass Measurement Accuracy, MMA; High-Resolution Accurate-Mass, HRAM; High-Resolution Mass Spectrometry, HR-MS.
Mechanism of Q-TOF MS
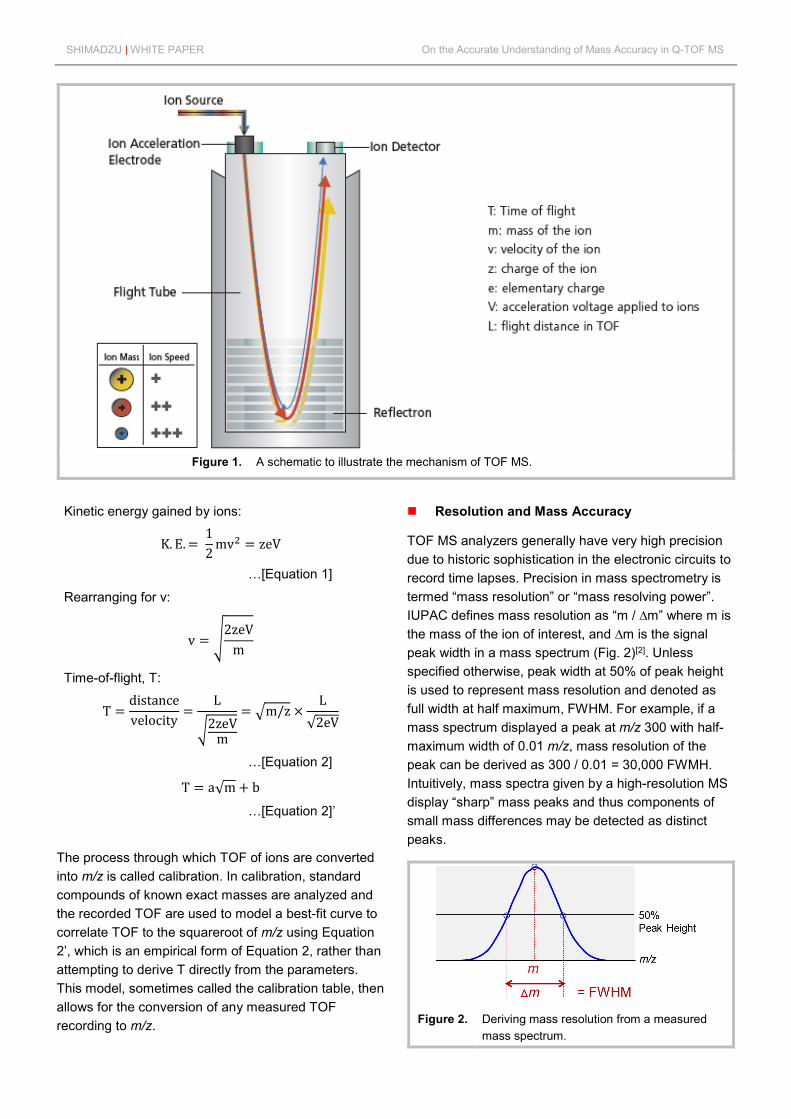
Quadrupole time-of-flight (Q-TOF) mass spectrometer (MS) uses a hybrid of technologies. Ions generated at the ion source are first focused into a ‘beam’ and transmitted through the quadrupole, using the proven technologies of the triple-quadrupole mass spectrometers. On the other end, the TOF technology analyzes the ions in ‘pulses’, measuring the time taken for the ions to travel through a high vacuum chamber called flight tube (Fig. 1)[1].
On entry into the flight tube, ions are accelerated by a high-voltage field oriented perpendicular to the vector of ion beam. This high-voltage field is applied transiently and repeatedly so that the ion beam in continuous flow can be segmented into small packets of pulses. The amount of kinetic energy gained by the ion packet in the field can be described by Equation 1. Assuming that all of the kinetic energy gained is converted into unidirectional velocity, time-of-flight can be described by Equation 2, which indicates that TOF is proportional to the squareroot of m/z for a constant flight path and acceleration voltage. Therefore, as a device, a TOF MS analyzer is a time recorder that synchronizes high-voltage pulse with ion detection to measure TOF.
Mass Spectrometry Fundamentals LCMS Q-TOF https://www.shimadzu.com/an/lcms/9030/index.html Publish Date: 10 April 2019 Author: Atsuhiko Toyama, Ph.D. Marketing Innovation Centre, Singapore.
SHIMADZU | WHITE PAPER On the Accurate Understanding of Mass Accuracy in Q-TOF MS
Figure 1. A schematic to illustrate the mechanism of TOF MS.
Kinetic energy gained by ions:
K. E. = 12
mv2 = zeV
…[Equation 1]
Rearranging for v:
v = �2zeVm
Time-of-flight, T:
T =distancevelocity
=L
�2zeVm
= �m/z ×L
√2eV
…[Equation 2]
T = a√m + b
…[Equation 2]’
The process through which TOF of ions are converted into m/z is called calibration. In calibration, standard compounds of known exact masses are analyzed and the recorded TOF are used to model a best-fit curve to correlate TOF to the squareroot of m/z using Equation 2’, which is an empirical form of Equation 2, rather than attempting to derive T directly from the parameters. This model, sometimes called the calibration table, then allows for the conversion of any measured TOF recording to m/z.
Resolution and Mass Accuracy
TOF MS analyzers generally have very high precision due to historic sophistication in the electronic circuits to record time lapses. Precision in mass spectrometry is termed “mass resolution” or “mass resolving power”. IUPAC defines mass resolution as “m / ∆m” where m is the mass of the ion of interest, and ∆m is the signal peak width in a mass spectrum (Fig. 2)[2]. Unless specified otherwise, peak width at 50% of peak height is used to represent mass resolution and denoted as full width at half maximum, FWHM. For example, if a mass spectrum displayed a peak at m/z 300 with half-maximum width of 0.01 m/z, mass resolution of the peak can be derived as 300 / 0.01 = 30,000 FWMH. Intuitively, mass spectra given by a high-resolution MS display “sharp” mass peaks and thus components of small mass differences may be detected as distinct peaks.
Figure 2. Deriving mass resolution from a measured
mass spectrum.

SHIMADZU | WHITE PAPER On the Accurate Understanding of Mass Accuracy in Q-TOF MS
In contrast, accuracy is an attribute of mass measurement that is not apparent from the mass spectrum. Abbreviated MMA, mass measurement accuracy is defined as the deviation of measured mass from the exact mass. Here, exact mass means the mass based on theoretical calculation, summing the masses of elemental isotopes that formulate the compound being measured. Evaluation of MMA hence requires prior knowledge of the compound identity.
Figure 3 illustrates the definition of MMA. Here, ∆m denotes the mass deviation from the measured mass and exact mass. In this example, if the ion suspected to be flufenoxuron (formula C21H11N2O3F6Cl, exact mass 488.03624 Da) is observed at m/z 488.03673, deviation is +0.00049 Da or +0.49 mDa or +1.0 parts per million, abbreviated ppm.
Figure 3. Deriving MMA from a measured mass
spectrum based on compound identity.
In this white paper (and hoping that other publications follow), we use the term MMA or accuracy to describe system performance, and mass deviation or mass error for the result pertaining to experiments. It is important to strictly differentiate the two notions because mass measurement involves randomness and it is quite possible to acquire results with small errors purely by chance, which does not prove the accurateness of the system used.
Mass Peak Detection and Ion Statistics
It is important to understand that MMA is an independent attribute from mass resolution in data interpretation. One can observe an extremely “sharp” mass peak measured at several ppm away from the exact mass, or in vice versa, a “broad” mass peak with its apex accurately coinciding the exact mass. In order to accurately understand the nature of mass accuracy and how it is affected by mass resolution, mass
measurement needs to be explained in terms of ion statistics.
First, consider a hypothetical compound that gives ions of exact mass 400.000. The objective of mass spectrometric analysis is to statistically infer this exact mass by extracting a subset of these ions and measuring their masses (Fig. 4). Several ions are simultaneously measured, giving a range of measurement values, which are represented as a smoothed histogram commonly referred to as mass spectrum. Thus, mass measurement results in a distribution of measured masses and the mean value is used to represent the mass of the original population.
Figure 4. A schematic representing the notion that
measurement of ions converts uniform population into distribution, or ion statistics.
To help interpret ion statistics, consider measurement of a single ion and predicting its outcome (Fig. 5). By assuming that mass measurement is a continuous random variable that follows Gaussian distribution, the outcome of a single event can be predicted by solving the probability function and probability distribution. That is, the measurement will most likely give the exact mass, but there are infinite other possibilities. Deriving a real number for standard deviation (σ) of probability distribution will be the goal of this approach, because the property of Gaussian distribution is that 95% of results fall within ±2σ. This translates directly to 95% confidence interval of mass accuracy.
Mass resolution in FWMH provides a good starting point to derive a real number for σ, as “∆m at 50% peak height” is equivalent to “width at 50% of maximum probability (Pmax)”. Solving the probability function for 50% Pmax gives the conversion ∆m = 2σ√2 ln 2 or 2.35σ[3]. For example, if the measurement of m/z 400.000 was performed with a mass spectrometer with 30,000 mass resolution (FWMH), ∆m is expected to be 400 / 30,000 = 0.0133 and σ of this distribution would be 0.0133/2.35 = 0.00566 m/z or 14 ppm.

SHIMADZU | WHITE PAPER On the Accurate Understanding of Mass Accuracy in Q-TOF MS
Figure 5. A schematic representing the probability
distribution of individual ion measurement. 95% of cases fall within ±2σ and FWHM translates to 2.35σ. Abbreviations: mi, individual measurement; mexact, exact mass; σ, standard deviation.
Thus, mass resolution is correlated directly to the probability distribution of the outcome of a single mass measurement. To generalize, σ of probability distribution (in ppm) for any given resolution (in FWMH) can be derived as follows:
RFWMH = m∆m
=m
2σ√2 ln 2
Rearranging for σ:
σ =m
2R√2 ln 2
Converting to ppm:
σ =m
2R√2 ln 2×
106
m=
106
2R√2 ln 2
≈106
2.35R≈
425000R
…[Equation 3]
Now consider a real acquisition event, where hundreds and thousands of ions are sampled and measured (Fig. 6). The mean of all individual ion measurements is termed “mean mi”. Most frequently this is observed simply as “centroid m/z” (centroid means weighted average) on peaks of mass spectra, since most mass spectrometers process multiple acquisitions and multiple ions to generate a single mass spectrum. The frequency of ions sampled by the mass spectrometer and contributing to the mean is reflected on the intensity of the mass peak.
Figure 6. A schematic representing how ion
abundance (sensitivity) determines the closeness of acquired mean to the expected mean. Abbreviations: mi, individual measurement; mexact, exact mass; σ, standard deviation.
Statistically, a population subset is never sufficiently large to be identical to the probability distribution predicted by mass resolution. Due to randomness in the sampling procedure, mean mi itself has distribution and variance, and its closeness to the predicted mean relates to the size of the population subset. By central limit theorem, standard deviation of mean mi (σmean) can be derived from the standard deviation of the probability distribution (σ) and the number of ions being sampled, N, such that:
σmean = σ√N
Substituting from Equation 3:
σmean ≈ 425000
R√N
…[Equation 4]
The resulting Equation 4 can be used to calculate the theoretical limit of MMA. As ion abundance relates directly to sensitivity, the relationship explains why both resolution and sensitivity are contributing elements for MMA. For instance, the theoretical limit of MMA for 30,000 mass resolution at various ion abundances have been summarized in Table 1. Because most mass spectrometric analyses deal with thousands of ions, the summary demonstrates that an instrument of 30,000 mass resolution should be well capable of achieving better than 1 ppm MMA. Conversely, MMA could be used to benchmark the sensitivity performance of mass spectrometers by making statistical estimation of the number of ions contributing to data.

SHIMADZU | WHITE PAPER On the Accurate Understanding of Mass Accuracy in Q-TOF MS
Table 1. Relationship between ion statistics and theoretical limit of mass measurement accuracy for mass resolution of 30,000.
Number of Ions Theoretical Limit of MMA (95% confidence interval)
1 28 ppm 10 9 ppm
100 2.8 ppm 1,000 0.9 ppm
10,000 0.28 ppm 100,000 0.09 ppm
Impact of Mass Calibration on MMA
Discussions so far have assumed ideal calibration, wherein the mean of probability distribution is representing the exact mass. However, similar in principle to calibration for quantitative analysis, such an ideal calibration can only be achieved by using the same calibration standard as the target. This is not the usual practice for qualitative analysis that seeks to determine the masses of unknown compounds for identification without authentic standards. Therefore, researchers must be conscious of the limitations of mass calibration and how the degree of inaccuracy can be minimized.
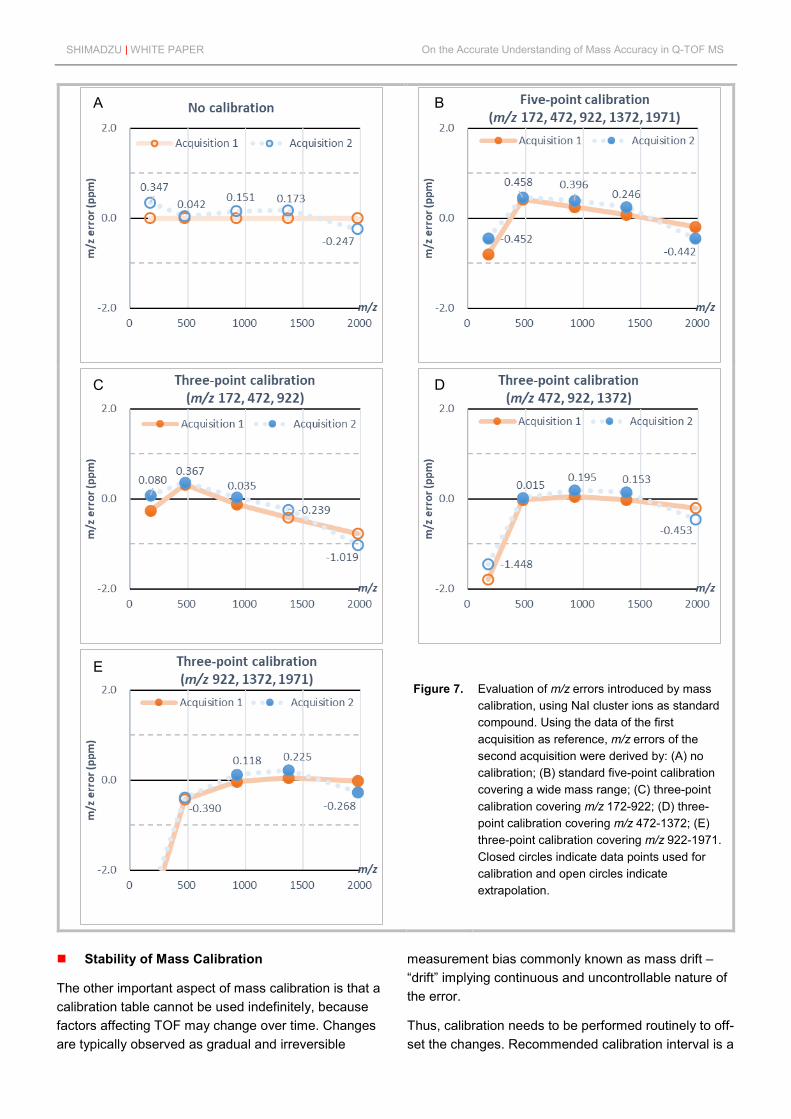
To understand how inaccuracies are built into analysis by mass calibration, consider two sets of data acquired in consecutive runs under the same conditions, measuring the TOF (in nanoseconds) of five sodium iodide cluster ions. Table 2 summarizes the representative data, demonstrating that the difference between the two acquisition outcomes were minimal. The TOF difference translates directly to m/z error (multiply by 2 for conversion) and indicate the instrument performance under ‘ideal’ calibration.
Next, mass calibration was conducted using the TOFs in the first acquisition, giving 2182.0922 as the regression coefficient and 94.2750 as the constant. Using this calibration table, measured TOFs were
converted to m/z for the two acquisitions, as summarized in Table 3. Notice that the m/z errors derived in this way were much larger than shown in Table 2. This is attributed to over-simplification of the TOF-m/z relationship as it ignores subtle factors such as mass dependency of initial ion energies. As the result of using the ‘incorrect’ calibration model, an accurate TOF measurement inherently results in erroneous m/z determination. Nevertheless, it is still the best practice to undergo linear fit with empirically derived coefficients, rather than attempting to derive a different type of curve fitting. Results presented in Tables 2 and 3 have been graphically displayed in Figure 7A and 7B to illustrate the difference between ‘ideal’ calibration (in fact, no calibration) and ‘real’ calibration.
Furthermore, Figure 7C, 7D and 7E illustrate how the performance of mass calibration may be influenced by the selection of calibration compounds. Here, three ions in different combinations were selected for deriving the regression model, using which the errors of the second acquisition were evaluated. Notable improvement in the m/z errors were observed for data points covered by the three-point calibration, while those outside of the calibration range (extrapolated results) were severely compromised. These observations clearly underly the ‘rule of thumb’ in mass calibration; avoid extrapolation but select calibration standards to minimally cover the range of interest. The results also suggest that a linear regression model for TOF-mass calibration introduces positive bias within the calibration range and negative bias in extrapolation or in the extremes of a wide range.
Fundamentally, mass calibration derives an empirical model to incorporate all systematic factors affecting TOF measurement, and in turn introduces systematic error (bias) that is constitutive to the act of calibration. Accurate understanding of mass calibration helps analysts better interpret the data, for example in judging the adequacy of identification results.
Table 2. Representative results of two consecutive acquisitions on NaI cluster ions (calibration reference).
Ion formula Exact Mass TOF measurement (1) TOF measurement (2) TOF diff (ppm)
Na-(NaI) 172.883462 28785.537 28785.542 0.174 Na-(NaI)2 472.671944 47535.195 47535.196 0.021 Na-(NaI)3 922.354668 66365.062 66365.067 0.075 Na-(NaI)4 1372.037391 80921.206 80921.213 0.087 Na-(NaI)5 1971.614356 96985.410 96985.398 -0.124
SHIMADZU | WHITE PAPER On the Accurate Understanding of Mass Accuracy in Q-TOF MS
Figure 7.
Evaluation of m/z errors introduced by mass calibration, using NaI cluster ions as standard compound. Using the data of the first acquisition as reference, m/z errors of the second acquisition were derived by: (A) no calibration; (B) standard five-point calibration covering a wide mass range; (C) three-point calibration covering m/z 172-922; (D) three-point calibration covering m/z 472-1372; (E) three-point calibration covering m/z 922-1971. Closed circles indicate data points used for calibration and open circles indicate extrapolation.
Stability of Mass Calibration
The other important aspect of mass calibration is that a calibration table cannot be used indefinitely, because factors affecting TOF may change over time. Changes are typically observed as gradual and irreversible
measurement bias commonly known as mass drift – “drift” implying continuous and uncontrollable nature of the error.
Thus, calibration needs to be performed routinely to off-set the changes. Recommended calibration interval is a
A B
C D
E

SHIMADZU | WHITE PAPER On the Accurate Understanding of Mass Accuracy in Q-TOF MS
Table 3. Result of mass calibration using the TOFs acquired in the first acquisition, deriving a linear regression model to allow conversion of TOF to m/z.
Ion formula Exact Mass Regression model (using TOF1)
Acquired m/z (1) and error in ppm
Acquired m/z (2) and error in ppm
Na-(NaI) 172.883462
T = a√m + b where T is TOF
and m is m/z
a: 2182.0922 b: 94.2750
172.88332 (-0.798 ppm)
172.88338 (-0.451 ppm)
Na-(NaI)2 472.671944 472.67214 (0.415 ppm)
472.67216 (0.457 ppm)
Na-(NaI)3 922.354668 922.35489 (0.245 ppm)
922.35503 (0.396 ppm)
Na-(NaI)4 1372.037391 1372.03749 (0.072 ppm)
1372.03773 (0.245 ppm)
Na-(NaI)5 1971.614356 1971.61397 (-0.194 ppm)
1971.61348 (-0.442 ppm)
critical performance metric of HRAM instrument, not only for routine usability but also because it demonstrates the stability of the instrument in generating reliable and reproducible data. Long calibration intervals can be achieved by efficient systems to counteract environmental interferences and, in addition, robust electronics to ensure that measurements are performed with precisely consistent voltages and timings. These relate to two major factors directly affecting the TOF, namely the flight path length (L) and electrostatic energy given to the ions (√2eV), as described in Equation 2.
Path length can change as the flight-tube undergoes subtle dimensional deformation by thermal expansion and contraction, and this can result in significant change in the TOF. Evaluation of MMA by Knolhoff et al.[4] demonstrated that fluctuation of a Q-TOF instrument temperature by merely a few degrees C resulted in increment of mass errors by tens of ppm. To resolve the temperature issue, Shimadzu have developed novel technologies for improved management of flight-tube temperature.
Collectively named UF-FlightTube™, the key technologies include:
(1) computational approach to optimization of heater/sensor positions;
(2) novel feedback and feedforward algorithm, and; (3) patented black nickel plating on flight tube housing
for maximizing heat radiation.
Effectiveness of this temperature control system was evaluated by controlled stress test, in which the LCMS-9030 was brought into the quality assessment chamber that can precisely modulate the ambient temperature (Fig. 8). In this experiment, the LCMS-9030 was subjected to rigorous temperature changes within a 24-hour period to mimic a harsh operating environment. Starting from 24°C, it was raised to 27°C, dropped to 21°C, and finally shifted back to 24°C. During this time, Q-TOF LC/MS runs were conducted at hourly intervals, recording the mass errors of a few targeted compounds to observe the mass drift. Mass calibration was conducted at the beginning of the experiment and this calibration table was used in all measurements without any additional calibration or correction.
Figure 8. Shimadzu Quality Center at Global Headquarters, Kyoto, Japan.

SHIMADZU | WHITE PAPER On the Accurate Understanding of Mass Accuracy in Q-TOF MS
Figure 9. Temperature stress test was performed to evaluate MMA in harsh operating environment. Hourly acquisitions were repeated for 24 hours and mass errors recorded (closed circles), while the ambient temperature was shifted by 3C (dotted line). Results are shown for positive mode (A) and negative mode (B) performed on separate days, each showing the same trend.
Three key findings given by the results (Fig. 9A and 9B) evidently support the conclusion that LCMS-9030, with the UF-FlightTube, has overcome the temperature issue altogether. First, the pattern of mass drift closely synchronized with the room temperature change. As the room temperature increased, m/z recordings were given positive bias, and vice versa, as predicted from the operating principle. More importantly, as the second finding, we observed that the mass errors returned to the original level at the end of the experiment when the room temperature returned to 24°C. This finding indicates that the environmental interference on instrument is reversible. Finally, the amplitude of mass drift was as small as ±1.5 ppm after experiencing ±3°C change in room temperature. This data has the potential to totally refashion the Q-TOF user experience – temperature change is no longer a source of random mass drift but a small bias that can be predicted and controlled.
The other critical TOF-determining factor is regarding the robustness and stability of high-voltages applied across the flight tube and orthogonal acceleration. Due to large number of factors contributing to robustness, it is not possible to identify the cause or predict the nature of this systematic error; the bias may be positive or negative, transient or irreversible, gradual or sudden, moderate or critical.
Following the 24-hour temperature stress test, we sought to assess the system robustness under constant laboratory temperature (<±1°C), thereby isolating the electronic factor as the only variable that can introduce mass drift. This time, hourly injections
were conducted for 60 hours and the initial mass calibration was conducted by using the target compounds themselves to give reference TOFs. Same reference TOFs were used in all measurements without any additional mass calibration or correction.
The results showed that all of the hourly measurements conducted in 60 hours fell under ±1 ppm from the original value (Fig. 10) and converged to near-zero as the mean value (Table 5). Since zero was the truly expected outcome (thanks to ‘ideal’ calibration), we deduced that all m/z deviations were within statistical randomness and there was not a sign of mass drift. Therefore, we conclude that the electronics of LCMS-9030 is not the regular source of systematic errors that necessitate frequent re-calibration.
Benefits and Pitfalls of Lock-Mass Correction
A widely-used approach for sustaining favorable MMA is to implement automated correction of calibration table using measured masses of a ubiquitous compound of known exact mass (the ‘lock-mass’). This lock-mass approach compensates for randomly-occurring mass drifts, alleviating the need for frequent re-calibration. Moreover, several researches have demonstrated the effectiveness of the lock-mass correction in improving the overall MMA, giving notable impact on complex analyses requiring long chromatographic runtime[5], albeit the different algorithms employed by researchers and instrument manufacturers.
A B

SHIMADZU | WHITE PAPER On the Accurate Understanding of Mass Accuracy in Q-TOF MS
Figure 10. Scatter plot showing the results of 60-hour stability test. Standard mixture was injected and analyzed 60
times at hourly intervals. All data points fell within 1 ppm deviation from the reference.
Table 5. Statistics of 60-hour stability test results.
Compound Exact Mass Amount injected
(pg)
Mean m/z deviation
(ppm)
Standard deviation
(ppm)
Acetaminophen 152.0706 2000 0.002 0.118 Anisomycin 266.1387 100 -0.022 0.092 Progesterone 315.2319 200 0.090 0.194 Mitomycin C 335.1350 200 -0.002 0.079 Griseofulvin 353.0786 100 0.017 0.090 Doxorubicin 544.1813 2000 0.025 0.099 Rifampicin 823.4124 200 -0.057 0.101 Valinomycin 1128.665 20 -0.008 0.097
The vast acceptance of lock-mass correction is pure reflection of the common recognition that external calibration is insufficient for practical use. As demonstrated above, Shimadzu LCMS-9030 has exceptional stability and can be ran routinely on long
intervals of external calibration. It is equipped with lock-mass function, but now that external calibration is also reliable, we recommend users to consider potential pitfalls (Table 6) and balance with the benefit gained.
Table 6. Precautions on the usage of lock-mass correction. Problem Consequence Corrective Action
Lock-mass found outside of the mass range of interest.
Correction introduces bias in proportion to deviation from the lock-mass.
Post-column addition of an appropriate reference compound.
Interfering signal overlaps the lock-mass peak, shifting the centroid.
Erroneous correction results in compromised MMA (worse than external calibration).
Inadequate signal intensity is particularly an issue with detector using time-to-digital converter (dead-time effect).
Rescue the data by post-run re-calibration.
If problem persists, modify conditions to adjust the detection level or apply correction only between analysis.
Lock-mass signal too low (ionization suppression) and not accurately measured.
Lock-mass signal too high and not accurately measured.

SHIMADZU | WHITE PAPER On the Accurate Understanding of Mass Accuracy in Q-TOF MS
Lock-mass reference compound interferes with target analytes e.g. ionization suppression.
Compromised data quality and reproducibility.
Use additional ionization source to avoid interference.
Lock-mass signal not found (frequently observed when solvent ion is used).
No correction occurs. Select a different lock-mass
Conclusion
This white paper explained the fundamentals pertaining to factors affecting accuracy of mass measurement. According to the ion statistics theory, the equation for calculating the limit of mass measurement accuracy is a direct function of both mass resolution (R) and sensitivity (√N). Above all, instrument stability is critically important in sustaining the accuracy. Stability is attributed to two elements; efficient temperature control system and long-term electronic robustness, both of which were experimentally demonstrated herein. To express this notion in simple terms, the numerical constant in Equation 4 was replaced with letter S to represent the stability element, and the resulting three letter fraction was illustrated as the ‘Mass Accuracy Triangle’ (Fig. 11). The engineering concept of LCMS-9030 was to balance the three elements to achieve good and sustainable accuracy, and the value of this approach is clearly evident in the data generated so far.
Figure 11. The ‘Mass Accuracy Triangle’ summarizes
the important elements for attaining good mass measurement accuracy.
References
1. Fundamental Guide to Liquid Chromatography Mass Spectrometry (LCMS), Shimadzu Corporation, 2018. https://www.shimadzu.com/an/lcms/support/fundamental/index.html
2. IUPAC. Compendium of Chemical Terminology, 2nd ed. (the "Gold Book"), online version 2.3.3. https://doi.org/10.1351/goldbook.R05318
3. Wolfram MathWorld – Gaussian Function (accessed April 2019). http://mathworld.wolfram.com/GaussianFunction.html
4. Knolhoff A.M., Callahan J.H., Croley T.R. J. Am. Soc. Mass Spectrom. (2014) 25:1285-1294.
5. Lee K.A., Farnsworth C., Yu W., Bonilla L.E. J. Proteome. Res. (2011) 4;10(2):880-5.
For Research Use Only. Not for use in diagnostic procedures. This publication may contain references to products that are not available in your country. Please contact us to check the availability of these products in your country. The content of this publication shall not be reproduced, altered or sold for any commercial purpose without the written approval of Shimadzu. Company names, products/service names and logos used in this publication are trademarks and trade names of Shimadzu Corporation, its subsidiaries or its affiliates, whether or not they are used with trademark symbol “TM” or “®”. Third-party trademarks and trade names may be used in this publication to refer to either the entities or their products/services, whether or not they are used with trademark symbol “TM” or “®”. Shimadzu disclaims any proprietary interest in trademarks and trade names other than its own. The information contained herein is provided to you "as is" without warranty of any kind including without limitation warranties as to its accuracy or completeness. Shimadzu does not assume any responsibility or liability for any damage, whether direct or indirect, relating to the use of this publication. This publication is based upon the information available to Shimadzu on or before the date of publication, and subject to change without notice.
Shimadzu Corporation www.shimadzu.com/an/
© Shimadzu Corporation, 2019