
On Secondary Buyouts - University of Oxfordeureka.sbs.ox.ac.uk/5271/1/SBO-Paper.pdf · On Secondary...
55
On Secondary Buyouts Francois Degeorge * , Jens Martin ** , and Ludovic Phalippou *** October 18, 2014 Abstract Private equity firms increasingly sell companies to each other in secondary buyouts (SBOs). We examine commonly expressed concerns regarding SBOs using novel and unique datasets. SBOs made by buyers under pressure to spend capital (a minority of transactions) underperform and destroy value for investors, who then reduce their capital allocation to private equity firms doing those transactions. Other SBOs perform as well as other buyouts, and investors do not penalize firms doing those. When the buyer and seller have complementary skill sets, SBOs generate significantly higher returns and outperform other buyouts. Investors do not pay higher total transaction costs as a result of SBOs, even if they have a stake in both the buying fund and the selling fund. Overall, our evidence paints a nuanced picture of SBOs. JEL Codes: G23, G24 Keywords: Private equity, buyouts, performance, secondary buyouts * Swiss Finance Institute, Università della Svizzera italiana, Lugano. ** University of Amsterdam *** University of Oxford, Said Business School, and Oxford-Man Institute. Corresponding author. We are thankful to a number of research assistants. Degeorge acknowledges financial support from NCCR Finrisk and the Swiss Finance Institute. Phalippou acknowledges financial support from the Oxford-Man Institute. We also thank an anonymous referee, François Derrien, Rüdiger Fahlenbrach, Lily Fang (LBS Private Equity Symposium discussant), Francesco Franzoni, Luis Garicano, Yaniv Grinstein, Edith Hotchkiss, Victoria Ivashina, Tim Jenkinson, Dirk Jenter, Sébastien Michenaud, Eric Nowak, Per Östberg, Florian Peters, Alberto Plazzi, Tarun Ramadorai, Zacharias Sautner, Enrique Schroth, Per Strömberg (European Finance Association Conference discussant), Alexander Wagner, David Yermack, and seminar and conference participants at Bath, Bern, Bocconi, European Finance Association Meetings, European Finance Winter Summit, Geneva, Humboldt University, EPFL/UNIL- Lausanne, London Business School (Private Equity Symposium), Lisbon, and Porto for useful comments and feedback. We are grateful to Per Strömberg for sharing his data.
Transcript of On Secondary Buyouts - University of Oxfordeureka.sbs.ox.ac.uk/5271/1/SBO-Paper.pdf · On Secondary...

On Secondary Buyouts
Francois Degeorge*, Jens Martin**, and Ludovic Phalippou***
October 18, 2014
Abstract
Private equity firms increasingly sell companies to each other in
secondary buyouts (SBOs). We examine commonly expressed concerns
regarding SBOs using novel and unique datasets. SBOs made by buyers
under pressure to spend capital (a minority of transactions)
underperform and destroy value for investors, who then reduce their
capital allocation to private equity firms doing those transactions. Other
SBOs perform as well as other buyouts, and investors do not penalize
firms doing those. When the buyer and seller have complementary skill
sets, SBOs generate significantly higher returns and outperform other
buyouts. Investors do not pay higher total transaction costs as a result of
SBOs, even if they have a stake in both the buying fund and the selling
fund. Overall, our evidence paints a nuanced picture of SBOs.
JEL Codes: G23, G24
Keywords: Private equity, buyouts, performance, secondary buyouts
*Swiss Finance Institute, Università della Svizzera italiana, Lugano.**University of Amsterdam***University of Oxford, Said Business School, and Oxford-Man Institute. Corresponding author.
We are thankful to a number of research assistants. Degeorge acknowledges financial support from
NCCR Finrisk and the Swiss Finance Institute. Phalippou acknowledges financial support from the
Oxford-Man Institute. We also thank an anonymous referee, François Derrien, Rüdiger Fahlenbrach,
Lily Fang (LBS Private Equity Symposium discussant), Francesco Franzoni, Luis Garicano, Yaniv
Grinstein, Edith Hotchkiss, Victoria Ivashina, Tim Jenkinson, Dirk Jenter, Sébastien Michenaud, Eric
Nowak, Per Östberg, Florian Peters, Alberto Plazzi, Tarun Ramadorai, Zacharias Sautner, Enrique
Schroth, Per Strömberg (European Finance Association Conference discussant), Alexander Wagner,
David Yermack, and seminar and conference participants at Bath, Bern, Bocconi, European Finance
Association Meetings, European Finance Winter Summit, Geneva, Humboldt University, EPFL/UNIL-
Lausanne, London Business School (Private Equity Symposium), Lisbon, and Porto for useful
comments and feedback. We are grateful to Per Strömberg for sharing his data.

On Secondary Buyouts
Abstract
Private equity firms increasingly sell companies to each other in secondary buyouts (SBOs). We examine commonly expressed concerns regarding SBOs using novel and unique datasets. SBOs made by buyers under pressure to spend capital (a minority of transactions) underperform and destroy value for investors, who then reduce their capital allocation to private equity firms doing those transactions. Other SBOs perform as well as other buyouts, and investors do not penalize firms doing those. When the buyer and seller have complementary skill sets, SBOs generate significantly higher returns and outperform other buyouts. Investors do not pay higher total transaction costs as a result of SBOs, even if they have a stake in both the buying fund and the selling fund. Overall, our evidence paints a nuanced picture of SBOs.

1
Secondary buyouts (SBOs) – transactions in which a private equity firm sells a portfolio company to
another private equity firm – have evolved from a rarity in the 1990s to 40% of private equity exits in
recent years (Strömberg 2008). The rise of SBOs has elicited concerns that such transactions cannot
create value, and even that they predictably destroy value, for private equity investors (the limited
partners with stakes in private equity funds). Given that private equity (PE) funds manage about $3
trillion worldwide, it is important to empirically assess the validity of the claims made about a large
fraction of transactions in this asset class. Such is the goal of this study.
The first claim we address is that SBOs are just “pass-the-parcel” deals in which the main
motivations for the buying fund are to spend capital and collect fees. This suspicion arises from certain
distinctive features of private equity funds: they have a finite period in which to invest their capital, after
which time general partners usually earn management fees on the invested capital. Axelson et al. (2009)
note an agency conflict between general partners and investors: if the fund has excess capital near the
end of the investment period, then a general partner has an incentive to “burn money” by taking bad
deals. SBOs are plausibly a preferred investment channel for such a fund: they have lower search costs
than other buyouts (the companies owned by private equity firms are publicly known) and lower adverse
selection problems (any company present in the portfolio of another PE firm is a priori up for sale.)
A second concern is what additional value, if any, an SBO buyer can bring to the portfolio
company relative to what the first private equity owner has achieved. While it is well documented that
the buyout ownership form has staying power (Kaplan, 1991), the academic literature is largely silent on
why it would be efficient for a portfolio company to have a succession of private equity owners.
Third, investors have stakes in several private equity funds. As a result, investors may find
themselves on both the buying side and the selling side of an SBO transaction (a situation known as “LP
overlap”). Consequently, they end up owning the same asset after the transaction, but have paid large
transaction costs; some observers equate this situation to a tax on investors.

2
Our empirical analysis relies on several large datasets, some of them hand-collected. Our sample
includes 5,849 buyouts, for which we have precise returns data. Our main findings are as follows. Our
evidence is partially consistent with the money burning view of SBOs. We find that SBOs made late in
the buying fund’s investment period, when the fund is under pressure to spend capital, underperform
other buyouts, while at the same time exhibiting slightly higher risk. Controlling for a number of factors,
the Public Market Equivalent (PME) of late SBOs is about 0.3 lower on average than for comparable
buyouts. Late SBOs generate negative Net Present Value (NPV) for the limited partners invested in the
buying fund: net of fees, late SBOs return $0.88 on average when an investment in the stock market
index would have returned $1. The follow-on-funds of funds that made late SBOs are markedly smaller,
consistent with the view that the investors penalize funds that burn money: investing in late SBOs
appears to be a short-lived trick for general partners.
SBOs made early in the investment period, which represent nearly two-thirds of our sample,
perform as well as other buyout transactions, and as a result generate a positive NPV for investors,
similar to other buyout transactions. The follow-on-funds of funds that engage in SBOs early in their
investment period are not penalized by investors: they raise funds of similar size as those that do not
engage in SBOs, suggesting that investors are not dissatisfied with funds doing early SBOs.
We uncover an important source of value creation in SBOs: the presence of complementary skill
sets between the buyer and the seller. In order to identify PE firm skill sets we construct two novel
datasets on the educational backgrounds and career paths of the general partners of PE funds, as well as
on the strategies pursued by private equity firms in their portfolio companies. We collect biographical
information on the 1,978 general partners of 138 PE firms, and financial performance information on
2,137 companies owned by 121 PE firms. Using this unique detailed data, we classify PE firms as
Finance-oriented or Operations-oriented; MBA-dominated or not MBA-dominated; regional or global;
and ‘margin-grower’ or ‘sales grower.’ We find that SBO transactions between firms with

3
complementary skill sets generate significantly higher returns for buyers than SBOs between firms with
similar skills. Moreover, we find that the net-of-fees NPV of SBOs that occurred between two
complementary PE firms is large and positive. In contrast, and consistent with often expressed concerns
about SBOs, transactions between funds without complementary skill sets do not generate value for
investors.
We show that the widespread view that SBOs generate extra transaction costs for LPs on both
sides of the transaction is conceptually incorrect. Yet LP overlap has a real consequence for PE
investors: diversification across funds does not necessarily translate into diversification across assets.
Previous studies have noted some agency costs of private equity funds: Axelson et al.
(forthcoming) suggest that they use too much leverage; Gompers (1996) and Robinson and Sensoy
(2013) find that funds exit good deals too early; Lopez-de-Silanes et al. (forthcoming) find that some
funds raise too much money.
A few other contemporaneous studies examine secondary buyouts empirically and present results
that are complementary to ours. Unlike this paper, most focus on the corporate finance side of SBOs.
Wang (forthcoming), Jenkinson and Sousa (2012), and Bonini (forthcoming) find that, on average,
SBOs exhibit smaller operating performance gains than other buyout transactions. Achleitner and Figge
(2013) find low average returns for SBOs compared to other buyout transactions.
Our investigation of the money burning hypothesis is related to Arcot et al. (forthcoming). Their
work centers on predicting whether a fund under buying pressure is more likely to engage in an SBO,
while ours focuses on the determinants of performance once an SBO occurs. They document that SBOs
made under buying pressure are overpriced. Our access to returns data enables us to quantify the
underperformance, the risk, and the investor net-of-fees NPV for SBOs made under buying pressure, and
we document the reaction of investors when the next fund is being raised. We also document that the
early SBOs, which comprise a majority of SBOs, create value for investors.

4
1. Data and Descriptive Statistics
We first explain our definition of secondary buyouts and the construction of our core dataset. Then we
show some descriptive statistics outlining the differences between secondary and primary buyout
transactions.
Variable definitions We define a secondary buyout (SBO) as a deal in which a private equity (PE) firm (or a group of private
equity firms) sells the majority of shares of a company in its portfolio to another PE firm (or group of PE
firms). By implication we classify so-called tertiary buyouts, fourth buyouts, etc. as SBOs. Our
definition also implies that we exclude a number of transactions sometimes classified as SBOs in
commercial databases. Appendix 1 lists the definitions of the other variables we use in the analysis, and
Appendix 2 provides further details on our definition of a secondary buyout.
Data source In order to study the performance of SBOs, we need data on the returns obtained by PE firms on their
investments. These data are not public information and can be obtained in three ways. The first approach
is to contact PE firms individually and ask their investment returns. Part of the data used by Franzoni et
al. (2012) are obtained that way. Second, one can obtain from one or several investors the list of private
equity investments they made and the corresponding returns. This type of data were obtained by
Ljungqvist and Richardson (2003). A third way is to obtain from investors the fund raising prospectuses
they receive. These fund raising prospectuses contain the track record of prospective PE firms, i.e. the
complete set of past investments with their returns. An increasing number of studies have access to this

5
type of data (cf. Braun et al., 2013; Lopez-de-Silanes et al., forthcoming). Each of these approaches to
obtain data has its pros and cons.
Our dataset is of the third type: it comes from Placement Memorandums (PPMs) received by a
group of potential investors. While it may have the lowest selection bias of the three types of data, it has
the disadvantage that the investments made by a PE firm since the last round of fund raising are not
present in the dataset. In addition, compared to Ljungqvist and Richardson (2003), Franzoni et al. (2012)
and Braun et al. (2013), we do not have the detailed cash flows per investment, only the summary
statistics for performance: total distributed divided by total invested (Cash Multiple) and Internal Rate of
Return (IRR).
From our set of PPMs, we extract the following data: (1) the month and year in which the
investment was initiated; (2) the month and year of exit (date realized); (3) the investment’s industry; (4)
the country where the investment is located; (5) the value of equity invested (referred to below as
“investment size” in PPMs); (6) the total amount distributed (realized value); (7) the current valuation of
any unsold stake (unrealized value); (8) the total value (sum of realized and unrealized value); (9) the
multiple (total value divided by investment size); (10) the IRR; (11) the status (unrealized, partially
realized, or fully realized); and (12) the exit route (trade sale, IPO, and so on). Not all PPMs provide this
full set of information, and we use commercial databases to complement our data. Appendix 3 provides
details on this dataset.
Descriptive statistics Our sample consists of 548 SBOs, of which 467 SBOs are liquidated (and thus have return data), and
7,449 PBOs, of which 5,382 are liquidated. We know the exit route for 421 SBOs and 4,326 PBOs.
Finally, for some specifications we also require information on all the other investments made by a fund.

6
That sub-sample contains 231 SBOs and 3,240 PBOs. Appendix Table A.1 shows these statistics broken
down per year.
A natural concern is whether our sample construction leads to biases relative to other data
sources, such as the commonly used Capital IQ. Appendix Table A.2, Panel A presents descriptive
statistics on PE firms that are part of Capital IQ, but not in our dataset (98 firms), vs. PE firms that are
present in both our dataset and in Capital IQ (222 firms). To assess whether the two sub-samples differ
along certain dimensions, we run a Probit regression. The dependent variable is equal to one if the PE
firm is part of our sample, and equal to zero otherwise. Results in Table A.2 Panel B shows that only the
‘number of funds previously raised’ is always statistically significant. Given that our dataset is based on
private placement memoranda (PPM) that are sent out by firms as part of the fund raising process, it is
natural that our dataset is more likely to include firms that raised more funds. A priori the performance
spreads between PBOs and SBOs is unrelated to the number of funds previously raised by a PE firm,
which makes the ‘number of previously raised funds’ a good instrumental variable.1
Figure 1 shows the rise of SBOs to a major channel for PE exits. Throughout the 1990s SBOs
were a fairly marginal exit route. Starting in 2003 the percentage of SBOs in PE exits starts to grow
sharply (with the exception of a dip during the financial crisis) and is now around 40%. Numbers from
other datasets are consistent with this time-series (e.g. Strömberg, 2008).2
Figure 1
Table 1 compares SBOs with same-year PBOs along several dimensions. Table 1, Panel A
reports exit channels. SBOs are much less likely than PBOs to be exited through an IPO (8% vs. 21%) or
a trade sale (27% vs. 38%). SBOs are also much more likely than PBOs to be exited through an SBO
1 Another potential source of sample selection bias arises from the fact we can only measure performance on exited deals. Longer PE investments tend to be worse performers. We study differences in duration across type of SBOs in appendix Table A.3. 2 News coverage of SBOs started at about the same time as SBO exits rose. For example, The Economist published its first major article on the SBO phenomenon, entitled “Small Expectations,” in November 2004.

7
(43% vs. 20%). These differences are large, suggesting that once a company enters the SBO route, it is
relatively likely to stay there and to shun the traditional exit routes, in particular public markets. SBOs
are as likely to end in bankruptcy as PBOs.3
Table 1
Table 1, Panel B offers a first look at performance differences between SBOs and PBOs, broken
down by exit route. We observe that secondary buyouts underperform primary buyouts regardless of the
exit route. Interestingly, buyout investments that are exited via a secondary buyout exhibit strong
performance. This is true for both SBOs and PBOs.
Overall, the median and average cash multiples are markedly lower for the average SBO than for
PBOs, as are other measures of performance, such as public market equivalents and internal rates of
return. Whereas an SBO returns $2.34 for every $1 invested on average, PBOs return $2.76, i.e. 18%
more.
In Table 1, Panel C we compare a number of characteristics of SBOs versus PBOs. We first look
at the occurrence of high and low returns and find that the lower performance of SBOs results from a
smaller upside: The percentage of “home runs” (which we define as transactions with a Cash Multiple
greater than 3) is 24% for SBOs vs. 35% for PBOs; the percentage of losses (transactions with a Cash
Multiple less than 1) is identical for SBOs and PBOs, at 26%. Hence, SBOs are less likely to deliver
spectacular returns than PBOs. This finding is consistent with anecdotal evidence: The well-known
“home runs” in the buyout industry are all PBOs, not SBOs (e.g., Angel trains, Boart Longyear,
Celanese, Dr Pepper, PanAmSat, Snapple).
SBOs and PBOs differ along a few characteristics. SBOs tend to be larger and more levered
investments, are held during periods of low stock-market returns, and conducted by private equity firms
3 See Hotchkiss et al. (2011) for an analysis of bankruptcy among PE-backed firms.

8
with more experience and more diversified. In our regression analyses we include these characteristics
as control variables.
2. Are late SBOs money-burning devices?
Unused capital, known as “dry powder,” [...] could give some managers an incentive to scramble and spend money before it expires. And it may already be visible in secondary buyouts.4
Axelson et al. (2009) note that the fixed investment period of PE funds results in incentives for the
general partner to burn money at the end of the investment period: after that time, the general partner
typically earns management fees only on the invested portion of the fund’s capital. As a result, a general
partner with unspent capital near the end of the investment period (“dry powder”) faces a dilemma: if
she does not invest, she forsakes fees on the uninvested portion of the fund’s committed capital; if she
invests, she earns these fees. Moreover, raising a new fund is harder if the general partner still has a lot
of unspent capital in an existing fund. Thus, at the end of the investment period the general partner may
have an incentive to invest in deals that are not in the best interest of the limited partners.
SBOs are plausibly a preferred channel for a fund wishing to “burn money.” Consider the
options faced by a general partner with unspent capital at the end of his investment period. One option
would be to source a traditional primary buyout (PBO): buying a company from a family (or a division
from a conglomerate), or taking a public firm private. Search costs and adverse selection costs are likely
to be high in such deals, making them impractical for a general partner in a hurry to spend. Another
option would be to purchase an auctioned asset. Relative to a sourced deal, an auction reduces the search
costs, but the adverse selection problem remains if the auction seller is a family or corporation. If,
however, the auction seller is a private equity firm, as in an SBO, both search costs and adverse selection
costs are likely to be low: a buyout fund has no incentive to sell only the “lemons” in its portfolio.
4 “Private equity in rush to use ‘dry powder’”, Wall Street Journal, Heard on the Street, September 26, 2012, p. 32.

9
According to this money burning hypothesis, general partners who want to burn their capital are likely to
buy SBOs in the later part of their fund’s investment period and to overpay for such deals.
Testing the money burning hypothesis
To test the predictions of the money burning hypothesis, we construct three dummy variables: i) ‘SBO
bought late,’ which takes the value one if the transaction is an SBO that is bought in the second half of
the investment period, and is zero otherwise; ii) ‘SBO bought early,’ which takes the value one if the
transaction is an SBO that is bought in the first half of the investment period, and is zero otherwise; iii)
‘PBO bought late,’ which takes the value one if the transaction is a PBO that is bought in the second half
of the investment period, and is zero otherwise. According to the money burning hypothesis, only late
SBOs should underperform.5
Results in Table 2 show that the coefficient on “SBO bought late” is indeed negative and
statistically significant throughout our specifications. The underperformance of late buyouts is
economically large: the PME of late SBOs is lower than that of other buyouts by 0.3 or more, depending
on the specification (in our sample the median PME for PBOs is 1.29).
Importantly, specification 3 in Table 2 shows that SBOs bought early do not underperform other
buyouts. It also shows that late PBOs do not underperform, which is inconsistent with the view that the
underperformance of late SBOs is due to funds walking down their demand curve – investing first in the
most valuable deals, and acting on weaker opportunities later.
Some funds might feel under pressure to invest simply because of their vintage year, rather than
because of an agency problem. For example, imagine that shortly after a fund is raised adverse market
conditions cause investment opportunities to dry up for several years. Funds raised in this “lost vintage”
year will all face the need to deploy capital quickly if investment opportunities resume as their
5 We need to restrict the sample to deals made by funds for which we know the performance of all their other investments, and which have limited life (i.e. non evergreen funds).

10
investment period is ending. This “lost vintage” explanation of late SBO underperformance sits
somewhere between our agency story and the “walking down the demand curve” story. To rule it out we
include fund quarter-of-birth fixed effects throughout our specifications.6
Throughout the specifications, we control for investment size, club deal, and buyer
characteristics (portfolio concentration, scale and experience); Lopez-de-Silanes et al. (forthcoming)
find that these investments characteristics are related to buyout returns. We also control for several fixed
effects. Private equity firm fixed effects capture what is specific to PE firms. Return cycles are captured
by interacting industry and investment inception year fixed effects. Cross-countries differences are
controlled for both at the company level and at the fund level (by having a fund focus country fixed
effect). Finally, we construct a Mill’s ratio using the ‘number of previously raised funds’ as an
instrumental variable and the Probit regression shown in specification 6 in Appendix Table A.2 Panel B.
We add the Mill’s ratio as a control variable in specification 4, and find that the coefficient is not
statistically significant, suggesting that sample selection bias is unlikely to drive our results.
Further empirical tests for the money burning hypothesis In specification 5 we introduce the idea of “dry powder,” which we label Excess Cash. The idea is to
measure the extent to which a fund is late in spending its capital. For example, if the average fund at the
end of year three has spent 60% of the capital, then a fund that has spent only 40% is late in its spending.
A fund that has spent 70% is early and thus under much less pressure to spend capital. We capture the
normal spending rate by fitting the fraction of committed capital spent as a quadratic function of fund
age in our sample. We define Excess Cash as the difference between the cash left to be spent by the fund
at the time of investment inception (sometimes called “dry powder”) and the fitted amount of cash left to
be spent for a fund of that age. When we interact SBO bought late with Excess Cash, we find a
6 We thank an anonymous referee for suggesting this alternative explanation.
11
significantly negative coefficient, which confirms that the presence of excess cash magnifies the
underperformance of late SBOs.
In model 6 we introduce Relative Investment Size, the size of the current investment of a fund
minus the average size of all past investments made by the respective fund. Our intuition is that a fund
that is burning money would probably do larger deals in order to spend its capital more quickly. Our
results are consistent with this conjecture. When we interact SBO bought late and Relative Investment
Size, the coefficient is negative and statistically significant.
Taken together our results strongly suggest that the completion of an SBO late in the investment
period of the fund reflects behavior consistent with the money burning hypothesis.
Table 2
Importantly, however, we find that SBOs made early in the investment period, and which
represent nearly two thirds of our sample, perform as well as other buyouts. In all specifications, we
observe that the coefficient on ‘SBO bought early’ is not significantly different from zero.
3. When do second private equity owners add value in an SBO?
“Once a business has been spruced up by one owner, there should be less value to be created by the next.”7
While much research has shown how PE owners create value in ways that public owners cannot (see
Kaplan (1989) for the seminal study on this topic) the PE literature is largely silent on why one PE
owner could create value for a company that has already undergone PE ownership. The skepticism
surrounding the rise of SBOs is in part a reflection of this void. PE practitioners sometimes express the
view that SBOs can create value when the transaction takes place between funds with complementary
skill sets. We now examine this argument and study empirically whether the existence of
7 “Circular Logic”, The Economist, February 25th, 2010.

12
complementary skills between the buying PE fund and the selling PE fund is associated with more value
creation.
Complementary skills in SBOs: an example The SBO case study on Com Hem by Strömberg (2013) illustrates the role of complementary skills in
SBO value creation and motivates our empirical analysis. In June 2003, EQT, a regional private equity
firm with a focus on Scandinavia at that time, bought a Swedish cable TV company called Com Hem
from TeliaSonera. The latter had to sell Com Hem, a non-core division, due to anti-trust regulation; a
piece of information that EQT probably acquired thanks to its strong local knowledge. EQT used a
standard PE recipe: it grew the company by implementing an efficiency program and added new
services and products. EQT also strengthened the board and incentivized the existing management. Over
the two-and-a-half years of EQT ownership, EBITDA rose from SEK 53m to SEK 700m and the
company became the leading Swedish triple play operator (cable, TV, telephone).
After this increase in Ebitda, Com Hem was a much bigger company with a value of SEK 10.5
billion. At that stage, EQT needed to exit for at least two reasons: i) The PE model is one in which
companies are held for 3-5 years; ii) the company was probably a large fraction of EQT’s portfolio at
that stage, raising diversification concerns.
Com Hem was bought in December 2005 by Carlyle and Providence Equity Partners, two US-
based global PE firms with experience in multinational telecom companies. The buyers implemented a
strategy based on external growth. They acquired UPC – the second largest cable provider at that time in
Sweden – for SEK 3 billion and merged it with Com Hem. They also invested SEK 4 billion to upgrade
the network and offer new services. Given that EQT had paid SEK 1 billion for Com Hem, it seems
unlikely that EQT or any other regional PE firm at the time would have been able to spend as much as
Carlyle and Providence to expand the company.

13
Com Hem is an example of an SBO that appears to have a value-creation rationale. EQT cannot
keep the company to implement the next strategy phase and Carlyle and Providence seem to be the right
owners for the company at that stage.
Hypotheses Value creation can mean (1) the present value of the portfolio company free cash flows; (2) higher
investment returns for the buyer or the seller. The argument that complementary skills can generate
value refers to the former. In the Com Hem example, if under the ownership of Carlyle-Providence the
company’s free cash flows grow faster than comparable companies, Carlyle and Providence are said to
have added value.
We analyze three types of PE skills that can give rise to complementarities between buyer and
seller in SBOs. First, we conjecture that to increase profitability, some PE firms focus on boosting
margins in their portfolio companies (by cutting costs, increasing prices, or both) while other PE firms
specialize in growing revenues. A PE firm with a margin focus might bring value to a firm that has so
far been sponsored by a PE firm with a growth focus (and vice versa).
Second, we build on the work of Acharya et al. (2013), who find that the career path of general
partners (ex-consultants vs. ex-bankers) strongly influences the type of deals they excel at: ex-
consultants tend to outperform in internal value-creation programs, while ex-bankers do well in mergers
and acquisitions (i.e. buy-and-build strategies). From their results we conjecture that an operation-
oriented PE firm might bring value to a company that has so far been sponsored by a finance-oriented
PE firm (and vice versa).
Third, directly drawing from the Com Hem example, we distinguish between regional PE firms –
those that focus on one or two countries – and global PE firms. The idea is that a regional PE firm may
14
get a company up to speed in its home market but cannot further help it reach a multinational dimension.
To do so, it would need to change sponsor and become owned by a global PE firm instead.
Data
In order to classify PE firms as “margin growers” or “sales growers,” we assemble the list of all the
companies that went through an LBO for all of the PE firms in our sample according to Capital IQ. We
keep the sub-sample for which Capital IQ has both Ebitda and sales from year t-1 to year t+3, where t is
the year of the LBO, and we require at least two valid observations per PE firms. We obtain a sample of
2,137 companies from 121 PE firms.
For each of the 121 PE firms we compute the (‘time-series’) average growth in margin (defined
as Ebitda divided by sales) and growth in sales. In order to make margin growth and sales growth
comparable, we normalize each measure.8 We classify PE firms whose normalized average margin
growth rate is higher than its normalized average sales growth rate as ‘Margin-grower’, and other PE
firms as ‘Sales growers’. Due to the normalization, we have about as many firms classified as ‘Margin-
growers’ and as ‘Sales-growers’.
In order to measure complementarities based on professional experience and education, we
gather biographical information on the general partners of the PE firms in our sample. We primarily use
our Private Placement Memoranda because they give the names of the partners at the time the fund was
raised and typically list any partners who left, as well as their departure date. We cross check this
information with that provided in Capital IQ, Thomson, LinkedIn, and on the websites of private equity
firms.
Table 3
8 We computed a z-score of the time-series average of margin growth by subtracting the cross-sectional average and dividing by the standard deviation of the time-series average across all PE firms.

15
We have complete biographical information for 138 PE firms and their 1,978 (past and present)
General Partners. We categorize each General Partners as either Finance-oriented (for those with
experience in finance or accounting) or as Operations-oriented (for those with consulting or industry
experience) as in Acharya et al. (2013). We then classify PE firms as Finance-oriented if the majority of
their general partners were Finance-oriented at the time of the transaction, and as Operations-oriented
otherwise. In our sample, 55% of the PE firms are Finance-oriented and 45% are Operations-oriented.
In addition, and also following Acharya et al. (2013), we categorize educational backgrounds by
recording whether a general partner has an MBA degree (37% of them do). Next, we compute the
percentage of MBA holders in each PE firm. We classify a firm as MBA-dominated if its percentage of
MBA-holder is above the mean across firms, which is 43%.
To categorize PE firms as regional or global, we count the number of different countries each
firm had invested in at the time of the SBO. We classify firms that had invested in two countries or less
as regional and those that had invested in three countries or more as global. For this classification we
need to restrict ourselves to the sample for which we know the full investment history of both the buying
PE firm and the selling PE firm. We exploit this categorization of PE firms differently from the others
(margin vs. growth, finance vs. operations, MBA-dominated) in that we require the seller to be regional
and the buyer to be global, while for the other PE firm categories we only require the buyer and seller to
have different skills.
Investment returns and value creation We observe investment returns for SBO buyers and sellers, rather than excess free cash flows for the
portfolio companies. Investment returns are the result of both value creation and value sharing between
buyers and sellers. In addition to influencing value creation in portfolio companies, complementary skill

16
sets may also affect value sharing. In order to infer value gains due to complementarities from
investment returns, we need to disentangle the two effects carefully.
Most SBOs are auctioned and, for simplicity, let us assume they all are. A buyer’s reservation
price is the sum of the portfolio company’s value under its current owner (the seller) and the capitalized
performance gains brought by the buyer. As is standard in an auction setting we assume that the
transaction price is the second highest reservation price. The sharing of value between buyer and seller
crucially depends on the distribution of reservation prices. It is helpful to distinguish two polar cases:
- In the first setting, all potential buyers bring similar skills and value gains to the company. The
second highest reservation price is close to the highest reservation price, and the pricing of the SBO is
such that the seller captures most of the performance gains brought by the buyer.
- In the second setting, one potential buyer has unique skills that allow it to bring higher value
gains to the company. This buyer’s reservation price is much higher than the second highest reservation
price. The pricing of the SBO is such that the buyer and seller in the SBO share the value gains brought
by the buyer.
We argue that when the SBO buyer has skills that are complementary to those of the seller, the
transaction is more likely to be in the second setting. Complementary skills bring value to a company by
taking it on a new strategic path: for instance, turning a regional company into a global one; or shifting a
firm’s strategy from organic growth to external growth. The distribution of value gains (and hence
reservation prices) is likely to be more spread out when the winning buyer has different skills than the
seller, and the gap between the highest and the second highest reservation prices will be higher than for
deals without complementary skills. As a result, in SBO transactions with complementary skill sets the
seller is forced to share more of the future value gains with the buyer.
If we call c the value gain brought on by a buyer with complementary skills, and s the fraction of
those gains captured the seller in a deal with complementarity skill sets (s<1), then the incremental

17
investment return for the buyer from investing in a deal with complementary skills (compared to a deal
with no complementary skills) is (1-s)c. The incremental return for the seller is sc.
We infer value gains from investment returns as follows. We run a regression of buyer
investment returns on deal characteristics and a dummy variable indicating complementary skills: the
coefficient on this dummy is an estimate of (1-s)c. We run the same regression with seller investment
returns as the dependent variable: the coefficient on the dummy is an estimate of sc. The sum of these
two coefficients is an estimate of c, the value gains due to complementary skill sets.
Table 3 presents regression results of buyer returns (Panel A) and seller returns (Panel B) on deal
characteristics and dummy variables indicating the presence of complementary skill sets between buyer
and seller in the SBO. The dummy variables of interest are ‘Margin grower’ trades with ‘Sales grower’;
‘Buyer has a different educational background than seller’; ‘Buyer has a different professional
background than seller’; and ‘Regional PE firm sells to Global PE firm’.
The results of Table 3 confirm that complementarity skill sets are associated with greater value
creation in SBOs. For all the skill sets we consider and for almost all specifications, the combined
returns of buyers and sellers are much larger in the presence of complementarities. The buyer
incremental PMEs are significantly larger for SBOs with complementary skills (the incremental PME is
generally in the range of 0.5 and is statistically significant).9 Seller incremental PMEs are usually not
significantly different from zero, suggesting that buyers capture the bulk of the value they add to the
company.10
Overall, our results suggest that the presence of complementary skills strongly contributes to
value creation in SBOs.
9 In non-tabulated results we added ‘late-SBOs’ as a control variable. The sample size is reduced but ‘late-SBOs’ is and none of the above results are affected. Hence, the late SBO effect complements the effect of complementarity of skills. 10 There is one exception: the incremental returns associated with a regional PE firm selling to a global one are even higher for the seller than for the buyer. This case of complementary skill sets is special, however: companies sold by a regional PE firm to a global one are likely to have been extremely successful, and seller returns should be mechanically higher in such transactions.

18
4. Risk and investor welfare in SBOs
Are underperforming SBOs less risky? A potential explanation for the underperformance of some SBOs (late SBOs, or SBOs between PE firms
with no complementary skills) is that such transactions are less risky. Before examining this explanation
empirically, we note that there is no generally accepted method of controlling for risk in the context of
private equity. Conceptually, there is no consensus on what the right set of risk factors is, or on whether
idiosyncratic risk should be taken into account. Empirically, for non-traded assets (such as private equity
stakes) measuring risk is even more difficult because we do not observe a time-series of market values.
As a result of these difficulties, there are no standard approaches to correcting for risk in private equity
research. For example, Hochberg and Rauh (2013) state that “precise measures of risk for [their] PE
fund investment sample are not available and thus that differences in returns may in theory be due to
differences in risk profiles of investments.” Another example is Cornelli et al. (forthcoming) who use a
dummy variable for “staged” investments as a measure of risk. In the context of LBOs, however, this
measure would not be useful because deals are not staged.
It is plausible that some SBOs are less risky. For example, late SBOs might carry less risk if
funds reaching the end of their investment period prefer to invest in safer transactions, for fear of
endangering their track records, even if by doing so they sacrifice a higher upside. SBOs occurring
between two similar parties may be less risky because the buyer understands better what the seller has
done and the transition may be smoother as a result. It could also be that it is less risky to continue the
seller’s strategy than to change strategies.
Table 4 shows four sets of risk estimates: i) bankruptcy rate; ii) capital loss rate; iii) leverage;
and iv) beta. We obtain betas by regressing IRR on the contemporaneous average stock-market returns
as in Axelson et al. (2013b). The resulting slope can be interpreted as a proxy for the systematic risk for
that group of investments (we label this measure ‘unconditional beta’). In addition, we run the same

19
regression with IRR as a dependent variable but with our standard set of explanatory variables (as in
Table 2 specification 3) and add interaction effects between each of the dummy variables of interest (e.g.
‘SBO bought late’) and stock-market returns. We label the coefficient estimates on these interaction
terms ‘conditional betas.’
On each of these four dimensions of risk, we find that late SBOs are more, rather than less risky.
Late SBOs have a 12% bankruptcy rate, which is three percentage points higher than that of other
buyouts. Late SBOs have a higher propensity to lose capital (i.e. to have a Multiple below one); their
average leverage ratio is two percentage points higher than that of other buyouts; and their conditional
and unconditional betas are higher.11
We also perform two additional analyses. In a regression setting we find that late SBOs have a
higher propensity to lose capital, controlling for all of our standard control variables and adjusting for
their average underperformance (Appendix Table A3). Second, liquidity may be an important dimension
of risk in private equity. Late in a fund’s investment period, and hence relatively close to the end of the
fund’s life, general partners might be looking for targets that are more likely to be exited quickly. If
SBOs are indeed more likely to provide earlier exits, they might be more suitable investments for a fund
late in its investment schedule. This higher liquidity of SBOs might carry a price and lead to lower
returns. Results in Appendix Table A.4 shows that late SBOs are not held longer.
Similarly, SBO transactions between PE firms with complementary skill sets generally exhibit
lower risk. Overall, risk does not offer a satisfactory explanation of the performance patterns we uncover
in SBOs.12
Table 4
11 We note that, overall, buyouts made early in the fund’s life exhibit higher risk, which is consistent with what Barrot (2014) finds in venture capital. 12 The one exception involves transactions in which the buyer has a different educational background than the seller, for which some risk measures are higher.

20
Investor welfare in SBOs The underperformance of certain groups of SBOs raises the question of whether limited partners would
have been better off having the capital returned to them. The answer depends on what limited partners
would have done with the money. Our results show that if limited partners had invested it in the average
PE fund, they would have been better off. Alternatively, limited partners could have invested the
returned capital in the stock market. Following the literature, we use the S&P 500 to proxy for the stock
market and the Public Market Equivalent of Kaplan and Schoar (2005). In addition, we need to deduct
fees from our gross-of-fees performance figures. To do so, we assume that management fees are equal to
20% of investment capital. Next, we deduct 20% carried interest on funds that returned more than 1.084
(investments have an average duration of four years and 8% is the typical hurdle rate) after management
fees are taken out. Table 5 shows that buyout transactions generate PMEs above one with figures that
are virtually identical to those shown in the literature (Harris et al., forthcoming; Robinson and Sensoy,
2011) - suggesting that our assumptions on fee structure are reasonable and our sample representative.
Late SBOs appear to be negative-NPV investments; their PME averages 0.88, i.e. late SBOs
return $0.88 dollar when an investment in the stock-market index would have returned $1.13 Similarly,
SBOs between PE firms with complementary skills generate positive NPVs for investors whereas SBOs
between PE firms without complementary skills generate negative NPVs for investors.14
Table 5
Table 6
13 For late SBOs to break even we would need to assume that fees are about at half the levels reported in the literature: management fees would have to be less than 10% of capital invested and carried interest less than 10%. As far as we know from both the literature and our discussion with practitioners, there are no funds charging such low fees. This underperformance result is thus robust to assumptions on the fee structure. 14 The apparent exception involves transactions in which a regional PE firm sells to a global PE firm. The discrepancy between this finding and the Table 3, Panel A result (which reports over-performance for such transactions) is due to the inclusion of industry-time fixed effects in the regression of Table 3. This means that the regional-to-global transactions tend to happen in boom times and compared to other transactions done in boom times the regional-to-global transactions have high returns.
21
Investor reaction to late SBO underperformance
Given that late SBOs destroy value for investors, a natural question is whether investors penalize
funds accordingly through a lower participation in the next fund raising round – effectively “voting with
their feet.”15 We examine this conjecture in Table 6. We report regressions of the follow-on fund size on
the fraction of capital invested in late SBOs, early SBOs and late PBOs. A higher fraction of capital
invested in late SBOs is associated with a significantly lower follow-on fund size. The effect is large: an
increase in the fraction of capital invested by the median fund in late SBOs from zero to 10% translates
into about an expected 20% lower follow-on fund size, controlling for the size and the performance of
the fund doing late SBOs, as well as vintage year fixed effects. Importantly, consistent with the results
above, investors do not penalize funds for doing early SBOs.
The lower size of follow-on-funds of funds that did late SBOs has several possible
interpretations. Perhaps general partners, realizing the difficulty of sourcing primary buyouts, choose to
raise a smaller fund. Alternatively, dissatisfied investors penalize the private equity firm. Our data do
not allow us to disentangle these demand and supply effects. If investor dissatisfaction caused the
smaller size of follow-on funds, it could be because the fund failed to source good deals early on,
leading investors to revise down their assessment of the general partner’s quality and reduce their
demand for its funds; or investors might penalize the fund because it destroyed value in late SBOs.
If investors impose a penalty on funds doing late SBOs, this raises the question of how general
partners trade off reputational concerns against immediate financial advantage. One interpretation of our
results is that the average general partner puts a low value on reputation relative to fees. Another
interpretation is that general partners feel that forsaking capital itself entails a loss of reputation, as it
amounts to an admission that they were not able to find valuable investment opportunities.
15 We cannot run this analysis for SBO transactions between PE firms without complementary skill sets because the sample size is too small (less than 50 funds).

22
5. LP overlap in SBOs and its consequences for LPs
“Investors who back private-equity firms […] are less than happy with the rise of secondaries […] they are in essence buying firms from themselves, with hefty transaction costs […]”16
Limited partners in private equity funds are sometimes invested in both the buying fund and the selling
fund of an SBO. This situation is known as “LP overlap” and has attracted much controversy. LP
overlap has been likened to a “viral infection.”17 Limited partners who find themselves on both sides of
an SBO often complain about the fees they pay in such transactions. A common perception is that they
pay an extra layer of fees, since they end up owning the same asset after the SBO (as exemplified in the
above quote). As a result, LP overlap is one of the most contentious issues surrounding secondary
buyouts.
Transaction costs borne by limited partners in SBOs with LP overlap: an illustrative example We first illustrate the transaction costs borne by LPs with an example. In October 2010, Green Equity
Investors V bought Aspen Dental Management from Ares Corporate Opportunities Fund II in a SBO.
Table 7, Panel A provides details of the Aspen transaction. CalPERS was a limited partner in both funds.
CalPERS held a 7.5% stake in the buying fund and a 9.7% stake in the selling fund. Through its stake in
the selling fund, CalPERS indirectly sold $24 million of Aspen equity. Through its stake in the buying
fund, CalPERS indirectly bought $18.7 million of Aspen equity. For CalPERS, the gross transaction was
the sum of its sale ($24 million) and purchase ($18.7 million) of equity in Aspen – a total of $42.7
million. Since CalPERS was both on the buying and on the selling side, the net Aspen transaction for
CalPERS was the difference between the sale and the purchase – a reduction of its Aspen equity stake
by $5.3 million. This discrepancy between the net transaction and the gross transaction is characteristic
of SBOs with LP overlap and causes much of the controversy surrounding SBOs because transaction
16 “Buy-in Barons”, The Economist, January 18th, 2014. 17 Canderle, Sebastien (2011). Private Equity’s Public Distress (Kindle Locations 2113-2114).

23
fees paid in practice are a proportion of the gross transaction amount and not of the net transaction
amount.
CalPERS paid fees on both sides of the transaction. From practitioner interviews that we
conducted, we obtained the following estimates of transaction costs in buyouts: Financial advisory is a
flat fee of $2-4 million plus 1% of the enterprise value (i.e. debt value plus equity value) to be paid by
both the buyer and the seller. Legal advisory amounts to $1-3 million, also to be paid by both the buyer
and the seller. The buyer needs to carry some additional due diligence, which tends to be a fixed cost of
about $1 million. Finally, the buyer needs to arrange loans with a bank (or a consortium of investors);
the cost of this lending arrangement is typically 2% of the amount borrowed.
Applying these estimates of transaction fees to the Aspen SBO, we estimate the total buyer fees
at $15 million, and the total seller fees at $10 million. Given CalPERS’s stakes in the buying and selling
funds, these estimates imply that its share of transaction costs in the Aspen SBO was about $2.1 million
(7.5% of $15 million plus 9.7% of $10 million). As a percentage of CalPERS’s gross Aspen transaction,
the fees paid by CalPERS amount to about 4.9% (2.1/42.7). But as a percentage of CalPERS’s net Aspen
transaction, its fees are a staggering 40% (2.1/5.3).
CalPERS was not the only limited partner on both sides of the Aspen Dental SBO. Pitchbook
reports eight other limited partners in the same situation. Table 7, Panel B reports the estimated
transaction fees paid by each, as well as their net transaction. As a percentage of their net transaction, the
transaction fees paid by limited partners with LP overlap in Aspen range from 6% to 66%, with a
median of 10% and a mean of 22%. On this evidence, it appears that the worries often expressed by LPs
about LP overlap in SBOs are justified: those limited partners subject to LP overlap in SBOs pay two
rounds of transaction fees, and transaction fees are large relative to the net transaction.
Table 7

24
The counterfactual: what transaction costs would limited partners have borne in alternative transactions? The evidence above begs the question: what is the counterfactual? What transaction costs would limited
partners have borne if the funds had engaged in other transactions, instead of doing an SBO with LP
overlap?
Returning to the Aspen example, there could have been two possible alternatives to the SBO
with LP overlap:
(a) Ares (the selling fund) could have kept its stake in Aspen instead of selling it;
(b) Ares could have sold its stake in other forms of exits.
Case (a): if Ares had refrained from selling Aspen, CalPERS would have saved on the
transaction cost of the exit. Note, however, that these savings would have been only temporary. Ares,
like almost all private equity funds, is structured as a finite-life entity, and would have eventually sold its
Aspen stake. At that time, CalPERS would have paid the transaction cost on the sale.
If Ares had kept its stake in Aspen instead of selling it to Green, CalPERS would also have saved
the transaction cost it paid as an investor in the buying fund (Green). But eventually, at some point
before the end of its investment period Green would have to invest the capital that it did not invest in
Aspen. When that happened, CalPERS would have had to pay the buying fund’s transaction cost.
Ultimately, if Ares had kept is stake in Aspen, CalPERS would not really have saved on
transaction costs: it would only have postponed them.
Case (b): if Ares had sold its stake in Aspen in a different transaction than an SBO with LP
overlap, CalPERS would not have saved on the exit transaction costs relative to the Aspen SBO:
whether the exit was through a trade sale, an IPO, or a SBO with no LP overlap, Ares would have paid
the transaction costs of selling, and CalPERS would have borne its share of them.

25
In this scenario, CalPERS would not have paid transaction costs on the buying side. However,
just as in case (a), Green would eventually have invested its capital in some other target company, and
CalPERS would have paid the buyer’s transaction cost on that purchase.
Thus, the analysis of possible counterfactual transactions suggests that an SBO with LP overlap
does not generate extra transaction costs for limited partners subject to LP overlap in the SBO.
Alternative transactions would only lead to a temporary postponement of transaction costs for the
limited partners. Regardless of the transaction chosen, for any portfolio company that a fund invests in, a
limited partner pays two rounds of transaction costs: one at entry and one at exit.
An actual consequence for limited partners of LP overlap in SBOs
LP overlap in SBOs does have a consequence for the LPs involved. LP overlap reduces the net
transaction achieved by LPs in SBOs. Because of LP overlap, diversification across funds does not
necessarily translate into diversification across assets.
We illustrate this point by computing the ratio of net transaction to gross transaction for
CalPERS in the Aspen SBO. We define net transaction as the absolute value of the difference between
the equity stakes indirectly bought and sold by the LP in the SBO. We define gross transaction as the
sum of the equity stakes indirectly bought and sold by the LP in the SBO. The net-to-gross transaction
ratio is the net transaction divided by the gross transaction. By construction limited partners not subject
to LP overlap in SBOs have a net-to-gross transaction ratio of 100%. The net-to-gross transaction ratio
for CalPERS was only 12.4%.
The extent of LP overlap in SBOs Private equity is now a major asset class for large institutional investors, who often have stakes in many
private equity funds Sensoy et al. (forthcoming). For those large investors, LP overlap appears likely. To
assess this likelihood, we obtain LP commitment information for companies involved in 114 SBOs from

26
the Pitchbook database. For these deals we either know the equity portion, or infer it by assuming an
equity portion of 40% (the median equity percentage in the SBO for which we know the equity portion).
Of these 114 SBOs, 76 SBOs had no LP overlap and 38 had LP overlap. We count 107 cases of SBOs
with some LP overlap. We measure the extent of LP overlap by calculating the number of SBOs in
which the limited partner is invested in both the buying and the selling side, divided by the number of
SBOs in which the limited partner is invested in selling side: this “LP overlap ratio” represents the
probability of LP overlap, conditional on the limited partner being on the selling side of an SBO.
Figure 2 reports the distribution of the LP overlap ratio broken down by the number of limited
partners’ private equity commitments. Limited partners invested in few funds mechanically have zero or
low LP overlap ratios. For limited partners invested in more than 20 funds, we find a median LP overlap
ratio of 17%. While the claims of a LP overlap “viral infection” may be overstated, LP overlap occurs
with significant frequency for large private equity investors.
Figure 2
Conclusion
SBOs have become a large share of private equity transactions. The growth of SBOs has given rise to
three major questions: (a) are SBOs money burning devices for general partners reaching their deadline
for investing committed capital? (b) what value can a new private equity owner add that the previous
private equity owner has not added? (c) when limited partners are in invested in both the buying side and
the selling side of an SBO, do they pay an extra layer of transaction costs?
We construct several unique datasets to investigate these questions. We find that on average
SBOs made close to the investment deadline underperform, are riskier, and destroy value for investors.
Investors appear to penalize PE firms that made late SBOs: the follow-on-funds of funds that did late
SBOs are markedly smaller.
27
We uncover an important source of value creation in SBOs: complementary skill sets between
the buyer and the seller. SBOs perform better, and create value for investors, when they occur between a
PE firm focusing on margin growth and a PE firm focusing on sales growth, or between two PE firms in
which the general partners have different educational backgrounds or career paths. SBOs also create
value when a global fund buys from a regional fund.
Finally, we show that even when a limited partner is on both sides of an SBO, the transaction
does not generate extra transaction costs for investors, contrary to a widespread view. Yet LP overlap
does have real consequences for investors: diversification across funds does not necessarily translate into
diversification across assets.
While our results on complementary skills indicate that the potential for value creation in SBOs
is real, our results on money burning suggest that the finite invest period of PE funds has negative
consequences for PE investors, begging the question of why PE funds are structured as finite-life
entities. Historically, the first private equity funds were organized as closed end funds. This structure
was largely abandoned in favor of finite life limited partnerships in the 1970s (Lerner and Schoar, 2004).
Axelson et al. (2009) show some benefits of PE fund institutional features. Our results reveal some
costs.
It is tempting to speculate on whether changes to standard PE contractual arrangements – for
example contractual caps on the percentage of a fund that a general partner may invest in late SBOs –
might improve limited partners’ welfare. A detailed discussion of whether such caps would result in a
superior contract overall is beyond the scope of this paper. We note a possible cost of caps on late SBOs:
they would needlessly penalize funds raised just before market conditions worsen and investment
opportunities dry up (funds in “lost vintages”). Caps may also be unnecessary, as investors appear to
penalize PE firms that engage in late SBOs by reducing their participation in future fund raisings by the
same PE firm. Overall, our findings paint a nuanced picture of SBOs.

28
References
Acharya, V. V., Gottschalg, O.F., Hahn, M., Kehoe, C., 2013. Corporate Governance and Value
Creation: Evidence from Private Equity. Review of Financial Studies 26, 368–402.
Achleitner, A.-K., Figge, C., 2013. Private Equity Lemons? Evidence on Value Creation in Secondary
Buyouts. European Financial Management.
Arcot, S., Fluck, Z., Gaspar, J.-M., Hege, U., 2014. Fund Managers Under Pressure: Rationale and
Determinants of Secondary Buyouts. Journal of Financial Economics, forthcoming.
Axelson, U., Jenkinson, T., Weisbach, M.S., Strömberg, P.J., 2013a. Borrow Cheap, Buy High? The
Determinants of Leverage and Pricing in Buyouts. Journal of Finance, forthcoming.
Axelson, U., Strömberg, P., Sorensen, M., 2013b. The Alpha and Beta of Private Equity. Unpublished
working paper, SIFR.
Axelson, U., Strömberg, P.J., Weisbach, M.S., 2009. Why Are Buyouts Levered? The Financial
Structure of Private Equity Funds. Journal of Finance 64, 1549–1582.
Barrot, J.-N., 2014. Investment Horizon and the Life Cycle of Innovative Firms: Evidence from Venture
Capital. Unpublished working paper. MIT.
Bonini, S., 2014. Secondary Buyouts. Financial Management, forthcoming.
Braun, R., Jenkinson, T., Stoff, I., 2013. How Persistent is Private Equity Performance? Evidence from
Deal-Level Data. Unpublished working paper. Said Buiness School, University of Oxford.

29
Cornelli, F., Kominek, Z.W., Ljungqvist, A., 2013. Monitoring Managers: Does it Matter? Journal of
Finance, forthcoming.
Franzoni, F., Nowak, E., Phalippou, L., 2012. Private Equity Performance and Liquidity Risk. Journal of
Finance 67, 2341–2373.
Gompers, P.A., 1996. Grandstanding in the venture capital industry. Journal of Financial Economics 42,
133–156.
Harris, R.S., Jenkinson, T., Kaplan, S.N., 2013. Private Equity Performance: What Do We Know?
Journal of Finance, forthcoming.
Hochberg, Y. V., Rauh, J.D., 2013. Local Overweighting and Underperformance: Evidence from
Limited Partner Private Equity Investments. Review of Financial Studies 26, 403–451.
Hotchkiss, E.S., Strömberg, P.J., Smith, D.C., 2011. Private Equity and the Resolution of Financial
Distress. Unpublished working paper. SIFR.
Jenkinson, T., Sousa, M., 2012. Keep taking the private equity medicine? Working paper Said Business
School, University of Oxford.
Kaplan, S.N., 1989. The effect of management buyouts on operating performance and value. Journal of
Financial Economics 24, 217–254.
Kaplan, S.N., 1991. The staying power of leveraged buyouts. Journal of Financial Economics 29, 287–
313.

30
Kaplan, S.N., Schoar, A., 2005. Private Equity Performance: Returns, Persistence, and Capital Flows.
Journal of Finance 60, 1791–1823.
Lerner, J., Schoar, A., 2004. The illiquidity puzzle: theory and evidence from private equity. Journal of
Financial Economics 72, 3–40.
Ljungqvist, A., Richardson, M., 2003. The Investment Behavior of Private Equity Fund Managers.
Unpublished working paper. NYU.
Lopez-de-Silanes, F., Phalippou, L., Gottschalg, O., 2013. Giants at the Gate: On the Cross-section of
Private Equity Investment Returns. Journal of Financial & Quantitative Analysis, forthcoming.
Robinson, D.T., Sensoy, B.A., 2011. Cyclicality, Performance Measurement, and Cash Flow Liquidity
in Private Equity. NBER Working Paper No. 17428.
Robinson, D.T., Sensoy, B.A., 2013. Do Private Equity Fund Managers Earn Their Fees? Compensation,
Ownership, and Cash Flow Performance. Review of Finacial Studies 26, 2760–2797.
Sensoy, B.A., Wang, Y., Weisbach, M.S., 2013. Limited Partner Performance and the Maturing of the
Private Equity Industry. Journal of Financial Economics, forthcoming.
Strömberg, P., 2008. The new demography of private equity. Unpublished working paper. SIFR.
Strömberg, P., 2013. Exiting Com Hem. Case study. SIFR.
Wang, Y., 2013. Secondary Buyouts : Why Buy and at What Price? Journal of Corporate Finance,
forthcoming.

31

32
Appendix 1: Variable Description
Background is Finance-dominated: More than 50% of General Partners in a PE firm have worked in finance or accounting. Background is MBA-dominated: PE firm has a higher percentage of General Partners with a MBA degree than the average PE firm. Buyer (seller) has a different professional background than seller (buyer): Buyer (seller) background is Finance-dominated and seller (buyer) background is MBA-dominated, or vice versa. Buyer/Seller Experience: (Natural logarithm of the) number of investments made by the PE firm as of the focal investment inception date. Buyer/Seller Portfolio Concentration: Value-weighted Herfindhal index based on the 48 Fama-French industries of the investments held by the PE firm at the same time as the focal investment. Buyer/Seller Scale (NIP): (Natural logarithm of the) number of investments held by the PE firm at the same time as the focal investment. This variable is called (Number of Investment held in Parallel; or NIP) in Lopez-de-Silanes et al. (forthcoming). Company Country fixed effects: Fixed effects based on the country of the investment’s location. The information sources for the country of the investment are the PPM (34%), the websites of PE firms (30%), the Thomson database (33%), and the Capital IQ database (3%). Duration: Number of years between the investment initiation date and the investment (final) exit. Excess Cash: We fit the fraction of committed capital spent as a quadratic function of fund age in our sample of funds. Excess cash is the difference between the cash left to be spent by the fund at the time of investment inception and the “fitted” amount of cash left to be spent for a fund of that age. The average speed of cash spending in our dataset is similar to that in other datasets (e.g. Robinson and Sensoy, 2011). Fund Age: Number of years between investment inception date and date of the first investment. Fund birth quarter fixed effects: Fixed effects based on the quarter when the fund made its first investment. Fund Country fixed effects: Fixed effects based on the country in which a fund is located. Fund size: Sum of investment size across fund investments. Inverse Mill’s ratio: Correction for potential sample selection bias. See Table 2 for the underlying data and Probit regressions. Investment: An investment includes all “add-on” acquisitions and divestments made by the company while held by the PE firm. Debt-only and public equity investments are excluded.

33
Investment size: Total cash invested by the fund into the focal investment converted into 2010 U.S. dollars. It should in principle include any cash transfer from the fund to the portfolio company, including loans. IRR: Internal rate of return. If missing, it is interpolated by Multiple^(1/duration)-1. This is from the fund perspective and thus is gross of fees, is computed in the currency originally used in the PPM to report performance, and should in principle include any cash transfer from the fund to/from the portfolio company, including loans. Margin (sales) grower: A margin (sales) grower is defined as a PE firm whose normalized average margin (sales) growth rate of their portfolio companies is higher than its normalized average sales (margin) growth rate. The margin (sales) growth rate is defined as the time-series average of margin (sales) growth of the portfolio company subtracted by the cross-sectional average margin (sales) growth and divided by the standard deviation (of the time-series average across all PE firms). The margin (sales) growth rate of a portfolio company is the change in Ebitda (sales) from year t-1 to year t+3, where t is the year of the LBO. Source: Capital IQ. Multiple: Ratio of total cash received from the investment plus its current valuation (if partially liquidated) to the total cash invested. This is from the fund perspective and thus is gross of fees, is computed in the currency originally used in the PPM to report performance, and should in principle include any cash transfer from the fund to/from the portfolio company, including loans. PE firm: Private equity firm and defined as any organization that undertakes buyout investments via funds that it advises. Firms that specialize in other private equity assets such as venture capital, timber, infrastructure, land, real estate, or mezzanine are all excluded. PME: Public market equivalent. The ratio of the present value of dividends to the present value of the amount invested. To calculate this measure, we assume that the full amount of the investment is made at the investment initiation date and that all of the distributions take place at the (final) exit date. To discount the cash flows, we use CRSP equally weighted return series. The cash flows are taken from the fund perspective and thus is gross of fees, and is computed in the currency originally used in the PPM to report performance. It should in principle include any cash transfer from the fund to/from the portfolio company, including loans. Regional (Global) PE firm: A PE firm investing into companies located in up to two (more than two) different countries up to the SBO. Relative investment size: Investment size divided by fund size. SBO, SBO/PBO bought late (early): Secondary buyout is defined in appendix 2. A secondary or primary buyout is late (early) if it is made when the fund is older (younger) than 2.5 years. Year x Industry fixed effects: Fixed effects based on both the year of investment inception and the industry of the investment. The industries are manually assigned to one of the 48 Fama-French industry classifications using their SIC codes or their would-be SIC codes (based on the information in siccode.com).
34
Appendix 2: Definition of a secondary buyout A secondary buyout (SBO) is a transaction in which a private equity (PE) firm or a group of private equity firms sell (in total) the majority of the shares of a company to another private equity firm or group of private equity firms. This definition means that the following type of transactions that commercial databases often list as SBOs are excluded from our sample:
Trade sale to a PE-owned company: A PE firm sells its portfolio company to the portfolio company of a PE-owned company. We classify such deals as a trade sale. For example, in April 2007, the PE firms American Capital, Caterton Partners, and KRG Capital Partners sold their portfolio company Case Logic to Thule, a Swedish manufacturer of load carriers for cars. Pitchbook, for instance, categorizes this deal as an SBO, because the PE firm Candover owned Thule at the time of the deal. In contrast, we categorize this deal as a trade sale. In May 2007, Candover subsequently sold Thule to Nordic Capital. This deal constitutes a majority transaction of a portfolio company between two PE firms. Hence we label that deal an SBO.
Similarly, the PE firm Riverside bought FLA Orthopedics from the PE firm Canaan Partners in April 2004. In 2007, Riverside sold FLA Orthopedics to BSN Medical, which is owned by the PE firm Montagu. Pitchbook defines both deal as SBOs. In contrast we define the first deal as an SBO and the second one as a trade sale.
IPO then Secondary: If a PE firm partially exits its portfolio company via an IPO and the remaining shares are sold to a PE firm, then we consider that transaction an SBO if the stake sold post-IPO is a majority stake. For example, the PE firm JL Partners took Builder First Source public in June 2005. Pitchbook, for instance, states that Builder First Source was exited via an IPO. However, JL Partners kept a 52% majority stake, which it sold in February 2006, after the expiration of the lockup period, to Warburg Pincus Equity. We thus label this deal an SBO.
Secondary block: Transactions in which a PE firm buys a minority stake of a portfolio company from another PE firm are not considered SBOs. For example, the PE firm Triton sold 20% of Tetra GmbH to AXA Private Equity. Another example is the transaction of Segur Iberia, a Spanish company specializing in guarding services and alarm systems. The PE firm Corpfin Capital went with N+1 Private Equity in a club deal to buy Segur Iberia from the PE firm 3i. In a follow-up deal, Corpfin Capital bought the minority stake of N+1 Private Equity. Here, a minority block was sold, and the buyer was already invested in the company. Pitchbook categorized this transaction as an SBO but we do not.
35
Appendix 3: PPM data We assembled the data by collecting fund-raising prospectuses, usually referred to as private placement memorandums (PPMs). PPMs contain the performance and characteristics of all prior investments made by the firm. Private equity (PE) firms are organizations that manage private equity funds. A firm may have several funds running at each point in time. Funds have a finite lifetime lasting 10 to 14 years. The typical firm launches a new fund every two to four years. When a firm raises a new fund, it gives a fund raising prospectus to potential investors. Investors commit capital at fund inception and cannot add or withdraw capital during the fund’s life. Several investors gave us access to their prospectuses, but under signed confidentiality agreements which bar us from disclosing information about the identity of the PE firms or their investments.
Lopez de Silanes et al. (forthcoming) use the same dataset and show that this dataset has overall similar coverage as the two most comprehensive publicly available PE datasets: Capital IQ and Thomson Reuters. Although these commercial databases keep track of the industry, country, and initiation date of the investments, they do not contain performance information, which is available for our sample. Yet, given the nature of our data source, our coverage is much better before 2000 than it is in more recent years.
There may be a concern that some PE firms show a selected track record but do not say so. To assess this potential problem, we first went to the databases of Thomson and Capital IQ and verified that all the investments reported for each of our PE firms in those databases were also in our dataset. We find it to be the case. Second, we read the legal disclaimers of our PPMs. The typical PPM disclaimer states that the fund has “taken all reasonable care to ensure that the facts stated in the Memorandum are true and accurate in all material respects and there are no other facts, the omission of which would make misleading any statement in the Memoranda, whether of fact or of opinion. The General Partner accepts responsibility accordingly.” Typically, the firm is only exempted from liability for estimates of economic trends, projected performance, forward-looking statements, and economic and market information prepared by third parties. Third, we mentioned this concern to the investors who provided us with the PPM and to industry lawyers. They dismissed the concern, arguing that the legal disclaimer limiting the responsibility of the firm applies in practice only to forecasts and that a PE firm misrepresenting its past investment record could be sued. They also pointed out to us that, unlike hedge fund investors, PE investors know the investments made by the firm because investors are asked to provide capital for each investment separately and they receive audited annual reports containing the list of investments. Finally, they argued that new investors generally ask old investors about their experience with the PE firm. In these circumstances, excluding past investments from the PPM could cause great damage to the firm.

35
Table 1: Characteristics of primary versus secondary buyouts
This table compares the characteristics of the sample of primary buyouts (PBOs) to that of the sample of secondary buyouts (SBOs). PBOs are investments in companies purchased from an entity other than a private equity fund (e.g. family, conglomerate); SBOs are buyout investments that are not PBOs (i.e. includes tertiary). Panel A shows the percentage of investments (equally weighted) that are exited via IPO, trade sale, bankruptcy, secondary buyout (SBO), and other routes (e.g. sale to management). Panel B shows the median and mean performance in each sample broken down by exit route. Multiple is the total amount received by the fund divided by total amount invested by the fund. The other two performance measures are the Public Market Equivalent (PME) and the Internal Rate of Return (IRR). Panel C compares the mean of several variables in the two samples. The sample is restricted to investments for which we know the exit route, and it is further restricted to those for which we know performance when we compute performance statistics. Variable definitions are listed in Appendix 1. a significant at 1%; b significant at 5%; c significant at 10%.
Panel A: Comparing exit status Entry channel PBOs SBOs Difference z-stat Exit route IPO 0.21 0.08 0.12c 1.82 Trade sale 0.38 0.27 0.11b 2.41 Bankruptcy 0.18 0.19 -0.01 -0.25 SBO 0.20 0.43 -0.23a -6.63 Other exit route 0.03 0.03 0.00 -0.02

36
Panel B: Descriptive statistics on performance Number of Median Mean observations Multiple PME IRR Multiple PME IRR Primary Buyout (PBO) Exit routes
IPO 900 3.24 1.91 0.43 4.09 2.68 0.72 Trade sale 1650 2.42 1.49 0.33 3.00 1.92 0.53 Bankruptcy 793 0.00 0.00 -1.00 0.32 0.21 -0.77 SBO 874 2.65 1.47 0.31 3.15 1.89 0.46 Other exit routes 109 2.09 1.13 0.22 2.62 1.55 0.23 All observations 4326 2.20 1.29 0.27 2.76 1.75 0.31 Secondary Buyout (SBO) Exit routes IPO 35 2.61 2.00 0.36 3.62 2.53 0.44 Trade sale 113 2.30 1.63 0.30 2.72 1.97 0.46 Bankruptcy 82 0.00 0.00 -1.00 0.15 0.12 -0.83 SBO 180 2.57 1.51 0.28 2.85 1.84 0.35 Other exit routes 11 2.00 1.14 0.24 2.52 1.24 0.22 All observations 421 2.03 1.25 0.22 2.34 1.58 0.15
Panel C: Comparing SBO and PBO mean characteristics Entry channel PBOs SBOs Difference t-stat Home run (Multiple > 3) 0.35 0.24 0.10a 4.31 Losses (Multiple < 1) 0.26 0.26 -0.00 -0.10 Duration 4.38 4.41 -0.03 -0.27 Investment Size ($ million) 49.53 70.34 -20.82a -5.59 Leverage 0.66 0.67 -0.00 -0.52 Stock-market Return (annual) 0.16 0.13 0.03a 6.81 Buyer Portfolio Concentration 0.18 0.17 0.02a 2.59 Buyer Scale (NIP) 37.18 34.85 2.33 1.06 Buyer Experience ($ billion) 1.66 2.64 -0.98a -5.43

37
Table 2: Performance of secondary buyouts and buyer fund characteristics
This table shows the estimates of OLS regressions. Dependent variable is the buyer’s Public Market Equivalent (PME). A buyout is bought late (early) if it is made when the fund is older (younger) than 2.5 years. The sample is restricted to transactions for which we know the performance of all the transactions made by the fund. Other control variables are: investment size, club deal, buyer portfolio concentration, scale and experience. All variable definitions are in Appendix 1. t-statistics reported in italics below each coefficient are based on standard errors clustered by both investment inception year and private equity firms.
Spec 1 Spec 2 Spec 3 Spec 4 Spec 5 Spec 6
SBO bought late -0.47a -0.52a -0.41a -0.48a -0.39a -0.36b
-3.35 -3.78 -2.90 -3.47 -2.81 -2.52
SBO bought early
-0.07 0.01 -0.07 -0.05
-0.47 0.06 -0.44 -0.30
PBO bought late
0.32a 0.37a 0.33a 0.32a
4.13 4.15 4.13 4.13
Mill’s ratio 0.69 1.01 Excess cash 0.12 0.49 SBO bought late -1.25c * Excess cash -1.93 SBO bought early 0.06 * Excess cash 0.10 PBO bought late 0.03 * Excess cash 0.08 Relative investment Size
0.04
0.34
SBO bought late Size
-0.51b * Relative investment
-2.13
SBO bought early
-0.35 * Relative investment
-1.16
PBO bought late
-0.33c * Relative investment
-1.78
Other control variables Yes Yes Yes Yes Yes Yes Fixed effects: Buyer firm Yes No No No No No Fund birth quarter Yes Yes Yes Yes Yes Yes Fund country Yes Yes Yes Yes Yes Yes Company country Yes Yes Yes Yes Yes Yes Year x Industry Yes Yes Yes Yes Yes Yes Adjusted R-square 8.83 7.18 7.71 8.41 7.65 7.75 Number of observations 3471 3471 3471 2819 3471 3471 a significant at 1%; b significant at 5%; c significant at 10%.
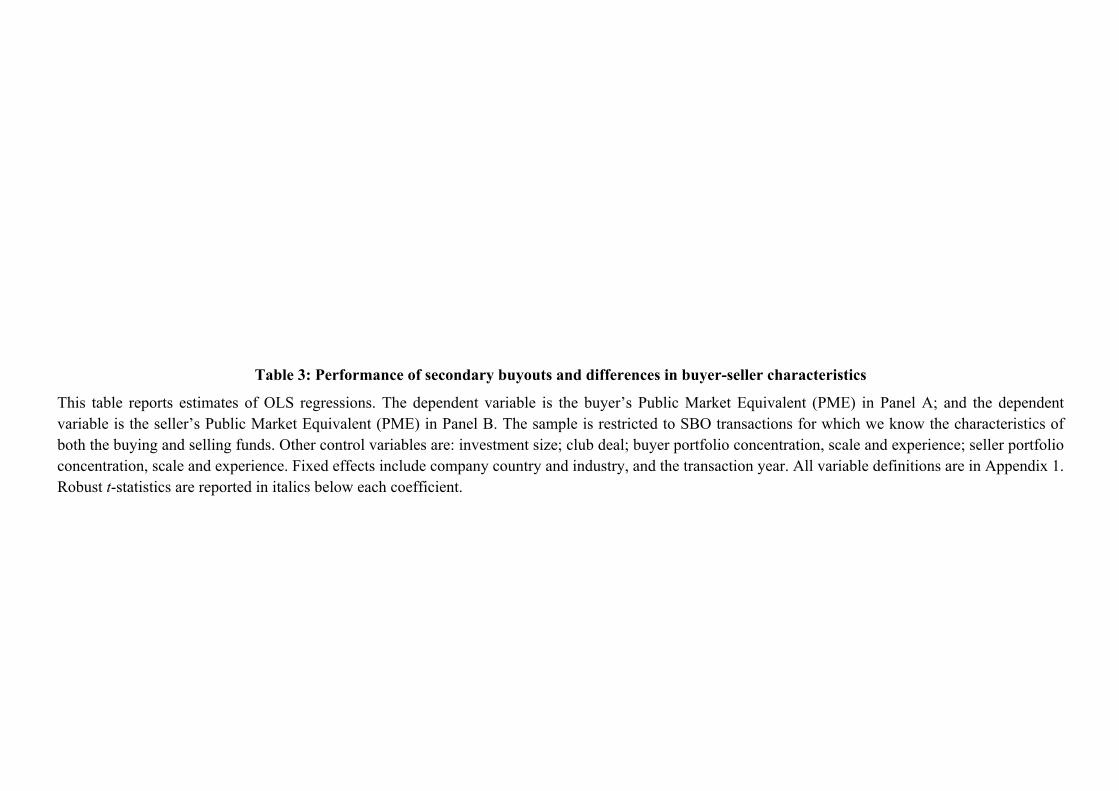
38
Table 3: Performance of secondary buyouts and differences in buyer-seller characteristics
This table reports estimates of OLS regressions. The dependent variable is the buyer’s Public Market Equivalent (PME) in Panel A; and the dependent variable is the seller’s Public Market Equivalent (PME) in Panel B. The sample is restricted to SBO transactions for which we know the characteristics of both the buying and selling funds. Other control variables are: investment size; club deal; buyer portfolio concentration, scale and experience; seller portfolio concentration, scale and experience. Fixed effects include company country and industry, and the transaction year. All variable definitions are in Appendix 1. Robust t-statistics are reported in italics below each coefficient.

39
Panel A: Buyer returns
Spec 1 Spec 2 Spec 3 Spec 4 Spec 5 Spec 6 Spec 7 Spec 8 Spec 9
Regional PE firm sells to Global PE firm 0.85a 0.61b 1.54a 2.75 2.31 4.12 Buyer is a Global PE firm -0.05a 0.00 0.00 -2.93 -0.12 0.11 Seller is a Global PE firm -0.01 -0.03 0.03c -0.38 -1.13 1.74 ‘Margin grower’ trades with a ‘Sales grower’ 0.46a 0.61a 0.80a 3.37 2.80 4.03 Buyer is a ‘Margin grower’ -0.69a -0.29 -0.07 -3.41 -1.12 -0.26 Seller is a ‘Margin grower’ -0.27 -0.09 0.27 -1.42 -0.43 1.17 Buyer has a different professional background than seller 0.59a 0.55a 0.98a 3.06 2.69 5.39 Buyer’s professional background is Finance-dominated -0.03 0.15 0.23 -0.17 0.73 1.07 Seller’s professional background is Finance-dominated 0.15 0.15 0.71a 0.74 0.77 3.63 Buyer has a different educational background than seller 0.63a 0.47b -0.01 2.84 2.28 -0.05 Buyer’s educational background is MBA-dominated -0.30c -0.25 -0.82a -1.65 -1.25 -3.12 Seller’s educational background is MBA-dominated -0.65a -0.75a -0.49c -2.80 -3.11 -1.85 All fixed effects included? Yes Yes Yes Yes Yes Yes Yes Yes Yes All other buyer and seller characteristics included? No No No No Yes Yes Yes Yes Yes Adjusted R-square 9.37 28.80 9.37 6.29 19.08 37.08 30.41 24.31 47.65 Number of observations 149 151 166 172 149 95 120 125 81 a significant at 1%; b significant at 5%; c significant at 10%.

40
Panel B: Seller returns
Spec 1 Spec 2 Spec 3 Spec 4 Spec 5 Spec 6 Spec 7 Spec 8 Spec 9
Regional PE firm sells to Global PE firm 1.25b 1.23b 2.58a 2.35 2.54 3.18 Buyer is a Global PE firm -0.02 0.03 0.14a -0.68 0.90 4.05 Seller is a Global PE firm 0.02 0.03 0.04c 0.81 0.86 1.90 ‘Margin grower’ trades with a ‘Sales grower’ -0.84 0.12 0.24 -0.25 0.39 0.81 Buyer is a ‘Margin grower’ 4.49 -0.71c -1.58a 0.98 -1.87 -3.07 Seller is a ‘Margin grower’ 3.57 -0.05 -0.12 0.91 -0.13 -0.40 Buyer has a different professional background than seller -0.27 -0.05 -0.34 -0.11 -0.13 -1.22 Buyer’s professional background is Finance-dominated 2.34 0.64c 0.87a 0.79 1.67 2.59 Seller’s professional background is Finance-dominated -1.24 0.35 0.93a -0.38 1.13 3.12 Buyer has a different educational background than seller 0.65 -0.25 -0.66 0.23 -0.52 -1.22 Buyer’s educational background is MBA-dominated 4.84c -0.37 -0.54 1.67 -0.84 -1.15 Seller’s educational background is MBA-dominated -7.04b -0.89c -0.38 -2.01 -1.78 -0.83 All fixed effects included? Yes Yes Yes Yes Yes Yes Yes Yes Yes All other buyer and seller characteristics included? No No No No Yes Yes Yes Yes No Adjusted R-square 5.96 -7.39 10.70 13.87 19.25 17.05 8.45 10.51 41.13 Number of observations 149 151 166 172 128 81 101 105 81 a significant at 1%; b significant at 5%; c significant at 10%.

41
Table 4: Risk of different type of PBOs and SBOs
This table shows statistics pertaining to risk measures: i) the fraction of the investments that are bankrupt; ii) the fraction of the investments that result in a capital loss; iii) leverage (debt divided by total enterprise value); iv) a conditional and unconditional estimate of Beta. Probability of
Leverage Beta
bankruptcy capital loss Unconditional Conditional SBO bought late 12% 28% 65% 1.67 1.85 SBO bought early 10% 20% 67% 2.34 2.41 PBO bought early 10% 27% 64% 1.49 1.47 PBO bought late 8% 22% 62% 1.42 1.41
SBO bought late Minus Other buyouts 3% 3% 2% 0.15 0.36 Regional PE firm sells to Global PE firm 18% 27% 75% 2.05 1.51 Not a regional PE firm selling to a Global PE firm 13% 26% 71% 1.93 1.86 ‘Margin grower’ trades with a ‘Sales grower’ 12% 20% 70% 1.89 1.89 ‘Margin grower’ does not trade with a ‘Sales grower’ 13% 28% 68% 2.74 2.76 Buyer has a different professional background than seller 7% 21% 70% 0.79 0.81 Buyer has the same professional background as seller 18% 29% 70% 2.61 2.69 Buyer has a different educational background than seller 0% 8% 67% 2.03 2.05 Buyer has a the same educational background as seller 20% 36% 73% 1.52 1.74

42
Table 5: NPV of different type of PBOs and SBOs
This table shows statistics pertaining to investors’ aggregate performance for different types of SBOs. To calculate the aggregate PME net of fees we assume a total management fee of 20% of invested capital for each investment. We assume that funds that returned, after management fees are deducted, more than (1.08)^4 were in the money and deducted 20% carried interest all the investments of these funds. 8% is the usual hurdle rate and 4 years is the average duration of a transaction.
Number of
observations Multiple
PME gross-of-fees
PME net-of-fees
SBO bought late 84 1.67 1.14 0.88 SBO bought early 148 2.14 1.30 0.98 PBO bought early 2312 2.56 1.50 1.11 PBO bought late 927 2.79 1.78 1.31
SBO bought late Minus Other buyouts -- -0.92 -0.43 -0.27 Regional PE firm sells to Global PE firm 22 1.51 0.88 0.80 Not a regional PE firm selling to a Global PE firm 127 2.17 1.47 1.17 ‘Margin grower’ trades with a ‘Sales grower’ 75 2.28 1.56 1.21 ‘Margin grower’ does not trade with a ‘Sales grower’ 76 1.83 1.15 0.95 Buyer has a different professional background than seller 87 2.45 1.61 1.26 Buyer has the same professional background as seller 79 1.61 1.14 0.93 Buyer has a different educational background than seller 66 2.77 1.94 1.57 Buyer has a the same educational background as seller 106 1.63 1.05 0.82

43
Table 6: Late SBOs and Follow-up Fund Size
This table reports estimates of OLS regressions. Funds are the unit of observation. The dependent variable is the natural logarithm of the follow-on fund size. Explanatory variables are the fraction of the fund size invested in different types of buyout investments, fund size and fund performance. Standard errors are clustered by follow-on fund vintage year. Data on Fund size and cash multiple is from Preqin. When cash multiple is missing in Preqin (25% of the observations) we compute the gross of fees cash multiple with our data and calculate the net of fees cash multiple like in Table 5.
Dependent variable: Natural logarithm of follow-on fund size Spec 1 Spec 2
Fraction invested in ‘SBOs bought late’ by focal fund -2.07a -2.01a -2.68 -2.65 Fraction invested in ‘SBOs bought early’ by focal fund 0.22 0.12 0.34 0.20 Fraction invested in ‘PBOs bought late’ by focal fund 0.93a 0.91b 2.66 2.57 Natural logarithm of Focal Fund Size 0.73a 0.73a 15.10 15.22 Natural logarithm of Focal Fund Cash Multiple 0.20b 2.28 Vintage year fixed effects Yes Yes Adj. R-square 69.57 69.92 Number of observations 207 207

44
Table 7: An Example of LP overlap - Aspen Dental We use data from Pitchbook and Moody’s, except for italicized numbers, which we obtained from Capital IQ or assumed based on conversations with practitioners. Bold numbers are derived from data. Numbers are in millions of US dollars. Transaction costs are based on a transaction value of 547.5 million and a loan of $200 million. Panel A derives the transactions costs for CalPERS and Panel B summarizes the transaction costs for the nine limited partners that are on both sides of the Aspen Dental Management SBO (i.e. overlap). Panel A: Transaction costs paid by CalPERS ($ million)
Green Equity Investors V
Ares Corporate Opportunities Fund II
Role in SBO Buyer Seller Fund size 5300 2065 CalPERS’ fund commitment 400 200 CalPERS’ fund percentage stakes 7.5% 9.7% Equity values Funds’ pre-SBO equity stake in Aspen 0.0 347.5 CalPERS’ pre-SBO equity stake in Aspen 0.0 33.7 Funds’ post-SBO equity stake in Aspen 247.5 100.0 CalPERS’ post-SBO equity stake in Aspen 18.7 9.7 Transaction costs: Financial advisory 8.0 8.0 Legal advisory 2.0 2.0 Various due diligence reports 1.0 0.0 Loan fees 4.0 0.0 Total transaction costs 15.0 10.0 Transaction costs (indirectly) paid by CalPERS 1.1 1.0 Panel B: Relative transaction costs for overlapping LPs in Aspen Dental SBO ($ million)
Transaction cost (1)
Net transaction
(2)
Relative transaction cost
(1)/(2) CalPERS 2.1 5.3 40% State of Wisconsin Investment Board 0.5 1.3 40% New York State Teachers’ Retirement System 0.5 4.3 12% New York State Common Retirement Fund 0.7 8.5 8% State Teachers Retirement System of Ohio 0.7 12.0 6% Variable Annuity Life Insurance Company 0.1 1.0 10% Western National Life Insurance Company 0.1 1.0 10% Michigan Department of Treasury 1.3 2.0 66% Princess Private Equity 0.1 1.9 7% Mean 22% Median 10%

45
Figure 1: Percentage of SBOs among exits per year
This figure shows the fraction of buyout investments that are exited via a secondary buyout transaction in a given year (source: Pitchbook). Other exits routes include IPOs, trade sales and bankruptcies.
0% 5%
10% 15% 20% 25% 30% 35% 40% 45%
1996 1997 1998 1999 2000 2001 2002 2003 2004 2005 2006 2007 2008 2009 2010 2011 2012
Percentage of SBOs among Exits per year

46
Figure 2
Box plot of LP overlap ratio vs. number of funds held by limited partners The overlap ratio is defined as the number of SBOs in which the limited partner (LP) was invested in both the buying fund and the selling fund, divided by the number of SBOs in which the LP was invested in the selling fund. The LPs are all U.S. pension funds and insurance companies listed by Pitchbook as having been involved in at least one SBO for which Pitchbook could identify the selling fund and the buying fund. Boxes in the plot are bordered at the 25th and 75th percentiles, with a median line at the 50th percentile. Whiskers extend from the box to the upper and lower adjacent values and are capped with an adjacent line. The upper adjacent value is the largest observation that is less than or equal to third quartile plus 1.5*interquartile range. The lower adjacent value is the smallest observation that is greater than or equal to first quartile minus 1.5*interquartile range. The circles are values above the upper adjacent value.
0.1
.2.3
.4.5
# de
als
in s
elle
r & b
uyer
/# d
eals
in s
elle
r
1-10 11-20 21-30 31-40 40+Number of funds that LP is invested in

47
Table A.1: Descriptive statistics by investment inception year
This table shows our sample of buyout investments by inception year. Results are shown separately for the sub-sample of secondary buyouts (SBOs, Panel A) and for the sub-sample of primary buyouts (PBOs, Panel B). PBOs are investments in companies purchased from an entity other than a private equity fund (e.g. family, conglomerate); SBOs are buyout investments that are not PBOs (i.e. includes tertiary). Four time series are displayed. The first column shows the total number of investments in our dataset; the second column shows the number of liquidated investments; and the third column shows the number of liquidated investments for which we know the exit route. The fourth column shows the number of liquidated investments (i) made by limited-life PE funds; and (ii) for which we know the performance of all the other investments made by that limited-life PE fund. Variable definitions are listed in Appendix 1. Panel A: Secondary buyouts Number of investments by inception year
Full sample
Liquidated sample
Sub-sample for which we know the exit route
Sub-sample for which we know the complete
fund track record 1986 1 1 1 0 1987 4 4 4 1 1988 2 2 2 2 1989 2 2 2 2 1990 1 1 1 0 1991 3 3 3 2 1992 6 6 6 3 1993 3 2 2 1 1994 2 2 2 1 1995 9 9 7 6 1996 14 14 13 7 1997 37 37 36 17 1998 28 28 28 7 1999 31 30 29 18 2000 48 43 42 24 2001 19 18 17 10 2002 31 31 28 27 2003 49 45 39 27 2004 77 61 52 41 2005 84 63 55 25 2006 59 39 35 10 2007 38 26 17 0 Total 548 467 421 231

48
Panel B: Primary buyouts Number of investments by inception year
Full sample
Liquidated sample
Sub-sample for which we know the exit route
Sub-sample for which we know the complete
fund track record 1986 68 68 45 25 1987 65 65 40 23 1988 122 122 80 52 1989 116 116 83 60 1990 148 147 113 80 1991 147 144 116 89 1992 218 212 159 133 1993 207 205 151 131 1994 306 297 221 153 1995 349 336 250 184 1996 431 387 313 194 1997 574 482 394 286 1998 593 460 373 248 1999 763 547 436 337 2000 722 511 421 345 2001 389 284 252 191 2002 364 256 238 214 2003 409 276 246 228 2004 458 226 191 159 2005 444 165 146 84 2006 390 59 44 19 2007 166 17 14 5 Total 7,449 5,382 4,326 3,240

49
Table A.2: Sample selection
This table compares the private equity firms that are in our sample with those that are not in our sample. We search all private equity firms (PE firms) that are in our liquidated sample (321 firms that made a total of 5,849 investments) in the Capital IQ dataset. 222 PE firms are found. In Capital IQ, we consider that a firm is a PE firm if it has made at least 5 transactions classified as buyouts between 1980 and 2007, and if the size of its funds is known. We count 98 such firms that are not in our list of 321 firms. Panel A shows the descriptive statistics for the sub-sample of 98 firms that are not in our dataset and for the sub-sample of 222 firms that are in both our dataset and in Capital IQ. Panel B shows the coefficients and corresponding t-statistics from a series of Probit regressions. The dependent variable is one if the firm is in our sample, zero otherwise.
Panel A: Summary Statistics
PE firms present in Capital IQ but not in our dataset
PE firms present both in our dataset and in Capital IQ
Mean Median N_obs Mean Median N_obs
Number of funds raised 3 3 98 7 5 222 Number of investments 20 16 98 31 17 222 Foundation year 1992 1994 98 1990 1991 222 Average fund size 300 147 98 698 361 222 US headquartered 0.67 1.00 98 0.56 1.00 222 UK headquartered 0.13 0.00 98 0.18 0.00 222 France headquartered 0.09 0.00 98 0.09 0.00 222 Average investment year 2002 2003 97 2002 2002 222 Average transaction value 110 59 86 358 159 206 % investments in Consumer industries 0.30 0.29 98 0.29 0.29 221 % investments in Healthcare industries 0.06 0.04 98 0.07 0.03 221 % investments in Industrials industries 0.31 0.31 98 0.28 0.26 221 % investments in Materials industries 0.12 0.07 98 0.11 0.07 221 % investments in Telecom and information technology industries 0.11 0.10 98 0.11 0.09 221 Average purchase EBITDA/Enterprise value 7.72 7.93 34 9.35 8.82 135

50
Panel B: Probit regressions (Dependent variable: 1 if PE firm is in our sample, 0 otherwise)
Spec 1 Spec 2 Spec 3 Spec 4 Spec 5 Spec 6 Number of funds previously raised 0.24a 0.27a 0.27a 0.27a 0.26a 0.22a 5.75 5.51 5.41 5.05 4.90 3.01 Number of investments 0.00 0.00 0.00 0.00 0.00 -1.32 -1.40 -0.68 -0.57 -0.08 Foundation year 0.01 0.01 0.00 0.00 -0.01 1.30 1.12 0.04 0.01 -0.53 Average fund size 0.44a 0.50a 0.24 0.28 0.01 2.83 3.09 1.23 1.33 0.04 US headquartered -0.64a -0.45 -0.48c -0.31 -2.60 -1.63 -1.69 -0.71 UK headquartered -0.51c -0.40 -0.44 -0.02 -1.65 -1.22 -1.31 -0.04 France headquartered -0.49 -0.53 -0.52 0.14 -1.44 -1.42 -1.37 0.24 Average investment year 0.08c 0.08c 0.08 1.90 1.92 1.28 Average transaction value 1.27b 1.09c 0.39 2.34 1.96 0.80 % investments in Consumer industries -0.89 -1.49 -1.11 -1.23 % investments in Healthcare industries -0.16 1.72 -0.13 0.81 % investments in Industrials industries -0.99 -0.41 -1.31 -0.33 % investments in Materials industries -1.30 -2.13c -1.58 -1.73 % investments in Telecom and information -0.03 1.28 technology industries -0.03 0.79 Average purchase EBITDA/Enterprise value 0.09b 1.98 Mc Fadden R-squared 0.14 0.17 0.19 0.22 0.23 0.26 Number of observations 320 320 320 292 292 169

51
Table A3: Propensity to underperform
This table shows the results of a Probit regression in which the dependent variable is a dummy variable equal to one if the Modified PME is below one; and zero otherwise. Modified PME is the same as the original PME for all investments except late SBOs, for which it is set to 0.4 plus the original PME so that we control for late SBO underperformance (0.4 being the magnitude of the underperformance). t-statistics are reported in italics below each coefficient; they are based on standard errors clustered by both investment inception year and private equity firms. a significant at 1%; b significant at 5%; c significant at 10%.
Spec 1 Spec 2 Spec 3 Spec 4 Spec 5 Spec 6
SBO bought late 0.11c 0.11c 0.08 0.07 0.07 0.06
1.91 1.95 1.34 1.11 1.32 0.98
SBO bought early
-0.03 -0.03 -0.03 -0.04
-0.75 -0.63 -0.68 -1.03
PBO bought late
-0.09a -0.09a -0.09a -0.09a
-4.08 -3.97 -3.96 -4.07
Mill’s ratio 0.20 1.03 Excess cash 0.00 0.02 SBO bought late 0.56b * Excess cash 2.42 SBO bought early 0.09 * Excess cash 0.49 PBO bought late 0.01 * Excess cash 0.04 Relative investment Size
0.01
0.22
SBO bought late Size
0.17 * Relative investment
1.36
SBO bought early
0.14 * Relative investment
1.50
PBO bought late
0.02 * Relative investment
0.50
Other control variables Yes Yes Yes Yes Yes Yes Fixed effects: Buyer firm Yes No No No No No Fund birth quarter Yes Yes Yes Yes Yes Yes Fund country Yes Yes Yes Yes Yes Yes Company country Yes Yes Yes Yes Yes Yes Year x Industry Yes Yes Yes Yes Yes Yes Number of observations 3471 3471 3471 2819 3471 3471

52
Table A4: Investment duration
This table reports the results of OLS regressions with investment duration as dependent variable. Explanatory variables and specifications are the same as in Table 2. t-statistics are reported in italics below each coefficient; they are based on standard errors clustered by both investment inception year and private equity firms. a significant at 1%; b significant at 5%; c significant at 10%.
Spec 1 Spec 2 Spec 3 Spec 4 Spec 5 Spec 6
SBO bought late 0.14 0.13 -0.03 -0.03 -0.05 -0.14
0.64 0.56 -0.13 -0.09 -0.21 -0.61
SBO bought early
0.20 0.16 0.20 0.21
1.32 0.91 1.35 1.40
PBO bought late
-0.50a -0.50a -0.51a -0.50a
-5.71 -5.08 -5.71 -5.66
Mill’s ratio -0.43 -0.45 Excess cash -0.44 -1.33 SBO bought late 0.89 * Excess cash 0.73 SBO bought early 0.50 * Excess cash 0.60 PBO bought late 0.37 * Excess cash 0.67 Relative investment Size
0.52a
3.28
SBO bought late Size
0.61 * Relative investment
1.43
SBO bought early
-0.36 * Relative investment
-1.03
PBO bought late
-0.39b * Relative investment
-2.05
Other control variables Yes Yes Yes Yes Yes Yes Fixed effects: Buyer firm Yes No No No No No Fund birth quarter Yes Yes Yes Yes Yes Yes Fund country Yes Yes Yes Yes Yes Yes Company country Yes Yes Yes Yes Yes Yes Year x Industry Yes Yes Yes Yes Yes Yes Adjusted R-square 14.66 10.47 11.36 11.55 11.31 11.67 Number of observations 3471 3471 3471 2819 3471 3471