On-Road Emissions Reductions and the Regional ...€¦ · Presentation Outline: – Current...
27
Tom Kear Tom Kear Cambridge Systematics Cambridge Systematics December 9, 2010 December 9, 2010 On On - - Road Emissions Reductions Road Emissions Reductions and the Regional Comprehensive and the Regional Comprehensive Goods Movement Plan Goods Movement Plan – – Background and Policy Questions Background and Policy Questions Presented to SCAG Regional Goods Movement Study Presented to SCAG Regional Goods Movement Study Steering Committee Steering Committee 1
Transcript of On-Road Emissions Reductions and the Regional ...€¦ · Presentation Outline: – Current...

Tom KearTom KearCambridge SystematicsCambridge Systematics
December 9, 2010December 9, 2010
OnOn--Road Emissions Reductions Road Emissions Reductions and the Regional Comprehensive and the Regional Comprehensive
Goods Movement Plan Goods Movement Plan –– Background and Policy Questions Background and Policy Questions
Presented to SCAG Regional Goods Movement Study Presented to SCAG Regional Goods Movement Study Steering CommitteeSteering Committee
1

Goods Movement Emissions as Percent of All Sources, South Coast Air Basin
Source: South Coast AQMD, 2007 Air Quality Management Plan.
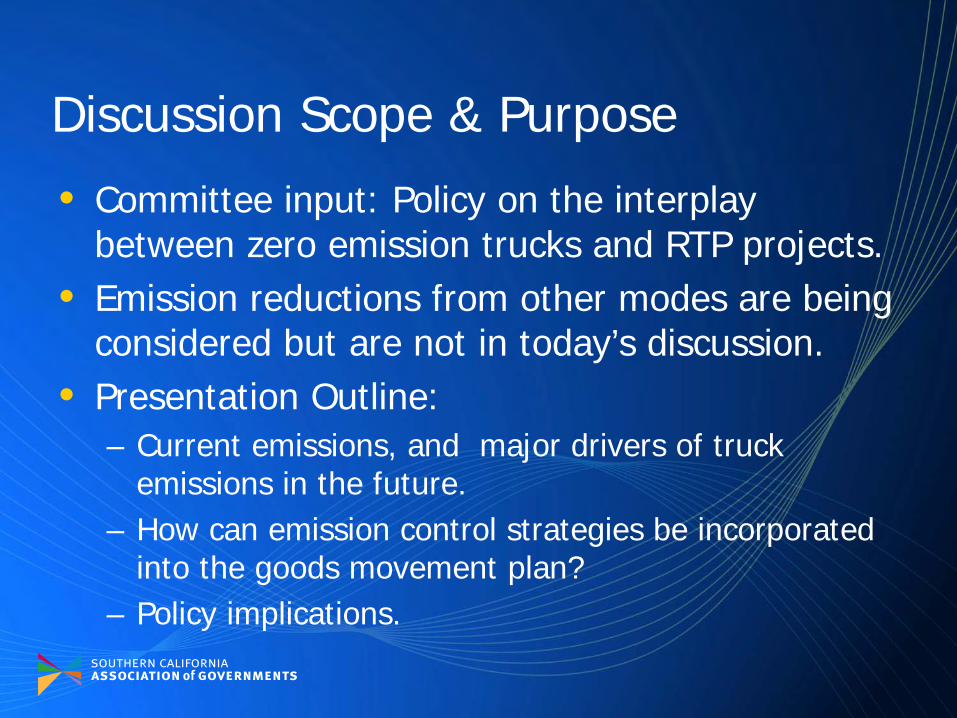
Discussion Scope & Purpose
• Committee input: Policy on the interplay between zero emission trucks and RTP projects.
• Emission reductions from other modes are being considered but are not in today’s discussion.
• Presentation Outline:– Current emissions, and major drivers of truck
emissions in the future.– How can emission control strategies be incorporated
into the goods movement plan?– Policy implications.
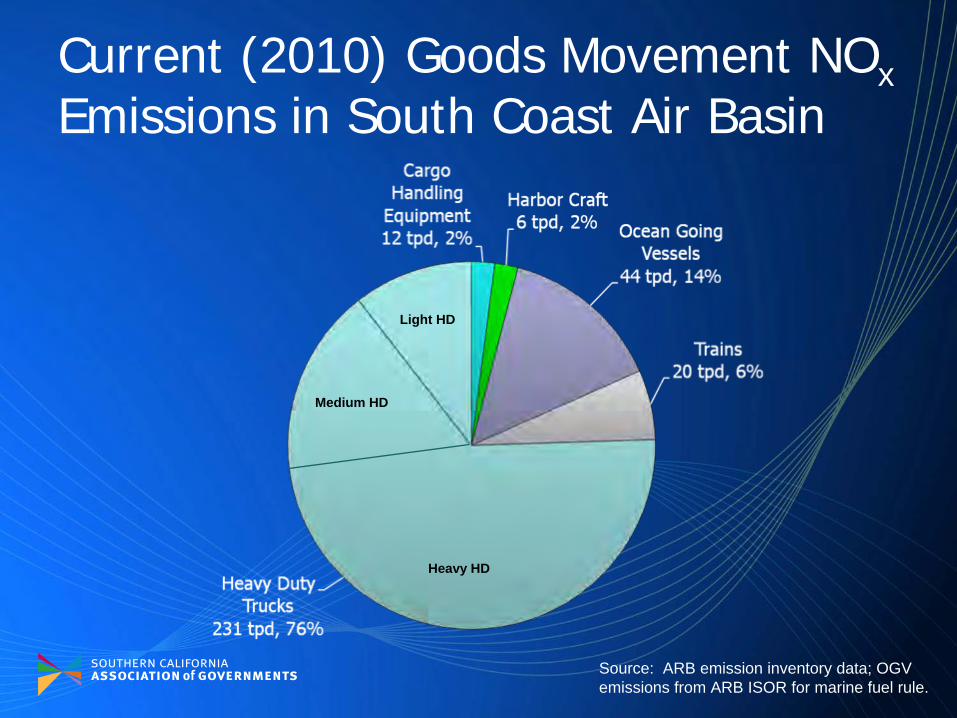
Current (2010) Goods Movement NOx Emissions in South Coast Air Basin
Source: ARB emission inventory data; OGV emissions from ARB ISOR for marine fuel rule.
Heavy HD
Medium HD
Light HD

Current (2010) Goods Movement PM2.5 Emissions in South Coast Air Basin
Source: ARB emission inventory data; OGV emissions from ARB ISOR for marine fuel rule.
Heavy HD
Medium HD
Light HD

Current (2010) Goods Movement NOx Emissions in SCAG Air Districts
Source: ARB emission inventory data.
8 tpd
34 tpd
389 tpd
87 tpd
19 tpd

Current (2010) Goods Movement PM2.5 Emissions in SCAG Air Districts
Source: ARB emission inventory data.
0.3 tpd
3.6 tpd2.2 tpd
18.3 tpd
0.7 tpd
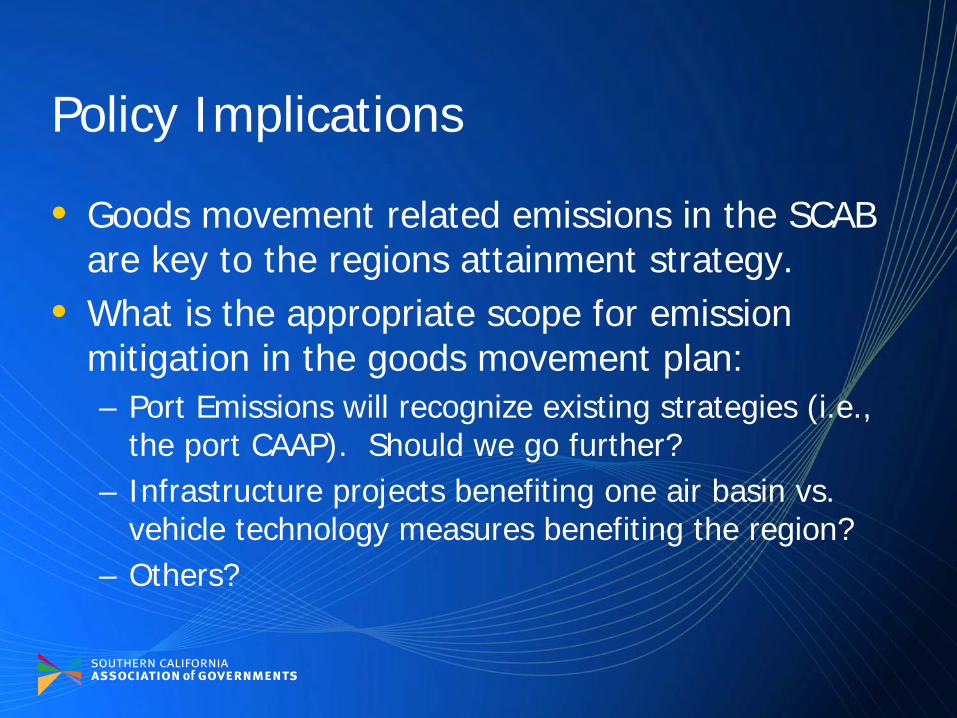
Policy Implications
• Goods movement related emissions in the SCAB are key to the regions attainment strategy.
• What is the appropriate scope for emission mitigation in the goods movement plan:– Port Emissions will recognize existing strategies (i.e.,
the port CAAP). Should we go further?– Infrastructure projects benefiting one air basin vs.
vehicle technology measures benefiting the region?– Others?

Anticipated Heavy Duty Truck Anticipated Heavy Duty Truck Emissions ReductionsEmissions Reductions

SCAG Region Truck VMT Projections
Source: EMFAC2007.
Average Daily VWT (000)35,000
30,000
25,000
20,000
15,000
10,000
5,000
02005 2010 2015 2020 2025 2030 2035
Year
Heavy HD TrucksHeavy HD Trucks
Light HD TrucksLight HD Trucks
Medium HD TrucksMedium HD Trucks
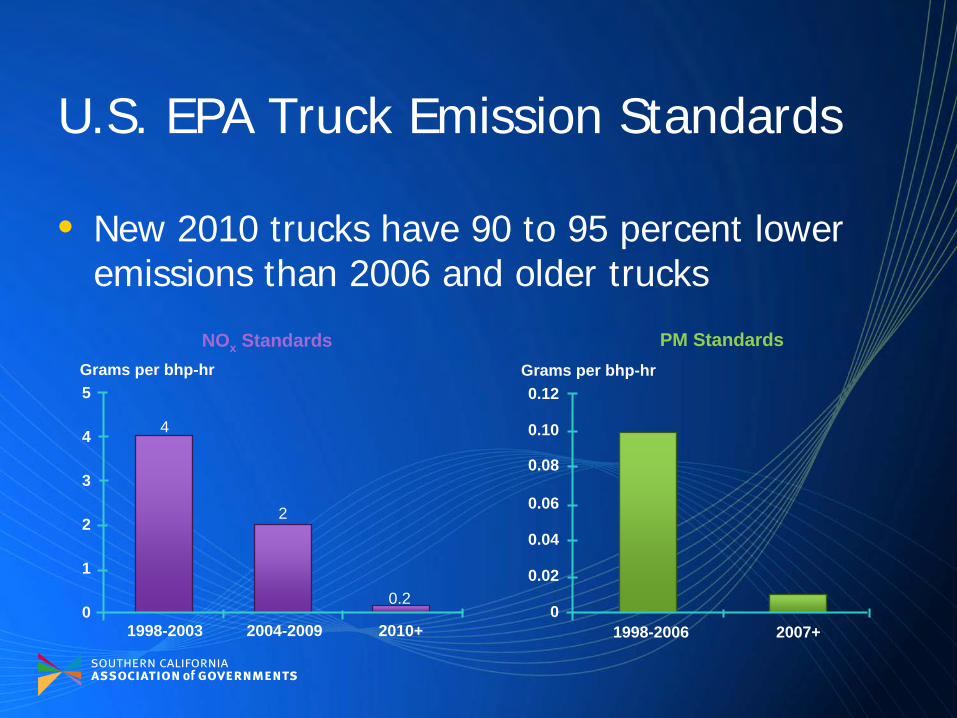
U.S. EPA Truck Emission Standards
• New 2010 trucks have 90 to 95 percent lower emissions than 2006 and older trucks
PM StandardsNOx Standards
5
4
3
2
1
01998-2003 2004-2009 2010+
4
2
0.2
Grams per bhp-hr0.12
0.10
0.08
0.06
0.04
0.02
01998-2006 2007+
Grams per bhp-hr

ARB In-Use Truck and Bus Rule
• Accelerates introduction of 2010-compliant trucks• Applies only to trucks with GVW >14,000 lbs.• Compliance schedule for trucks with GVW >26,000
lbs.:Existing Engine Model Replace with 2010 Engine by:1993 and older January 1, 2015
1994-1995 January 1, 2016
1996-1997 January 1, 2017
1998-2000 January 1, 2020
2001-2004 January 1, 2021
2005-2006 January 1, 2022
2007-2009 January 1, 2023

Effect of In-Use Truck and Bus Rule on PM2.5 , SCAG Region
Source: ICF International analysis based on EMFAC 2007 and ARB regulation
PM2.5 (tons per day)
Year
18
2005 2035
16
14
12
10
8
6
4
2
0
2010 2015 2020 2025 2030
BaselineBaseline
w/ Truck and Bus Rulew/ Truck and Bus Rule

Effect of In-Use Truck and Bus Rule on NOx , SCAG Region
Source: ICF International analysis based on EMFAC 2007 and ARB regulation.
NOx (tons per day)500
2005 2035
BaselineBaseline
w/ Truck and Bus Rulew/ Truck and Bus Rule
450
400
350
300
250
200
150
100
50
0
2010 2015 2020 2025 2030
Year

Policy Consideration
• 90-95% reduction in NOx and PM2.5 emissions make many previous strategies less cost effective for mitigation.
• To what extent should the RTP mitigations consider cost effectiveness?
Trucks Trucks –– Emission Reduction Emission Reduction Options for 2025 and BeyondOptions for 2025 and Beyond
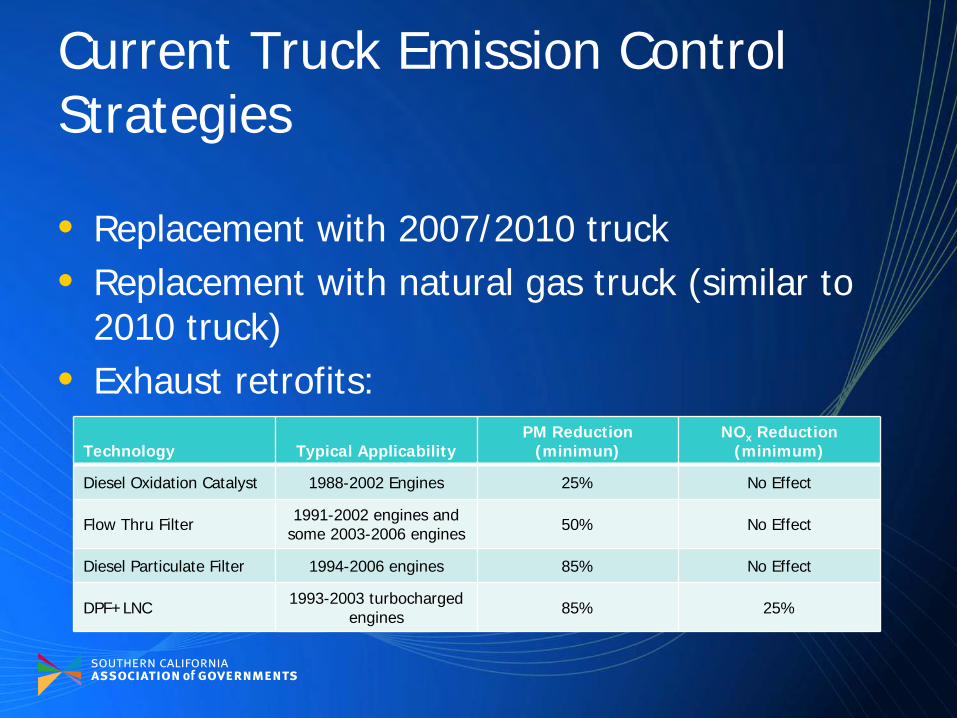
Current Truck Emission Control Strategies
• Replacement with 2007/2010 truck• Replacement with natural gas truck (similar to
2010 truck)• Exhaust retrofits:
Technology Typical ApplicabilityPM Reduction
(minimun)NOx Reduction
(minimum)
Diesel Oxidation Catalyst 1988-2002 Engines 25% No Effect
Flow Thru Filter 1991-2002 engines and some 2003-2006 engines 50% No Effect
Diesel Particulate Filter 1994-2006 engines 85% No Effect
DPF+LNC 1993-2003 turbocharged engines 85% 25%

Current Truck Emission Control Strategies
• Current strategies will have little to no effect by 2020/2025
Source: EMFAC 2007.
VMT from pre-2007 TrucksFraction of VMT
Heavy Heavy DutyMedium Heavy DutyLight Heavy Duty
80%
2010 2025
70%60%
50%
40%
30%20%
10%
0%
2015 2020

Potential Future Low Emission Truck Technologies
• Hybrid-electric drive– Parallel hybrid– Series hybrid– Other configurations
• Hydraulic hybrid• Full battery electric• Fuel cell vehicles• Electric drive with overhead catenary system• Electric drive with electromagnetic induction (power
system in roadway) • Electric drive with third rail power

How to Implement Low Emission Truck Technologies?• Barriers (URS will discuss specific technologies)
– Vehicle cost.– Limited performance (range, speed, load, charging
time).– Highly dispersed ownership of trucks.
• Implementation mechanisms– Use of facility access to encourage purchase and use
of low emission trucks (limited by fleet that must use those facilities).
– Use of vehicle purchase incentives (limited by cost).

Facility Access Limitations – Ports and Yards
• Ports– SPB Port trucks account for 5 to 10 percent of total
SCAB truck VMT and emissions (2008)
• Intermodal yards– 9 major yards
Source: Port of LA Air Emissions Inventory; Port of LB Air Emissions Inventory.
All SCAB HDTs SPB port Trucks Percent
VMT/Average Weekday 21,863,585 1,175,979 5%
NOx (tons/day) 231 20.9 9%
PM2.5 (tons/day) 7.6 0.5 7%

Facility Access Limitations – Highways
• Major N/S and E/W truck corridors– I-110, I-710, I-605, I-10, SR 60, SR 91, I-15, I-215
– Accounts for ~20 percent of total SCAB truck VMT (2008)
Source: ICF International estimate based on Caltrans truck counts.
All SCAB HDTsThru Trucks on Major N/S
and E/S Corridors Percent
VMT/Weekday 21,863,585 3,670,000 17%

Truck Purchase Incentives
• Existing programs– Ports’ Clean Truck Program– Carl Moyer Program– State and Federal tax incentives for alt fuel vehicles
• To have a significant impact, costs could be huge– More than 400,000 HDTs in SCAG region– More than 80,000 Class 8 trucks (HHDT)– Incremental costs may be $50,000/vehicle,
or much more

Policy Implications
• How should projects in the goods movement plan implement specific emission reduction strategies:– Access limitations to encourage adoption of specific
technologies (i.e., electric trucks)?– Provide adequate right-of-way to subsequently build
enabling infrastructure (i.e., ability to accommodate catenary power)?
– Providing specific technologies under RTP projects (i.e., catenary power and funds to purchase trucks)?

Next Steps for Consultant Team
• Evaluate the effectiveness of truck and rail emission reduction strategies in 2023 and 2035– Identify goods movement markets/segments to
target emission reduction strategies– Assess emissions impacts of selected infrastructure
and operations strategies– Assess truck emission reduction strategies– Assess rail emission reduction strategies– Estimate cost to achieve target emission reductions
in select market segments

Guidance Recap
• What is the appropriate scope for emission mitigation in the goods movement plan:– Port Emissions, or other sources not directly effected
by the RTP, will recognize existing strategies (i.e., the port CAAP). Should we go further?
– Infrastructure projects benefiting one air basin vs. vehicle technology measures benefiting the region?
– Others?
• To what extent should the RTP mitigations consider cost effectiveness?
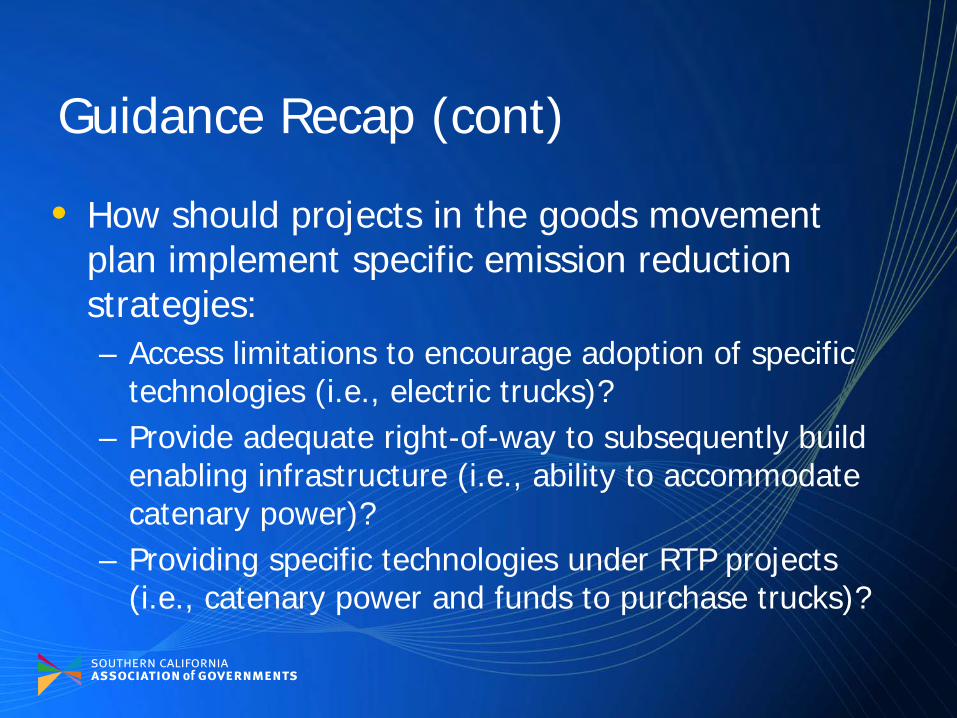
Guidance Recap (cont)
• How should projects in the goods movement plan implement specific emission reduction strategies:– Access limitations to encourage adoption of specific
technologies (i.e., electric trucks)?– Provide adequate right-of-way to subsequently build
enabling infrastructure (i.e., ability to accommodate catenary power)?
– Providing specific technologies under RTP projects (i.e., catenary power and funds to purchase trucks)?