On Representing Uncertainty In Some COCOMO Model Family Parameters October 27, 2004 John Gaffney...
18
On Representing Uncertainty In Some COCOMO Model Family Parameters October 27, 2004 John Gaffney [email protected] 301-240-7038 Fellow, Software & Systems Resource Center, Lockheed Martin
-
Upload
jessie-martinson -
Category
Documents
-
view
214 -
download
0
Transcript of On Representing Uncertainty In Some COCOMO Model Family Parameters October 27, 2004 John Gaffney...
On Representing Uncertainty In Some COCOMO Model Family Parameters
October 27, 2004
John [email protected]
301-240-7038
Fellow, Software & Systems Resource Center, Lockheed Martin
(c) Copyright, Lockheed Martin Corporation, 2004
2
Background• Uncertainties should be recognized in estimates of effort/cost,
schedule, and other measures of interest in software and systems development.
• Managers and technical personnel need to make tradeoffs and decisions under uncertainty through the effective assessment and evaluation of risks.
• All too often, “the” value is presented, unaccompanied by any statement of the degree of uncertainty in that value.– Program managers and others involved in developing estimates for
proposals should be able to quantify the degree of uncertainty in the estimates that they produce.
– Estimating cost, schedule, and other product or process variables as single numbers fails to provide decision makers with information sufficient to make good bidding and other decisions.
• Suggestion: Develop estimate of RISK for the value of the parameter of interest (e.g., COSYSMO size drivers, development effort)– Risk: A measure of the probability of an undesirable situation.
(c) Copyright, Lockheed Martin Corporation, 2004
3
Overview• A method, prototype tools, and example applications are presented for
explicitly dealing with and quantifying uncertainty in the values of various parameters used in COSYSMO and COCOMO II. They should be usable in other members of the COCOMO family of estimation models as well.
• The uncertainty is defined in terms of an empirical probability distribution for the value of the parameter of interest and one minus its value or the “risk.”Examples:
– Cost Risk= Probability that the target value for the cost (or effort) will be exceeded.– Schedule Risk= Probability that the target value for the schedule (duration) will be
exceeded.
• In general, if higher values (such as a prospective cost, or cost driver) are less desirable, then the risk is the probability that the target value will be exceeded. However, if higher values are more desirable (such as Mean-Time-Between-Failures), then the risk is the probability that the actual value will be less than the target value.
• The Pearson-Tukey three-point approximation is used for estimating the probability distribution for each parameter whose variation is represented. The three points use values at the (estimated) 5%,50%, and 95% fractiles.
– Values obtained by expert opinion, experience data, or a combination of them; base on an assessment of impact of “risk factors.”
(c) Copyright, Lockheed Martin Corporation, 2004
4
COSYSMO Size Driver Prototype
• Excel-based prototype tool.
• Provides cumulative probability and risk distributions for COSYSMO size,S.
• S=Σ(wi*si); i=1,2,3,4 . The wi are weights for “easy,” “normal,” and “difficult.” The Si, sizes, are: # of system requirements, # of system interfaces, # of operational scenarios, and # of critical algorithms.
(c) Copyright, Lockheed Martin Corporation, 2004
5
Example, Illustrative Application of COSYSMO Prototype

(c) Copyright, Lockheed Martin Corporation, 2004
6
13-Oct-04
PROTOTYPE COSYSMO SIZE DRIVER RISK ESTIMATOR TOOL
Place value in each box indicated in yellow.
DO NOT MAKE ENTRIES IN ANY OTHER CELLS. Most Likely Size=
Then, press cntrl+b to execute the tool and obtain the Risk=
size driver risk and cumulative probabilities
Risk Component Range Estimate Values
Number Name 5% Low er Most Likely 95% Upper
1 # of System Requirements 100 200 350 N
2 # of Interfaces 135 250 350 N
3 # of Critical Algorithms 10 15 17 N
4 # of Operational Scenarios 20 25 30 N
Weight: Enter E, N, or D only
COSYSMO Size Driver Summary Statistics
Minimum Size= 1179
Risk= 99.88%
Most Likely Size= 1882
Risk= 43.48%
Maximum Size= 2559
Risk= 0.00%
20% Risk Size= 2063
30% Risk Size= 2003
50% Risk Size= 1880

(c) Copyright, Lockheed Martin Corporation, 2004
7
Size Driver Value Risk
0%5%
10%15%20%25%30%35%40%45%50%55%60%65%70%75%80%85%90%95%
100%
1000 1250 1500 1750 2000 2250 2500
Size Driver
Ris
k (
= P
rob
. Th
at
Ac
tua
l Siz
e
Dri
ve
r W
ill E
xc
ee
d V
alu
e In
dic
ate
d
on
X-A
xis
)
Most Likely Size=1882.1Risk For Nom= 43.48%

(c) Copyright, Lockheed Martin Corporation, 2004
8
Size Driver Cumulative Probability
0%5%
10%15%20%25%30%35%40%45%50%55%60%65%70%75%80%85%90%95%
100%
1000 1250 1500 1750 2000 2250 2500
Size Driver
Cum
ulat
ive
Pro
babi
lity
of S
ize
Dri
ver
Val
ue
(c) Copyright, Lockheed Martin Corporation, 2004
9
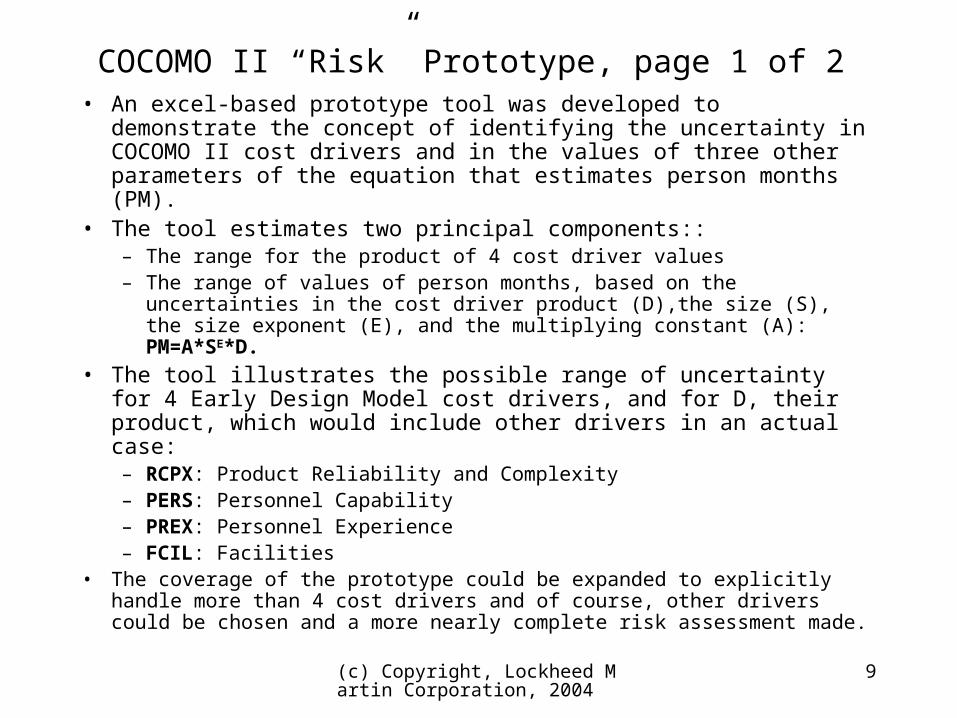
COCOMO II “Risk” Prototype, page 1 of 2• An excel-based prototype tool was developed to demonstrate the
concept of identifying the uncertainty in COCOMO II cost drivers and in the values of three other parameters of the equation that estimates person months (PM).
• The tool estimates two principal components::– The range for the product of 4 cost driver values – The range of values of person months, based on the uncertainties in the cost
driver product (D),the size (S), the size exponent (E), and the multiplying constant (A): PM=A*SE*D.
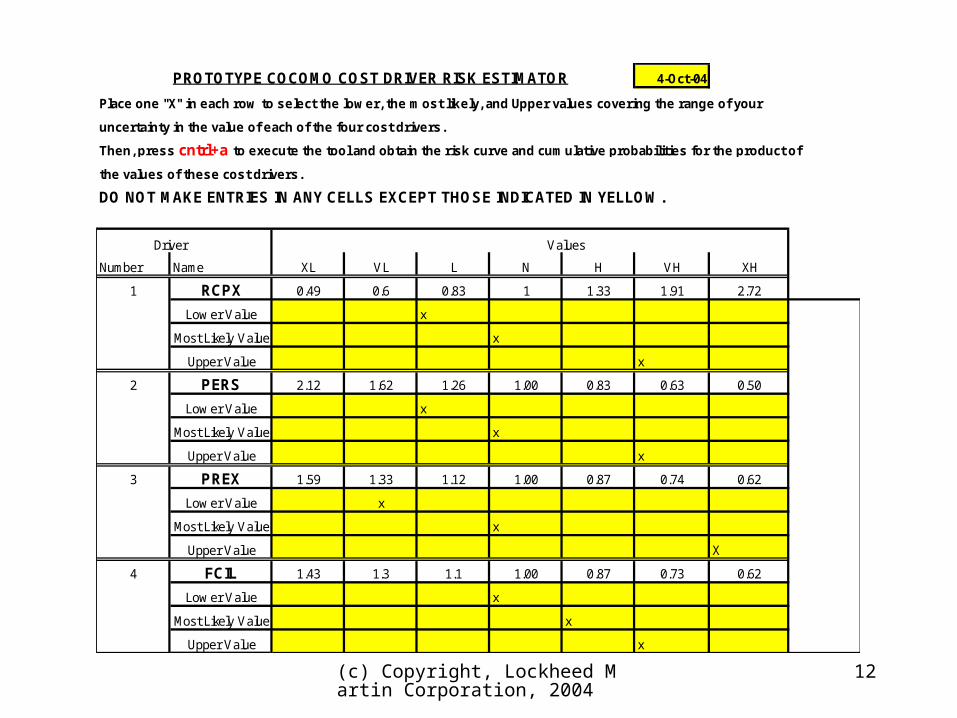
• The tool illustrates the possible range of uncertainty for 4 Early Design Model cost drivers, and for D, their product, which would include other drivers in an actual case:
– RCPX: Product Reliability and Complexity– PERS: Personnel Capability– PREX: Personnel Experience– FCIL: Facilities
• The coverage of the prototype could be expanded to explicitly handle more than 4 cost drivers and of course, other drivers could be chosen and a more nearly complete risk assessment made.
(c) Copyright, Lockheed Martin Corporation, 2004
10
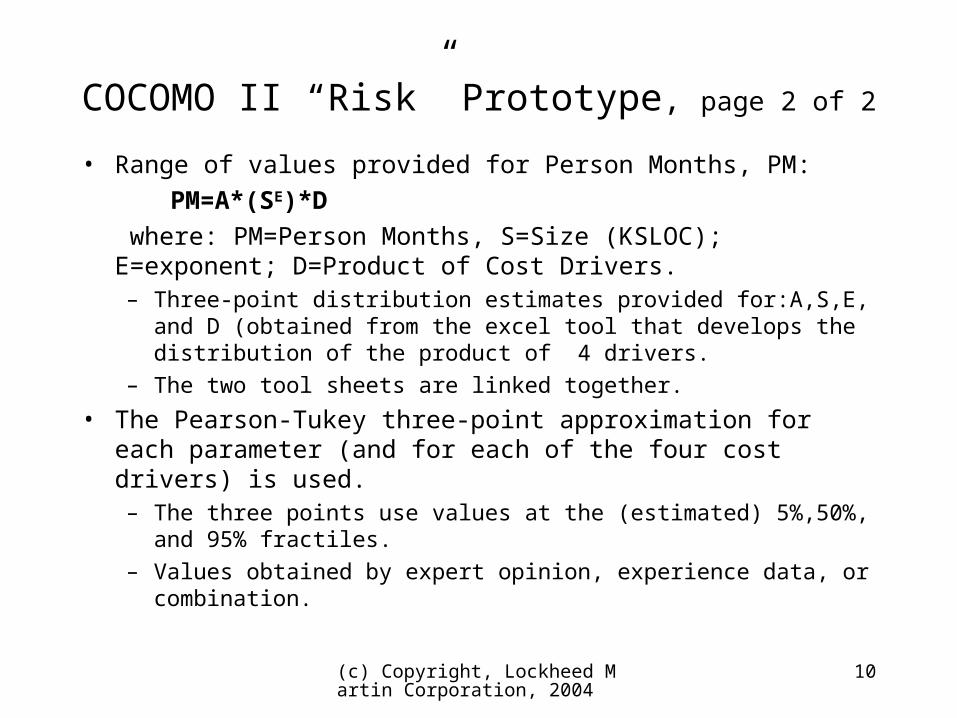
COCOMO II “Risk” Prototype, page 2 of 2
• Range of values provided for Person Months, PM:
PM=A*(SE)*D
where: PM=Person Months, S=Size (KSLOC); E=exponent; D=Product of Cost Drivers.– Three-point distribution estimates provided for:A,S,E, and D (obtained
from the excel tool that develops the distribution of the product of 4 drivers.
– The two tool sheets are linked together.
• The Pearson-Tukey three-point approximation for each parameter (and for each of the four cost drivers) is used.– The three points use values at the (estimated) 5%,50%, and 95% fractiles.
– Values obtained by expert opinion, experience data, or combination.
(c) Copyright, Lockheed Martin Corporation, 2004
11
Example, Illustrative Application of COCOMO II Prototype
(c) Copyright, Lockheed Martin Corporation, 2004
12
PROTOTYPE COCOMO COST DRIVER RISK ESTIMATOR 4-Oct-04
Place one "X" in each row to select the lower, the most likely, and Upper values covering the range of your
uncertainty in the value of each of the four cost drivers.
Then, press cntrl+a to execute the tool and obtain the risk curve and cumulative probabilities for the product of
the values of these cost drivers.
DO NOT MAKE ENTRIES IN ANY CELLS EXCEPT THOSE INDICATED IN YELLOW.
Driver Values
Number Name XL VL L N H VH XH
1 RCPX 0.49 0.6 0.83 1 1.33 1.91 2.72
Low er Value x 1
Most Likely Value x 1
Upper Value x 1
2 PERS 2.12 1.62 1.26 1.00 0.83 0.63 0.50
Low er Value x 1
Most Likely Value x 1
Upper Value x 1
3 PREX 1.59 1.33 1.12 1.00 0.87 0.74 0.62
Low er Value x 1
Most Likely Value x 1
Upper Value X 1
4 FCIL 1.43 1.3 1.1 1.00 0.87 0.73 0.62
Low er Value x 1
Most Likely Value x 1
Upper Value x 1

(c) Copyright, Lockheed Martin Corporation, 2004
13
4-Oct-04
PROTOTYPE COCOMO II EFFORT RISK ESTIMATOR
Place value in each box in dicated in yellow. DO NOT MAKE ENTRIES IN ANY OTHER CELLS.Then, press cntrl+b to execute the tool and obtain the person month risk and cumulative probabilities
Risk Component Range Estimate Values
Number Name 5% Low er Most Likely 95% Upper
1 A 2.40 2.94 3.60
2 S 135.0 200.0 300.0
3 E 1.05 1.12 1.20
4 D 0.4520 1.1571 1.9100
Person Months,PM=A*SE*D; where: D, cost driver product, is obtained from the other tool sheet.
(c) Copyright, Lockheed Martin Corporation, 2004
14
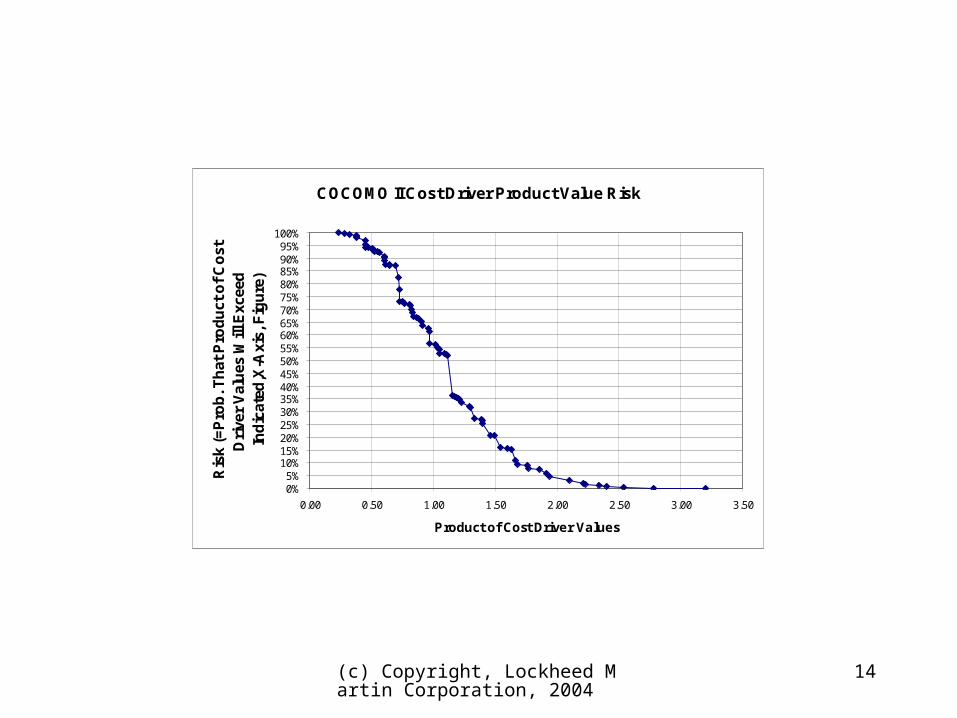
COCOMO II Cost Driver Product Value Risk
0%5%
10%15%20%25%30%35%40%45%50%55%60%65%70%75%80%85%90%95%
100%
0.00 0.50 1.00 1.50 2.00 2.50 3.00 3.50
Product of Cost Driver Values
Ris
k (=
Pro
b. T
hat
Pro
du
ct o
f C
ost
D
rive
r V
alu
es W
ill E
xcee
d
Ind
icat
ed,X
-Axi
s, F
igu
re)
(c) Copyright, Lockheed Martin Corporation, 2004
15
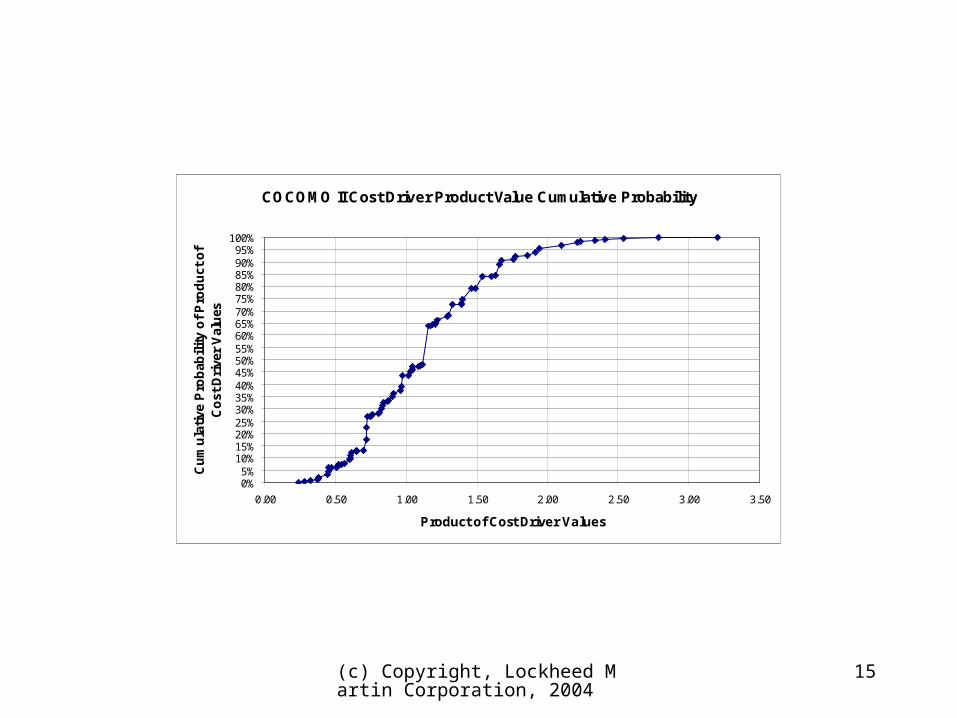
COCOMO II Cost Driver Product Value Cumulative Probability
0%5%
10%15%20%25%30%35%40%45%50%55%60%65%70%75%80%85%90%95%
100%
0.00 0.50 1.00 1.50 2.00 2.50 3.00 3.50
Product of Cost Driver Values
Cu
mu
lati
ve P
rob
abil
ity
of
Pro
du
ct o
f C
ost
Dri
ver
Val
ues
(c) Copyright, Lockheed Martin Corporation, 2004
16
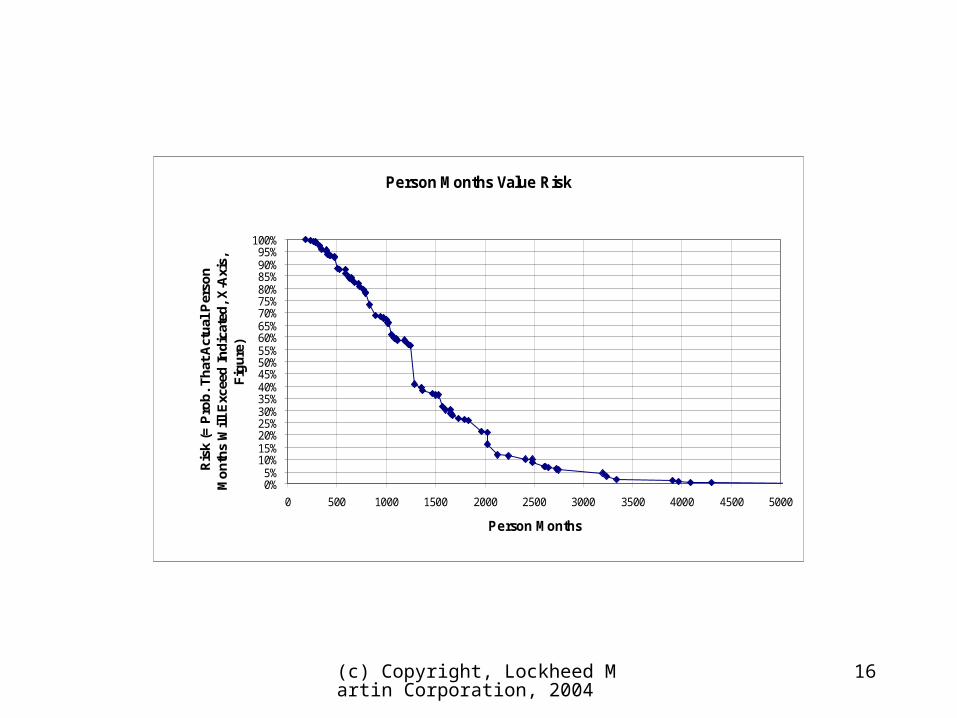
Person Months Value Risk
0%5%
10%15%20%25%30%35%40%45%50%55%60%65%70%75%80%85%90%95%
100%
0 500 1000 1500 2000 2500 3000 3500 4000 4500 5000
Person Months
Ris
k (=
Pro
b.
Th
at A
ctu
al P
erso
n
Mo
nth
s W
ill
Exc
eed
In
dic
ated
, X
-Axi
s,
Fig
ure
)
(c) Copyright, Lockheed Martin Corporation, 2004
17
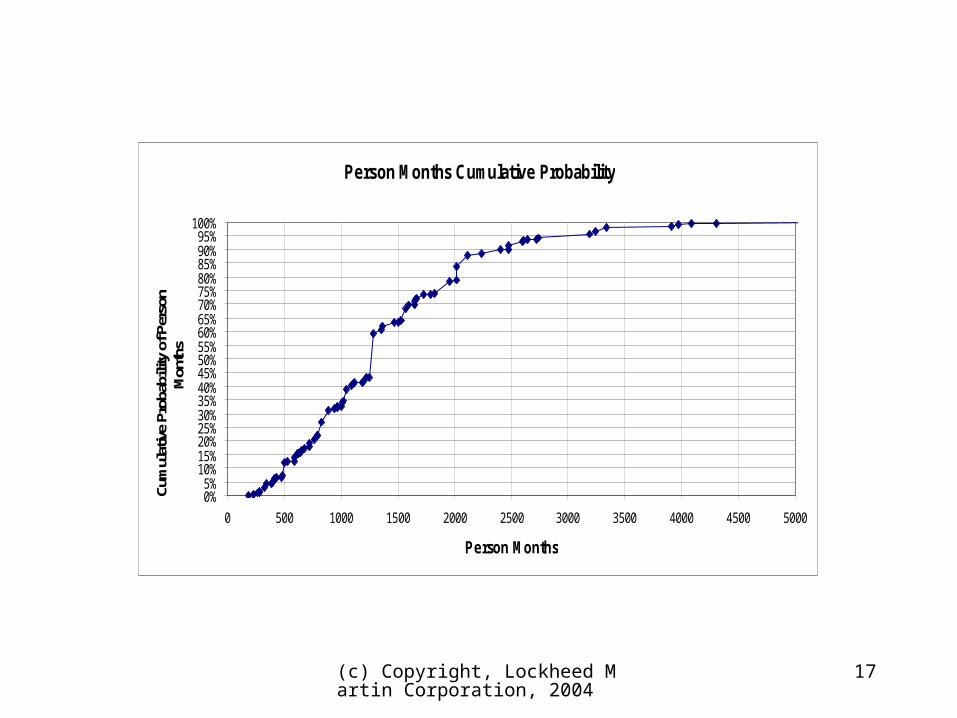
Person Months Cumulative Probability
0%5%
10%15%20%25%30%35%40%45%50%55%60%65%70%75%80%85%90%95%
100%
0 500 1000 1500 2000 2500 3000 3500 4000 4500 5000
Person Months
Cum
ulat
ive
Prob
abili
ty o
f Per
son
Mon
ths
(c) Copyright, Lockheed Martin Corporation, 2004
18
Some References
1. In Chapter 8, How To Estimate Software Cost, in The Software Measurement Guidebook, by J. Gaffney, R. Cruickshank et al., Thomson Computer Press, 1995.
2. In the section, How to Estimate Software Project Schedules, by J. Gaffney, in the book, Software Engineering Project Management, edited by Richard Thayer, IEEE Computer Press, 1997.
3. Software Risk Metrics and Tool, by J. Ulvila, J. Gaffney, and J. Chinnis, Metrics 2002, IEEE 8th International Symposium on Software Metrics.
4. A Methodology and Implementation For Software System Cost and Risk Estimation, by J. Gaffney, J. Bridel, and D. McGovern, 8th PSM Users’ Group Conference, July, 2004.