On-Orbit Testing of the EO-1 Pulsed Plasma Thruster
11
On-Orbit Testing of the EO-1 Pulsed Plasma Thruster Charles Zalawski NASA-Goddard Space Flight Center Greenbelt, MD 20771 Scott Benson NASA-Glenn Research Center Cleveland, OH 44136 Paul Smernan Swales Aerospace Beltsville, MD 20705 Andrew Hoskins General Dynamics Space Systems Division Redmond,WA 98073 Abstract The Pulsed Plasma Thruster (PPT) Experiment on the Earth Observing 1 (EO-1) spacecraft has demonstrated the capability of a new generation PPT to perform spacecraft attitude control. The PPT is a small, self- contained pulsed electromagnetic propulsion system capable of delivering hgh specific impulse (900-1200 s) and very small impulse bits (10-1000 pN-s) at low average power ( 4 to 100 W). EO-1 has a single PPT that can produce torque in the positive or negative pitch direction and replace the function of the spacecraft’s pitch reaction wheel. The flight validation experiment was designed to demonstrate the ability of the PPT to provide precision pointing accuracy, response and stability, and to confirm that the thruster plume and EMI effects on the spacecraft and instruments were benign. The PPT has been successfully used for pitch attitude control accumulating over 26 hours of operational time with over 96,000 pulses. Thruster performance has been nominal and all spacecraft subsystems and instruments continue to show no detrimental effects fiom PPT operation. Introduction The Earth Observing 1 (EO-1) Pulsed Plasma Thruster (PPT), shown in Figure 1, is being flown as a technology validation experiment. The objectives of the flight validation of this new generation of PPTs are: 1) to demonstrate the ability of the PPT to function as a precision attitude control actuator; 2) to confirm benign interaction of the thruster plume and EM1 with other spacecraft subsystems and instruments; and 3) to verify performance parameters in flight. For this experiment, Figure 1: EO-1 PPT the PPT is operated as a replacement actuator for the pitch wheel in EO-1’s attitude control system. The EO-1 PPT is the first PPT to be developed for flight in the past 10 years. The design improvements in the electronics resulted in significant reduction in mass and volume compared to the previous generation of PPTs. With its very small impulse bit capability (10- 1000 pNs), ease of integration to the spacecraft, and the non-toxic, slosh-fkee propellant, the PPT has excellent potential as a precision attitude control thruster. The PPT could also offer sigmficant mass saving by replacing the functionally equivalent complement of reaction wheels, torque rods andor liquid chemical thrusters.”* 1 American Institute of Aeronautics and Astronautics
Transcript of On-Orbit Testing of the EO-1 Pulsed Plasma Thruster
On-Orbit Testing of the EO-1 Pulsed Plasma Thruster
Charles Zalawski NASA-Goddard Space Flight Center
Greenbelt, MD 20771
Scott Benson NASA-Glenn Research Center
Cleveland, OH 44136
Paul Smernan Swales Aerospace
Beltsville, MD 20705
Andrew Hoskins General Dynamics Space Systems Division
Redmond,WA 98073
Abstract
The Pulsed Plasma Thruster (PPT) Experiment on the Earth Observing 1 (EO-1) spacecraft has demonstrated the capability of a new generation PPT to perform spacecraft attitude control. The PPT is a small, self- contained pulsed electromagnetic propulsion system capable of delivering hgh specific impulse (900-1200 s) and very small impulse bits (10-1000 pN-s) at low average power ( 4 to 100 W). EO-1 has a single PPT that can produce torque in the positive or negative pitch direction and replace the function of the spacecraft’s pitch reaction wheel. The flight validation experiment was designed to demonstrate the ability of the PPT to provide precision pointing accuracy, response and stability, and to confirm that the thruster plume and EMI effects on the spacecraft and instruments were benign. The PPT has been successfully used for pitch attitude control accumulating over 26 hours of operational time with over 96,000 pulses. Thruster performance has been nominal and all spacecraft subsystems and instruments continue to show no detrimental effects fiom PPT operation.
Introduction
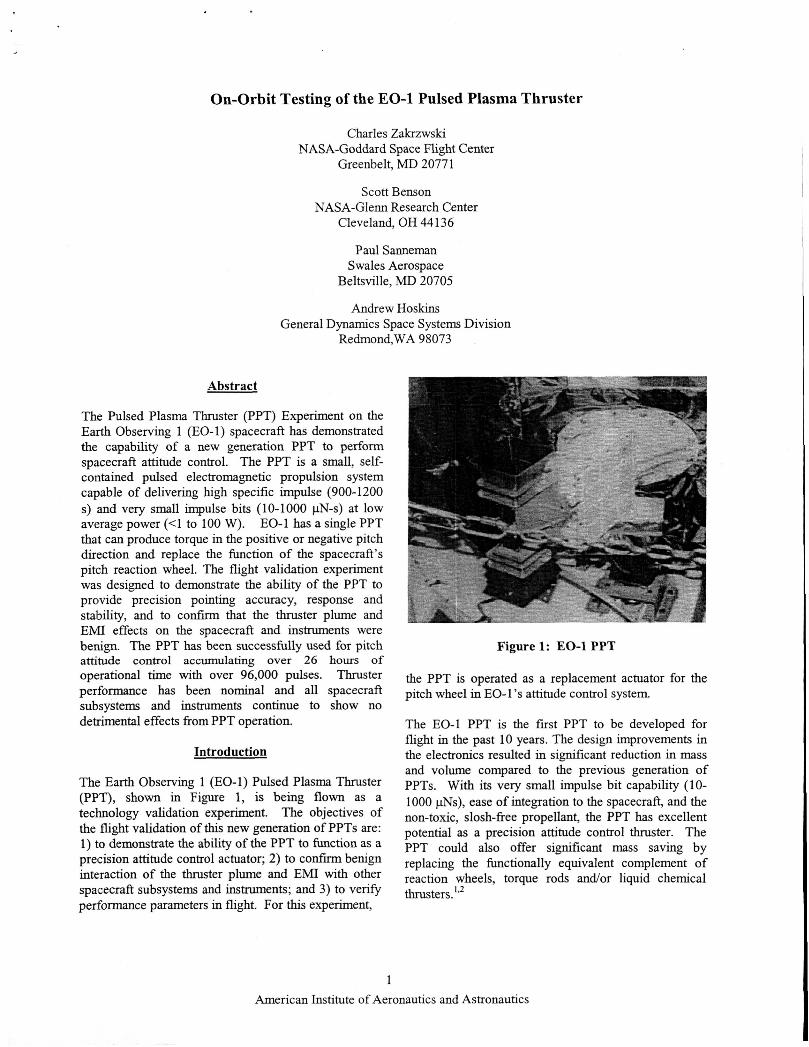
The Earth Observing 1 (EO-1) Pulsed Plasma Thruster (PPT), shown in Figure 1, is being flown as a technology validation experiment. The objectives of the flight validation of this new generation of PPTs are: 1) to demonstrate the ability of the PPT to function as a precision attitude control actuator; 2) to confirm benign interaction of the thruster plume and EM1 with other spacecraft subsystems and instruments; and 3) to verify performance parameters in flight. For this experiment,
Figure 1: EO-1 PPT
the PPT is operated as a replacement actuator for the pitch wheel in EO-1’s attitude control system.
The EO-1 PPT is the first PPT to be developed for flight in the past 10 years. The design improvements in the electronics resulted in significant reduction in mass and volume compared to the previous generation of PPTs. With its very small impulse bit capability (10- 1000 pNs), ease of integration to the spacecraft, and the non-toxic, slosh-fkee propellant, the PPT has excellent potential as a precision attitude control thruster. The PPT could also offer sigmficant mass saving by replacing the functionally equivalent complement of reaction wheels, torque rods andor liquid chemical thrusters.”*
1 American Institute of Aeronautics and Astronautics

Technology Description
Pulse Frequency
Overall ThrustRower Main Capacitor Energy
The EO-1 PPT was designed to control the pitch axis of the spacecraft by providing both positive and negative pitch torque capability. This is achieved by discharging the PPT’s main energy storage capacitor through one of two opposing electrode pairs (Side #1, Side #2). The development of the EO-1 PPT and the design of the EO-1 PPT attitude control experiment have been discussed in previous publications.39495 The key performance characteristics of the EO-1 PPT are listed in Table 1.
1 Hz
8% 8.5 - 56 J
Table 1: EO-1 PPT Characteristics
Efficiency Total Mass Fuel Mass Total Impulse (estimated)
Impulse Bit (per pulse) Specific Impulse
I 90 - 860 pNsec I 650 - 1400 sec
4.95 kg 0.07 kg per side 460 N-sec
The mechanical mounting and orientation of the PPT on the EO-1 spacecraft are shown in Figure 2.
Figure 2: PPT Mounting on EO-1 Spacecraft
On EO-1, the PPT functions as an actuator of the Attitude Control Subsystem (ACS). The Attitude Control Electronics (ACE) Input/Output card provided the interface for the PPT command and telemetry (Table 2).
The EO-1 PPT fires at the fixed ACS control rate of 1 Hz. Thrust modulation is achieved by varying the magnitude of charge on the main capacitor. This charge is directly proportional to the thrust. The magnitude of charge on the main capacitor is adjusted by controlling the duration of capacitor charge time. The ACE operates at 25 Hz whch allows the main
2
Table 2: PPT Command and Telemetry
PPT Commands: Charge Main Capacitor (0-5V logic) Fire SDark Plug # 1 (O-SVloeic)
capacitor charge time to be varied in 40 msec increments. PPT firing is accomplished by sending two commands. The first command charges the main capacitor for the selected length of time. The second command discharges either spark plug #1 (negative torque) or spark plug #2 (positive torque) to initiate main capacitor discharge through the appropriate side.
The range of allowable charge times was initially set between 160 msec (4 ACE cycles) and 920 msec (23 ACE cycles). The minimum charge duration was determined by the minimum energy at which the PPT reliably Qscharged during acceptance testing. The maximum time was set by the time needed to charge the main capacitor, fire the appropriate spark plug, and discharge the main capacitor within the 1 Hz ACS control rate.
For PPT closed-loop operation, the on-board control algorithm is nearly identical to that used for normal 3- axis reaction wheel operation. This algorithm has been described in detail in Reference 5. During PPT control, pitch torque commands fiorn a Proportional-htegral- Derivative (PID) controller are translated to PPT charge and fire commands instead of pitch wheel torque commands. The pitch integral control gain was the only adjustment made to the PID controller to accommodate PPT pitch control. During PPT pitch control mode, the roll and yaw axes continue to be controlled by reaction wheels and torquer bars.
Once in PPT control mode, a fault detection algorithm checks the number of consecutive times the PPT is commanded to fire at its maximum thrust level. If this counter exceeds a limit value it automatically transitions the spacecraft back into three-axis reaction wheel control mode. The baseline value for this counter was set at 100 counts (where one count equals one second).
American Institute of Aeronautics and Astronautics

On-Orbit Test Sequence
Day UTC
The PPT was flown as a Category 3 (non-mission critical) experiment on EO-1. Risks to the primary EO- 1 objectives due to PPT operation was eliminated by scheduling the PPT on-orbit experiment after the completion of the EO-1 primary mission objectives, including the validation of the science instruments.
Activity Comments ( cycle= ACE charge cycle)
The concern over PPT EM1 effects on the Advanced Land Imager (ALI) has been described in Reference 6 . In December 2001, the EO-1 mission was extended beyond the baseline New Millennium Program (N”) objectives. This resulted in an extensive review of the potential effect of PPT operation on other spacecraft subsystems and instruments. Additional analysis and ground testing with a breadboard PPT unit demonstrated that the PPT-radiated emissions posed minimal risk to the spacecraft and instruments6. Approval was obtained to have the Advanced Land Imager (ALI) and Atmospheric Corrector (AC) in image collection mode whle fuing the PPT. To allay concerns regarding the PPT plume contamination effects, a conservative approach was implemented by placing the Hyperion instrument in powered off and out-gassing mode during PPT operations. Imaging with the Hyperion during PPT operations is scheduled prior to the end of life disposal operations to complete HyperionPPT compatibility testing.
006-0129
Jon 6 006-1408
-Initial PPT Test Period
sec Fire Side #I , 23 cycles, 60 sec Uplink during PPT Uplink string of NOOP commands Fire Side #2,23 cycles, 60 sec
Enable PPT pitch control
Nominal
firing validated
Nominal
Nominal transition
The initial PPT tests consisted of verifymg PPT functionality as well as the health status of the spacecraft and instrument. Table 3 provides a brief chronology of the events. With the spacecraft under reaction wheel control, open loop PPT firings were commanded to verify the health of the PPT. A L I lamp calibration images were verified as nominal before proceedmg to the next sequence of PPT tests
PPT control testing was initiated with short duration closed loop control activities to venfy the ability of the spacecraft to transition into and out of PPT control. The ability of the PPT to maintain control during solar array rewind was also tested. These tests occurred while the spacecraft was in continuous communication with a ground station. The initial PPT test activities culminated in four hours (2.4 orbits) of continuous PPT pitch axis control. During this period, the spacecraft was commanded to nadir pointing with yaw steering enabled. Yaw steering improves ground target imaging by rotating the yaw axis to compensate for the Earth’s rotation. Three science Data Collection Events (DCEs) were performed with the ALI while the spacecraft was
Table 3: Test Activities (Initial Test Period)
I sec 1 Fire Side #2,23 cycles, 10 I Nominal
~
American Institute of Aeronautics and Astronautics
to PPT
in PPT control. The DCEs provided data to validate pointing performance of the PPT for science observations and to assess adverse effects of PPT operation on the instrument. All spacecraft subsystem, instrument, and PPT telemetry were nominal during the PPT operation.
Second PPT Test Period
In the second test period, the pitch axis of the spacecraft was under PPT control for a total of 10 hours over a 12- hour period. The major PPT test objectives of this period were to:
1) Obtain ALI dark imaging data to evaluate PPT stray light and EM1 noise effect on ALI images; Evaluate PPT control performance with solar array traclung disabled during DCEs (Previous
2)
3

DCEs were performed with the solar array in track mode);
3) Evaluate PPT control performance with roll and yaw wheel biasing enabled during PPT control; Determine the minimum charge level at which PPT would reliably discharge; Extend time of continuous PPT operation to obtain steady-state thermal characteristic
4)
5 )
ALI Dark Cal PPT Control Enable
The detailed activity sequence for test period #2 is shown in Table 4. The ALI dark imaging compatibility tests were successfully performed. The minimum charge length at which the PPT would successfully discharge was determined to be 3 ACE cycles (120 msec). A steady state temperature profile was also obtained. These results are discussed below.
Baseline (No PPT Firings) Nominal (s/c in Yaw
During PPT control, a Failure Detection and Correction (FDC) subroutine automatically switched the spacecraft from PPT to reaction wheel pitch control on two occasions. Although these transitions out of PPT control were not anticipated, they were not a result of anomalous PPT behavior. The FDC routine that prevents the PPT from being continuously fired at the maximum energy level for longer than a specified number of times (100 cycles in th is case) was a conservative safeguard against having the spacecraft transition into safe hold mode.
ALI DCE (Argentina) FDC#25 Tripbackto Pitch wheel control PPT Control Enable
Changed PPT Min. charge cycles from 4
The first FDC trip was caused by the response of the PPT to the large acceleration of the solar array rotation during the transition of the solar array from a parked position to the sun tracking mode. The solar array had been parked during the DCE to compare the performance of the PPT to the pitch wheel. Reducing the acceleration of the solar array or increasing the time the PPT is allowed to fire at maximum charge will prevent the spacecraft from experiencing thls FDC trip event.
Steering) Nominal Trip due to solar array tracking and Wheel Bias Disabled software flag to prevent solar tracking on subsequent DCEs Unreliable discharge at 2 ACE cycles.
The second FDC trip was caused by excessive pitch axis magnetic torque created by a change in the roll and yaw wheel speed bias commands. Wheel biasing is used to prevent attitude transients during imaging caused by wheel stiction effects. The wheel speed management algorithm computes the desired spacecraft torque vector that will cause the wheel speeds to shift toward the desired bias. This spacecraft torque is created by energizing the Magnetic Torquer Bars to create a magnetic dipole to interact with the Earth magnetic field. While the desired torque had only roll and yaw components, the resultant torque had a pitch component due to cross-product coupling. Due to the orbital location, attitude and commanded dipole, the relatively large pitch magnetic torque caused the
to 2 ACE cycles ALI DCE (East Coast) Reaction Wheel
Table 4: PPT Test Period #2 Activity Sequence
Nominal Image
Day UTC March 14 073-1240 073-1256
073-14:14 073-14: 17
073-1450
073-1 5 1 8
073-1536 073-1544
073-1627
073-16:33
073-17~13
073-17:20 073-17:46
073-1 8: 10 073-18149
073-19:07
073-23:38
(RWA) Bias change ALI Dark Cal (Cover Closed) with 10 PPT SP1 Ovenide Firings at Max Charge ALI Dark Cal (Cover Open) with 10 PPT SP1 Ovenide Firings at Max Charge ALI DCE (Great Plains) RWA Bias change ACSFDC#25Trip back to Pitch RWA control PPT Control Enable ALI DCE (Seattle, West Coast) Changed PPT Min. Cycles from 2 to 3 ACE cycles. Disable PPT Control
I Activity
Image Nominal - No EM1 effects on Dark Calibration
Image Nominal - No Stray Light effect on ALI image
Image Nominal
Trip due to Wheel Bias operation.
Zero out RWA Bias values Nominal Image
Obtained reliable discharges at min charge of 3 cycles
attitude controller to send maximum charge commands to the PPT for an extended duration. While the PPT responded properly and would have been able to compensate for this external disturbance, the FDC logic tripped when the maximum value had been commanded for 100 seconds. It is unlikely that this result would effect future spacecraft designs which will incorporate PPTs. This excessive momentum build up was an artifact of controlling one axis with the PPT and the other two with wheels and torquer bars.
Third and Fourth PPT Test Periods
The third test period allowed for over 9 hours of continuous PPT control of the pitch axis. The goals of this test opportunity were to evaluate the effect of the PPT operation on the Atmospheric Corrector (AC) and to obtain longer continuous test time with the PPT. A total of five DCEs were performed with the Atmospheric Corrector (AC). The fourth PPT test period-provided the opportunity to obtain PPT thrust
4 American Institute of Aeronautics and Astronautics

calibration data at capacitor charge levels that corresponded to ground test data. Two orbits of PPT control without yaw steering or wheel biasing were also obtained. Summaries of the third and fourth test period activities are shown in Table 5.
Day Activity (ESn
Table 5: PPT Test Period #3&4 Activity Sequence
Comments
157-2050
157 -2052
no wheel b&) Nominal 3.8 hrs of PPT control PPT thrust
Disable PPT control
Fire Side #1,23 cycles, 60 sec
It should be noted that prior to PPT operations on April 25, a flight software patch was implemented to adjust how the spacecraft generated PPT commands. The software patch corrected the command processing to prevent PPT thruster firings whenever the required pitch control torque was calculated to be less than the minimum capability of the PPT. Analysis of on-orbit data from previous PPT testing revealed the flight software fired the PPT at the minimum charge level when the calculated torque was below minimum PPT capability.
Attitude Control Results
of the PPT can be demonstrated by comparing attitude control performance obtained under PPT control with that obtained when the pitch reaction wheel was in control. The attitude control results for the science instrument DCE portion of the orbit as well as for the entire orbit are discussed in this section.
For the PPT attitude control experiment, the period of greatest interest was the DCE sequence. During a DCE, fine attitude control is critical for obtaining high quality science images. Figure 3 and Figure 5 show the pitch attitude error and pitch rate error, respectively, for ALI DCE sequences. These plots were constructed by overlaying the data from four different DCEs. The attitude error is the difference between estimated and commanded angular attitude position. The rate error is the difference between measured and commanded attitude rate.
During the ALI DCE sequence, transient pitch-axis torques are dominated by those generated from the opening and closing of the ALI cover. The plots in Figure 3 and Figure 5 have been constructed so the ALI cover opening occurs near 300 seconds into the sequence. The peak attitude error for the ALI cover open disturbance is 270 arcseconds under reaction wheel control and 310 arcseconds under PPT control. Since the EO-1 installation of the PPT does not have as much torque authority as the reaction wheel, the peak attitude error shown in Figure 3 is slightly higher for the PPT cases as compared to the reaction wheel case. However, since the ALI cover opening occurs about three minutes prior to the actual science data acquisition, the critical pointing performance occurs during the period referenced by 480-540 seconds on the plots. During this interval, the reaction wheel-based error is 10-20 arcseconds and the three PPT-based errors are 0 to 40 arcseconds. Two of the three PPT cases demonstrate better performance than the reaction wheel case during this interval. The attitude control error transient response for all cases is largely determined by the characteristics of the PID controller parameters. Note that the pitch integral control gain for the PPT is about one-fourth the wheel value. A comparison of the pitch attitude error for the ALI cover closed disturbance after the DCE cannot be made. In reaction wheel control, the ALI cover is closed at the same time the reaction wheel is zeroed and the solar array begins tracking.
The primary purpose of the EO-1 PPT on orbit validation was to demonstrate the capability of the PPT to perform the function of a precision attitude control actuator during science imaging mode. T h s capability
5 American Institute of Aeronautics and Astronautics

RlchAttitude Error Dunng C C E
-mO 100 200 300 4W 5w 600 700 800 900 Time in Sew&
:, I
-100' ' I 300 350 400 450 500 550
Tnre in Seconds
Figure 3: Pitch Attitude Error Comparison Charge Cycles for Side #1
"" I I W
2
I 300 350 400 450 500 550
Tine in Seconds
Figure 4: Main Capacitor Charge Cycles for PPT-1 DCE
Figure 4 provides the commanded PPT charge time in terms of ACE cycles for the DCE PPT-1. Only negative pitch torque is required for this period. This can be seen by the plots that show only Side #1 commands. Note that the control torque required to counteract the ALI cover opening causes the full, saturated value of the PPT (23 ACE cycles) to be commanded for about 15 seconds.
-40 I 300 350 4W 454 500 550
Time in Sem&
Figure 5: Pitch Rate Error Comparison
It can be seen that the PPT pointing performance exhlbited by the EO-1 spacecraft during DCEs has been demonstrated to be comparable to that provided by the pitch reaction wheel. While the PPT has a lower torque authority, the lack of internal momentum accumulation and the precision impulse capability enable excellent pointing performance.
Figure 6 is a collection of plots that show three axis attitude control parameters for both PPT and reaction wheel pitch control. Both sets of plots show data for over one orbital period (6000 sec) while the spacecraft is in science collection mode with yaw steering enabled. Two ALI DCE's were taken during the period shown for PPT pitch control, one at 9000 sec and another at 13,800 sec. One ALI DCE at 6750 sec occurred during the period time plotted for reaction wheel control. The integral error is shown in addtion to the position and rate error. The integral error is the controller integrated position error. The PPT charge commands and the wheel momentum show how the pitch actuators were exercised. It can be seen for all three axes that the PPT control mode compares favorably with the wheel control mode.
6 American Institute of Aeronautics and Astronautics

Rate Ernx
1 .I,: 6 8 g o r t - 7 - 8 r '
I-
rn i
Pate Error
J .c r , s o 2
-"
8 a
I 8000 9000 10000 11000 12000 13000 14000 15MM 16000
Tine in Seconds Since 07-Jz~2002 12:00:09
- 0 1000 2000 3000 4000 5000 6000 7000 8000
lime in Seconds Since 15Now2WI 07:00:07
lntegal Error Integral Error 50000 -
0 I000 2000 3000 4000 5000 6000 7000 8000 -50000
8000 9000 10000 11000 12000 13000 14000 I5OW 16000
8000 9000 10000 10000 12000 13000 14000 15000 16000 I
I 0 1000 2000 3000 4000 5000 WOO 7000 8000
-50000 I SOOM,
b
?i I -50000
0 1000 2000 3000 4000 5000 M)00 7000 8000 -50000 8000 9000 10000 11000 12000 13000 14000 15ooo lMM0
lime in Seconds Since 07-Jan2002 12:W:09 TimeinSecondsSie 15-Now2001 07M):07
PPT Chage Commands for W 1
8000 9000 10000 11000 12000 13000 14ooo 15000 16ooo Tine in Seconds Since 07-Jz~2002 12:00:09
Pitch Wheel Momentun
0 ' I 0 1000 2000 3000 4000 5000 6000 7000 8000
Tme in Seconds Since 15-NO\c200107:00:07
Figure 6: Attitude Control Parameter Comparison
7 American Institute of Aeronautics and Astronautics

SpacecraftlPPT Interaction
All spacecraft subsystems and instruments operated nominally during and after all PPT operations. The PPT operated for more than 26 hours accumulating over 96,000 pulses from the four PPT test periods. During PPT operation, all processor or other error flags generated on the spacecraft were determined to be caused by actions other than the operation of the PPT. All telemetry appeared nominal. The command uplink was venified by a sequence of test commands sent during PPT firing. There was no evidence of EMI or plume effects on other subsystems or instruments. Because there had been considerable concern over the effect the PPT may have on the scientific instruments, the verification of nominal instrument performance during and after PPT operation will be discussed in detail below.
ALI Instrument
As indicated in the timeline in Table 4, the PPT was operated incrementally as the ALI went through a verificatiodcalibration sequence between each step. ALI's standard lamp calibration tests were used to venfy the status and health of the instruments. All the lamp calibrations looked nominal and an analysis of the noise background showed no discernable difference between that seen with and without PPT operation. All ALI ground images looked nominal and showed no sign of distortion or blurring due to PPT operations. The quality of images taken under PPT control was indistinguishable fiom those taken under wheel control. An example of part of one of these images is shown in Figure 7.
To quantify the effect of the PPT operation on ALI noise and to search for stray light effects that might be caused by the PPT plume, a sequence of ALI, DCEs were taken during orbit night over the Pacific Ocean during the second PPT test period. Three 30-second images where taken, the first with the ALI cover closed and the PPT not firing, the second with the ALI cover closed and the PPT firing, and the thud with the ALI cover open and the PPT firing. The two images with the PPT firing were centered on 10 seconds of ovemde commands to fire Side #1 at the maximum charge.
The noise for each band of the ALI was calculated over the 30-second period and the image taken with the PPT not firing was used as a baseline. Figure 8 shows the plots of noise on one of the ALI's 10 Bands (Band 4) for both the baseline case and the case of the PPT firing with the cover open. There is no discernable difference in noise level between images taken with and without the PPT firing. Similar results obtained for all other bands demonstrate that the level of ALI imaging is not affected by PPT fuing.
Baseline I
PPT Firing, Cover Open
f ' l j 0 2
Figure 8: ALI Noise Comparison (Band 4)
Figure 7: ALI Image During PPT Control
8
To search for stray light effects, the mean subtracted dark current images were plotted highlighting pixels with values greater than 5 times the noise. PPT stray light effects would appear as horizontal lines. Figure 9 is a representative example of these plots. There was no indication of stray light effects from the PPT for this band and all other bands.
Bond 4
.. .. . . . . . . .. . .'. . - . .
2 6000 . .
. . . _ . . . . . . . . - .. .. . . .
-. . - E . .. . . . . . .
0 200 400 600 809 1000 1200 Dctcctor Nurnkr
Figure 9: ALI Mean Subtracted Noise (Band 4)
American Institute of Aeronautics and Astronautics

Hnerion
The Hyperion instrument has continued operating nominally after all PPT operations. Instrument state of health was verified after the initial PPT testing by instrument re-calibration. As mentioned before, because of the conservative approach taken in addressing a plume contamination concern, the Hyperion instrument was powered off and in a “warm” outgas mode during all PPT operations to date. Imaging with the Hyperion during PPT operations is scheduled prior to the end of life disposal operations to complete HyperionPPT compatibility testing.
Atmospheric Corrector
Five AC images were collected during the third PPT test period. These images are currently being processed and evaluated to determine if there is any noticeable effect caused by PPT operations. The AC instrument state of health telemetry was nominal during and after PPT all PPT operations. The AC instrument team believe that PPT operations will not have effect the AC image data.
PPT Performance
In addition to examining the closed loop attitude control response to PPT actuation, PPT voltage, temperature, and fuel bar telemetry as well as the spacecraft response to open loop PPT firings where examined to evaluate PPT performance. All telemetry has indicated nominal PPT hardware performance.
Discharge Characteristics
The on-orbit main capacitor charge and discharge voltage profile looked identical to the charge and discharge characteristic measured on the ground. Figure 10 shows the main capacitor voltage for 10 consecutive pulses on Side #1 at the maximum charge level for both the on-orbit and acceptance tests. The peak capacitor voltage of 1720 V corresponds to capacitor energy of approximately 58 J.
With the exception of the first firing on Side #2 at a charge level of 4 ACE cycles (1 60 msec), there was no evidence of off-nominal charge or discharge characteristics of the main capacitor within the PPT’s qualified range of charge levels. The possibility of a misfire at the initial firing of the PPT at the lowest charge levels had been anticipated. Ground test experience indicated that the PPT may not initially discharge after an extended period of inactivity because of oxidation and other factors that effect the discharge
Main Capacitcr Voltage 1800 r I
Time (msec)
Figure 10: Main Capacitor Voltage
surfaces of the sparkplug. The oxidation is removed and discharging at the minimum energy levels is possible after a PPT spark plug is successfully discharged. On EO-1, once Side #2 was successfully discharged, all subsequent attempts to fire Side #2 at the 4 ACE charge magnitude were successful.
The minimum allowable charge level for the PPT main capacitor was reduced from 4 ACE cycles to 3 ACE cycles after testing revealed that both sides of the PPT would reliably fire at this lower level. Based on ground measurements, this lower charge level changed the lowest possible minimum impulse bit from 90 pN-s to 50 pN-s. Tests with a further reduction of the minimum main capacitor charge time to 2 ACE cycles (80 msec) showed that the PPT would not reliably fire at this lower level. During a portion of the test period, the PPT failed to fire 123 times out of 21 1 attempts to discharge the PPT at the 2 ACE cycle charge level.
Spark plug voltage telemetry indicated both sparkplugs performed as expected. Two sparkplug capacitors, one for each thrust direction, are simultaneously charged during main capacitor charging. The appropriate capacitor is discharged through its associated sparkplug to initiate PPT firing. Spark plug charge voltage is captured at two different ACE time cycles each second, the cycle before discharge and the last cycle, cycle 25. Figure 11 shows both spark plug voltages at ACE cycle 25 for a sequence of h n g s at maximum charge level. Ten pulses on Side #1 are followed by ten pulses on Side #2. In Figure 11, the sparkplug that was discharged has a much lower voltage during the firing period than the sparkplug that was not commanded to discharge. This indicates a good sparkplug discharge on the side that was commanded to fire and that the side that was not commanded charged properly and then slowly bled down as expected.
9 American Institute of Aeronautics and Astronautics

Figure 11: Spark Plug Voltage at Ace Cycle 25
Prouellant Consumption
The total cumulative number of pulses at each commanded charge level, given in terms of the number of ACE cycles, is shown in Table 6. The estimated total fuel consumption of the PPT, fiom extrapolated ground test data of specific impulse as a function of capacitor charge level, is also shown. Less than 2.3% of the total fuel has been used based on an estimated total usable propellant of 69.5 g per side.
Table 6: Charge Level and Fuel Estimation Summary
Fuel bar readings .from the cumulative on-orbit firing time of the PPT were not sufficient to obtain reliable fuel consumption measurements. The fuel bar telemetry points relate the linear distance the fuel bar travels as it is consumed. The resolution of the fuel bar
measurements coupled with what appears to be thermal noise has made it impossible to discern fuel consumption with the total amount of PPT operation experienced to date. It should be noted that during PPT protoflight qualification testing it was determined that the Side # 1 fuel bar reading was anomalous due to a manufacturing defect in the resistive strip. Because the fuel bar readmgs are not critical for PPT operation, the PPT was launched with the understanding that the Side #1 telemetry could not be relied upon but that it may provide useful readings at some portion of the fuel consumption.
Temuerature Effects
The PPT operated as expected over the entire range of temperatures experienced on-orbit. The maximum PPT temperatures during PPT operation were approximately 10 degrees higher than anticipated. After initial testing it was uncertain whether the PPT temperatures would rise above the operational temperature limits under extended continuous operation. The upper temperature limit is 54 "C for the PPT main capacitor and 110 "C for the PPT transformer electronics. During the second test period, a steady state temperature profile was achieved that indicated the PPT could be operated continuously without exceeding temperature limits. Figure 12 shows both the transformer and main capacitor temperature profiles obtained for th~s period. Subsequent PPT tests also showed similar results with the PPT approaching but not exceeding its maximum operating temperatures.
FPT Temoerature
"0 MW 10000 15oM1 20000 Time (sec) from2002-073 -17:30
Figure 12: PPT Temperature Profile
Acknowledgements
The authors of this paper would like to acknowledge the work of Seth Shulman and the entire EO-1 flight operations team who provided support for the PPT operations. Dr. Jeff A. Mendenhall of MIT Lincoln
10 American Institute of Aeronautics and Astronautics

Laboratories is also acknowledged for his outstanding support of PPT experiment in processing and analyzing the ALI image and instrument state of health data. A special thanks and acknowledgement is given to Nick Speciale of NASNGoddard Space Flight Center (GSFC), the EO-1 Lead Technologist. Without his persistence and dedication, on-orbit testing of the EO-1 PPT would not have been possible.
Summary
The Pulsed Plasma Thruster has been successfully validated as a precision attitude control thruster on the EO-1 spacecraft. The PPT has been demonstrated to be compatible with all spacecraft subsystems and instruments as tested to date. Hyperion instrument imaging during PPT control is scheduled for the end of EO-1 mission life and will complete PPT compatibility tests. All PPT performance parameters appear nominal and correspond well with ground measurements. Additional testing of the PPT is scheduled to complete performance evaluation and to provide better assessment of its life capabilities.
Minor issues with PPT fuel bar readings, PPT temperature predictions, and predictions of non-PPT attitude disturbances have not sigmfkantly affected the on-orbit evaluation of the EO-1 PPT. The success of the EO-1 PPT Flight Validation Experiment enables this new generation of PPT technology to be considered for future missions with negligible risk. This experiment has been the collaborative effort of NASA GFSC, NASA Glenn Research Center, General Dynamics Space Systems Division and Swales Aerospace in partnership with the Hammers Company.
Acronvms
AC - Atmospheric Corrector ACE - Attitude Control Electronics ACS - Attitude Control Subsystem DCE - Data Collection Event EM1 - Electromagnetic Interference EO-1 - Earth Observing One FDC - Failure Detection and Correction GSFC - Goddard Space Flight Center NMP - New Millennium Program PID - Proportional Integral Derivative PPT - Pulsed Plasma Thruster RWA - Reaction Wheel Assembly SIC - spacecraft
References
Cassady, R.J., Moms, J.P., Vaughan, C.E., Willey, M.J., ‘mew Attitude Control Strategies Using Pulsed Plasma Thruster Systems,” AAS 98-065, February, 1998
1
Cassady, R.J., Morris, J.P., Vaughan, C.E., Willey, M.J., “New Attitude Control Strategies Using Pulsed Plasma Thruster Systems,” AAS 98-065, February, 1998
2
Benson, S.W., Arrington, L.A., Hoskins, W.A., “Development of a PPT for the EO-1 Spacecraft”, AIAA Joint Propulsion Conference, AIAA-99-2276, June 1999
3
Anrington, L.A., Haag, T.W., “Multi-Axis Thrust Measurements of the EO-1 Pulsed Plasma Thruster”, AIAA Joint Propulsion Conference, AIAA 99-2290, June
C Zalawski, P. Sanneman, T. Hunt, K. Blackman, “Design of the EO-1 Pulsed Plasma Thruster Attitude Control Experiment”, AIAA Joint Propulsion Conference, AIAA-2001-3637, July 2001
Hoskins, W. A. , Sarmiento, C., Rayburn, C. and Campbell, M.E. “The Electromagnetic Compatibility of Pulsed Plasma Thrusters with Spacecraft Systems.” AIAA-2002-3979.38& Joint Propulsion Conference, Indianapolis, Indiana, 2002.
6
Hoskins, W.A., Wilson, M.J., Willey, M.J., Meckel, 7
N.J., Campbell, M. Chung, S., “PPT Development Efforts at Primex Aerospace Company”, AIAA 99- 2291, June 1999.
11 American Institute of Aeronautics and Astronautics