On Meeting Gender Data Needs in Agriculture in the … On Meeting Gender Data Needs in Agriculture...
23
1 On Meeting Gender Data Needs in Agriculture in the Philippines FAO Sub-Regional Workshop on Sex-Disaggregated Data in Agriculture and Rural Development for Southeast Asian Countries 13-16 November 2012, Bangkok, Thailand Prepared by: MS. MECHELLE M. VIERNES Philippine National Statistical Coordination Board and MS. EMERLYN BAES Bureau of Agricultural Statistics
Transcript of On Meeting Gender Data Needs in Agriculture in the … On Meeting Gender Data Needs in Agriculture...

1
On Meeting Gender Data Needs in Agriculture in the Philippines
FAO Sub-Regional Workshop on Sex-Disaggregated Data in Agriculture
and Rural Development for Southeast Asian Countries 13-16 November 2012, Bangkok, Thailand
Prepared by:
MS. MECHELLE M. VIERNES Philippine National Statistical Coordination Board
and
MS. EMERLYN BAES Bureau of Agricultural Statistics

2
Outline of the Presentation
1. Introduction
2. Efforts of the Philippine Statistical System (PSS) on the Compilation of Gender Statistics
3. Gender Statistics in Agriculture
4. Women and Men in Agriculture: What the Statistics Says?
5. Data Coherence Challenges
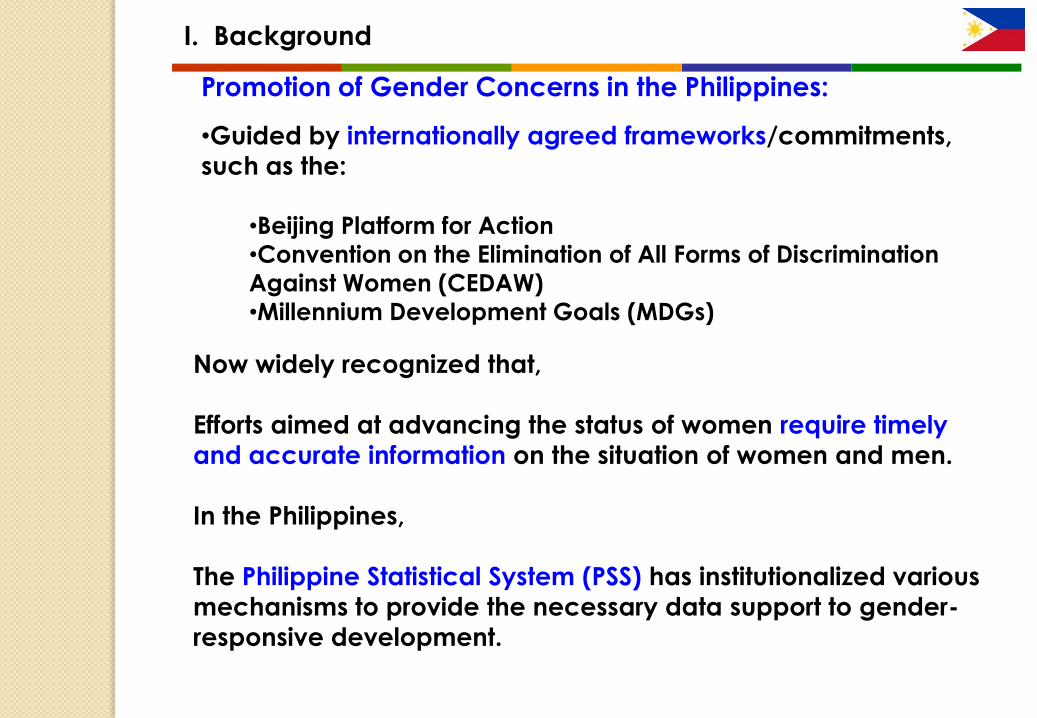
I. Background
Promotion of Gender Concerns in the Philippines:
•Guided by internationally agreed frameworks/commitments,
such as the:
•Beijing Platform for Action
•Convention on the Elimination of All Forms of Discrimination
Against Women (CEDAW)
•Millennium Development Goals (MDGs)
Now widely recognized that,
Efforts aimed at advancing the status of women require timely
and accurate information on the situation of women and men.
In the Philippines,
The Philippine Statistical System (PSS) has institutionalized various
mechanisms to provide the necessary data support to gender-
responsive development.
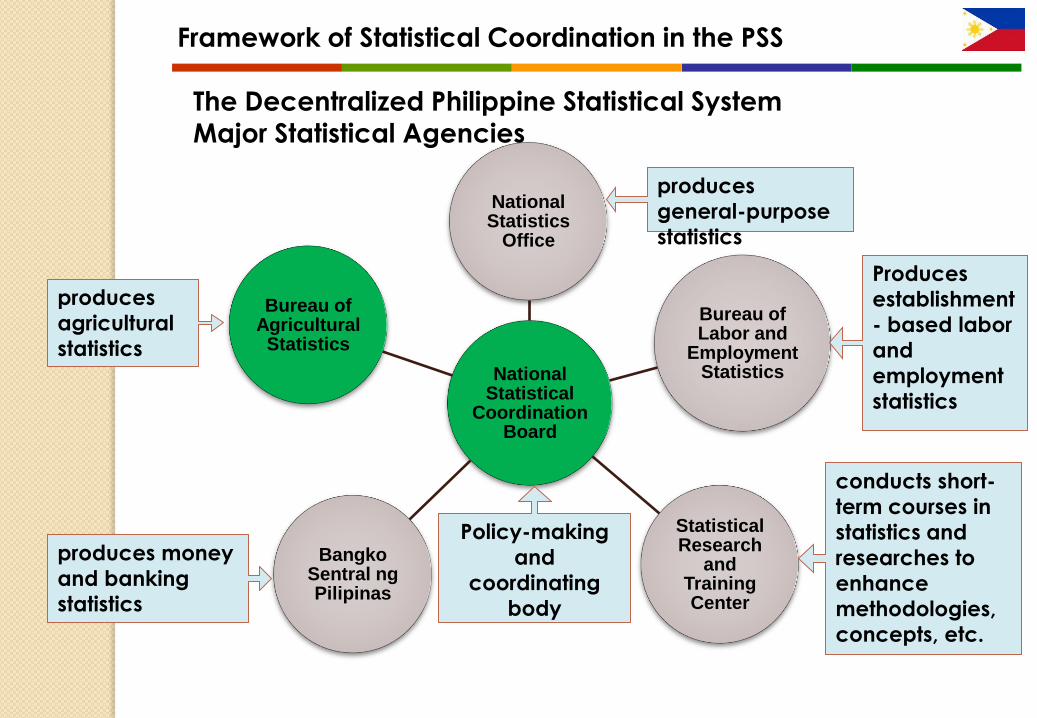
Framework of Statistical Coordination in the PSS
National Statistical
Coordination Board
National Statistics
Office
Bureau of Labor and
Employment Statistics
Statistical Research
and Training Center
Bangko Sentral ng Pilipinas
Bureau of Agricultural
Statistics
produces
general-purpose
statistics
Produces
establishment
- based labor
and
employment
statistics
produces
agricultural
statistics
produces money
and banking
statistics
conducts short-
term courses in
statistics and
researches to
enhance
methodologies,
concepts, etc.
Policy-making
and
coordinating
body
The Decentralized Philippine Statistical System
Major Statistical Agencies

1. NSCB Resolutions enjoining different agencies to promote
gender concerns in the generation of statistics, approving
statistical frameworks on gender and development indicator
systems
2. Official Concepts and Definitions for Statistical Purposes on
the Gender and Development Sector
II. Efforts of the Philippine Statistical System in the Compilation
of Gender Statistics
A. Statistical Policies on Gender Statistics
B. Coordination Mechanisms on Gender Statistics
1. Interagency Committee on Gender Statistics(IACGS)
2. Philippine Statistical Development Plan (PSDP) Chapter on
Statistics on Children and Gender and Development
3. Gender and Development Focal System in the Department of
Agriculture
4. National Convention on Statistics (NCS)
5. National Statistics Month

6
C. Regular PSS statistical products and services - (BAS)
3. 1 Agricultural Labor Survey (ALS)
• Presents in tables and analysis on :
• Sex disaggregated wage rates statistics in the
agricultural sector, particularly in the palay, corn,
coconut and sugarcane farms;
• average labor utilization by farm activity and by
source; and
• extent of women’s participation in agriculture
production activities.
II. Efforts of the PSS on the Compilation of Gender Statistics
3. 2 Gender-Based Indicators of Labor and
employment in Agriculture
• Presents in tables and analysis on the sex-
disaggregated labor and employment in agriculture:
-Working Age Population -Employment
-Labor Force Participation -Unemployment
-Visible Underemployment
-Participation in Farming Activities
-Agricultural Wage Rates
7
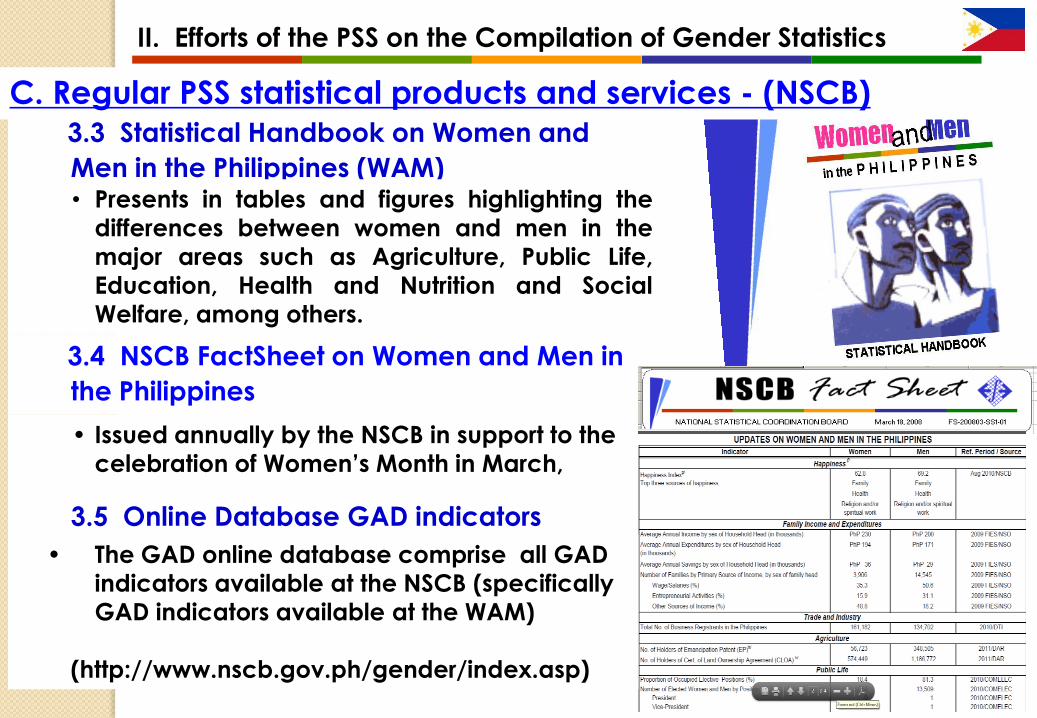
3.3 Statistical Handbook on Women and
Men in the Philippines (WAM) • Presents in tables and figures highlighting the
differences between women and men in the
major areas such as Agriculture, Public Life,
Education, Health and Nutrition and Social
Welfare, among others.
II. Efforts of the PSS on the Compilation of Gender Statistics
3.4 NSCB FactSheet on Women and Men in
the Philippines
• Issued annually by the NSCB in support to the
celebration of Women’s Month in March,
3.5 Online Database GAD indicators
• The GAD online database comprise all GAD
indicators available at the NSCB (specifically
GAD indicators available at the WAM)
(http://www.nscb.gov.ph/gender/index.asp)
C. Regular PSS statistical products and services - (NSCB)

8
III. Gender Statistics in Agriculture
Statistical indicator Data
Disaggregation
Source of Data Frequency
of Conduct
Data
Available
Percentage of
agricultural
households or
holdings
By Sex of
Household
Head
By Region
By Province
By Municipality
Census on
Population and
Housing
(CPH)
Every 10
years
2000
Women Beneficiaries
of Agricultural Credit
Through Grameen
Bank Replication
Program
By Sex Agricultural
Credit Policy
Council,
Department of
Agriculture
1995
Recipients of
Extension Services
By Sex Department of
Agriculture
Annual 2009-2011
A. Selected key gender data in agriculture indicators

9
III. Gender Statistics in Agriculture
Statistical indicator Data
Disaggregation
Source of Data Frequency
of Conduct
Data
Available
Distribution of
Households by
agricultural land
ownership
By Sex
By Region
By Province
By Municipality
Census on
Population and
Housing
(CPH)
Every 10
years
2000
Percentage of
Agricultural Operators
By Sex
By Region
By Province
By Municipality
Census on
Agriculture and
Fisheries
(CAF)
Every 10
years
1991,
2002,
(will be
conducte
d again
in 2012) Percentage
Distribution of
Members in
Household with
Agricultural Operators
Engaged in
Agricultural Activities
By Sex
By Type of
Holding
B. Other Gender Data in Agriculture ( Census-based)

10
III. Gender Statistics in Agriculture
Statistical indicator Data
Disaggregation
Source of
Data
Frequency of
Conduct
Data
Available
• Percentage
Distribution of Hired
Workers
National, Regional
By Sex
By term of payment
Agricultural
Labor Survey
(ALS) of the
BAS
Semi-Annual
(selected crops
i.e, palay and
corn)
Annual
(selected crops,
i.e., coconut
and sugarcane)
1974-2011
• Women’s
participation in
farming activities
National
by sex
by farm activity • Labor Utilization
• Nominal/real Wage
rate in agriculture
National, Regional
By sex
• Proportion of
employed workers in
agriculture
National, Regional
By sex
Labor Force
Survey of the
NSO
Quarterly 2006 - Jul
2012
• Proportion of
unemployed workers
in agriculture
• Proportion of visibly
underemployed in
agriculture
B. Other Gender Data in Agriculture ( Survey-based)

11
III. Gender Statistics in Agriculture
Statistical indicator Data
Disaggregation
Source of Data Frequency of
Conduct
Data Available
• Holders of
Emancipation
Patent (EP)
By Sex Department of
Agrarian Reform
(DAR)
Annual 1992-2010
• Holders of
Certificate of
Land Ownership
Agreement
(CLOA)
B. Other Gender Data in Agriculture
( Administrative-based)

IV. Women and Men in Agriculture: What the Statistics Says?
Snapshot : Facts on Men and Women Population: 92,337,852 million
Sex ratio: 102 males per 100 females
Employment:
Proportion of employed workers, by sex, 2011
Male:60.8%
Female:39.2%
Income:
Share of the average annual income by sex of household head, 2009
Male:52.7%
Female:47.3%
Poverty Incidence for the Basic Sectors in 2009:
Fishermen: 35.4%
Farmers: 38.9%
Women: 24.3%
Poor Underemployed:
Agriculture, forestry and hunting: 60.7%
Fishing:7%
Happiness Index, 2010: Women: 62.8%
Men:69.2%

IV. Women and Men in Agriculture: What the Statistics Says?
A. Agricultural Operators
Male operators dominated agriculture sector. Of the 4.8 million
agricultural operators, 89 percent are males while only 11 percent are
females.
89%
11%
male
female
Proportion of Agricultural Operators, by Sex :2002
Source: 2002 Census on Agriculture and Fisheries
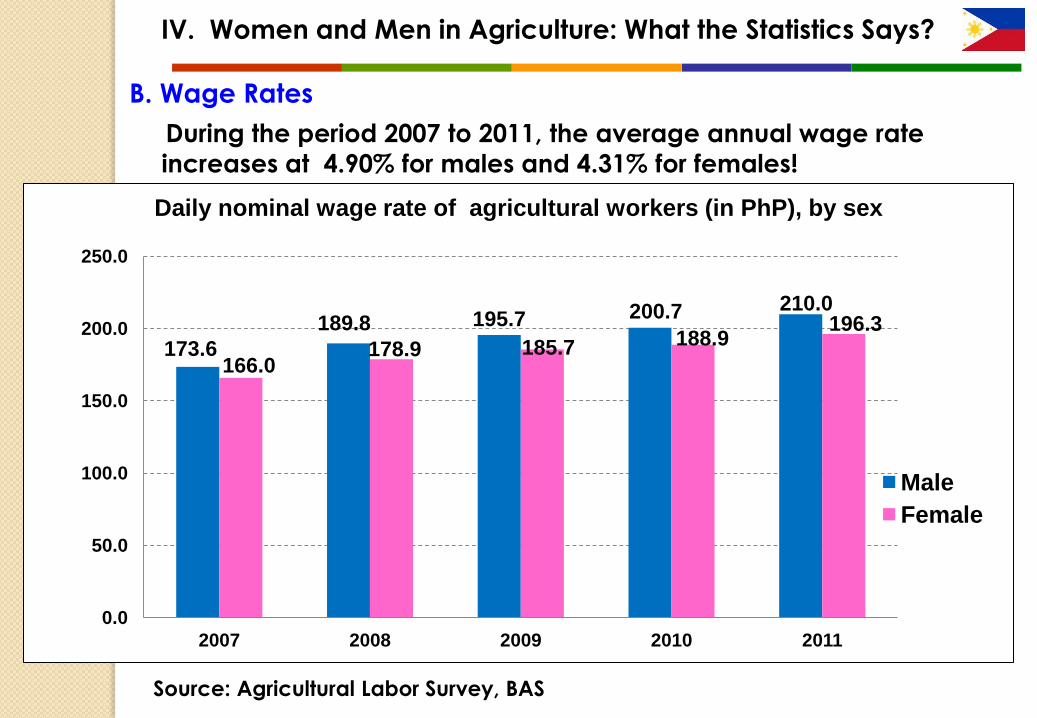
IV. Women and Men in Agriculture: What the Statistics Says?
B. Wage Rates
During the period 2007 to 2011, the average annual wage rate
increases at 4.90% for males and 4.31% for females!
173.6
189.8 195.7 200.7 210.0
166.0 178.9 185.7 188.9
196.3
0.0
50.0
100.0
150.0
200.0
250.0
2007 2008 2009 2010 2011
Daily nominal wage rate of agricultural workers (in PhP), by sex
Male
Female
Source: Agricultural Labor Survey, BAS

74.4 74.7 74.4 74.3 74.1
25.6 25.3 25.6 25.7 25.9
0.0
10.0
20.0
30.0
40.0
50.0
60.0
70.0
80.0
2007 2008 2009 2010 2011
Proportion of employed in agriculture
Male Female
C. Employment Status in Agriculture
67.5 68.3 67.5 66.8 66.8
32.5 31.7 32.5 33.2 33.2
-
10.0
20.0
30.0
40.0
50.0
60.0
70.0
80.0
2007 2008 2009 2010 2011
Proportion of underemployed in agriculture
Male Female
IV. Women and Men in Agriculture: What the Statistics Says?
• The proportion of employed and visibly underemployed female workers in
agriculture continued to increase from 2008 to 2011!
• The trend shows that 7 out of 10 workers in the agriculture comprise of men
while only 3 out of 10 workers were women.
Source: Labor Force Survey, NSO

D. Agricultural Extension Services
• As of October 2012, 46 percent of clientele of agricultural extension
services is female!
54% 46%
Clientele of Agricultural Extension Services: 2012
Male
Female
IV. Women and Men in Agriculture: What the Statistics Says?
Source: Agricultural Training Institute, Department of Agriculture

women 14%
men 86%
Proportion of Emancipation Patent Holder, by sex:2011
D. Emancipation Patent and Cert. of Land Ownership Holders
women 33%
men 67%
Proportion of Cert. of Land Ownership Agreement (CLOA)
Holders: 2011
• In 2011, almost 4 out of 10 Certificate of Land Ownership Agreement Holders
were women while only 2 out of 10 women are emancipation patent holder !
IV. Women and Men in Agriculture: What the Statistics Says?
Source: Department of Agricultural Reform

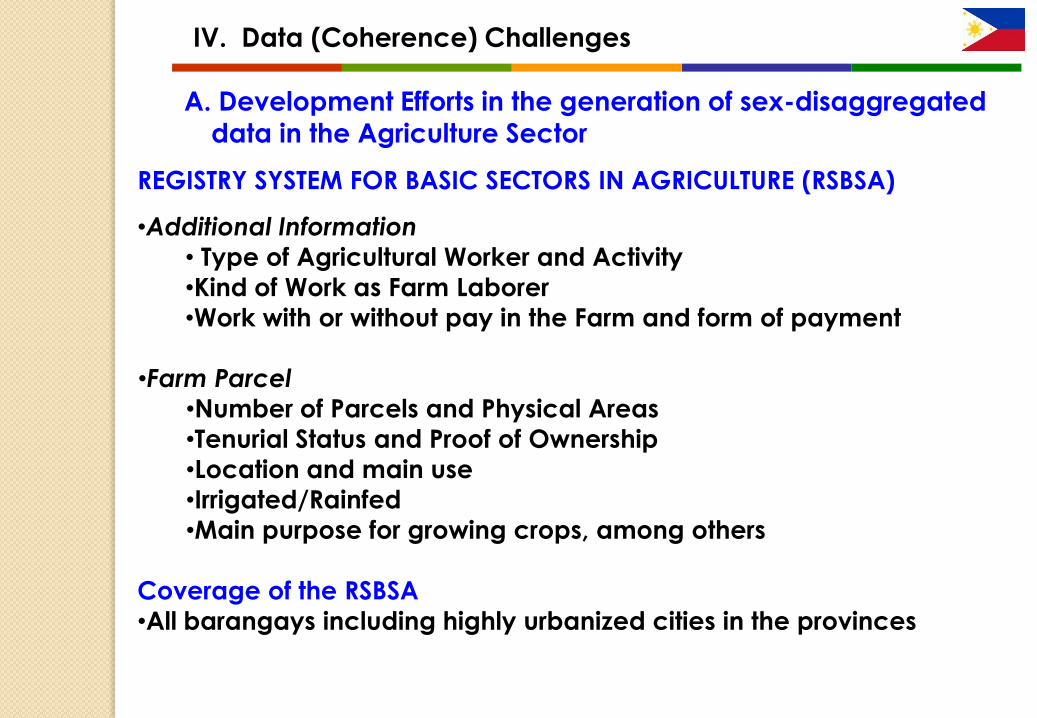
A. Development Efforts in the generation of sex-disaggregated
data in the Agriculture Sector
IV. Data (Coherence) Challenges
REGISTRY SYSTEM FOR BASIC SECTORS IN AGRICULTURE (RSBSA)
-electronic compilation of basic information on farmers, farm laborers
and fishermen
-The RSBSA was established to achieve the following objectives:
• to gather demographic and socio-economic characteristics of
the farmers, farm laborers and fisherman, selected
characteristics of the farm
• to provide information on the main purpose for farming and/or
fishing activity is for household consumption or for sale
• to provide data on selected characteristics of the fishing activity
and type of aquafarm

A. Development Efforts in the generation of sex-disaggregated
data in the Agriculture Sector
IV. Data (Coherence) Challenges
REGISTRY SYSTEM FOR BASIC SECTORS IN AGRICULTURE (RSBSA)
Scope of the RSBSA
• Profile of the Farmer, Farm laborer and Fisherman
• Name of Farmer/Farm Laborer
•Sex
•Age
•Birthdate
•Marital Status
•Highest educational attainment
•Whether with other sources of income
•Membership in Agriculture/Fisheries Organization
•Whether the household is a beneficiary of the CCT, among others
A. Development Efforts in the generation of sex-disaggregated
data in the Agriculture Sector
IV. Data (Coherence) Challenges
REGISTRY SYSTEM FOR BASIC SECTORS IN AGRICULTURE (RSBSA)
•Additional Information
• Type of Agricultural Worker and Activity
•Kind of Work as Farm Laborer
•Work with or without pay in the Farm and form of payment
•Farm Parcel
•Number of Parcels and Physical Areas
•Tenurial Status and Proof of Ownership
•Location and main use
•Irrigated/Rainfed
•Main purpose for growing crops, among others
Coverage of the RSBSA
•All barangays including highly urbanized cities in the provinces

A. Development Efforts in the generation of sex-disaggregated
data in the Agriculture Sector
IV. Data (Coherence) Challenges
Status of the Implementation of RSBSA
• The 1st batch of the registration activity was completed in January
2012, covering 20 provinces out of 79
•The 2nd batch will be undertaken from October to November 2012 covering the rest of the provinces
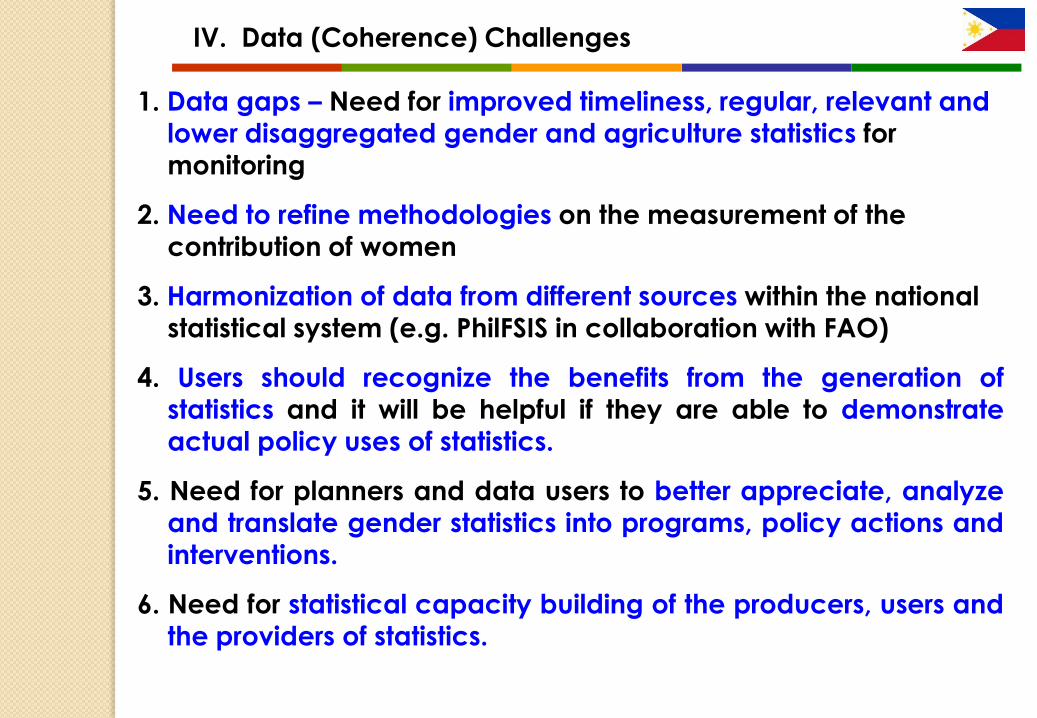
1. Data gaps – Need for improved timeliness, regular, relevant and
lower disaggregated gender and agriculture statistics for
monitoring
2. Need to refine methodologies on the measurement of the
contribution of women
3. Harmonization of data from different sources within the national
statistical system (e.g. PhilFSIS in collaboration with FAO)
4. Users should recognize the benefits from the generation of
statistics and it will be helpful if they are able to demonstrate actual policy uses of statistics.
5. Need for planners and data users to better appreciate, analyze
and translate gender statistics into programs, policy actions and
interventions.
6. Need for statistical capacity building of the producers, users and
the providers of statistics.
IV. Data (Coherence) Challenges

23
Maraming Salamat Po!
URL: http://www.nscb.gov.ph
http://www.bas.gov.ph