
ON LOW CARBON DEVELOPMENT AND NATIONALLY …
69
THE SECOND CAPACITY BUILDING WORKSHOP ON LOW CARBON DEVELOPMENT AND NATIONALLY APPROPRIATE MITIGATION ACTIONS PROCEEDINGS ORGANIZED BY DEPARTMENT OF METEOROLOGY, HYDROLOGY AND CLIMATE CHANGE, MINISTRY OF NATURAL RESOURCES AND ENVIRONMENT OF VIET NAM IN COOPERATION WITH UNITED NATIONS ENVIRONMENT PROGRAMME’S RISOE CENTRE IN DENMARK 16-18 December 2013, Hai Phong City, Viet Nam
Transcript of ON LOW CARBON DEVELOPMENT AND NATIONALLY …
THE SECOND CAPACITY BUILDING WORKSHOP
ON LOW CARBON DEVELOPMENT AND NATIONALLY APPROPRIATE MITIGATION ACTIONS
PROCEEDINGS
ORGANIZED BY DEPARTMENT OF METEOROLOGY, HYDROLOGY AND CLIMATE CHANGE, MINISTRY OF NATURAL RESOURCES AND ENVIRONMENT OF VIET NAM
IN COOPERATION WITH UNITED NATIONS ENVIRONMENT PROGRAMME’S RISOE CENTRE IN DENMARK
16-18 December 2013, Hai Phong City, Viet Nam

Table of contents
ABBREVIATIONS ................................................................................................... i
PREFACE ................................................................................................................. ii
PHOTOS FROM THE WORKSHOP ..................................................................... iv
ORGANIZATION OF THE WORKSHOP ............................................................. ix
PART I. REPORT OF THE WORKSHOP
Attendance ............................................................................................................. 2
Workshop Chairs.................................................................................................... 2
Key contents ........................................................................................................... 3
PART II. PRESENTATIONS AT THE WORKSHOP
I. Opening session ...............................................................................................16
II. LCDS Component ...........................................................................................18
2.1. Current status and development plan of RE in Viet Nam ........................18
2.2. Alternative Policy Scenarios for RE development in Viet Nam ..............21
2.3. A review of LCDS for RE development in Viet Nam ..............................26
III. Development of Wind Power NAMA in Viet Nam ......................................31
3.1. General introduction on the development of Wind Power NAMA ..........31
3.2. Baseline and Policy Scenario Development for Wind Power NAMA .....32
3.3. Barriers for the implementation of Wind Power NAMA in Viet Nam ....35
3.4. Towards 100% RE in Denmark in 2020 – the role of wind energy .........36
3.4. Future activities of Wind Power NAMA in Viet Nam .............................38
IV. Development of Biogas NAMA in Viet Nam ...............................................40
4.1. Overview of Biogas NAMA: Difficulties, Challenges and Solutions ......40
4.2. Baseline and scenario policy development for the Biogas NAMA ..........42
4.3. Biogas NAMA: Barriers and Measures for effective implementation in
Viet Nam ..........................................................................................................45
4.3. NAMA for promoting use of Biogas ........................................................46
4.4. Action plan for Biogas NAMA in Viet Nam ............................................47
Updated work plan for FIRM in Viet Nam & further capacity building
arrangements by URC & UNEP ..........................................................................49
ANNEXES
i
ABBREVIATIONS APS Alternative Policy Scenario
BAU Business as usual
BOD Biochemical Oxygen Demand
COD Chemical Oxygen Demand
DMHCC Department of Meteorology, Hydrology and Climate Change
FIRM Facilitating Implementation and Readiness for Mitigation
GHG Greenhouse Gas
IMHEN Institute of Meteorology, Hydrology and Environment
LCDS Low Carbon Development Strategy
LEAP Long- range Energy Alternatives Planning System
MARD Ministry of Agriculture and Rural Development
MOIT Ministry of Industry and Trade
MONRE Ministry of Natural Resources and Environment
MRV Measurement, Reporting and Verification
NAMAs Nationally Appropriate Mitigation Actions
NGOs Non-Government Organizations
RE Renewable energy
UNEP United Nations Environment Programme
UNFCCC United Nations Framework Convention on Climate Change
URC UNEP Risoe Centre
ii
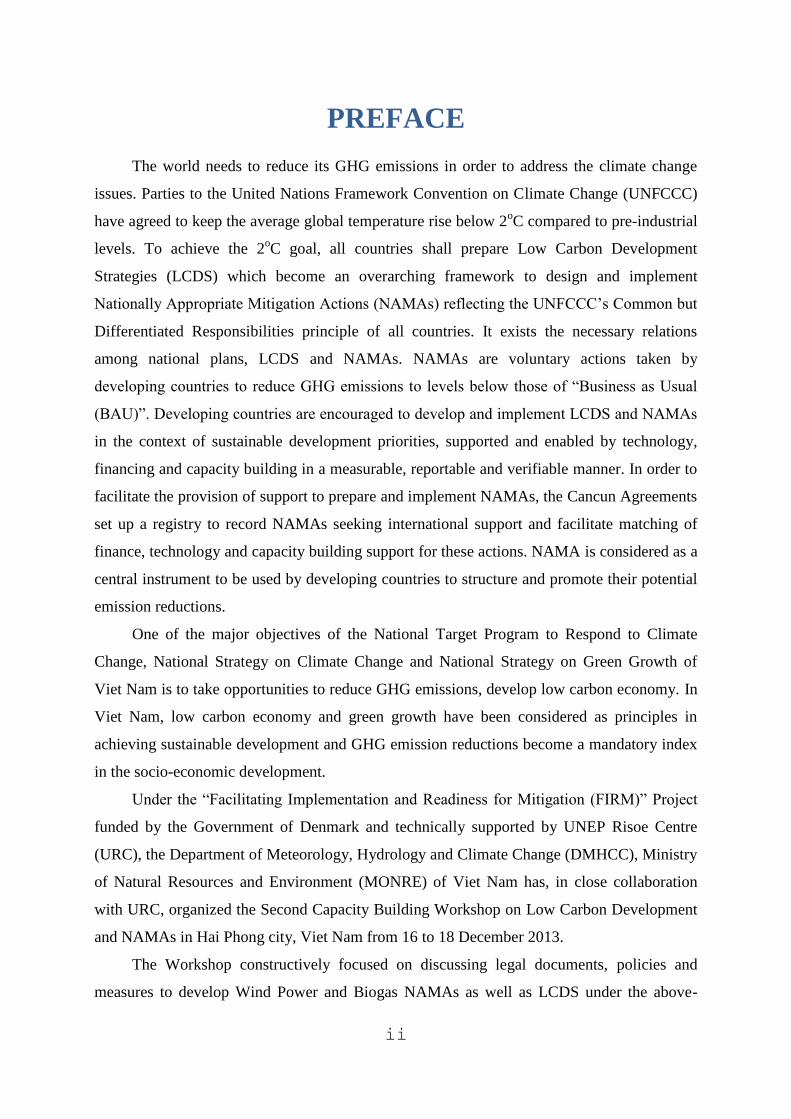
PREFACE
The world needs to reduce its GHG emissions in order to address the climate change
issues. Parties to the United Nations Framework Convention on Climate Change (UNFCCC)
have agreed to keep the average global temperature rise below 2oC compared to pre-industrial
levels. To achieve the 2oC goal, all countries shall prepare Low Carbon Development
Strategies (LCDS) which become an overarching framework to design and implement
Nationally Appropriate Mitigation Actions (NAMAs) reflecting the UNFCCC‟s Common but
Differentiated Responsibilities principle of all countries. It exists the necessary relations
among national plans, LCDS and NAMAs. NAMAs are voluntary actions taken by
developing countries to reduce GHG emissions to levels below those of “Business as Usual
(BAU)”. Developing countries are encouraged to develop and implement LCDS and NAMAs
in the context of sustainable development priorities, supported and enabled by technology,
financing and capacity building in a measurable, reportable and verifiable manner. In order to
facilitate the provision of support to prepare and implement NAMAs, the Cancun Agreements
set up a registry to record NAMAs seeking international support and facilitate matching of
finance, technology and capacity building support for these actions. NAMA is considered as a
central instrument to be used by developing countries to structure and promote their potential
emission reductions.
One of the major objectives of the National Target Program to Respond to Climate
Change, National Strategy on Climate Change and National Strategy on Green Growth of
Viet Nam is to take opportunities to reduce GHG emissions, develop low carbon economy. In
Viet Nam, low carbon economy and green growth have been considered as principles in
achieving sustainable development and GHG emission reductions become a mandatory index
in the socio-economic development.
Under the “Facilitating Implementation and Readiness for Mitigation (FIRM)” Project
funded by the Government of Denmark and technically supported by UNEP Risoe Centre
(URC), the Department of Meteorology, Hydrology and Climate Change (DMHCC), Ministry
of Natural Resources and Environment (MONRE) of Viet Nam has, in close collaboration
with URC, organized the Second Capacity Building Workshop on Low Carbon Development
and NAMAs in Hai Phong city, Viet Nam from 16 to 18 December 2013.
The Workshop constructively focused on discussing legal documents, policies and
measures to develop Wind Power and Biogas NAMAs as well as LCDS under the above-
iii
mentioned Project. Hence, the Workshop has helped participants to enhance understanding of
low carbon development as well as analytical, methodological approaches to NAMAs
development and Measurement, Reporting and Verification (MRV) systems and provided a
valuable opportunity for participants to share useful information and exchange experiences for
developing LCDS, formulating Wind Power and Biogas NAMAs in Viet Nam and also
overcoming the barriers in the implementation of NAMAs.
Finally, I would like to take this opportunity to express my sincere thanks to experts
from URC for their generous support and to all participants of the workshop for their active
and constructive contribution to the successful Workshop.
Nguyen Khac Hieu
Deputy Director General
Department of Meteorology, Hydrology and Climate Change
Ministry of Natural Resources and Environment, Viet Nam
iv
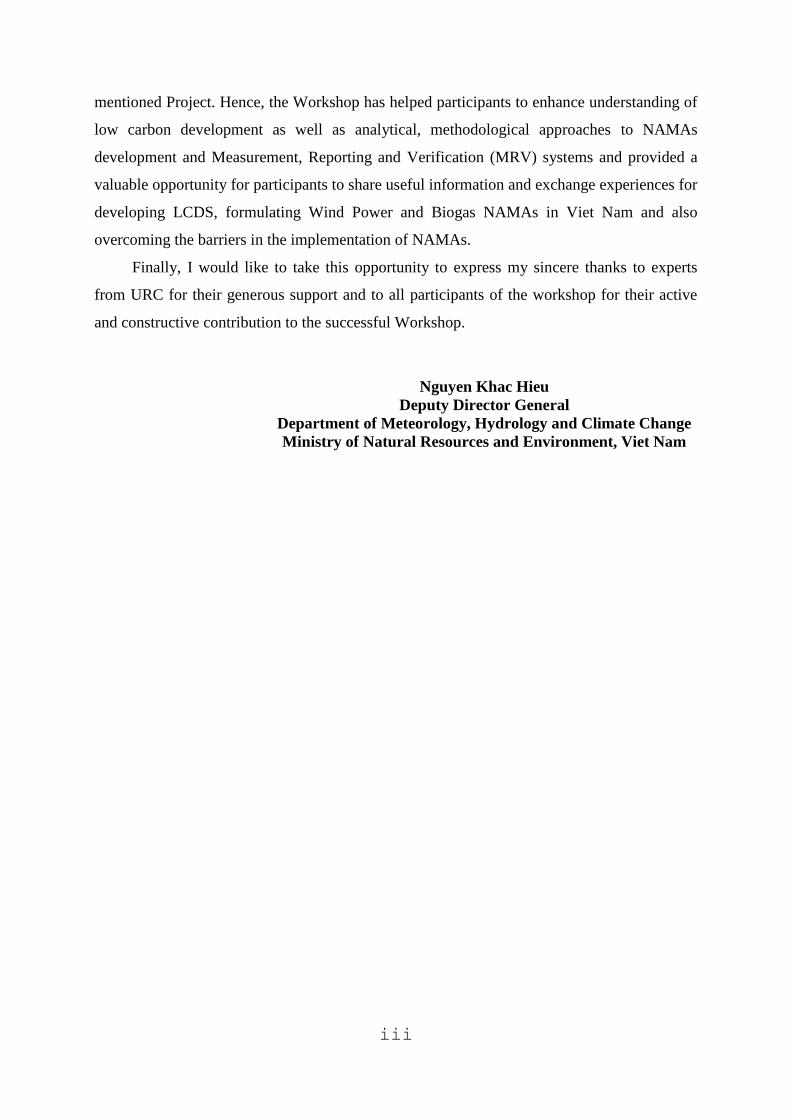
PHOTOS FROM THE WORKSHOP 1- Opening session
Mr. Hoang Manh Hoa, Director, Division of GHG
Emission Monitoring and Low Carbon Economy,
DMHCC, MONRE, introduces Workshop‟s agenda
Mr. Nguyen Khac Hieu, Deputy Director General,
DMHCC, MONRE, gives the welcome speech
Dr. Sudhir Sharma, Representative of UNEP Risoe
Centre in Denmark, delivers the opening statement Participants at Workshop
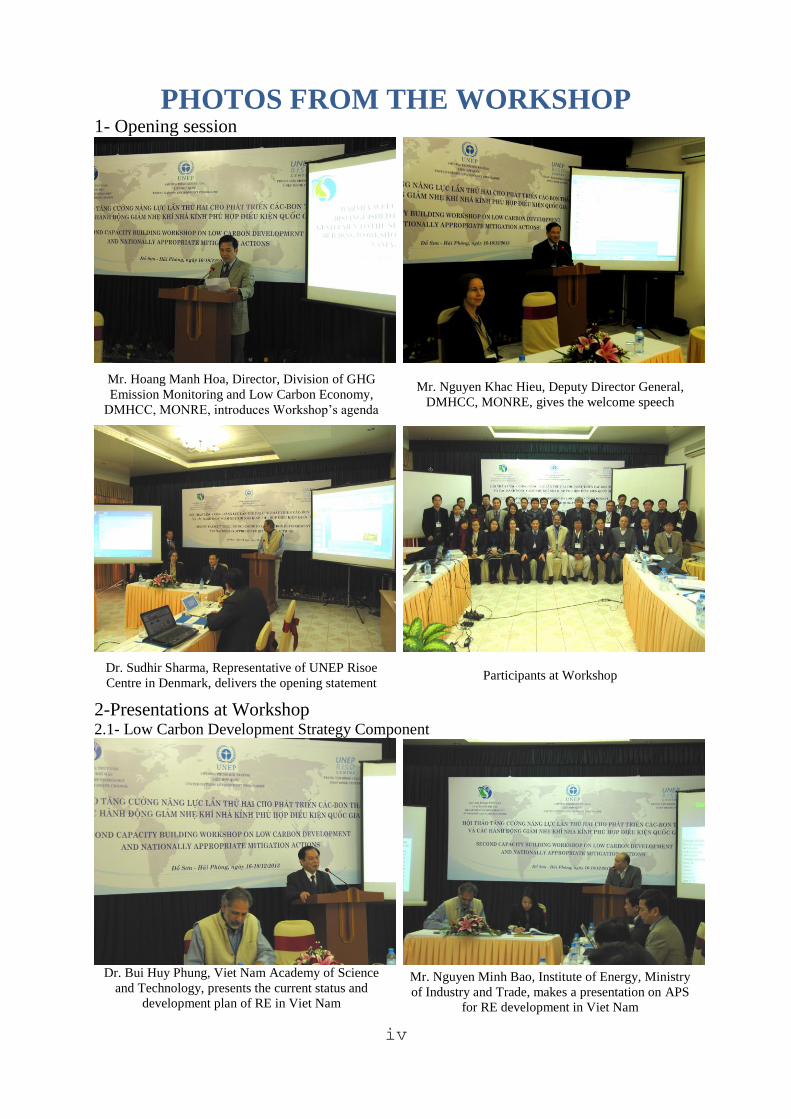
2-Presentations at Workshop 2.1- Low Carbon Development Strategy Component
Dr. Bui Huy Phung, Viet Nam Academy of Science
and Technology, presents the current status and
development plan of RE in Viet Nam
Mr. Nguyen Minh Bao, Institute of Energy, Ministry
of Industry and Trade, makes a presentation on APS
for RE development in Viet Nam
v
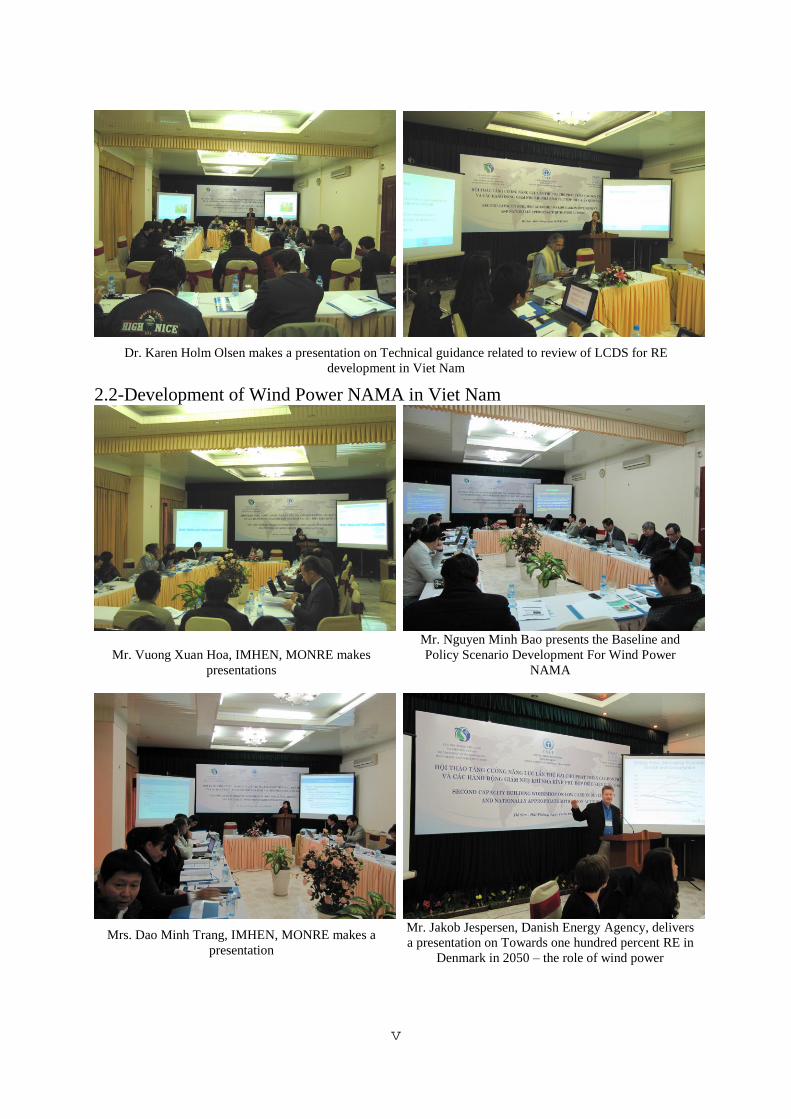
Dr. Karen Holm Olsen makes a presentation on Technical guidance related to review of LCDS for RE
development in Viet Nam
2.2-Development of Wind Power NAMA in Viet Nam
Mr. Vuong Xuan Hoa, IMHEN, MONRE makes
presentations
Mr. Nguyen Minh Bao presents the Baseline and
Policy Scenario Development For Wind Power
NAMA
Mrs. Dao Minh Trang, IMHEN, MONRE makes a
presentation
Mr. Jakob Jespersen, Danish Energy Agency, delivers
a presentation on Towards one hundred percent RE in
Denmark in 2050 – the role of wind power
vi
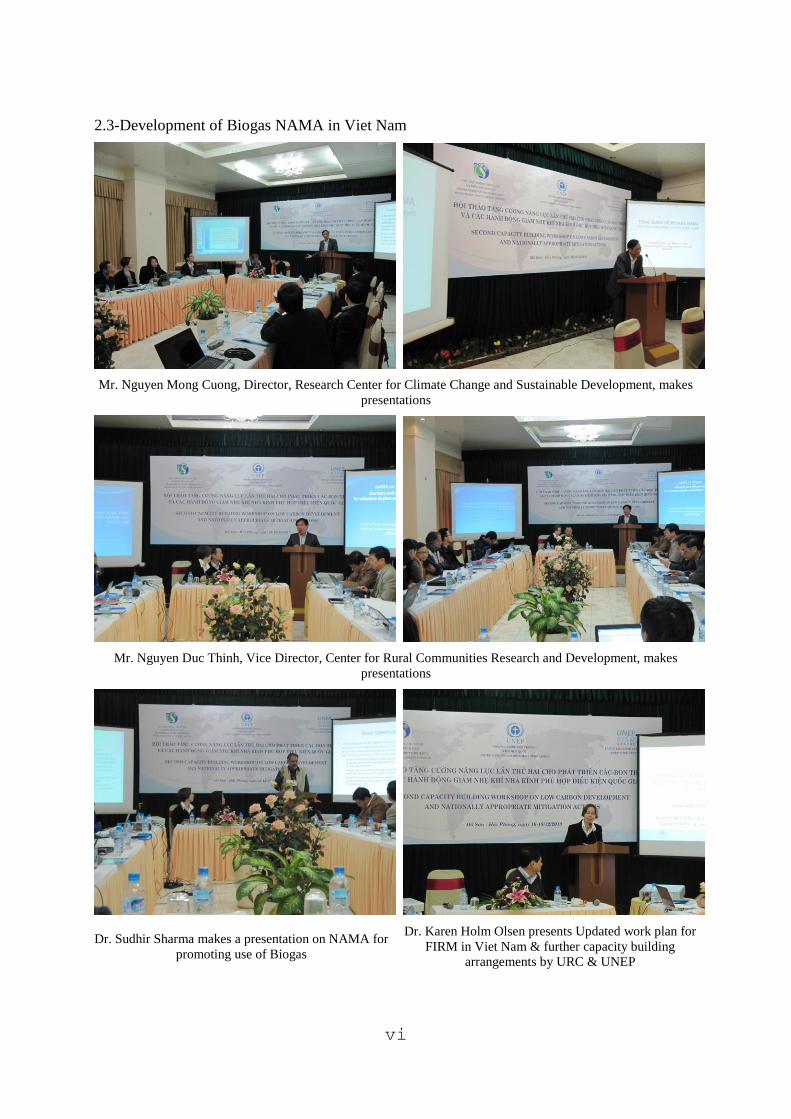
2.3-Development of Biogas NAMA in Viet Nam
Mr. Nguyen Mong Cuong, Director, Research Center for Climate Change and Sustainable Development, makes
presentations
Mr. Nguyen Duc Thinh, Vice Director, Center for Rural Communities Research and Development, makes
presentations
Dr. Sudhir Sharma makes a presentation on NAMA for
promoting use of Biogas
Dr. Karen Holm Olsen presents Updated work plan for
FIRM in Viet Nam & further capacity building
arrangements by URC & UNEP
vii
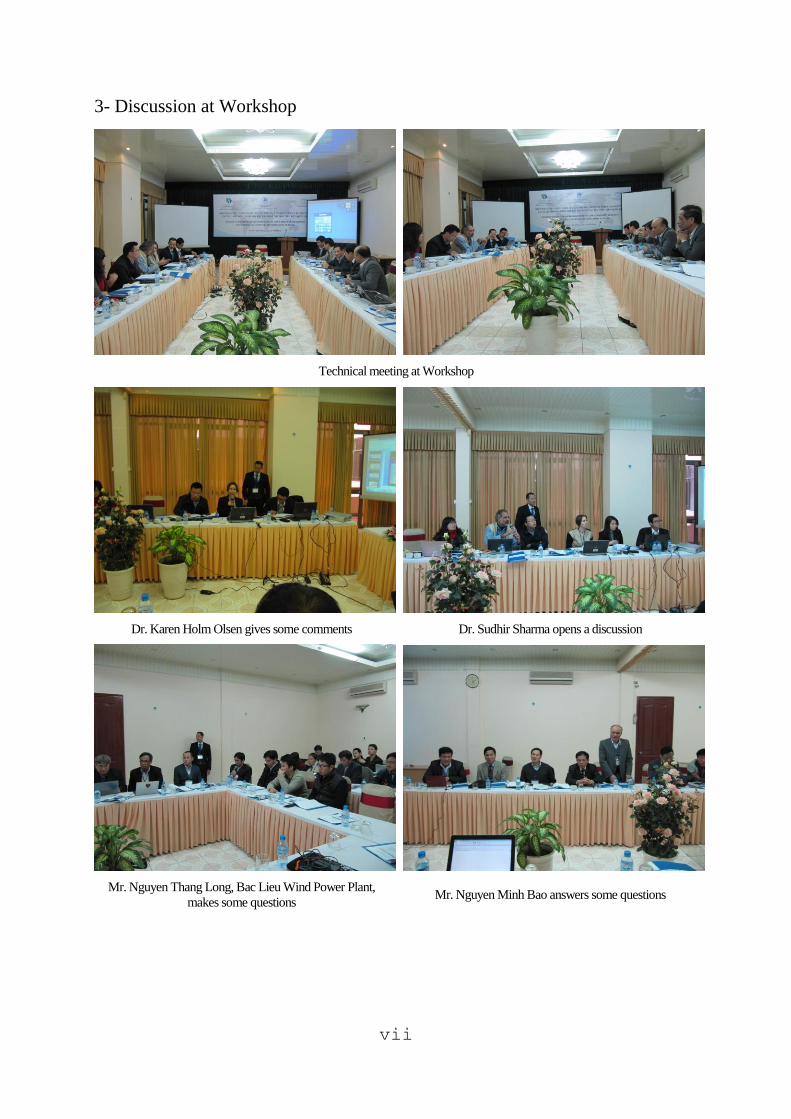
3- Discussion at Workshop
Technical meeting at Workshop
Dr. Karen Holm Olsen gives some comments Dr. Sudhir Sharma opens a discussion
Mr. Nguyen Thang Long, Bac Lieu Wind Power Plant,
makes some questions Mr. Nguyen Minh Bao answers some questions
viii
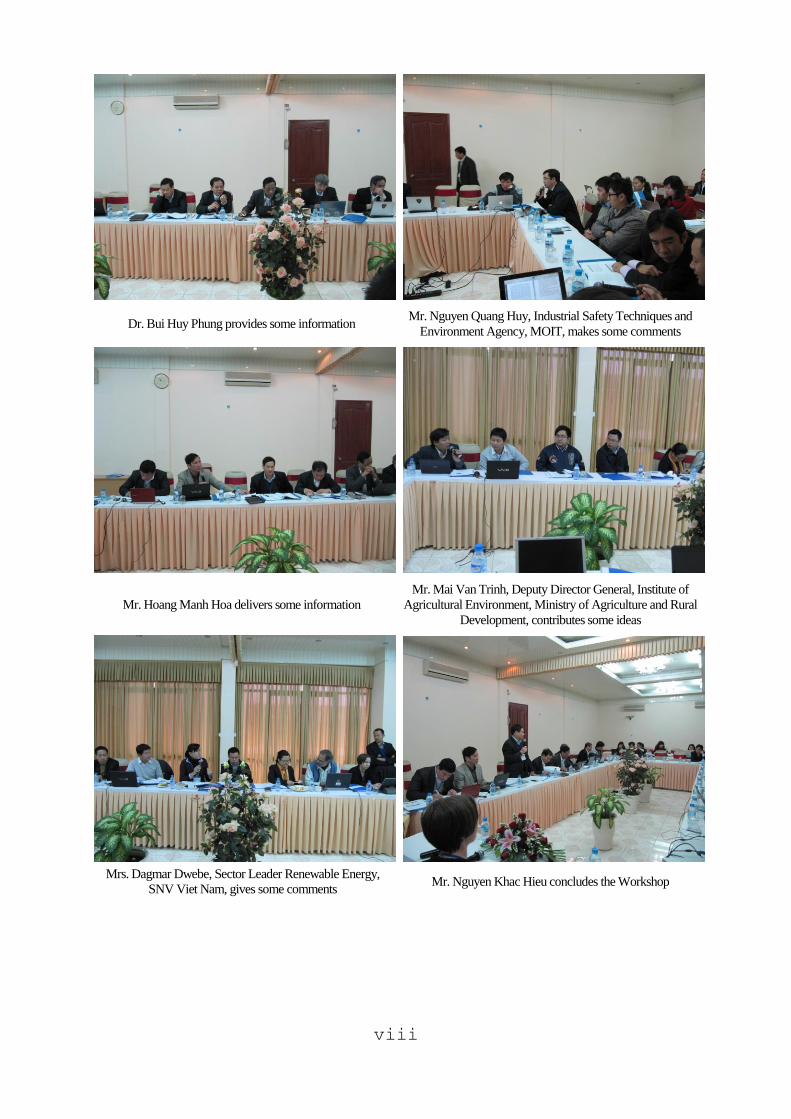
Dr. Bui Huy Phung provides some information Mr. Nguyen Quang Huy, Industrial Safety Techniques and
Environment Agency, MOIT, makes some comments
Mr. Hoang Manh Hoa delivers some information
Mr. Mai Van Trinh, Deputy Director General, Institute of
Agricultural Environment, Ministry of Agriculture and Rural
Development, contributes some ideas
Mrs. Dagmar Dwebe, Sector Leader Renewable Energy,
SNV Viet Nam, gives some comments Mr. Nguyen Khac Hieu concludes the Workshop
ix
ORGANIZATION OF THE WORKSHOP
Objective of the Workshop
The objective of the Workshop was to discuss and have consultations from relevant
agencies related to:
- Development of the BAU and APS scenarios for RE in period from 2020 to 2030
contributing to develop LCDS in Viet Nam;
- The proposed Wind Power and Biogas NAMAs in Viet Nam;
- Upcoming activities under the cooperation with UNEP Risoe Centre in Denmark.
Date of Workshop
From 16 to 18 December 2013
Venue
Training and Service Supply Center – Base II,
No. 1, Ly Thanh Tong Street, Zone 1, Do Son, Hai Phong City, Viet Nam.
Organizers
- Department of Meteorology, Hydrology and Climate change (DMHCC), Ministry of
Natural Resources and Environment (MONRE).
- UNEP Risoe Centre in Denmark.
PART I. REPORT OF THE WORKSHOP
2
Second Capacity Building Workshop on
Low Carbon Development (LCD)
and Nationally Appropriate Mitigation Actions (NAMAs)
From 16 to 18 December 2013, Hai Phong City, Viet Nam
REPORT OF THE WORKSHOP
1. Under the FIRM Project, the Second Capacity Building Workshop on LCD
and NAMAs was jointly organized by Department of Meteorology,
Hydrology and Climate Change (DMHCC), Ministry of Natural Resources
and Environment (MONRE) of Viet Nam and Risoe Centre of the United
Nations Environment Programme (UNEP).
Attendance
2. Attending the Workshop, there were heads, representatives and experts of
relevant Departments and Institutes from MONRE and other related
Ministries such as Ministry of Industry and Trade (MOIT), Ministry of
Agriculture and Rural Development (MARD), Viet Nam Academy of
Science and Technology, etc. In addition, several representatives and
experts from non-governmental organizations in Viet Nam were also
invited. For the international side, there were the representatives, experts
from Risoe Centre of the United Nations Environment Programme
(UNEP), Danish Energy Agency and SNV Netherlands Development
Organisation (see Annex 2).
Workshop Chairs
3. The Workshop was chaired by Mr. Nguyen Khac Hieu, Deputy Director
General of DMHCC, MONRE, Viet Nam and Dr. Karen Holm Olsen,
Senior Researcher and Dr. Sudhir Sharma, Senior Adviser, URC in
Denmark. Mr. Hoang Manh Hoa, Director, Division of GHG Emission
Monitoring and Low Carbon Economy, DMHCC, MONRE, serverd as the
secretary.
3
Key contents
I. Opening session
4. Mr. Hoang Manh Hoa introduced all the delegates and attendants as well as
workshop agenda. At the session, Mr. Nguyen Khac Hieu, on behalf of
DHMCC, delivered a speech to open the workshop and welcome all
national and international participants. He had a brief introduction of FIRM
project in Viet Nam, objectives and the importance of the workshop,
namely “Second Capacity Building Workshop on Low Carbon
Development and Nationally Appropriate Mitigation Actions (NAMAs)”.
5. Dr. Karen Holm Olsen, on behalf of URC, briefly introduced URC‟s
organisational structure and functions as well as delivered sincere thanks to
all delegates attending the workshop. She did expect that all outcomes
generated from the workshop will have a great contribution to the success
of FIRM project in Viet Nam.
6. Mr. Sudhir Sharma, one of the most experienced experts working for URC,
would like to show his gratefulness to participate in the workshop. He does
hope that the great efforts of DMHCC as implementing agency to
undertake the project activities in Viet Nam with good collaboration among
stakeholders to ensure the success of FIRM project as well as other
cooperation between Viet Nam and UNEP in the coming period.
7. As scheduled, the Workshop mainly focused on 3 parts: (1) Low Carbon
Development Strategy (LCDS); (2) Development of Wind Power NAMA;
(3) Development of Biogas NAMA.
II. Low Carbon Development Strategy Component
8. It is necessary to assess the current situation and propose a plan to develop
power sources to enable Viet Nam to achieve Low Carbon Development
Strategy (LCDs), especially focused on RE.
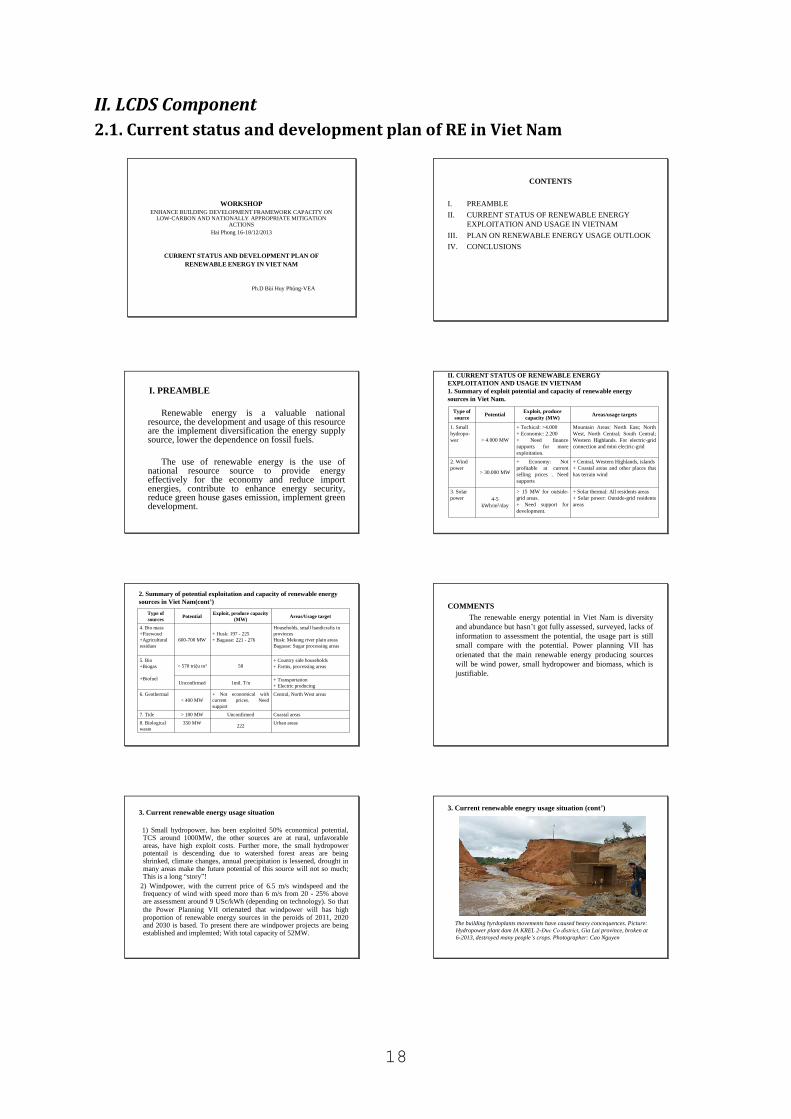
9. The report was presented by Dr. Bui Huy Phung, Chairman of Scientific
Council, Viet Nam Academy of Science and Technology. The report gave
an overview on the current status of using RE in Viet Nam and aslo
determined that the RE in Viet Nam is potential and diversed but has not
yet been assessed, investigated in a completed and comprehensive maner
due to the lack of relevant information and activity data to assess the
feasibility.
10. Viet Nam has somehow taken some advantage of the potential RE since
there has not been any proper mechanism and incentive policies to attract
the participation of private enterprises to invest in RE which has therefore
not been as developed as expected. E.g. the subsidy from government to
4
develop 1kw power is US cent 7.8 while investing for 1kw power is about
US cent 10.
11. Following the presentation on current status and potential of RE
development, a brief introduction on RE development plan of Viet Nam in
the near future was also cunducted by the expert in accordance to the
Power Master Plan No VII. Renewable energy generating resources are of
wind power, small hydro power plants, and biomass power. There have
been 48 wind power projects registered to develop 5000 MW, however,
only 4 projects have been undertaken in the first round. In order to develop
wind power with the capacity accounting for 6-10% of the total national
commercial primary energy, Viet Nam is required a total investment budget
of around USD 7-15 billion by 2020 visioning to 2030.
12. To ensure the integration of all policies to develop national energy
resources properly and stably, Mr. Nguyen Minh Bao, Energy Institute,
Ministry of Industry and Trade, presented an APS responding to the
development of RE; Business As Usual (BAU) and APS aiming at
increasing RE ratio up to 5% over the total amount of primary commercial
energy in Viet Nam by 2020.
13. Participants concerned and discussed about GHG emission reduction target
enacted in the Plan of GHG emission management; management of carbon
trading activities to the world market in which the energy sector (incl.
transportation sector) was targeted to reduce the GHG emission of 8% by
2020 comparing to those of base year 2005. As the result, the GHG
Inventory 2005 estimated emission of energy sector including
transportation was of about 101.564 thousand tons CO2e meaning that by
2020 the GHG emission from energy sector would be about 8.125 thousand
tons CO2e as clarified by Mr. Hieu based on the BAU scenario.
14. While developing BAU and APS scenarios, the expert team has studied and
updated existing policies, however, these policies will be immediately
updated if there is any changes occured. According to a recent report, coal
has become the main source to generate power in Viet Nam. As foreseen, it
is essential to invest and develop RE in order to achieve towards the green
economic and sustainable development. Indeed, the APS scenario proposes
the increasing rate up to 5% over the total amount of used energy in Viet
Nam by 2020 which is indicated to be achievable.
15. With the purpose of supporting Vietnamese stakeholders and agencies in
developing LCDS in term of developing renewable anergy within FIRM
project, Dr. Karen Holm Olsen presented technical guideline to develop
LCDS in Viet Nam. Her speech showed the current situation and ambition
to reduce GHGs emission to assure that the global temperature is not
increasing over 2oC by the end of this century. Her presentation also briefly
5
mentioned an overview of policy mechanism related to the development of
RE in Viet Nam as well as suggestions to develop LCDS and APS in Viet
Nam. Her presentation was ended with the introduction of a guideline to
develop LCDS released recently.
After presentations of energy experts and technical guideline given by
representative from URC, the workshop takes into account the
following approaches:
16. The role of RE in Viet Nam: It is said that RE has been strongly taken into
concern, however, hydropower is mainly focused. Other renewable
energies have been emerged such as wind power with minor share. It is
considered as a big challenge to the development of RE in Viet Nam since
the hydor power has been almost prioritised while others have been not
taken advantages due to the lack of incentive policy, technical and financial
supports.
17. Clarification of proposal basis and development of BAU and APS: The
bases to develop BAU was taken into account by all delegates since it is
regarded as the basis to assess whether proposed BAU would match the
reality or not. The assessment enabled to develop APS accurately that
matched the existing condition to boost the feasibility of the APS.
However, wonders were raised by delegates as the definition of BAU is not
clearly difined in Viet Nam.
18. Roles and impacts of existing policies and stakeholders upon BAU and APS
scenarios proposed: All delegates agreed on the facts that the Government
of Viet Nam and related ministries, departments have issued plans on
orientation for RE development, however, these are general plans under
which specific guidelines and incentive policies need elaborating.
Otherwise, this caused the difficulty in undertaking and implementing these
plans in reality.
19. The selection of base year and inputs to develop BAU scenario were also
taken into account by all delegates since there has not been a similarity
among policies to choose base year that leads to the difficulty in assessing
and calculating. According to Dr. Karen Holm Olsen, there has not been
any policies to oblige countries to use a particular base year for BAU
scenario over the world, neverthelesss, the transparence and patency need
the most concerns.
20. How to clarify the role of supplementary policies for APS scenario
developed within the context of Viet Nam: has there been any improvement
within supplementary policies compared to existing policies. This issue
was considered as a difficulty while BAU scenario has not been completed.
All delegates aggreed to continue to study on this issue and complete in the
coming time.
6
III. Develop Wind Power NAMA
21. On behalf of the Wind Power NAMA project expert team, Mr. Vuong
Xuan Hoa, Climate Change Research Centre, IMHEN, MONRE presented
the overall concept of Wind Power NAMA in Viet Nam. This presentation
introduced the steps for developing a NAMA based on the current status of
development of wind power as well as its related legal documents which
would be the legal base for the proposed Wind Power NAMA in Viet Nam.
22. Mr. Nguyen Minh Bao, energy expert from Institute of Energy, Ministry of
Industry and Trade (MOIT) delivered a presentation on baseline and policy
scenario development for Wind Power NAMA because to meet the
requirement for developing NAMA, the host countries must develop the
baseline scenario for it. His presentation focussed on the methodology and
input data and how to calculate and develop the baseline and policy
scenario of Wind Power NAMA in Viet Nam.
- The developed NAMA baseline scenario (BAU) was based on the
wind power development plan under the Power Master Plan No VII
without the implementation of Wind Power NAMA.
- The NAMA scenario development was based on the potential
assessment of wind power in Viet Nam as well as the National
Targets in the development of wind power under the condition that
it would have additional supporting policies.
- He highlighted that the difference between baseline scenario and
NAMA scenarios would show the reduction of fossil fuels as well
as the GHG emissions.
- The emission factors used for developing the BAU of the NAMA
was the default emssion factor provided by IPCC. The GHG
emissions from various sources were estimated by using the Tier 1
and 2 methodologies of IPCC.
- According to the stastistic data, most of electricity was produced by
the coal thermal power plants. Therefore, he assumed that the
electricity from Wind Power NAMA would contribute to reduce
the use of coal. It was estimated that up to 2030, 50 mil. tons CO2e
would be reduced by applying the Wind Power NAMA.
23. Beside the advantages of social economy benefits that the Wind Power
NAMA can bring, there are some concerns about difficulties and barriers
which Viet Nam may have to face during the implementation of the
proposed NAMA such as policies, regulations, institutions, markets,
financial investment, human resources, etc. Therefore, the “Barriers for the
Implementation of Wind Power NAMA in Viet Nam” presented by Mr.
7
Vuong Xuan Hoa aimed to analyse and identify the implementing barriers
as well as partially propose some measures for coping those barriers.
- Viet Nam is appraised to be a high potential country for developing
wind power. However, the development of wind power still are
very slow due to many barriers.
- Those proposed measures initially helped participants at the
Workshop to have more orientations for wind power development,
but they should be added more details and clearly clarified the
financial support and technology tranfer issues.
24. Mr. Jakob Jespersen, representative of Danish Energy Agency shared the
experience in planning, investing and developing wind power in order to
have the green economy in Denmark where the development of wind
power and wind turbines has historically been known for long time.
- The first wind power plant was contructed in Denmark from 1970s
by NGOs. From 1980s, Denmark Government issued many policies
to encourage the wind power development, especially to stablised
the price of 15 US cent/kWh for a limited period (the first 10 years
of wind power plant) and commercialised afterwards. Recently, the
price is reduced to about 10 US cent/kWh.
- At present, Denmark has focused on self-sufficient with energy,
and become electricity exporter due to having good management
as well as suitable policies on oil, gas, coal, large scale wind
energy and implementing successful energy savings and energy
efficiency programs. Because of those long-term development
strategies under high consensus of the Parliament members, the
investors have the peace of mind to develop and implement RE
projects. The cost-effective subsidy schemes and energy taxes on
fossil fuels make RE more competitive and accurate the
development of RE in Denmark.
- The Government of Denmark set the target to have approximately
50% of electricity consumption to be supplied by wind power and
reduce GHG emissions about 34% in 2020. There will be no coal
thermal power plant in Denmark by 2030. By 2035, completely use
RE for electricity and heating demands. By 2050, completedly use
RE in all sectors included transportation.
- Denmark is using “one stop shop” model in the registration process
for wind power projects. Danish Energy Agency is the coordinating
authority to receive, assess and approve the wind power projects in
Denmark as well as develop subsidy schemes for the registered
projects. This agency also gradually takes part in developing high
8
capacity wind turbines up to 50MW a long with replacement of the
higher capacity turbines.
25. For developing and implementing the proposed Wind Power NAMA, the
Project expert team developed the expected action plan for the proposed
NAMA. On behalf of the Project expert team, Mrs. Dao Minh Trang,
IMHEN, briefly introduced the plan to develop and implement the
proposed Wind Power NAMA in Viet Nam.
- The plan is divided into 3 phases as follows:
+ Phase (1) is to prepare and scope for the proposed NAMA. This
phase is expected to be completed by end of August 2014.
+ Phase (2) is to apply supporting policies and measures for a pilot
project in Viet Nam. This phase is expected to begin in August
2014 and be finished in December 2016.
+ Phase (3) is the full development of the NAMA program in
whole country. The period for this phase is expected from
January 2017 to December 2020.
- DMHCC will be the coordinator to cooperate with related focal
agencies to implement all activities under the proposed NAMA in
the country.
Discussions on this content were focused on some following issues:
26. For the issues related on the additional policies to encourage the
involvement of the private sector in the development of wind power in Viet
Nam on the basis of Power Master Plan No VII: Participants form private
sector expected to involve in the implementation process of NAMA and
hoped that there would be some policies to encourage the involvement of
private sector in this process. The Workshop admitted and appreciated the
role of the private sector, especially in wide deployment phase of NAMA.
Their involvement will be consider to add in the suitable implementing
phase of NAMA.
27. Measures for accelerating the deployment of Wind Power NAMA in order
to avoid the slow progress of such other normal wind power project in Viet
Nam: Participants agreed that it would have been the current situation in
Viet Nam and this proposed NAMA would be expected to meliorate that
situation.
28. For the Wind Power NAMA’s Action plan: UNEP experts propose that the
action plan for Wind Power NAMA was quite clear; however, it should be
added more details and provided some indicators for assessing or expected
outcome(s) for each activities. On be half of those experts team were
incharge to develop Action Plan for Wind Power NAMA, Mr. Vuong Xuan
9
Hoa explained that they would acquire and consider to add those contents
to the revising Action Plan.
29. About methodology, input for developing Wind Power NAMA in Viet Nam:
After discussion, the Workshop agreed that the basis of input for estimation
and development the baseline scenario as well as NAMA shoud be based
on the latest policies, plans issued by the highest levels to ensure the
orthodoxy and update of the data.
30. For emission factor for developing the baseline of the proposed Wind
Power NAMA: some participants concerned that the emission factors used
in the development of proposed Wind Power NAMA and the grid emission
factor of country which was published in 2011 were not the same. This
would cause deviations in calculations for the baseline scenario. After
discussion, participants agreed that the emission factor to calculate the
baseline and develop BAU for Wind Power NAMA would be the default
factor from IPCC for estimating the years after 2011, for the period before
2011, the factors would be the emission factors of the grid which was
announced by MONRE;
31. The development of baseline scenario for Wind Power NAMA was spent
quite long time for discussion. After discussion, the Workshop agreed that
in the coming time, the project‟s expert team would continue to research
and update the baseline for the proposed NAMA according to the latest
documents issued for all types of energy sources such as renewable, coal,
nuclear, etc;
32. The role of additional policies for incentives, financial support, technology
tranfer, etc in the proposed scenario for Wind Power NAMA in Viet Nam:
In the coming time, the Project‟s Wind Power NAMA team will consider to
supplement these information to express the addition of the proposed
policy;
33. Lack of human and technology resources: Some participants said that lack
of human resources for the operation of wind power technology is fairly
comprehensive and recommended to develop a roadmap to strengthen
human resources to acquire and operate that technology. Some others said
that some high technical parts still could not be produced in Viet Nam;
therefore, the operating costs would be greatly increased because of the
importation cost for replacing, repairing equipment.
34. Discussions related to the lessons learned in wind power development
policies in Denmark and the ability to apply this experience to the current
context of Viet Nam: Participants were impressed with the successes in
developing RE in general and wind power in particular. The Workshop
acknowledged that the “One stop shop” model in Denmark have been
operated very effective. However, this model can not be feasible to form in
10
the short term because the coordination mechanism between relevant
ministries is still not yet strong enough in Viet Nam. The issues related to
the development of offshore wind power project was a very good
suggestion for Viet Nam. However, some participants wondered about the
technical issues in contruction and safety operation of offshore wind power
turbines. Especially, Viet Nam has to face a lot of strong storms each year.
IV. Development of Biogas NAMA
35. Similar procedures of Wind Power NAMA, the development of Biogas
NAMA on the pig farms was registered by Viet Nam under FIRM project
with the selected scale of farms varying from 150 to 3000 heads. The first
draft Biogas NAMA proposal have been prepared based on the given
template by UNEP, a national Biogas NAMA expert team led by Mr
Nguyen Mong Cuong, Research Center for Climate Change and
Sustainable Development and Center for Community and Rural
Development presented the overview of proposed NAMA including its
challenges and solutions and of pig husbandry sector in Viet Nam, its
productivity increment in accordance to the national report. The pig herd
increased from 20 million heads in 2000 to 27.4 million heads in 2010
(increase 37%) and is estimated to reach 35 million heads in 2020. Big pig
farms are normally distributed in the two main areas of Red River Delta
and Southeast. Meat production of pig occupies the largest proportion
comparing to poultry and other animals. The report revealed the neccesity
to solve the environmental issues of the pig husbandry farms and potentials
for development of biogas energy as RE source from the livestock
residuum. Policies and opportunities related to pig husbandry and
environment protection were refered such as National Strategy on
Livestock Development to 2020 (Desision No. 10/2008/QĐ-TTg); Policy
on RE Development (Power Master Plan No. 7 at Decision No. 1208/QD-
TTg dated 21/7/2011); etc. Those are the important pre-conditions for
developing Biogas NAMA on pig husbandry in Viet Nam with the
objective to minimise environment pollution and reduce GHG emission in
the concentrated husbandry areas by promoting in-situ electricity
generation, sustainable livestock and national electricity grid connection, if
possibile.
36. Mr Nguyen Duc Thinh, an biogas expert from Center for Rural
Communities Research and Development reported the baseline and policy
scenarios of Biogas NAMA based on the current policies such as Master
Power Plan No. 7, National Strategy on Climate Change, National Strategy
on Green Growth, National Strategy on Livestock Development to 2020.
Apart from the available policies, Viet Nam does not have the national
11
technical regulations on conditions for biosecurity of pig farms,
management of biogas generator, incentive mechanisms to promote the
usage of biogas to generate electricity to facilitate the development Biogas
NAMA. The experts pointed out the difficulties, barriers and challenges in
developing and applying the biogas electricity generation technology at big
scale husbandry farms as more specific policies, regulations are needed
especially market for biogas electricity. The certification of technology and
quality of biogas generators have not yet been clear because the biogas
electricity generation is new in Viet Nam, capacity of experts is limited,
cooperation among related agencies and financial ability of farm owners
for investment biogas energy are still weak, awareness on NAMA and
GHG emission reduction has not yet been popularly understood, etc. Upon
the above mentioned difficulties and barriers, some solutions were also
proposed helping to direct the biogas electricty generation development and
overcome barriers step by step to complete the first Biogas NAMA
proposal in Viet Nam.
37. A series of acitivities in the proposed Action Plan to complete and
implement Biogas NAMA were identified and benchmarked by Mr Nguyen
Đuc Thinh, actions are (1) completing and submitting overal draft of
Biogas NAMA, (2) researching, designing and proposing for policy
propulgating on connecting biogas electricity to the national grid under
NAMA mechanism; (3) establishing an investment foundation to attract
financial sources for biogas energy generating from pig farms; (4)
surveying, assessing and proposing appropiate biogas generating
technologies to the context of Viet Nam, (5) strengthening state
management, formulation of national organisational system & capacity
building for implementing Biogas NAMA, (6) awareness raising and
capacity building for pig-farms owners and other related agencies on
management and operation of biogas generation system, (7) building
demonstration models on biogas electricity generation and (8) developing a
full Biogas NAMA. A time frame to conduct and complete those solutions
were also determined.
38. The baseline development of Biogas NAMA was based on the existing
data. The emission was calculated for the average farm of 3000 heads with
methane GHG emission of 2040 tons CO2e/year for manuring and 328 tons
CO2e/year by using biogas for electricity generation. It was forecasted that
by 2020 there will likely be 4000 farms implementing NAMA, the total
methan GHG emission will be of 9.47 million tons CO2e/year.
39. After the presentations of the national experts on Biogas NAMA, Dr.
Sudhir Sharma presented some technical guidances on Biogas NAMA
focusing on issues (1) whether the existing system of open pond disposal
on land meets the environmental regulations for disposal of waste in the
12
water bodies or not, (2) what is the environmental regulation requirement
for BOD and COD for disposal of waste in water bodies and (3) if the
anaerobic treatment based system results in waste treatment that meets the
regulatory requirements for BOD and COD. He emphasised that NAMA
would cover only large farms to address the issue of use of biogas since
government strategy is to use biogas energy as an electricity generation
source connecting to national grid which is possible only on big sized-
farms because the small pig farms can only use the generated biogas
electricity for self consumption.
40. In regard to development of baseline for NAMA, it is necessary to consider
the use of biogas by farms for heating, cooking, pumping water, etc and
safety requirements may need to flare of certain amount of gas. For barriers
analysis, It was advised to have more detailed and deeper explainations on
what are the regulations and specifications of waste treatment to meet
required standards for disposal of waste in water bodies and what are the
gaps, what are existing regulations and specifications of uplinking small
RE projects to the grid, some experiences on policies and regulations in
other countries to identify the required steps, gaps including existing
avenues for accessing finance by pig farm owners and the costs of getting
loans, analysis of present markets for small electricity generator sets and
their terms of sales as well as after sales service availability for the
electricity generators, analysis of the present system for quality control,
testing and approval of electricity generation equipments for sale.
41. Identified some hints that help to strengthen the activities such as
identification of key actors in the successful implementation process for
information and consultation on NAMA, e.g., EVN (MOIT), some of the
local communities, pig farm owners thus the roles and responsibilities of
key actors should be clearly indicated. Based on analysis of grid connection
of small RE projects, identification of elements on regulations required
consultation with EVN, it may not need a full specification, but key
elements along with EVN for development and implementation of NAMA
including MRV plan. The cooperation will help shorten the adoption of
regulations in the system. For financial investment models using of biogas
generation system based on the assessment of the viabilities and
identification of supports are necessary for cost calculation. This is required
to develop the financial estimates for implementing NAMA and also
identify various sources of funds. It was also advised to consult with banks
and other avenues for loans arrangement, identification of key issues in
extending loans, such as risk, viability of projects assessment, etc. to find
out the possible ways of loan provision.
With the supports of experts from URC, participants concentrated to
discuss the following issues:
13
42. The scale proposed by national expert in the report for Biogas NAMA
development on pig farm which has 150 to 3000 heads is inappropriated to
deal with the environmental issues thus two types of scale could be more
suitable (1) medium and small farms, (2) big farm. For medium and small
farms, generated electricity can be used for on-the site consumption and
other scale is for national grid connection.
43. Biogas technology application, quality control of biogas generators
including standard regulations, market for biogas electricy generation, etc
were of much care by participants and openly discussed. It was estimated
that the electricity generated from biogas tanks will be redundant thus a
solution for this needs forming in order not to waste the energy source.
Therefore, a cooperative system can be established to use up the generated
electricity from small scaled farm and this solution is mostly supported by
participants, only whose farms produce more than 1MWh will be
considered for connecting to national grid. Some advised that the
connection to grid should be postponed till related policies have been laid
out including investment mechanisms, management and gid connecting
regulations with roadmap to reduce the use of engergy from fossil sources.
44. Issues related to treatment of biogas residuum, waste and water outlet
system, sustainability of technology, technology change and even the
anaerobic input sources for biogas operation to produce enough electricity
for the grid, role of private sector and NGOs were also discussed in the
workshop but no end-up was made yet.
45. In sum-up of the Biogas NAMA development, it was stated that two scales
of pig farms will be applied for Biogas NAMA proposal, the LEAP
software will be used to run the baseline and scenario for Biogas NAMA
based on the available data input. Biogas generated electricity will
temperarily be used for on-site consumption of farms, households or local
community. The connection with national grid will be considered later
since the effectiveness on economic aspect of biogas for grid connection
has not been clearly analysed. Baseline development of Biogas NAMA
needs more explainations for a proposed NAMA including its
implementation plan, measures on policy, financial sources and
technologies, roles and responsibility of related agencies.
V. Update Action Plan of the FIRM Project
46. A detailed and updated workplan to September 2014 of the FIRM project
was presented by Dr. Karen Holm Olsen. The two proposed NAMAs will
be key focus of Viet Nam in the coming time, a teleconference will be
organised in the end of January 2014 to review the progress of two NAMA
proposals and preparation for FIRM regional workshop to be held in
Cophenhagen, Denmark in March 2014. For MRV development plan, the
14
expert teams on NAMA will additionally includes the participation of
EVN, Biogas Office in Viet Nam, Livestock Production Department of
Ministry of Agricultural and Rural Development.
47. URC found no objection to use FIRM budget for nominating some more
related members NAMA working group of Viet Nam to participate to the
above mentioned regional workshop to report case study in Viet Nam under
FIRM project activities.
VI. Conclusions
Mr Nguyen Khac Hieu, based on the presentations, discussions and advices
of participants, concluded the results of workshop and assigned some
follow-ups bellows:
48. It was requested that expert teams of the two NAMAs collaborate to
complete the Wind Power and Biogas NAMAs illustrating clearly the
objectives, expected outcomes, methodologies, time frame, implementation
arrangements, financial measures for both short-term and long term
operations, responsibility of related agencies, especially MOIT and
MONRE.
49. A technical meeting will be organised by DMHCC to review the progress
and other related issues soon after the experts have updated add-in and
completed to prepare for regional FIRM workshop.
50. It is scheduled to organize a teleconference with URC expert in January
2014 to discuss (1) detailed work plan of FIRM to September 2014 (2)
project extension and (3) project third installment.
51. The Workshop was closed at 12:30 p.m on 18 December 2013.

PART II.
PRESENTATIONS AT THE WORKSHOP
16
I. Opening session
Welcome!
2nd Capacity Building Workshop:
„Low Carbon Development and
Nationally Appropriate Mitigation
Actions‟
Do Son, Hai Phong, Vietnam 16-18 December 2013
Objectives and overview of workshop
Objectives of the workshop:
• To understand the work so far by country team on LCDS
and NAMAs and discuss challenges and solutions
• Hear the plans for further work and provide technical
guidance on; baselines for LCDS and NAMA scenarios,
barrier and solution analysis, operational arrangements
Overview:
• Low Carbon Development strategy
• Wind NAMA
• Biogas NAMA
Who are the UNEP Risø Centre?
UNEP Risø Centre – Energy, Climate and Sustainable Development
International research team of
over 45 economists and
scientists.
Based on agreement between
Risø, UNEP and Danida.
Located at Roskilde,
Denmark since 1990.
Mandate is to support and
promote UNEP activities in
the areas of energy and
climate change, with a
special emphasis on
developing countries.
Part of DTU Management Engineering
URC Structure
UNEP and UNEP Risø NAMA related activities
Projects & Technical Support
Institutional Capacity Building & Partnerships
Analytical work & Publications
Facilitating Implementation and readiness for Mitigation (FIRM)
NAMA Development for the Building sector in Asia
Low Carbon Mobility Plan for three cities in India
Green Facility – Ghana and Maldives
Technology Needs Assessment (TNA)
Regional Gateway for Technology Transfer and Climate Change Action (REGATTA).
Regional NAMAs studies and NAMAs Prioritisation Framework for Philippines
National and Sectoral LCDS - Baselines
NAMA Academy
Individual Coaching for NAMAs to partner countries
GG/LCD training in the Emirates
NAMA Partnership & LEDS GP
Africa & LA Carbon Forums
Energy Efficiency Hub
Institutional challenges for NAMAs
Financial engineering
Understanding NAMAs
SD impacts of NAMAs
MRV of NAMAs
NAMA Handbook
NAMA Guidebook for Enlighten
More information:www.uneprisoe.org
www.namapipeline.orgwww.lowcarbondev-
support.orgwww.tech-action.orgwww.ggemirates.net
17
Guidance for
NAMA Design
UNFCCC with UNEP Risø
and UNDP released
publication at COP-19,
Warsaw.
Find the publication
here: http://unfccc.int/files/cooperation_supp
ort/nama/application/pdf/guidance_for_
nama_design_(2013)_final.pdf
Or here:
http://www.uneprisoe.org/Newsbase/N
yhed?id=8F3EA191-FF13-40BA-92E7-
43DB13C6F7E3
COP19 – Warsaw
UNEP Risø is leading the WG on SD
The NAMA partnership
NAMA PARTNERSHIP WEBSITEhttp://www.namapartnership.org/
NAMA WIKI WEBSITEhttp://namapartnership.wikispaces.com/
Thanks!
18
II. LCDS Component
2.1. Current status and development plan of RE in Viet Nam
WORKSHOP
ENHANCE BUILDING DEVELOPMENT FRAMEWORK CAPACITY ON LOW-CARBON AND NATIONALLY APPROPRIATE MITIGATION
ACTIONS
Hai Phong 16-18/12/2013
CURRENT STATUS AND DEVELOPMENT PLAN OF
RENEWABLE ENERGY IN VIET NAM
Ph.D Bùi Huy Phùng-VEA
CONTENTS
I. PREAMBLE
II. CURRENT STATUS OF RENEWABLE ENERGY
EXPLOITATION AND USAGE IN VIETNAM
III. PLAN ON RENEWABLE ENERGY USAGE OUTLOOK
IV. CONCLUSIONS
I. PREAMBLE
Renewable energy is a valuable nationalresource, the development and usage of this resourceare the implement diversification the energy supplysource, lower the dependence on fossil fuels.
The use of renewable energy is the use ofnational resource source to provide energyeffectively for the economy and reduce importenergies, contribute to enhance energy security,reduce green house gases emission, implement greendevelopment.
II. CURRENT STATUS OF RENEWABLE ENERGY
EXPLOITATION AND USAGE IN VIETNAM
1. Summary of exploit potential and capacity of renewable energy
sources in Viet Nam.
Type of
sourcePotential
Exploit, produce
capacity (MW)Areas/usage targets
1. Small
hydropo-
wer > 4.000 MW
+ Techical: >4.000
+ Economic: 2.200
+ Need finance
supports for more
exploitation.
Mountain Areas: North East; North
West, North Central; South Central;
Western Highlands. For electric-grid
connection and mini electric-grid
2. Wind
power> 30.000 MW
+ Economy: Not
profitable at current
selling prices . Need
supports
+ Central, Western Highlands, islands
+ Coastal areas and other places that
has terrain wind
3. Solar
power 4-5
kWh/m2/day
> 15 MW for outside-
grid areas.
+ Need support for
development.
+ Solar thermal: All residents areas
+ Solar power: Outside-grid residents
areas
2. Summary of potential exploitation and capacity of renewable energy
sources in Viet Nam(cont‟)
Type of
sourcesPotential
Exploit, produce capacity
(MW)Areas/Usage target
4. Bio mass
+Firewood
+Agricultural
residues
600-700 MW
+ Husk: 197 - 225
+ Bagasse: 221 - 276
Households, small handicrafts in
provinces
Husk: Mekong river plain areas
Bagasse: Sugar processing areas
5. Bio
+Biogas
+Biofuel
> 570 triệu m3 58+ Country side households
+ Farms, processing areas
Unconfirmed 1mil. T/n+ Transportation
+ Electric producing
6. Geothermal
< 400 MW
+ Not economical with
current prices. Need
support
Central, North West areas
7. Tide > 100 MW Unconfirmed Coastal areas
8. Biological
waste
350 MW222
Urban areas
COMMENTS
The renewable energy potential in Viet Nam is diversity
and abundance but hasn‟t got fully assessed, surveyed, lacks of
information to assessment the potential, the usage part is still
small compare with the potential. Power planning VII has
orienated that the main renewable energy producing sources
will be wind power, small hydropower and biomass, which is
justifiable.
3. Current renewable energy usage situation
1) Small hydropower, has been exploited 50% economical potential, TCS around 1000MW, the other sources are at rural, unfavorable areas, have high exploit costs. Further more, the small hydropower potentail is descending due to watershed forest areas are being shrinked, climate changes, annual precipitation is lessened, drought in many areas make the future potential of this source will not so much; This is a long “story”!
2) Windpower, with the current price of 6.5 m/s windspeed and the frequency of wind with speed more than 6 m/s from 20 - 25% above are assessment around 9 USc/kWh (depending on technology). So that
the Power Planning VII orienated that windpower will has high proportion of renewable energy sources in the peroids of 2011, 2020 and 2030 is based. To present there are windpower projects are being established and implemted; With total capacity of 52MW.
3. Current renewable enegry usage situation (cont‟)
The building hyrdoplants movements have caused heavy concequences. Picture:
Hydropower plant dam IA KREL 2-Đuc Co district, Gia Lai province, broken at
6-2013, destroyed many people’s crops. Photographer: Cao Nguyen
19
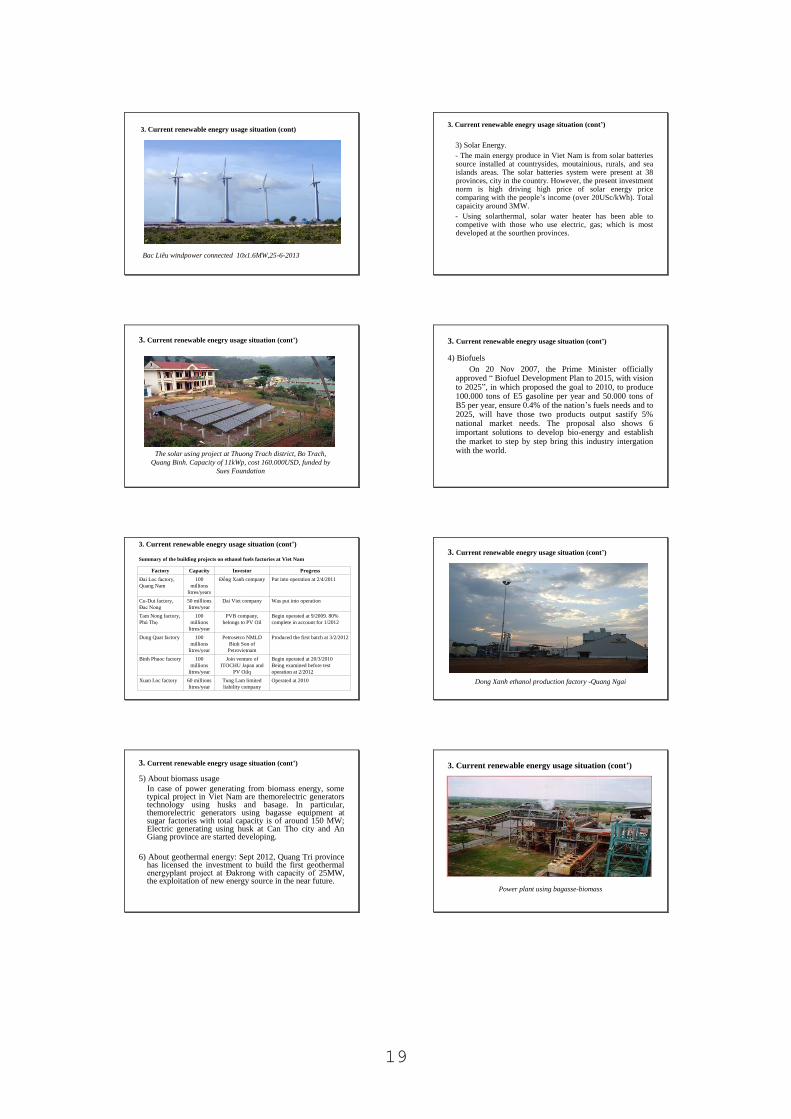
3. Current renewable enegry usage situation (cont)
Bac Liêu windpower connected 10x1.6MW,25-6-2013
3. Current renewable enegry usage situation (cont‟)
3) Solar Energy.
- The main energy produce in Viet Nam is from solar batteries source installed at countrysides, moutainious, rurals, and sea islands areas. The solar batteries system were present at 38 provinces, city in the country. However, the present investment norm is high driving high price of solar energy price comparing with the people‟s income (over 20USc/kWh). Total capaicity around 3MW.
- Using solarthermal, solar water heater has been able to competive with those who use electric, gas; which is most developed at the sourthen provinces.
3. Current renewable enegry usage situation (cont‟)
The solar using project at Thuong Trach district, Bo Trach,
Quang Binh. Capacity of 11kWp, cost 160.000USD, funded by
Sues Foundation
3. Current renewable enegry usage situation (cont‟)
4) Biofuels
On 20 Nov 2007, the Prime Minister officially approved “ Biofuel Development Plan to 2015, with vision to 2025”, in which proposed the goal to 2010, to produce 100.000 tons of E5 gasoline per year and 50.000 tons of B5 per year, ensure 0.4% of the nation‟s fuels needs and to 2025, will have those two products output sastify 5% national market needs. The proposal also shows 6 important solutions to develop bio-energy and establish the market to step by step bring this industry intergation with the world.
3. Current renewable enegry usage situation (cont‟)
Summary of the building projects on ethanol fuels factories at Viet Nam
Factory Capacity Investor Progress
Đai Loc factory,
Quang Nam
100
millions
litres/years
Đồng Xanh company Put into operation at 2/4/2011
Cu-Dut factory,
Đac Nong
50 millions
litres/year
Dai Viet company Was put into operation
Tam Nong factory,
Phú Thọ
100
millions
litres/year
PVB company,
belongs to PV Oil
Begin operated at 9/2009. 80%
complete in account for 1/2012
Dung Quat factory 100
millions
litres/year
Petrosetco NMLD
Binh Son of
Petrovietnam
Produced the first batch at 3/2/2012
Binh Phuoc factory 100
millions
litres/year
Join venture of
ITOCHU Japan and
PV Oilq
Begin operated at 20/3/2010
Being examined before test
operation at 2/2012
Xuan Loc factory 60 millions
litres/year
Tung Lam limited
liability company
Operated at 2010
3. Current renewable enegry usage situation (cont‟)
Dong Xanh ethanol production factory -Quang Ngai
3. Current renewable enegry usage situation (cont‟)
5) About biomass usage
In case of power generating from biomass energy, some typical project in Viet Nam are themorelectric generators technology using husks and basage. In particular, themorelectric generators using bagasse equipment at sugar factories with total capacity is of around 150 MW; Electric generating using husk at Can Tho city and An Giang province are started developing.
6) About geothermal energy: Sept 2012, Quang Tri province has licensed the investment to build the first geothermal energyplant project at Đakrong with capacity of 25MW, the exploitation of new energy source in the near future.
3. Current renewable energy usage situation (cont‟)
Power plant using bagasse-biomass
20
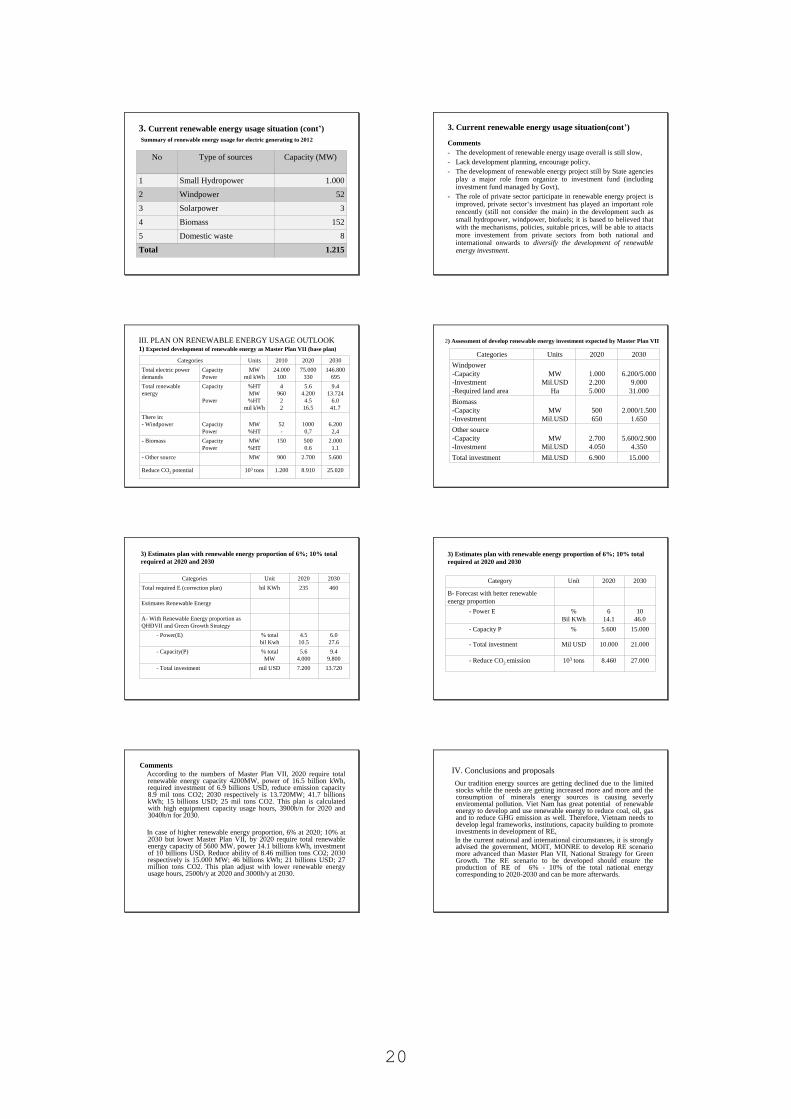
3. Current renewable energy usage situation (cont‟)
Summary of renewable energy usage for electric generating to 2012
No Type of sources Capacity (MW)
1 Small Hydropower 1.000
2 Windpower 52
3 Solarpower 3
4 Biomass 152
5 Domestic waste 8
Total 1.215
3. Current renewable energy usage situation(cont‟)
Comments
- The development of renewable energy usage overall is still slow,
- Lack development planning, encourage policy,
- The development of renewable energy project still by State agencies play a major role from organize to investment fund (including investment fund managed by Govt),
- The role of private sector participate in renewable energy project is improved, private sector„s investment has played an important role rencently (still not consider the main) in the development such as small hydropower, windpower, biofuels; it is based to believed that with the mechanisms, policies, suitable prices, will be able to attacts more investement from private sectors from both national and international onwards to diversify the development of renewable energy investment.
III. PLAN ON RENEWABLE ENERGY USAGE OUTLOOK1) Expected development of renewable energy as Master Plan VII (base plan)
Categories Units 2010 2020 2030
Total electric power
demands
Capacity
Power
MW
mil kWh
24.000
100
75.000
330
146.800
695
Total renewable
energy
Capacity
Power
%HT
MW
%HT
mil kWh
4
960
2
2
5.6
4.200
4.5
16.5
9.4
13.724
6.0
41.7
There in:
- Windpower Capacity
Power
MW
%HT
52
-
1000
0,7
6.200
2,4
- Biomass Capacity
Power
MW
%HT
150 500
0.6
2.000
1.1
- Other source MW 900 2.700 5.600
Reduce CO2 potential 103 tons 1.200 8.910 25.020
2) Assessment of develop renewable energy investment expected by Master Plan VII
Categories Units 2020 2030
Windpower
-Capacity
-Investment
-Required land area
MW
Mil.USD
Ha
1.000
2.200
5.000
6.200/5.000
9.000
31.000
Biomass
-Capacity
-Investment
MW
Mil.USD
500
650
2.000/1.500
1.650
Other source
-Capacity
-Investment
MW
Mil.USD
2.700
4.050
5.600/2.900
4.350
Total investment Mil.USD 6.900 15.000
3) Estimates plan with renewable energy proportion of 6%; 10% total
required at 2020 and 2030
Categories Unit 2020 2030
Total required E (correction plan) bil KWh 235 460
Estimates Renewable Energy
A- With Renewable Energy proportion as
QHĐVII and Green Growth Strategy
- Power(E) % total
bil Kwh
4.5
10.5
6.0
27.6
- Capacity(P) % total
MW
5.6
4.000
9.4
9.800
- Total investment mil USD 7.200 13.720
3) Estimates plan with renewable energy proportion of 6%; 10% total
required at 2020 and 2030
Category Unít 2020 2030
B- Forecast with better renewable
energy proportion
- Power E %
Bil KWh
6
14.1
10
46.0
- Capacity P % 5.600 15.000
- Total investment Mil USD 10.000 21.000
- Reduce CO2
emission 103 tons 8.460 27.000
Comments
According to the numbers of Master Plan VII, 2020 require total renewable energy capacity 4200MW, power of 16.5 billion kWh, required investment of 6.9 billions USD, reduce emission capacity 8.9 mil tons CO2; 2030 respectively is 13.720MW; 41.7 billions kWh; 15 billions USD; 25 mil tons CO2. This plan is calculated with high equipment capacity usage hours, 3900h/n for 2020 and 3040h/n for 2030.
In case of higher renewable energy proportion, 6% at 2020; 10% at 2030 but lower Master Plan VII, by 2020 require total renewable energy capacity of 5600 MW, power 14.1 billions kWh, investment of 10 billions USD, Reduce ability of 8.46 million tons CO2; 2030 respectively is 15.000 MW; 46 billions kWh; 21 billions USD; 27 million tons CO2. This plan adjust with lower renewable energy usage hours, 2500h/y at 2020 and 3000h/y at 2030.
IV. Conclusions and proposals
Our tradition energy sources are getting declined due to the limited stocks while the needs are getting increased more and more and the consumption of minerals energy sources is causing severly enviromental pollution. Viet Nam has great potential of renewable energy to develop and use renewable energy to reduce coal, oil, gas and to reduce GHG emission as well. Therefore, Vietnam needs to develop legal frameworks, institutions, capacity building to promote investments in development of RE,
In the current national and international circumstances, it is strongly advised the government, MOIT, MONRE to develop RE scenario more advanced than Master Plan VII, National Strategy for Green Growth. The RE scenario to be developed should ensure the production of RE of 6% - 10% of the total national energy corresponding to 2020-2030 and can be more afterwards.
21
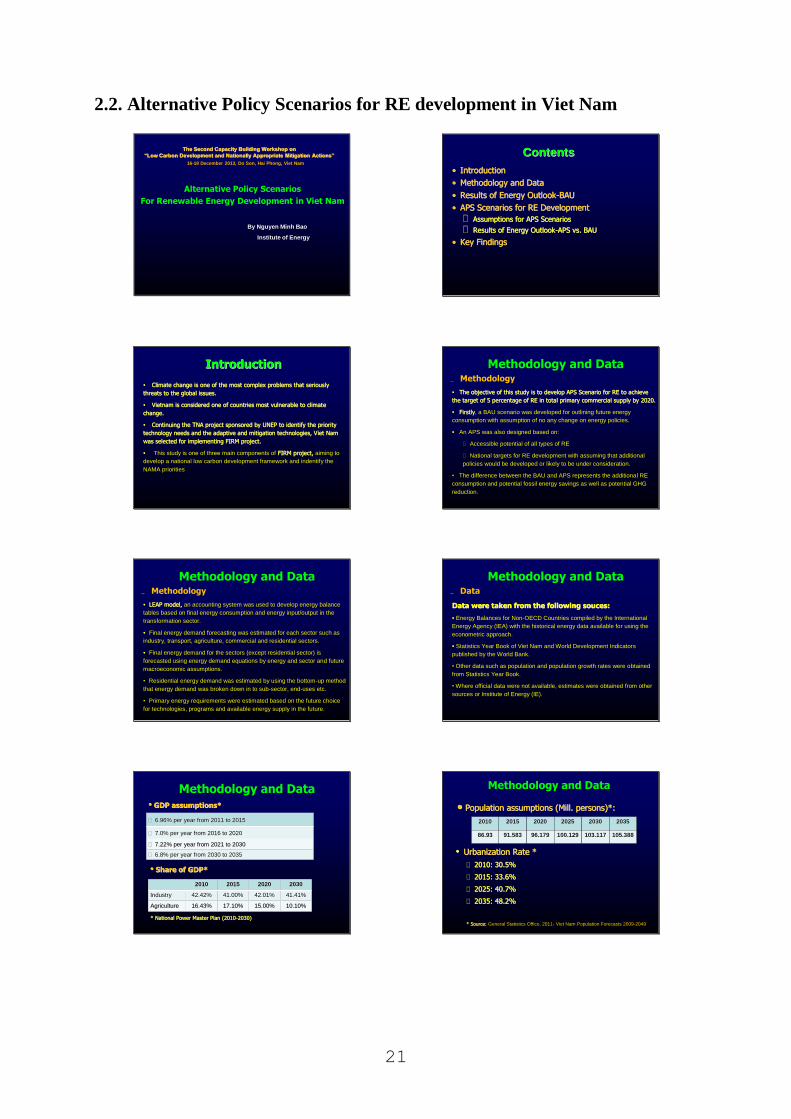
2.2. Alternative Policy Scenarios for RE development in Viet Nam
The Second Capacity Building Workshop on
“Low Carbon Development and Nationally Appropriate Mitigation Actions”
Alternative Policy Scenarios
For Renewable Energy Development in Viet Nam
By Nguyen Minh Bao
Institute of Energy
16-18 December 2013, Do Son, Hai Phong, Viet Nam
ContentsContents
•• IntroductionIntroduction
•• Methodology and Data Methodology and Data
•• Results of Energy OutlookResults of Energy Outlook--BAUBAU
•• APS Scenarios for RE Development APS Scenarios for RE Development
Assumptions for APS ScenariosAssumptions for APS Scenarios
Results of Energy OutlookResults of Energy Outlook--APS APS vs. BAUvs. BAU
•• Key FindingsKey Findings
•• Climate change is one of the most complex problems that seriousClimate change is one of the most complex problems that seriously ly
threats to the global issues.threats to the global issues.
•• Vietnam is considered one of countries most vulnerable to climatVietnam is considered one of countries most vulnerable to climate e
change.change.
•• Continuing the Continuing the TNA project sponsored by UNEP to identify the priority TNA project sponsored by UNEP to identify the priority
technology needs and the adaptive and mitigation technologies, Vtechnology needs and the adaptive and mitigation technologies, Viet Nam iet Nam
was selected for implementing FIRM project. was selected for implementing FIRM project.
•• This study is one of three main components of FIRM project, FIRM project, aiming to
develop a national low carbon development framework and indentify the
NAMA priorities
IntroductionIntroduction
•• The objective of this study is to develop APS Scenario for RE tThe objective of this study is to develop APS Scenario for RE to achieve o achieve
the target of 5 percentage of RE in total primary commercial supthe target of 5 percentage of RE in total primary commercial supply by 2020. ply by 2020.
•• FirstlyFirstly, a BAU scenario was developed for outlining future energy
consumption with assumption of no any change on energy policies.
•• An APS was also designed based on:
Accessible potential of all types of RE
National targets for RE development with assuming that additional
policies would be developed or likely to be under consideration.
• The difference between the BAU and APS represents the additional RE
consumption and potential fossil energy savings as well as potential GHG
reduction.
Methodology and Data Methodology
•• LEAP model, LEAP model, an accounting system was used to develop energy balance
tables based on final energy consumption and energy input/output in the
transformation sector.
•• Final energy demand forecasting was estimated for each sector such as
industry, transport, agriculture, commercial and residential sectors.
•• Final energy demand for the sectors (except residential sector) is
forecasted using energy demand equations by energy and sector and future
macroeconomic assumptions.
• Residential energy demand was estimated by using the bottom-up method
that energy demand was broken down in to sub-sector, end-uses etc.
• Primary energy requirements were estimated based on the future choice
for technologies, programs and available energy supply in the future.
Methodology and Data Methodology
Data were taken from the following souces: Data were taken from the following souces:
•• Energy Balances for Non-OECD Countries compiled by the International
Energy Agency (IEA) with the historical energy data available for using the
econometric approach.
•• Statistics Year Book of Viet Nam and World Development Indicators
published by the World Bank.
• Other data such as population and population growth rates were obtained
from Statistics Year Book.
• Where official data were not available, estimates were obtained from other
sources or Institute of Energy (IE).
Methodology and Data Data
•• GDP assumptions* GDP assumptions*
6.96% per year from 2011 to 20156.96% per year from 2011 to 2015
7.0% per year from 2016 to 20207.0% per year from 2016 to 2020
7.22% per year from 2021 to 20307.22% per year from 2021 to 2030
6.8% per year from 2030 to 2035 6.8% per year from 2030 to 2035
20102010 20152015 20202020 20302030
IndustryIndustry 42.42%42.42% 41.00%41.00% 42.01%42.01% 41.41%41.41%
AgricultureAgriculture 16.43%16.43% 17.10%17.10% 15.00%15.00% 10.10%10.10%
•• Share of GDP* Share of GDP*
* National Power Master Plan (2010* National Power Master Plan (2010--2030)2030)
Methodology and Data
•• Population assumptions (Mill. persons)*: Population assumptions (Mill. persons)*:
•• Urbanization Rate *Urbanization Rate *
2010: 30.5%2010: 30.5%
2015: 33.6%2015: 33.6%
2025: 40.7%2025: 40.7%
2035: 48.2%2035: 48.2%
* Source: * Source: General Statistics Office, 2011- Viet Nam Population Forecasts 2009-2049
20102010 20152015 20202020 20252025 20302030 20352035
86.9386.93 91.58391.583 96.17996.179 100.129100.129 103.117103.117 105.388105.388
Methodology and Data
22
Methodology and Data
* Changes in Technology
- Base year 2010 thermal efficiencies by fuel type (coal, gas, and oil) were
derived from Energy Balance Tables.
- Thermal efficiencies by fuel (coal, gas, and oil) in the Viet Nam were
projected based on the forecasting future power plant technologies in USDOE‟s
Annual Energy Outlook, 2008.
* Renewable Energy Technologies
Installed electricity generating capacity from renewable energy is
assumed based on:
- Current status of policies and RE application
- RE potential and planning to develop RE technologies
In BAU, it assumed that RE would reach to 4300 MW in 2030 with small
hydro contributing 4000 MW wind 200 MW, and biomass 100 MW.
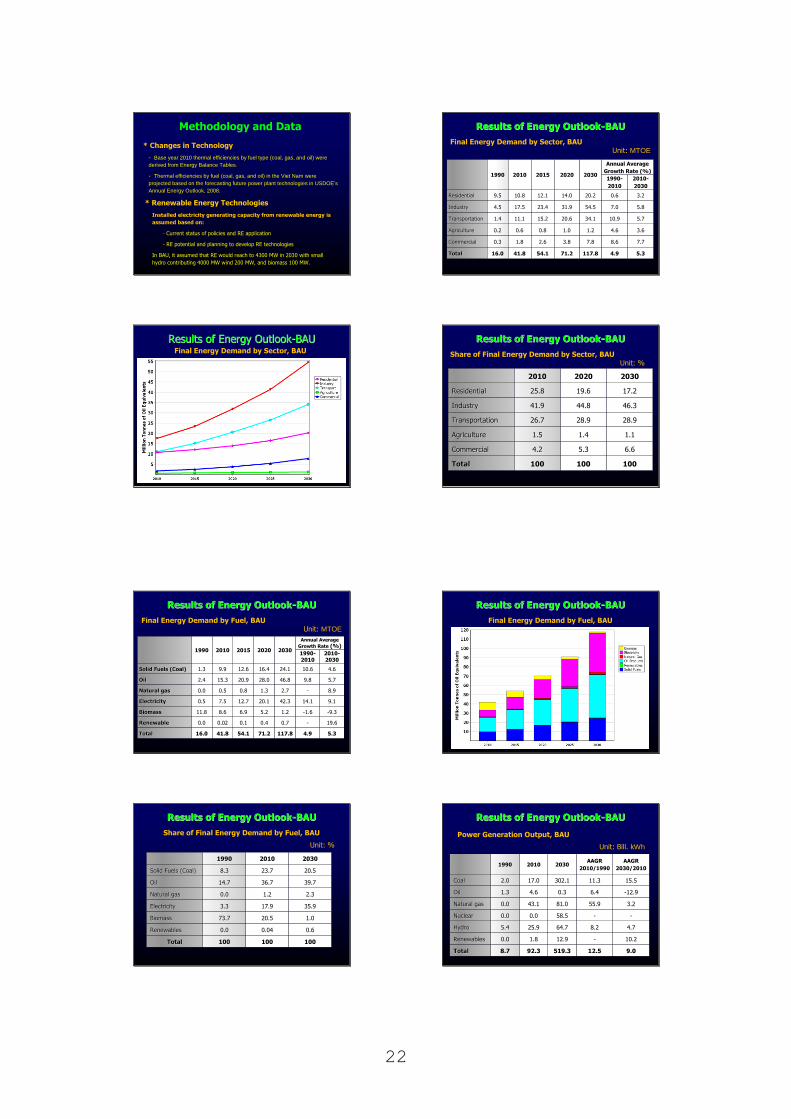
Results of Energy OutlookResults of Energy Outlook--BAUBAU
Final Energy Demand by Sector, BAU Unit: MTOE
19901990 20102010 20152015 20202020 20302030
Annual Average Annual Average
Growth Rate (%)Growth Rate (%)
19901990--
20102010
20102010--
20302030
ResidentialResidential 9.59.5 10.810.8 12.112.1 14.014.0 20.220.2 0.60.6 3.23.2
IndustryIndustry 4.54.5 17.517.5 23.423.4 31.931.9 54.554.5 7.07.0 5.85.8
TransportationTransportation 1.41.4 11.111.1 15.215.2 20.620.6 34.134.1 10.910.9 5.75.7
AgricultureAgriculture 0.20.2 0.60.6 0.80.8 1.01.0 1.21.2 4.64.6 3.63.6
CommercialCommercial 0.30.3 1.81.8 2.62.6 3.83.8 7.87.8 8.68.6 7.77.7
Total Total 16.016.0 41.841.8 54.154.1 71.271.2 117.8117.8 4.94.9 5.35.3
Results of Energy OutlookResults of Energy Outlook--BAUBAUFinal Energy Demand by Sector, BAU
Results of Energy OutlookResults of Energy Outlook--BAUBAU
Share of Final Energy Demand by Sector, BAU Unit: %
20102010 20202020 20302030
ResidentialResidential 25.825.8 19.619.6 17.217.2
IndustryIndustry 41.941.9 44.844.8 46.346.3
TransportationTransportation 26.726.7 28.928.9 28.928.9
AgricultureAgriculture 1.51.5 1.41.4 1.11.1
CommercialCommercial 4.24.2 5.35.3 6.66.6
TotalTotal 100100 100100 100100
Results of Energy OutlookResults of Energy Outlook--BAUBAU
Final Energy Demand by Fuel, BAU Unit: MTOE
19901990 20102010 20152015 20202020 20302030
Annual Average Annual Average
Growth Rate Growth Rate (%)(%)
19901990--
2010201020102010--
20302030
Solid Fuels (Coal)Solid Fuels (Coal) 1.31.3 9.99.9 12.612.6 16.416.4 24.124.1 10.610.6 4.64.6
OilOil 2.42.4 15.315.3 20.920.9 28.028.0 46.846.8 9.89.8 5.75.7
Natural gasNatural gas 0.00.0 0.50.5 0.80.8 1.31.3 2.72.7 -- 8.98.9
ElectricityElectricity 0.50.5 7.57.5 12.712.7 20.120.1 42.342.3 14.114.1 9.19.1
BiomassBiomass 11.811.8 8.68.6 6.96.9 5.25.2 1.21.2 --1.61.6 --9.39.3
RenewableRenewable 0.00.0 0.020.02 0.10.1 0.40.4 0.70.7 -- 19.619.6
TotalTotal 16.016.0 41.841.8 54.154.1 71.271.2 117.8117.8 4.94.9 5.35.3
Results of Energy OutlookResults of Energy Outlook--BAUBAU
Final Energy Demand by Fuel, BAU
Results of Energy OutlookResults of Energy Outlook--BAUBAU
Share of Final Energy Demand by Fuel, BAU
Unit: %
19901990 20102010 20302030
Solid Fuels (Coal)Solid Fuels (Coal) 8.38.3 23.723.7 20.520.5
OilOil 14.714.7 36.736.7 39.739.7
Natural gasNatural gas 0.00.0 1.21.2 2.32.3
ElectricityElectricity 3.33.3 17.917.9 35.935.9
BiomassBiomass 73.773.7 20.520.5 1.01.0
RenewablesRenewables 0.00.0 0.040.04 0.60.6
TotalTotal 100100 100100 100100
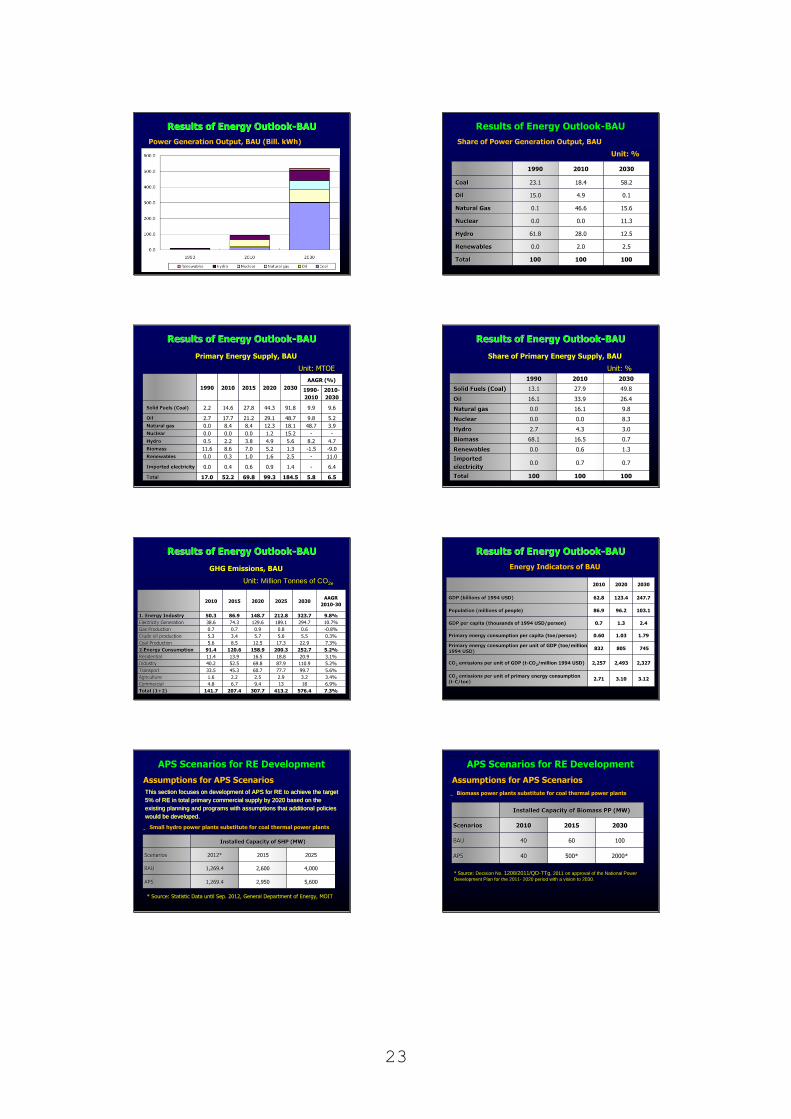
Results of Energy OutlookResults of Energy Outlook--BAUBAU
Power Generation Output, BAU
Unit: Bill. kWh
19901990 20102010 20302030AAGRAAGR
2010/19902010/1990
AAGRAAGR
2030/20102030/2010
CoalCoal 2.02.0 17.017.0 302.1302.1 11.311.3 15.515.5
OilOil 1.31.3 4.64.6 0.30.3 6.46.4 --12.912.9
Natural gasNatural gas 0.00.0 43.143.1 81.081.0 55.955.9 3.23.2
NuclearNuclear 0.00.0 0.00.0 58.558.5 -- --
HydroHydro 5.45.4 25.925.9 64.764.7 8.28.2 4.74.7
RenewablesRenewables 0.00.0 1.81.8 12.912.9 -- 10.210.2
TotalTotal 8.78.7 92.392.3 519.3519.3 12.512.5 9.09.0
23
Results of Energy OutlookResults of Energy Outlook--BAUBAU
Power Generation Output, BAU (Bill. kWh)
Results of Energy Outlook-BAU
Share of Power Generation Output, BAU
Unit: %
19901990 20102010 20302030
CoalCoal 23.123.1 18.418.4 58.258.2
OilOil 15.015.0 4.94.9 0.10.1
Natural GasNatural Gas 0.10.1 46.646.6 15.615.6
NuclearNuclear 0.00.0 0.00.0 11.311.3
HydroHydro 61.861.8 28.028.0 12.512.5
RenewablesRenewables 0.00.0 2.02.0 2.52.5
TotalTotal 100100 100100 100100
Results of Energy OutlookResults of Energy Outlook--BAUBAU
Primary Energy Supply, BAU
Unit: MTOE
Primary Energy Supply, BAU
Unit: MTOE
19901990 20102010 20152015 20202020 20302030
AAGR (%)AAGR (%)
19901990--
20102010
20102010--
20302030
Solid Fuels (Solid Fuels (Coal)Coal) 2.22.2 14.614.6 27.827.8 44.344.3 91.891.8 9.99.9 9.69.6
OilOil 2.72.7 17.717.7 21.221.2 29.129.1 48.748.7 9.89.8 5.25.2
Natural gasNatural gas 0.00.0 8.48.4 8.48.4 12.312.3 18.118.1 48.748.7 3.93.9
NuclearNuclear 0.00.0 0.00.0 0.00.0 1.21.2 15.215.2 -- --
HydroHydro 0.50.5 2.22.2 3.83.8 4.94.9 5.65.6 8.28.2 4.74.7
BiomassBiomass 11.611.6 8.68.6 7.07.0 5.25.2 1.31.3 --1.51.5 --9.09.0
RenewablesRenewables 0.00.0 0.30.3 1.01.0 1.61.6 2.52.5 -- 11.011.0
Imported electricityImported electricity 0.00.0 0.40.4 0.60.6 0.90.9 1.41.4 -- 6.46.4
TotalTotal 17.017.0 52.252.2 69.869.8 99.399.3 184.5184.5 5.85.8 6.56.5
Results of Energy OutlookResults of Energy Outlook--BAUBAU
Primary Energy Supply, BAU
Unit: MTOE
Share of Primary Energy Supply, BAU
Unit: %
19901990 20102010 20302030
Solid Fuels (Coal)Solid Fuels (Coal) 13.113.1 27.927.9 49.849.8
OilOil 16.116.1 33.933.9 26.426.4
Natural gasNatural gas 0.00.0 16.116.1 9.89.8
NuclearNuclear 0.00.0 0.00.0 8.38.3
HydroHydro 2.72.7 4.34.3 3.03.0
BiomassBiomass 68.168.1 16.516.5 0.70.7
RenewablesRenewables 0.00.0 0.60.6 1.31.3
Imported Imported
electricityelectricity0.00.0 0.70.7 0.70.7
Total Total 100100 100100 100100
Results of Energy OutlookResults of Energy Outlook--BAUBAU
Primary Energy Supply, BAU
Unit: MTOE
GHG Emissions, BAU
Unit: Million Tonnes of CO2e
20102010 20152015 20202020 20252025 20302030AAGRAAGR
20102010--3030
1. Energy Industry1. Energy Industry 50.350.3 86.986.9 148.7148.7 212.8212.8 323.7323.7 9.8%9.8%
Electricity GenerationElectricity Generation 38.638.6 74.374.3 129.6129.6 189.1189.1 294.7294.7 10.7%10.7%
Gas Production Gas Production 0.70.7 0.70.7 0.90.9 0.80.8 0.60.6 --0.8%0.8%
Crude oil productionCrude oil production 5.35.3 3.43.4 5.75.7 5.65.6 5.55.5 0.3%0.3%
Coal ProductionCoal Production 5.65.6 8.58.5 12.512.5 17.317.3 22.922.9 7.3%7.3%
2.Energy Consumption2.Energy Consumption 91.491.4 120.6120.6 158.9158.9 200.3200.3 252.7252.7 5.2%5.2%
ResidentialResidential 11.411.4 13.913.9 16.516.5 18.818.8 20.920.9 3.1%3.1%
IndustryIndustry 40.240.2 52.552.5 69.869.8 87.987.9 110.9110.9 5.2%5.2%
TransportTransport 33.533.5 45.345.3 60.760.7 77.777.7 99.799.7 5.6%5.6%
AgricultureAgriculture 1.61.6 2.22.2 2.52.5 2.92.9 3.23.2 3.4%3.4%
CommercialCommercial 4.84.8 6.76.7 9.49.4 1313 1818 6.9%6.9%
Total (1+2)Total (1+2) 141.7141.7 207.4207.4 307.7307.7 413.2413.2 576.4576.4 7.3%7.3%
Results of Energy OutlookResults of Energy Outlook--BAUBAU
Energy Indicators of BAU
20102010 20202020 20302030
GDP (billions of 1994 USD)GDP (billions of 1994 USD) 62.862.8 123.4123.4 247.7247.7
Population (millions of people)Population (millions of people) 86.986.9 96.296.2 103.1103.1
GDP per capita (thousands of 1994 USD/person)GDP per capita (thousands of 1994 USD/person) 0.7 0.7 1.3 1.3 2.4 2.4
Primary energy consumption per capita (toe/person)Primary energy consumption per capita (toe/person) 0.60 0.60 1.03 1.03 1.79 1.79
Primary energy consumption per unit of GDP (toe/million Primary energy consumption per unit of GDP (toe/million
1994 USD)1994 USD)832 832 805 805 745 745
COCO22 emissions per unit of GDP (temissions per unit of GDP (t--COCO22/million 1994 USD)/million 1994 USD) 2,257 2,257 2,493 2,493 2,327 2,327
COCO22 emissions per unit of primary energy consumption emissions per unit of primary energy consumption
(t(t--C/toe)C/toe)2.71 2.71 3.10 3.10 3.12 3.12
APS Scenarios for RE Development
Assumptions for APS Scenarios
This section focuses on development of APS for RE to achieve theThis section focuses on development of APS for RE to achieve the target target
5% of RE in total primary commercial supply by 2020 based on the5% of RE in total primary commercial supply by 2020 based on the
existing planning and programs with assumptions that additional existing planning and programs with assumptions that additional policies policies
would be developed. would be developed.
Small hydro power plants substitute for coal thermal power plants
Installed Capacity of SHP (MW)Installed Capacity of SHP (MW)
ScenariosScenarios 2012*2012* 20152015 20252025
BAUBAU 1,269.4 1,269.4 2,600 2,600 4,000 4,000
APSAPS 1,269.4 1,269.4 2,950 2,950 5,600 5,600
* Source: Statistic Data until Sep. 2012, General Department of Energy, MOIT
APS Scenarios for RE Development
Assumptions for APS Scenarios
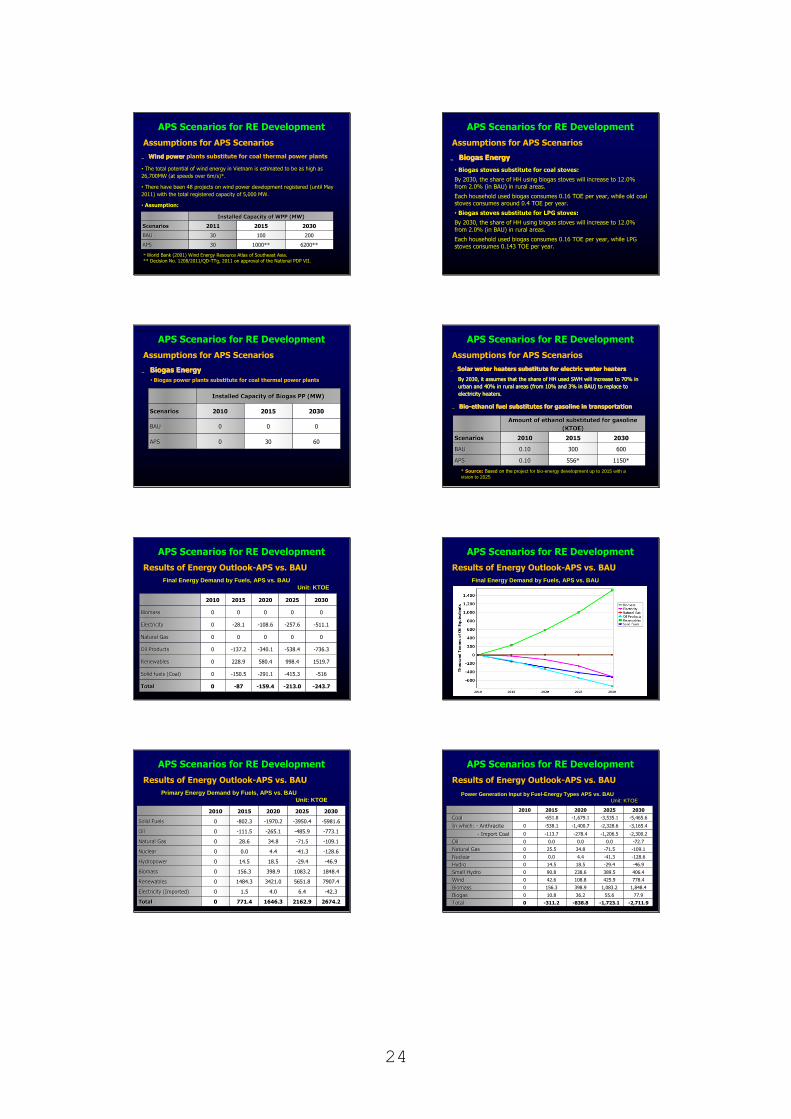
Biomass power plants substitute for coal thermal power plants
Installed Capacity of Biomass PP (MW)Installed Capacity of Biomass PP (MW)
ScenariosScenarios 20102010 20152015 20302030
BAUBAU 4040 60 60 100 100
APS APS 4040 500* 500* 2000* 2000*
40MW in 2010 to 60 MW in 2020 and 100 MW in 2030.
* Source: Decision No. 1208/2011/QD-TTg, 2011 on approval of the National Power
Development Plan for the 2011- 2020 period with a vision to 2030.
24
APS Scenarios for RE Development
Assumptions for APS Scenarios
Wind powerWind power plants substitute for coal thermal power plants
40MW in 2010 to 60 MW in 2020 and 100 MW in 2030.
* World Bank (2001) Wind Energy Resource Atlas of Southeast Asia. ** Decision No. 1208/2011/QD-TTg, 2011 on approval of the National PDP VII.
• The total potential of wind energy in Vietnam is estimated to be as high as
26,700MW (at speeds over 6m/s)*.
• There have been 48 projects on wind power development registered (until May
2011) with the total registered capacity of 5,000 MW.
• Assumption:
Installed Capacity of WPP (MW)Installed Capacity of WPP (MW)
ScenariosScenarios 20112011 20152015 20302030
BAUBAU 3030 100 100 200 200
APS APS 3030 1000** 1000** 6200** 6200**
APS Scenarios for RE Development
Assumptions for APS Scenarios
Biogas EnergyBiogas Energy
40MW in 2010 to 60 MW in 2020 and 100 MW in 2030.
• Biogas stoves substitute for coal stoves:
By 2030, the share of HH using biogas stoves will increase to 12.0% from 2.0% (in BAU) in rural areas.
Each household used biogas consumes 0.16 TOE per year, while old coal stoves consumes around 0.4 TOE per year.
• Biogas stoves substitute for LPG stoves:
By 2030, the share of HH using biogas stoves will increase to 12.0% from 2.0% (in BAU) in rural areas.
Each household used biogas consumes 0.16 TOE per year, while LPGstoves consumes 0.143 TOE per year.
APS Scenarios for RE Development
Assumptions for APS Scenarios
Biogas EnergyBiogas Energy
40MW in 2010 to 60 MW in 2020 and 100 MW in 2030.
• Biogas power plants substitute for coal thermal power plants
Installed Capacity of Biogas PP (MW)Installed Capacity of Biogas PP (MW)
ScenariosScenarios 20102010 20152015 20302030
BAUBAU 00 0 0 0 0
APS APS 00 30 30 60 60
APS Scenarios for RE Development
Assumptions for APS Scenarios
Solar water heaters substitute for electric water heatersSolar water heaters substitute for electric water heaters
40MW in 2010 to 60 MW in 2020 and 100 MW in 2030.
By 2030, it assumes that the share of HH used SWH will increase By 2030, it assumes that the share of HH used SWH will increase to 70% in to 70% in
urban and 40% in rural areas (from 10% and 3% in BAU) to replaceurban and 40% in rural areas (from 10% and 3% in BAU) to replace to to
electricity heaters. electricity heaters.
BioBio--ethanol fuel substitutes for gasoline in transportationethanol fuel substitutes for gasoline in transportation
Amount of ethanol substituted for gasoline Amount of ethanol substituted for gasoline
(KTOE)(KTOE)
ScenariosScenarios 20102010 20152015 20302030
BAUBAU 0.100.10 300 300 600 600
APS APS 0.100.10 556* 556* 1150* 1150*
* Source: Based on the project for bio-energy development up to 2015 with a
vision to 2025
APS Scenarios for RE Development
20102010 20152015 20202020 20252025 20302030
BiomassBiomass 00 00 00 00 00
ElectricityElectricity 00 --28.128.1 --108.6108.6 --257.6257.6 --511.1511.1
Natural GasNatural Gas 00 00 00 00 00
Oil ProductsOil Products 00 --137.2137.2 --340.1340.1 --538.4538.4 --736.3736.3
RenewablesRenewables 00 228.9228.9 580.4580.4 998.4998.4 1519.71519.7
Solid fuels (Coal) Solid fuels (Coal) 00 --150.5150.5 --291.1291.1 --415.3415.3 --516516
TotalTotal 00 --8787 --159.4159.4 --213.0213.0 --243.7243.7
Results of Energy Outlook-APS vs. BAU
Final Energy Demand by Fuels, APS vs. BAU
Final Energy Demand by Fuels, APS vs. BAU
Unit: KTOE
APS Scenarios for RE Development
Results of Energy Outlook-APS vs. BAU
Final Energy Demand by Fuels, APS vs. BAU
Final Energy Demand by Fuels, APS vs. BAU
APS Scenarios for RE Development
Results of Energy Outlook-APS vs. BAU
20102010 20152015 20202020 20252025 20302030
Solid FuelsSolid Fuels 00 --802.3802.3 --1970.21970.2 --3950.43950.4 --5981.65981.6
OilOil 00 --111.5111.5 --265.1265.1 --485.9485.9 --773.1773.1
Natural GasNatural Gas 00 28.628.6 34.834.8 --71.571.5 --109.1109.1
NuclearNuclear 00 0.00.0 4.44.4 --41.341.3 --128.6128.6
HydropowerHydropower 00 14.514.5 18.518.5 --29.429.4 --46.946.9
BiomassBiomass 00 156.3156.3 398.9398.9 1083.21083.2 1848.41848.4
RenewablesRenewables 00 1484.31484.3 3421.03421.0 5651.85651.8 7907.47907.4
Electricity (Imported)Electricity (Imported) 00 1.51.5 4.04.0 6.46.4 --42.342.3
TotalTotal 00 771.4771.4 1646.31646.3 2162.92162.9 2674.22674.2
Primary Energy Demand by Fuels, APS vs. BAU
Unit: KTOE
APS Scenarios for RE Development
Results of Energy Outlook-APS vs. BAU
Power Generation Input by Fuel-Energy Types APS vs. BAU
Unit: KTOE
Power Generation Input by Fuel-Energy Types APS vs. BAU
Unit: KTOE
20102010 20152015 20202020 20252025 20302030
CoalCoal --651.8651.8 --1,679.11,679.1 --3,535.13,535.1 --5,465.65,465.6
In which: In which: -- Anthracite Anthracite 00 --538.1538.1 --1,400.71,400.7 --2,328.62,328.6 --3,165.43,165.4
-- Import CoalImport Coal 00 --113.7113.7 --278.4278.4 --1,206.51,206.5 --2,300.22,300.2
Oil Oil 00 0.00.0 0.00.0 0.00.0 --72.772.7
Natural GasNatural Gas 00 25.525.5 34.834.8 --71.571.5 --109.1109.1
NuclearNuclear 00 0.00.0 4.44.4 --41.341.3 --128.6128.6
HydroHydro 00 14.514.5 18.518.5 --29.429.4 --46.946.9
Small HydroSmall Hydro 00 90.890.8 238.6238.6 389.5389.5 406.4406.4
Wind Wind 00 42.642.6 108.8108.8 425.9425.9 778.4778.4
BiomassBiomass 00 156.3156.3 398.9398.9 1,083.21,083.2 1,848.41,848.4
Biogas Biogas 00 10.810.8 36.236.2 55.655.6 77.977.9
TotalTotal 00 --311.2311.2 --838.8838.8 --1,723.11,723.1 --2,711.92,711.9
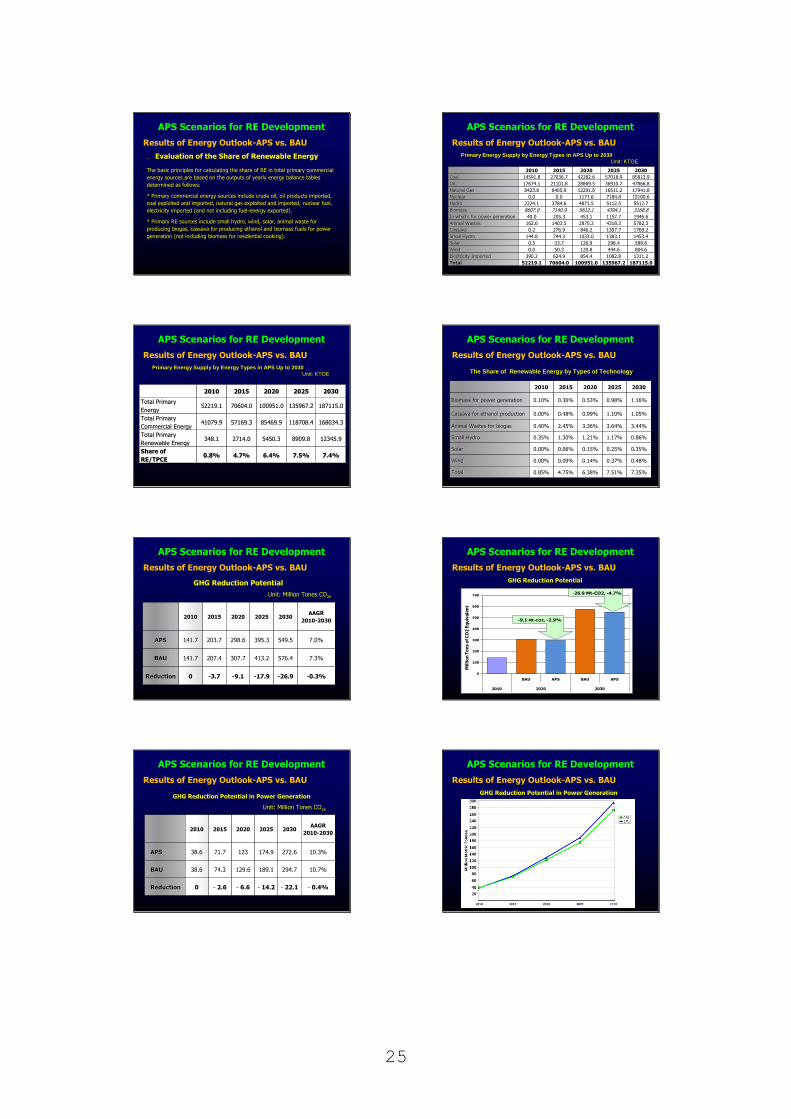
25
APS Scenarios for RE Development
Results of Energy Outlook-APS vs. BAU
Evaluation of the Share of Renewable Energy
The basic principles for calculating the share of RE in total primary commercial
energy sources are based on the outputs of yearly energy balance tables
determined as follows:
* Primary commercial energy sources include crude oil, oil products imported,
coal exploited and imported, natural gas exploited and imported, nuclear fuel,
electricity imported (and not including fuel-energy exported).
* Primary RE sources include small hydro, wind, solar, animal waste for
producing biogas, cassava for producing ethanol and biomass fuels for power
generation (not including biomass for residential cooking).
APS Scenarios for RE Development
Results of Energy Outlook-APS vs. BAU
Primary Energy Supply by Energy Types in APS Up to 2030
Unit: KTOE
Primary Energy Supply by Energy Types in APS Up to 2030
Unit: KTOE
20102010 20152015 20202020 20252025 20302030
CoalCoal 14591.814591.8 27036.727036.7 42282.642282.6 57018.957018.9 85813.985813.9
OilOil 17674.117674.1 21101.821101.8 28869.528869.5 36910.736910.7 47866.847866.8
Natural GasNatural Gas 8423.88423.8 8405.98405.9 12291.812291.8 16511.216511.2 17941.817941.8
NuclearNuclear 0.00.0 0.00.0 1171.61171.6 7184.87184.8 15100.615100.6
HydroHydro 2224.12224.1 3784.63784.6 4871.54871.5 5112.55112.5 5512.75512.7
BiomassBiomass 8607.08607.0 7140.97140.9 5612.15612.1 4394.14394.1 3168.83168.8
In which: for power generationIn which: for power generation 40.040.0 205.3205.3 453.1453.1 1157.71157.7 1946.61946.6
Animal WastesAnimal Wastes 162.6162.6 1403.51403.5 2870.32870.3 4318.34318.3 5782.35782.3
Cassava Cassava 0.20.2 276.9276.9 846.2846.2 1307.71307.7 1769.21769.2
Small HydroSmall Hydro 144.8144.8 744.3744.3 1033.01033.0 1383.11383.1 1453.41453.4
SolarSolar 0.50.5 33.733.7 126.9126.9 298.4298.4 589.8589.8
WindWind 0.00.0 50.350.3 120.8120.8 444.6444.6 804.6804.6
Electricity Imported Electricity Imported 390.2390.2 624.9624.9 854.4854.4 1082.81082.8 1311.21311.2
TotalTotal 52219.152219.1 70604.070604.0 100951.0100951.0 135967.2135967.2 187115.0187115.0
APS Scenarios for RE Development
Results of Energy Outlook-APS vs. BAU
20102010 20152015 20202020 20252025 20302030
Total Primary Total Primary
EnergyEnergy52219.152219.1 70604.070604.0 100951.0100951.0 135967.2135967.2 187115.0187115.0
Total Primary Total Primary
Commercial EnergyCommercial Energy41079.941079.9 57169.357169.3 85469.985469.9 118708.4118708.4 168034.3168034.3
Total Primary Total Primary
Renewable EnergyRenewable Energy348.1348.1 2714.02714.0 5450.35450.3 8909.88909.8 12345.912345.9
Share of Share of
RE/TPCERE/TPCE0.8%0.8% 4.7%4.7% 6.4%6.4% 7.5%7.5% 7.4%7.4%
Primary Energy Supply by Energy Types in APS Up to 2030
Unit: KTOE
APS Scenarios for RE Development
Results of Energy Outlook-APS vs. BAU
20102010 20152015 20202020 20252025 20302030
Biomass for power generationBiomass for power generation 0.10%0.10% 0.36%0.36% 0.53%0.53% 0.98%0.98% 1.16%1.16%
Cassava for ethanol productionCassava for ethanol production 0.00%0.00% 0.48%0.48% 0.99%0.99% 1.10%1.10% 1.05%1.05%
Animal Wastes for biogas Animal Wastes for biogas 0.40%0.40% 2.45%2.45% 3.36%3.36% 3.64%3.64% 3.44%3.44%
Small HydroSmall Hydro 0.35%0.35% 1.30%1.30% 1.21%1.21% 1.17%1.17% 0.86%0.86%
SolarSolar 0.00%0.00% 0.06%0.06% 0.15%0.15% 0.25%0.25% 0.35%0.35%
WindWind 0.00%0.00% 0.09%0.09% 0.14%0.14% 0.37%0.37% 0.48%0.48%
TotalTotal 0.85%0.85% 4.75%4.75% 6.38%6.38% 7.51%7.51% 7.35%7.35%
The Share of Renewable Energy by Types of Technology
APS Scenarios for RE Development
Results of Energy Outlook-APS vs. BAU
GHG Reduction Potential
Unit: Million Tones CO2e
20102010 20152015 20202020 20252025 20302030AAGRAAGR
20102010--20302030
APSAPS 141.7141.7 203.7203.7 298.6298.6 395.3395.3 549.5549.5 7.0%7.0%
BAUBAU 141.7141.7 207.4207.4 307.7307.7 413.2413.2 576.4576.4 7.3%7.3%
ReductionReduction 00 --3.73.7 --9.19.1 --17.917.9 --26.926.9 --0.3%0.3%
APS Scenarios for RE Development
Results of Energy Outlook-APS vs. BAU
GHG Reduction Potential
0
100
200
300
400
500
600
700
BAU APS BAU APS
2010 2020 2030
Mil
lio
n T
on
s o
f C
O2
Eq
uiv
ale
nt
-26.9 Mt-CO2, -4.7%
-9.1 Mt-CO2, -2.9%
APS Scenarios for RE Development
Results of Energy Outlook-APS vs. BAU
GHG Reduction Potential in Power Generation
Unit: Million Tones CO2e
20102010 20152015 20202020 20252025 20302030AAGR AAGR
20102010--20302030
APSAPS 38.638.6 71.771.7 123123 174.9174.9 272.6272.6 10.3%10.3%
BAUBAU 38.638.6 74.374.3 129.6129.6 189.1189.1 294.7294.7 10.7%10.7%
Reduction Reduction 00 -- 2.62.6 -- 6.66.6 -- 14.214.2 -- 22.122.1 -- 0.4%0.4%
APS Scenarios for RE Development
Results of Energy Outlook-APS vs. BAU
GHG Reduction Potential in Power Generation
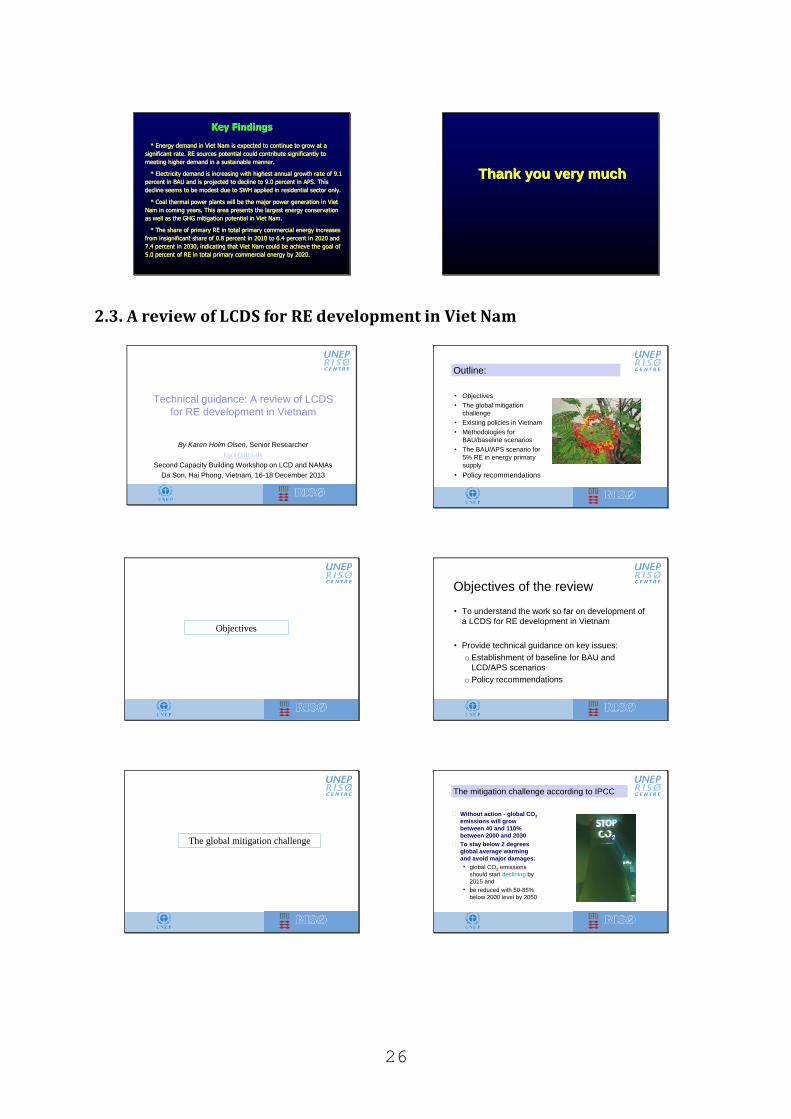
26
2.3. A review of LCDS for RE development in Viet Nam
Key FindingsKey Findings
* Energy demand in Viet Nam is expected to continue to grow at a* Energy demand in Viet Nam is expected to continue to grow at a
significant rate. RE sources potential could contribute significsignificant rate. RE sources potential could contribute significantly to antly to
meeting higher demand in a sustainable manner. meeting higher demand in a sustainable manner.
* Electricity demand is increasing with highest annual growth ra* Electricity demand is increasing with highest annual growth rate of 9.1 te of 9.1
percent in BAU and is projected to decline to 9.0 percent in APSpercent in BAU and is projected to decline to 9.0 percent in APS. This . This
decline seems to be modest due to SWH applied in residential secdecline seems to be modest due to SWH applied in residential sector only. tor only.
* Coal thermal power plants will be the major power generation i* Coal thermal power plants will be the major power generation in Viet n Viet
Nam in coming years. This area presents the largest energy conseNam in coming years. This area presents the largest energy conservation rvation
as well as the GHG mitigation potential in Viet Nam. as well as the GHG mitigation potential in Viet Nam.
* The share of primary RE in total primary commercial energy inc* The share of primary RE in total primary commercial energy increases reases
from insignificant share of 0.8 percent in 2010 to 6.4 percent ifrom insignificant share of 0.8 percent in 2010 to 6.4 percent in 2020 and n 2020 and
7.4 percent in 2030, indicating that Viet Nam could be achieve t7.4 percent in 2030, indicating that Viet Nam could be achieve the goal of he goal of
5.0 percent of RE in total primary commercial energy by 2020.5.0 percent of RE in total primary commercial energy by 2020.
Thank you very muchThank you very much
Technical guidance: A review of LCDS
for RE development in Vietnam
By Karen Holm Olsen, Senior Researcher
Second Capacity Building Workshop on LCD and NAMAs
Da Son, Hai Phong, Vietnam, 16-18 December 2013
Outline:
• Objectives
• The global mitigation
challenge
• Existing policies in Vietnam
• Methodologies for
BAU/baseline scenarios
• The BAU/APS scenario for
5% RE in energy primary
supply
• Policy recommendations
Objectives
Objectives of the review
• To understand the work so far on development of
a LCDS for RE development in Vietnam
• Provide technical guidance on key issues:
o Establishment of baseline for BAU and
LCD/APS scenarios
o Policy recommendations
The global mitigation challenge
The mitigation challenge according to IPCC
Without action - global CO2
emissions will grow
between 40 and 110%
between 2000 and 2030
To stay below 2 degrees
global average warming
and avoid major damages:
• global CO2 emissions
should start declining by
2015 and
• be reduced with 50-85%
below 2000 level by 2050
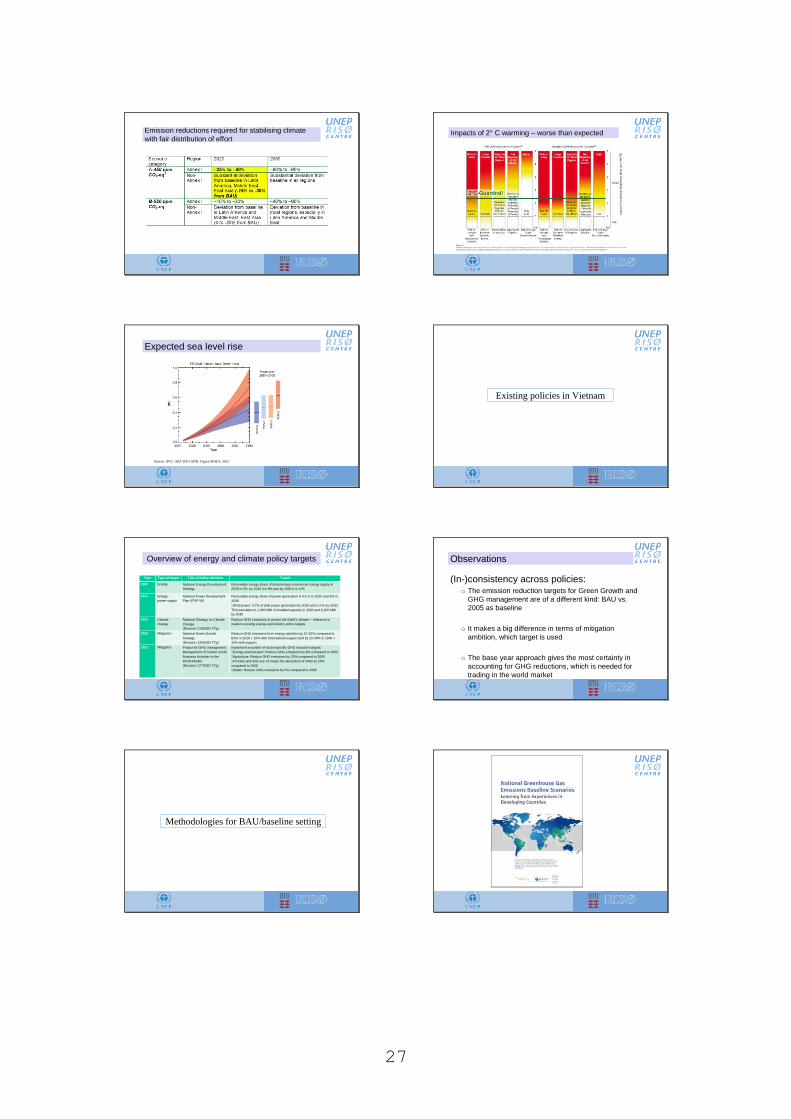
27
Emission reductions required for stabilising climate
with fair distribution of effort
Impacts of 2° C warming – worse than expected
Expected sea level rise
Source: IPCC AR5 WG1 SPM. Figure SPM.9, 2013
Existing policies in Vietnam
Overview of energy and climate policy targets
Year Type of target Title of policy decision Target
2007 Energy National Energy Development
Strategy
Renewable energy share of total primary commercial energy supply in
2020 is 5%, by 2015 it is 8% and by 2050 it is 11%
2011 Energy -
power supply
National Power Development
Plan (PDP VII)
Renewable energy share of power generation is 4.5 % in 2020 and 6% in
2030
Wind power: 0.7% of total power generation by 2020 and 2.4 % by 2030.
This translates to 1,000 MW of installed capacity in 2020 and 6,200 MW
by 2030
2011 Climate
change
National Strategy on Climate
Change
(Decision 2139/QD-TTg)
Reduce GHG emissions to protect the Earth‟s climate – reference is
made to existing energy and industry policy targets
2012 Mitigation National Green Growth
Strategy
(Decision 1393/QD-TTg)
Reduce GHG emissions from energy activities by 10-20% compared to
BAU in 2020 + 10% with international support and by 20-30% in 2030 +
10% with support.
2012 Mitigation Project for GHG management:
Management of Carbon Credit
Business Activities to the
World Market
(Decision 1775/QD-TTg)
Implement a number of sector specific GHG reduction targets:
Energy and transport: Reduce GHG emissions by 8% compared to 2005
Agriculture: Reduce GHG emissions by 20% compared to 2005
Forestry and land use: Increase the absorption of GHG by 20%
compared to 2005
Waste: Reduce GHG emissions by 5% compared to 2005
Observations
(In-)consistency across policies:o The emission reduction targets for Green Growth and
GHG management are of a different kind: BAU vs.
2005 as baseline
o It makes a big difference in terms of mitigation
ambition, which target is used
o The base year approach gives the most certainty in
accounting for GHG reductions, which is needed for
trading in the world market
Methodologies for BAU/baseline setting
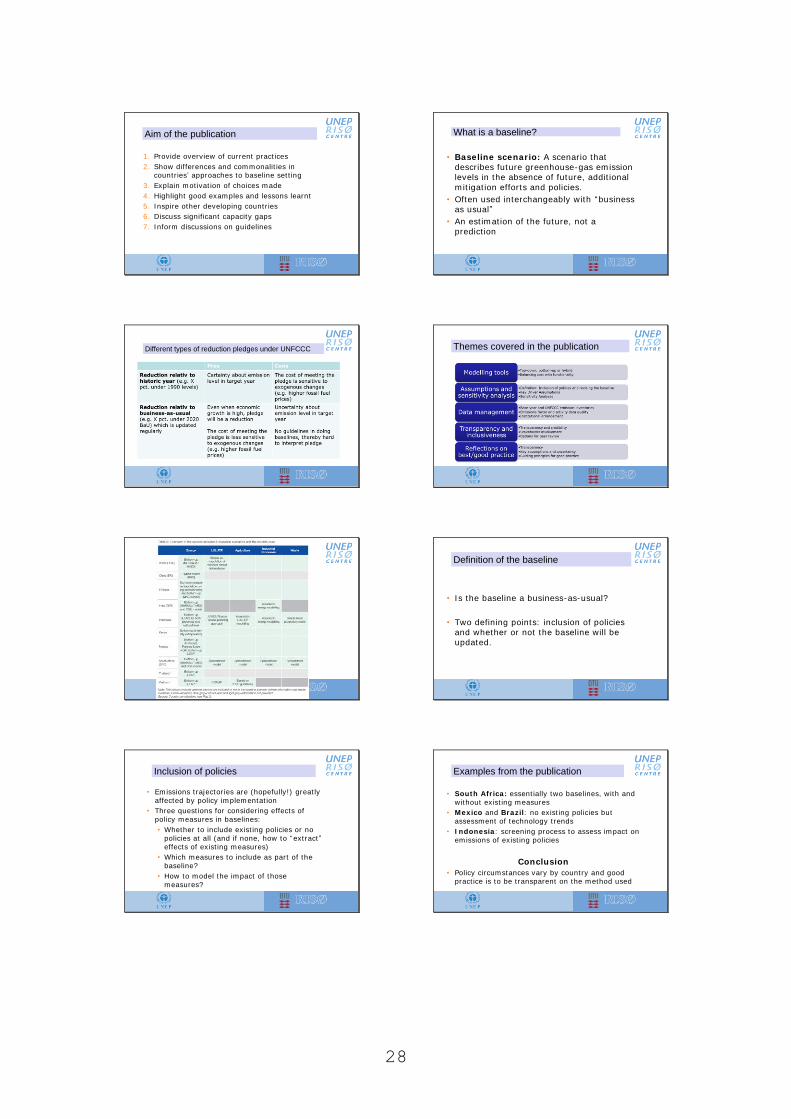
28
Aim of the publication
1. Provide overview of current pract ices
2. Show differences and com monalit ies in
countr ies‟ approaches to baseline set t ing
3. Explain mot ivat ion of choices made
4. Highlight good examples and lessons learnt
5. I nspire other developing countr ies
6. Discuss significant capacity gaps
7. I nform discussions on guidelines
What is a baseline?
• Baseline scenario: A scenario that
describes future greenhouse-gas em ission
levels in the absence of future, addit ional
m it igat ion efforts and policies.
• Often used interchangeably with “business
as usual”
• An est im at ion of the future, not a
predict ion
Different types of reduction pledges under UNFCCC
Themes covered in the publication
Definition of the baseline
• I s the baseline a business-as-usual?
• Two defining points: inclusion of policies
and whether or not the baseline will be
updated.
Inclusion of policies
• Emissions t rajector ies are (hopefully! ) great ly
affected by policy implementat ion
• Three quest ions for considering effects of
policy measures in baselines:
• Whether to include exist ing policies or no
policies at all (and if none, how to “ext ract ”
effects of exist ing measures)
• Which measures to include as part of the
baseline?
• How to model the impact of those
measures?
Examples from the publication
• South Afr ica: essent ially two baselines, with and
without exist ing measures
• Mexico and Brazil: no exist ing policies but
assessment of technology t rends
• I ndonesia : screening process to assess impact on
em issions of exist ing policies
Conclusion
• Policy circumstances vary by country and good
pract ice is to be t ransparent on the method used
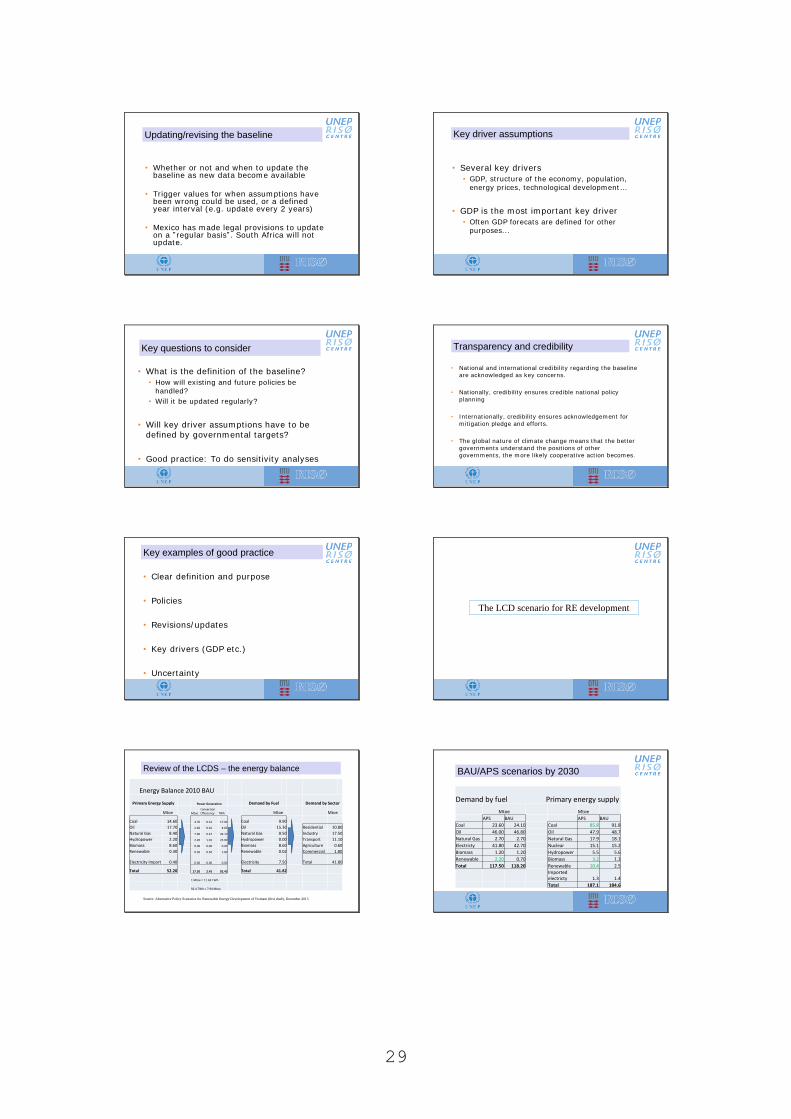
29
Updating/revising the baseline
• Whether or not and when to update the baseline as new data becom e available
• Trigger values for when assum pt ions have been wrong could be used, or a defined year interval (e.g. update every 2 years)
• Mexico has made legal provisions to update on a ” regular basis” . South Afr ica will not update.
Key driver assumptions
• Several key drivers
• GDP, st ructure of the economy, populat ion,
energy pr ices, technological developm ent …
• GDP is the m ost im portant key driver
• Often GDP forecats are defined for other
purposes...
Key questions to consider
• What is the definit ion of the baseline?
• How will exist ing and future policies be
handled?
• Will it be updated regular ly?
• Will key driver assum pt ions have to be
defined by governm ental targets?
• Good pract ice: To do sensit ivity analyses
Transparency and credibility
• Nat ional and internat ional credibilit y regarding the baseline
are acknowledged as key concerns.
• Nat ionally, credibilit y ensures credible nat ional policy
planning
• I nternat ionally, credibilit y ensures acknowledgem ent for
m it igat ion pledge and efforts.
• The global nature of clim ate change m eans that the bet ter
governm ents understand the posit ions of other
governm ents, the m ore likely cooperat ive act ion becom es.
Key examples of good practice
• Clear definit ion and purpose
• Policies
• Revisions/ updates
• Key drivers (GDP etc.)
• Uncertainty
The LCD scenario for RE development
Energy Balance 2010 BAU
Primary Energy Supply Power Generation Demand by Fuel Demand by Sector
Mtoe MtoeConversion Effieciency TWh Mtoe Mtoe
Coal 14.60 4.70 0.31 17.00 Coal 9.90
Oil 17.70 2.40 0.16 4.60 Oil 15.30 Residential 10.80
Natural Gas 8.40 7.90 0.47 43.10 Natural Gas 0.50 Industry 17.50
Hydropower 2.20 2.20 1.01 25.90 Hydropower 0.00 Transport 11.10
Biomass 8.60 0.00 0.00 0.00 Biomass 8.60 Agriculture 0.60
Renewable 0.30 0.30 0.50 1.80 Renewable 0.02 Commercial 1.80
Electricity Import 0.40 0.00 0.00 0.00 Electricity 7.50 Total 41.80
Total 52.20 17.50 2.45 92.40 Total 41.82
1 Mtoe = 11.63 TWh
92.4 TWh = 7.94 Mtoe
Source: Alternative Policy Scenarios for Renewable Energy Development of Vietnam (first draft), December 2013
Review of the LCDS – the energy balance
BAU/APS scenarios by 2030
Demand by fuel Primary energy supply
Mtoe Mtoe
APS BAU APS BAU
Coal 23.60 24.10 Coal 85.8 91.8
Oil 46.00 46.80 Oil 47.9 48.7
Natural Gas 2.70 2.70 Natural Gas 17.9 18.1
Electricty 41.80 42.70 Nuclear 15.1 15.2
Biomass 1.20 1.20 Hydropower 5.5 5.6
Renewable 2.20 0.70 Biomass 3.2 1.3
Total 117.50 118.20 Renewable 10.4 2.5
Imported electricty 1.3 1.4
Total 187.1 184.6
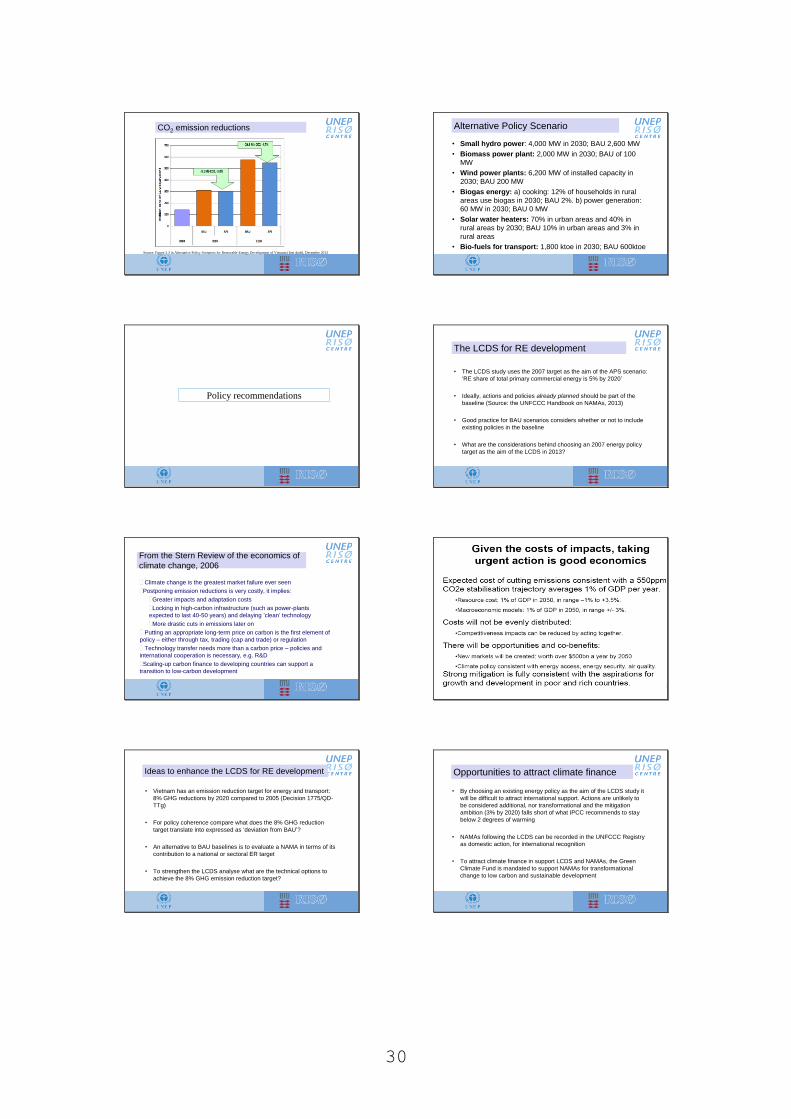
30
CO2 emission reductions
Source: Figure 3.3 in Alternative Policy Scenarios for Renewable Energy Development of Vietnam (first draft), December 2013
Alternative Policy Scenario
• Small hydro power: 4,000 MW in 2030; BAU 2,600 MW
• Biomass power plant: 2,000 MW in 2030; BAU of 100
MW
• Wind power plants: 6,200 MW of installed capacity in
2030; BAU 200 MW
• Biogas energy: a) cooking: 12% of households in rural
areas use biogas in 2030; BAU 2%. b) power generation:
60 MW in 2030; BAU 0 MW
• Solar water heaters: 70% in urban areas and 40% in
rural areas by 2030; BAU 10% in urban areas and 3% in
rural areas
• Bio-fuels for transport: 1,800 ktoe in 2030; BAU 600ktoe
Policy recommendations
The LCDS for RE development
• The LCDS study uses the 2007 target as the aim of the APS scenario:
„RE share of total primary commercial energy is 5% by 2020‟
• Ideally, actions and policies already planned should be part of the
baseline (Source: the UNFCCC Handbook on NAMAs, 2013)
• Good practice for BAU scenarios considers whether or not to include
existing policies in the baseline
• What are the considerations behind choosing an 2007 energy policy
target as the aim of the LCDS in 2013?
From the Stern Review of the economics of
climate change, 2006
Climate change is the greatest market failure ever seen
Postponing emission reductions is very costly, it implies:
Greater impacts and adaptation costs
Locking in high-carbon infrastructure (such as power-plants
expected to last 40-50 years) and delaying ‟clean‟ technology
More drastic cuts in emissions later on
Putting an appropriate long-term price on carbon is the first element of
policy – either through tax, trading (cap and trade) or regulation
Technology transfer needs more than a carbon price – policies and
international cooperation is necessary, e.g. R&D
Scaling-up carbon finance to developing countries can support a
transition to low-carbon development
Ideas to enhance the LCDS for RE development
• Vietnam has an emission reduction target for energy and transport:
8% GHG reductions by 2020 compared to 2005 (Decision 1775/QD-
TTg)
• For policy coherence compare what does the 8% GHG reduction
target translate into expressed as „deviation from BAU‟?
• An alternative to BAU baselines is to evaluate a NAMA in terms of its
contribution to a national or sectoral ER target
• To strengthen the LCDS analyse what are the technical options to
achieve the 8% GHG emission reduction target?
Opportunities to attract climate finance
• By choosing an existing energy policy as the aim of the LCDS study it
will be difficult to attract international support. Actions are unlikely to
be considered additional, nor transformational and the mitigation
ambition (3% by 2020) falls short of what IPCC recommends to stay
below 2 degrees of warming
• NAMAs following the LCDS can be recorded in the UNFCCC Registry
as domestic action, for international recognition
• To attract climate finance in support LCDS and NAMAs, the Green
Climate Fund is mandated to support NAMAs for transformational
change to low carbon and sustainable development
31
III. Development of Wind Power NAMA in Viet Nam
3.1. General introduction on the development of Wind Power NAMA
NAMA potential of Vietnam
By Vuong Xuan HoaInstitute of Meteorology, Hydrology and EnvironmentMinistry of Natural Resources and EnvironmentClimate Change Research CenterVietnam
General introduction on the development of Wind Power NAMA
The Second Capacity Building Workshop on “Low Carbon Development and Nationally Appropriate Mitigation Actions”
16-18 December 2013, Do Son, Hai Phong, Viet Nam
Content
1. Basic information;
2. Overview of NAMA;
3. Scope and Objectives.
1. Basic information
• Title of NAMA: Program for Support Wind Power Development in Vietnam;
• NAMA Implementation coordinating entity:Department of Meteorology Hydrology and Climate Change;
• Name of person(s)/organization responsible for developing the NAMA proposal: Vietnam Institute of Meteorology, Hydrology and Environment;
• Sector/Subsector: Energy/Wind Power
• Greenhouse Gas covered by the Action: CO2
(1) Collection of Info on relevant policies and strategies
Collect and analyze relevant policy documents of development, climate change and related sector
(2) Collection data for BAU in the sector
Collect data for calculating BAU emission
(3) Quantification GHG emissions of BAU
Quantify GHG emissions based on (2) data, and a) Identify the calculation formulas b) Calculate respective emission in BAUc) Aggregate respective emissions
(4) Examination and selection of NAMAs options
Select possible NAMAs options and technologies based on (1) policies and mitigation strategies and additional consideration.
(5) Quantification GHG emission reduction by NAMAs
Quantify GHG emissions with (4)NAMAs assumptionsa) Set the calculation formulasb) Calculationc) Aggregate potential with reduction by NAMAs
Steps for NAMAs Design
Supporting Policies and
incentives survey
Examination MRV methods
2. Overview of the NAMA
2.1 Brief Description of the objectives of the proposed NAMA:
• The current situation:– Energy demand by 2030: 4 times– Electricity demand: 10% per year– CDM?– Environmental impacts from hydropower– Wind power potential: 500,000 MW (WB, IEA)– 2010: 48 projects: 1 IO (31 MW)
• The situation after NAMA implementation:– 48 wind power projects in operation (IO)– 0.7% (1000 MW) and 2.4% (6,200 MW) of total electricity
production by 2020 and 2030
2. Overview of the NAMA (cont’)
2.1 Brief Description of the objectives of the proposed NAMA (cont’):
• Measures which would be implemented under the NAMA: specifically supporting policies and mechanisms
• The sources of emissions that will be addressed by the proposed NAMA: CO2
• How the proposed NAMA reduces GHG emissions: develop wind power instead of thermal power plants
Elements of a paradigm shift for transformational change
Source: NAMA Facility, 2013
Thanks!
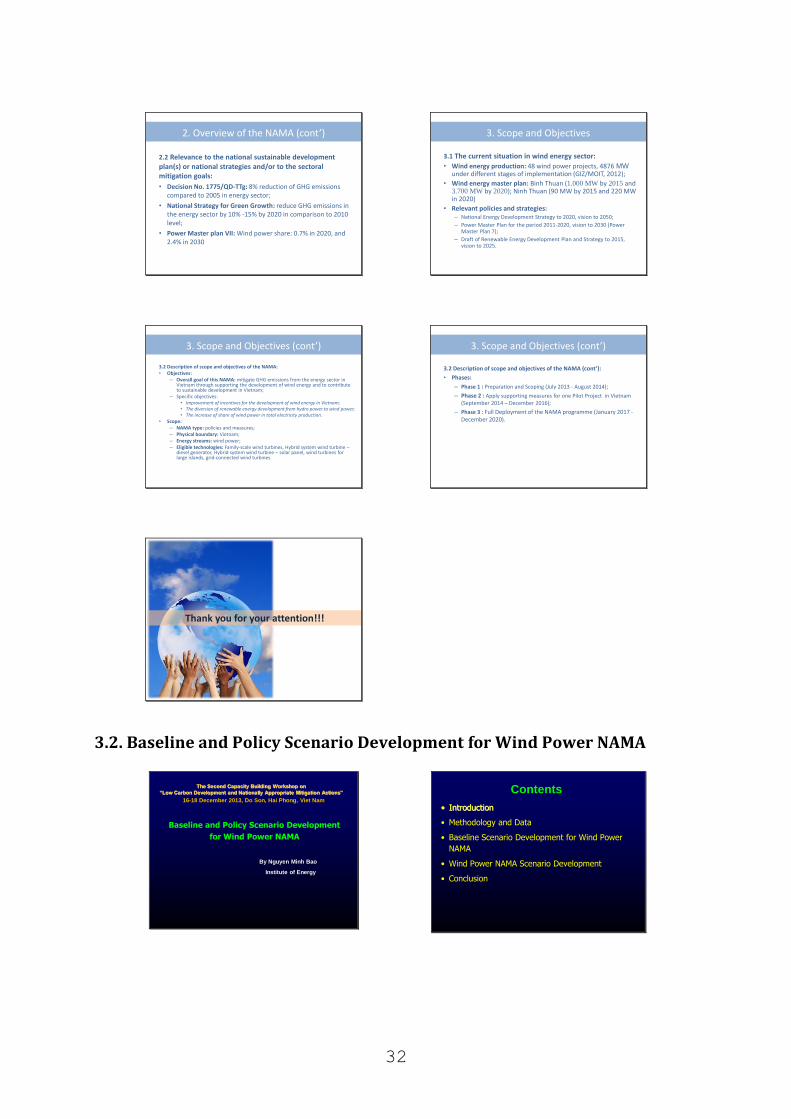
32
2. Overview of the NAMA (cont’)
2.2 Relevance to the national sustainable development plan(s) or national strategies and/or to the sectoralmitigation goals:
• Decision No. 1775/QD-TTg: 8% reduction of GHG emissions compared to 2005 in energy sector;
• National Strategy for Green Growth: reduce GHG emissions in the energy sector by 10% -15% by 2020 in comparison to 2010 level;
• Power Master plan VII: Wind power share: 0.7% in 2020, and 2.4% in 2030
3. Scope and Objectives
3.1 The current situation in wind energy sector:
• Wind energy production: 48 wind power projects, 4876 MWunder different stages of implementation (GIZ/MOIT, 2012);
• Wind energy master plan: Binh Thuan (1.000 MW by 2015 and3.700 MW by 2020); Ninh Thuan (90 MW by 2015 and 220 MW in 2020)
• Relevant policies and strategies: – National Energy Development Strategy to 2020, vision to 2050;
– Power Master Plan for the period 2011-2020, vision to 2030 (Power Master Plan 7);
– Draft of Renewable Energy Development Plan and Strategy to 2015, vision to 2025.
3. Scope and Objectives (cont’)
3.2 Description of scope and objectives of the NAMA:• Objectives:
– Overall goal of this NAMA: mitigate GHG emissions from the energy sector in Vietnam through supporting the development of wind energy and to contribute to sustainable development in Vietnam;
– Specific objectives: • Improvement of incentives for the development of wind energy in Vietnam;• The diversion of renewable energy development from hydro power to wind power;• The increase of share of wind power in total electricity production.
• Scope: – NAMA type: policies and measures;– Physical boundary: Vietnam;– Energy streams: wind power;– Eligible technologies: Family-scale wind turbines, Hybrid system wind turbine –
diesel generator, Hybrid system wind turbine – solar panel, wind turbines for large islands, grid-connected wind turbines.
3. Scope and Objectives (cont’)
3.2 Description of scope and objectives of the NAMA (cont’):
• Phases:
– Phase 1 : Preparation and Scoping (July 2013 - August 2014);
– Phase 2 : Apply supporting measures for one Pilot Project in Vietnam (September 2014 – December 2016);
– Phase 3 : Full Deployment of the NAMA programme (January 2017 -December 2020).
Thank you for your attention!!!
3.2. Baseline and Policy Scenario Development for Wind Power NAMA
The Second Capacity Building Workshop on
“Low Carbon Development and Nationally Appropriate Mitigation Actions”
Baseline and Policy Scenario Development
for Wind Power NAMA
By Nguyen Minh Bao
Institute of Energy
16-18 December 2013, Do Son, Hai Phong, Viet Nam
Contents
• Introduction
• Methodology and Data
• Baseline Scenario Development for Wind Power
NAMA
• Wind Power NAMA Scenario Development
• Conclusion
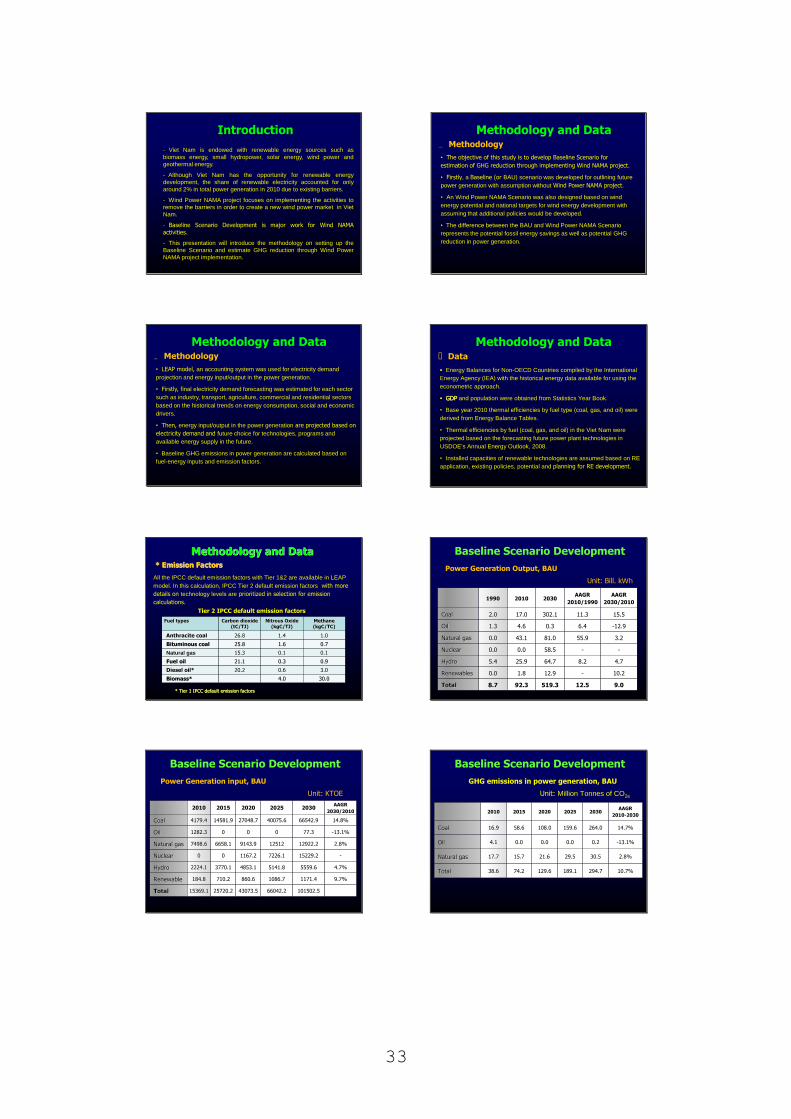
33
Introduction
- Viet Nam is endowed with renewable energy sources such as
biomass energy, small hydropower, solar energy, wind power and
geothermal energy.
- Although Viet Nam has the opportunity for renewable energy
development, the share of renewable electricity accounted for only
around 2% in total power generation in 2010 due to existing barriers.
- Wind Power NAMA project focuses on implementing the activities to
remove the barriers in order to create a new wind power market in Viet
Nam.
- Baseline Scenario Development is major work for Wind NAMA
activities.
- This presentation will introduce the methodology on setting up the
Baseline Scenario and estimate GHG reduction through Wind Power
NAMA project implementation.
• The objective of this study is to develop Baseline Scenario for
estimation of GHG reduction through implementing Wind NAMA project.
• Firstly, a Baseline (or BAU) scenario was developed for outlining future
power generation with assumption without Wind Power NAMA project.
• An Wind Power NAMA Scenario was also designed based on wind
energy potential and national targets for wind energy development with
assuming that additional policies would be developed.
• The difference between the BAU and Wind Power NAMA Scenario
represents the potential fossil energy savings as well as potential GHG
reduction in power generation.
Methodology and Data Methodology
• LEAP model, an accounting system was used for electricity demand
projection and energy input/output in the power generation.
• Firstly, final electricity demand forecasting was estimated for each sector
such as industry, transport, agriculture, commercial and residential sectors
based on the historical trends on energy consumption, social and economic
drivers.
• Then, energy input/output in the power generation are projected based on
electricity demand and future choice for technologies, programs and
available energy supply in the future.
• Baseline GHG emissions in power generation are calculated based on
fuel-energy inputs and emission factors.
Methodology and Data Methodology
•• Energy Balances for Non-OECD Countries compiled by the International
Energy Agency (IEA) with the historical energy data available for using the
econometric approach.
•• GDPGDP and population were obtained from Statistics Year Book.
• Base year 2010 thermal efficiencies by fuel type (coal, gas, and oil) were
derived from Energy Balance Tables.
• Thermal efficiencies by fuel (coal, gas, and oil) in the Viet Nam were
projected based on the forecasting future power plant technologies in
USDOE‟s Annual Energy Outlook, 2008.
• Installed capacities of renewable technologies are assumed based on RE
application, existing policies, potential and planning for RE development.
Methodology and Data Data
Methodology and DataMethodology and Data* Emission Factors* Emission Factors
All the IPCC default emission factors with Tier 1&2 are available in LEAP
model. In this calculation, IPCC Tier 2 default emission factors with more
details on technology levels are prioritized in selection for emission
calculations.
Fuel typesFuel types Carbon dioxideCarbon dioxide
((tC/TJ)tC/TJ)Nitrous OxideNitrous Oxide
(kgC/TJ) (kgC/TJ) Methane Methane
(kgC/TC)(kgC/TC)
Anthracite coalAnthracite coal 26.826.8 1.41.4 1.01.0
Bituminous coal Bituminous coal 25.825.8 1.61.6 0.70.7
Natural gas Natural gas 15.315.3 0.10.1 0.10.1
Fuel oilFuel oil 21.121.1 0.30.3 0.90.9
Diesel oil*Diesel oil* 20.220.2 0.60.6 3.03.0
Biomass*Biomass* 4.04.0 30.030.0
Tier 2 IPCC default emission factors
* Tier 1 * Tier 1 IPCC default emission factorsIPCC default emission factors
Power Generation Output, BAU
Unit: Bill. kWh
19901990 20102010 20302030AAGRAAGR
2010/19902010/1990
AAGRAAGR
2030/20102030/2010
CoalCoal 2.02.0 17.017.0 302.1302.1 11.311.3 15.515.5
OilOil 1.31.3 4.64.6 0.30.3 6.46.4 --12.912.9
Natural gasNatural gas 0.00.0 43.143.1 81.081.0 55.955.9 3.23.2
NuclearNuclear 0.00.0 0.00.0 58.558.5 -- --
HydroHydro 5.45.4 25.925.9 64.764.7 8.28.2 4.74.7
RenewablesRenewables 0.00.0 1.81.8 12.912.9 -- 10.210.2
TotalTotal 8.78.7 92.392.3 519.3519.3 12.512.5 9.09.0
Baseline Scenario Development
Power Generation input, BAU
Unit: KTOE
20102010 20152015 20202020 20252025 20302030AAGRAAGR
2030/20102030/2010
CoalCoal 4179.44179.4 14581.914581.9 27048.727048.7 40075.640075.6 66542.966542.9 14.8%14.8%
OilOil 1282.31282.3 00 00 00 77.377.3 --13.1%13.1%
Natural gasNatural gas 7498.67498.6 6658.16658.1 9143.99143.9 1251212512 12922.212922.2 2.8%2.8%
NuclearNuclear 00 00 1167.21167.2 7226.17226.1 15229.215229.2 --
HydroHydro 2224.12224.1 3770.13770.1 4853.14853.1 5141.85141.8 5559.65559.6 4.7%4.7%
RenewableRenewable 184.8184.8 710.2710.2 860.6860.6 1086.71086.7 1171.41171.4 9.7%9.7%
TotalTotal 15369.115369.1 25720.225720.2 43073.543073.5 66042.266042.2 101502.5101502.5
Baseline Scenario Development
GHG emissions in power generation, BAU
Unit: Million Tonnes of CO2e
20102010 20152015 20202020 20252025 20302030AAGRAAGR
20102010--20302030
CoalCoal 16.9 58.6 108.0 159.6 264.0 14.7%
OilOil 4.1 0.0 0.0 0.0 0.2 -13.1%
Natural gasNatural gas 17.7 15.7 21.6 29.5 30.5 2.8%
Total Total 38.6 74.2 129.6 189.1 294.7 10.7%
Baseline Scenario Development
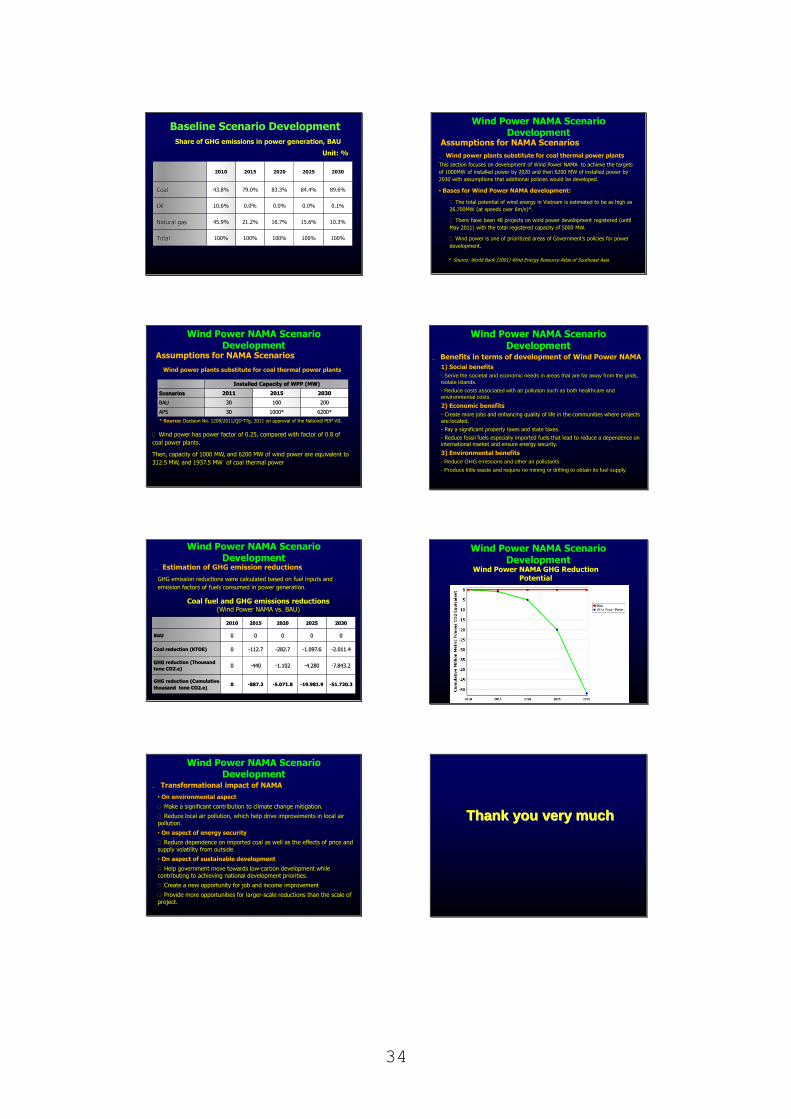
34
Share of GHG emissions in power generation, BAU
Unit: %
20102010 20152015 20202020 20252025 20302030
CoalCoal 43.8% 79.0% 83.3% 84.4% 89.6%
OilOil 10.6% 0.0% 0.0% 0.0% 0.1%
Natural gasNatural gas 45.9% 21.2% 16.7% 15.6% 10.3%
Total Total 100% 100% 100% 100% 100%
Baseline Scenario Development
Assumptions for NAMA Scenarios
Wind power plants substitute for coal thermal power plants
This section focuses on development of Wind Power NAMA to achieve the targets
of 1000MW of installed power by 2020 and then 6200 MW of installed power by
2030 with assumptions that additional policies would be developed.
• Bases for Wind Power NAMA development:
The total potential of wind energy in Vietnam is estimated to be as high as
26.700MW (at speeds over 6m/s)*.
There have been 48 projects on wind power development registered (until
May 2011) with the total registered capacity of 5000 MW.
Wind power is one of prioritized areas of Government’s policies for power
development.
Wind Power NAMA Scenario Development
* Source: World Bank (2001) Wind Energy Resource Atlas of Southeast Asia.
Assumptions for NAMA Scenarios
Wind Power NAMA Scenario Development
* Source: Decision No. 1208/2011/QD-TTg, 2011 on approval of the National PDP VII.
Installed Capacity of WPP (MW)
Scenarios 2011 2015 2030
BAU 30 100 200
APS 30 1000* 6200*
Wind power plants substitute for coal thermal power plants
Wind power has power factor of 0.25, compared with factor of 0.8 of
coal power plants.
Then, capacity of 1000 MW, and 6200 MW of wind power are equivalent to
312.5 MW, and 1937.5 MW of coal thermal power
Wind Power NAMA Scenario Development
Benefits in terms of development of Wind Power NAMA
1) Social benefits
- Serve the societal and economic needs in areas that are far away from the grids,
isolate islands.
- Reduce costs associated with air pollution such as both healthcare and
environmental costs.
2) Economic benefits
- Create more jobs and enhancing quality of life in the communities where projects are located.
- Pay a significant property taxes and state taxes.
- Reduce fossil fuels especially imported fuels that lead to reduce a dependence on international market and ensure energy security.
3) Environmental benefits
- Reduce GHG emissions and other air pollutants.
- Produce little waste and require no mining or drilling to obtain its fuel supply.
Wind Power NAMA Scenario Development
Coal fuel and GHG emissions reductions (Wind Power NAMA vs. BAU)
2010 2015 2020 2025 2030
BAU 0 0 0 0 0
Coal reduction (KTOE) 0 -112.7 -282.7 -1.097.6 -2.011.4
GHG reduction (Thousand
tone CO2.e)0 -440 -1.102 -4.280 -7.843.2
GHG reduction (Cumulative
thousand tone CO2.e)0 -887.2 -5.071.8 -19.981.9 -51.720.3
Estimation of GHG emission reductions
GHG emission reductions were calculated based on fuel inputs and
emission factors of fuels consumed in power generation.
Wind Power NAMA GHG Reduction Potential
Wind Power NAMA Scenario Development
Wind Power NAMA Scenario Development
Transformational impact of NAMA
• On environmental aspect
Make a significant contribution to climate change mitigation.
Reduce local air pollution, which help drive improvements in local air pollution.
• On aspect of energy security
Reduce dependence on imported coal as well as the effects of price and supply volatility from outside.
• On aspect of sustainable development
Help government move towards low-carbon development while contributing to achieving national development priorities.
Create a new opportunity for job and income improvement
Provide more opportunities for larger-scale reductions than the scale of project.
Thank you very muchThank you very much
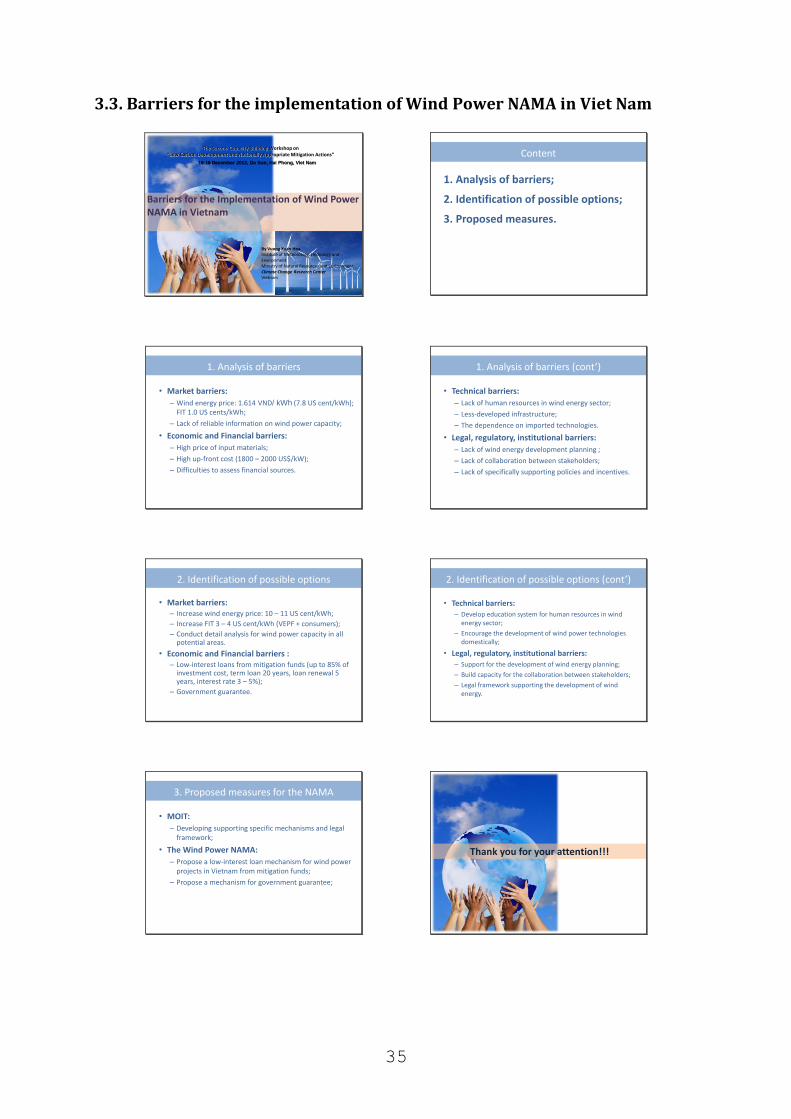
35
3.3. Barriers for the implementation of Wind Power NAMA in Viet Nam
NAMA potential of Vietnam
By Vuong Xuan HoaInstitute of Meteorology, Hydrology and EnvironmentMinistry of Natural Resources and EnvironmentClimate Change Research CenterVietnam
Barriers for the Implementation of Wind Power NAMA in Vietnam
The Second Capacity Building Workshop on “Low Carbon Development and Nationally Appropriate Mitigation Actions”
16-18 December 2013, Do Son, Hai Phong, Viet Nam
Content
1. Analysis of barriers;
2. Identification of possible options;
3. Proposed measures.
1. Analysis of barriers
• Market barriers:
– Wind energy price: 1.614 VND/ kWh (7.8 US cent/kWh); FIT 1.0 US cents/kWh;
– Lack of reliable information on wind power capacity;
• Economic and Financial barriers:
– High price of input materials;
– High up-front cost (1800 – 2000 US$/kW);
– Difficulties to assess financial sources.
1. Analysis of barriers (cont’)
• Technical barriers:
– Lack of human resources in wind energy sector;
– Less-developed infrastructure;
– The dependence on imported technologies.
• Legal, regulatory, institutional barriers:
– Lack of wind energy development planning ;
– Lack of collaboration between stakeholders;
– Lack of specifically supporting policies and incentives.
2. Identification of possible options
• Market barriers: – Increase wind energy price: 10 – 11 US cent/kWh;
– Increase FIT 3 – 4 US cent/kWh (VEPF + consumers);
– Conduct detail analysis for wind power capacity in all potential areas.
• Economic and Financial barriers :– Low-interest loans from mitigation funds (up to 85% of
investment cost, term loan 20 years, loan renewal 5 years, interest rate 3 – 5%);
– Government guarantee.
2. Identification of possible options (cont’)
• Technical barriers:
– Develop education system for human resources in wind energy sector;
– Encourage the development of wind power technologies domestically;
• Legal, regulatory, institutional barriers:
– Support for the development of wind energy planning;
– Build capacity for the collaboration between stakeholders;
– Legal framework supporting the development of wind energy.
3. Proposed measures for the NAMA
• MOIT:
– Developing supporting specific mechanisms and legal framework;
• The Wind Power NAMA:
– Propose a low-interest loan mechanism for wind power projects in Vietnam from mitigation funds;
– Propose a mechanism for government guarantee;
Thank you for your attention!!!
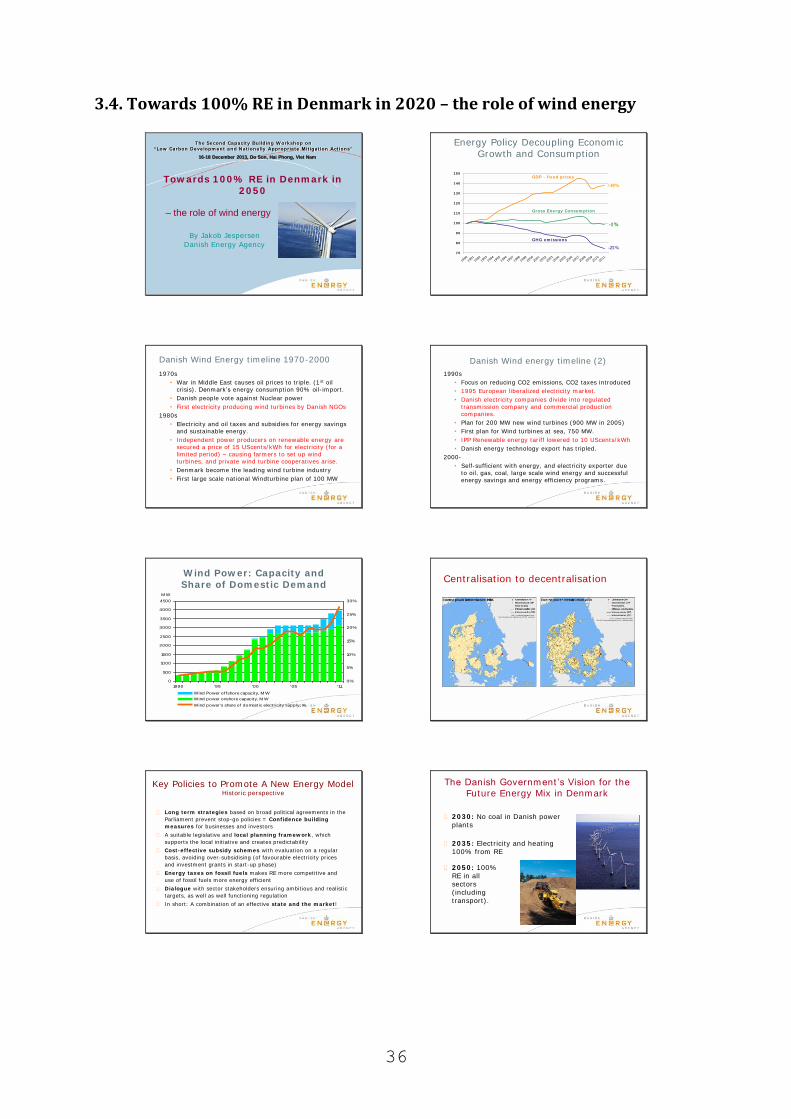
36
3.4. Towards 100% RE in Denmark in 2020 – the role of wind energy
Tow ards 1 0 0 % RE in Denm ark in
2 0 5 0
By Jakob Jespersen
Danish Energy Agency
– the role of wind energy
16-18 December 2013, Do Son, Hai Phong, Viet Nam
The Second Capacity Building W orkshop on
“Low Carbon Development and Nat ionally Appropriate Mit igat ion Act ions”
Energy Policy Decoupling Economic
Growth and Consumpt ion
-25%7 0
8 0
9 0
1 00
1 10
1 20
1 30
1 40
1 50
-1%
+38%
GDP - fixed pr ices
Gross Energy Consum ption
GHG em issions
Danish Wind Energy t im eline 1970-2000
1970s
• War in Middle East causes oil prices to t r iple. (1 st oil
cr isis) . Denm ark‟s energy consum pt ion 90% oil- im port .
• Danish people vote against Nuclear power
• First elect r icity producing wind turbines by Danish NGOs
1980s
• Elect r icity and oil taxes and subsidies for energy savings
and sustainable energy.
• I ndependent power producers on renewable energy are
secured a price of 15 UScents/ kWh for elect r icit y ( for a
lim ited period) – causing farm ers to set up wind
turbines, and private wind turbine cooperat ives arise.
• Denm ark becom e the leading wind turbine indust ry
• First large scale nat ional Windturbine plan of 100 MW
Danish Wind energy t im eline (2)
1990s
• Focus on reducing CO2 em issions, CO2 taxes int roduced
• 1995 European liberalized elect r icit y m arket .
• Danish elect r icit y com panies divide into regulated
t ransm ission com pany and com m ercial product ion
com panies.
• Plan for 200 MW new wind turbines (900 MW in 2005)
• First plan for Wind turbines at sea, 750 MW.
• IPP Renewable energy tariff lowered to 10 UScents/ kWh
• Danish energy technology export has t r ipled.
2000-
• Self-sufficient with energy, and elect r icit y exporter due
to oil, gas, coal, large scale wind energy and successful
energy savings and energy efficiency program s.
W ind Pow er: Capacity and
Share of Dom est ic Dem and
0
500
1000
1500
2000
2500
3000
3500
4000
4500
1990 '95 '00 '05 '11
M W
0%
5%
10%
15%
20%
25%
30%
Wind Power offshore capacity, M W
Wind power onshore capacity, M W
Wind power's share of domestic electricity supply, %
Centralisat ion to decent ralisat ion
Key Policies to Prom ote A New Energy Model Histor ic perspect ive
Long term strategies based on broad polit ical agreements in the
Parliament prevent stop-go policies = Confidence building
m easures for businesses and investors
A suitable legislat ive and local planning fram ew ork , which
supports the local init iat ive and creates predictabilit y
Cost - effect ive subsidy schem es with evaluat ion on a regular
basis, avoiding over-subsidising (of favourable elect r icit y pr ices
and investment grants in start -up phase)
Energy taxes on fossil fuels makes RE more compet it ive and
use of fossil fuels more energy efficient
Dialogue with sector stakeholders ensuring ambit ious and realist ic
targets, as well as well funct ioning regulat ion
I n short : A combinat ion of an effect ive state and the m arket !
The Danish Government ‟s Vision for the
Future Energy Mix in Denmark
2 0 3 0 : No coal in Danish power
plants
2 0 3 5 : Elect r icity and heat ing
100% from RE
2 0 5 0 : 100%
RE in all
sectors
( including
t ransport ) .
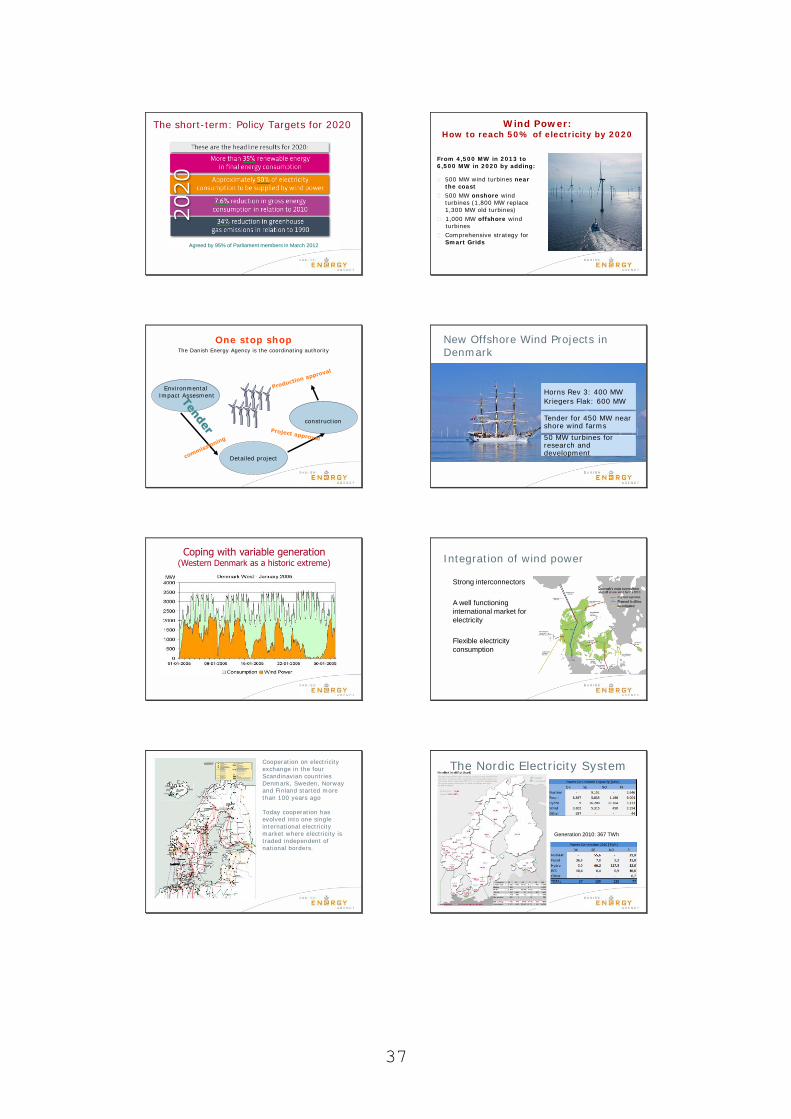
37
The short - term : Policy Targets for 2020
Agreed by 95% of Parliament members in March 2012
W ind Pow er: How to reach 5 0 % of electr icity by 2 0 2 0
From 4 ,5 0 0 MW in 2 0 1 3 to
6 ,5 0 0 MW in 2 0 2 0 by adding:
500 MW wind turbines near
the coast
500 MW onshore wind
turbines (1,800 MW replace
1,300 MW old turbines)
1,000 MW offshore wind
turbines
Com prehensive st rategy for
Sm art Grids
One stop shopThe Danish Energy Agency is the coordinat ing authorit y
Environm ental
Im pact Assesm ent
Detailed project
const ruct ion
New Offshore Wind Projects in
Denmark
Horns Rev 3: 400 MW
Kriegers Flak: 600 MW
Tender for 450 MW near shore wind farms
50 MW turbines for research and development
Coping with variable generation(Western Denmark as a historic extreme)
I ntegrat ion of wind power
Strong interconnectors
A well functioning
international market for
electricity
Flexible electricity
consumption
PJ
Cooperat ion on elect r icit y
exchange in the four
Scandinavian count ries
Denm ark, Sweden, Norway
and Finland started m ore
than 100 years ago
Today cooperat ion has
evolved into one single
internat ional elect r icit y
m arket where elect r icity is
t raded independent of
nat ional borders.
The Nordic Elect r icity System
Generation 2010: 367 TWh
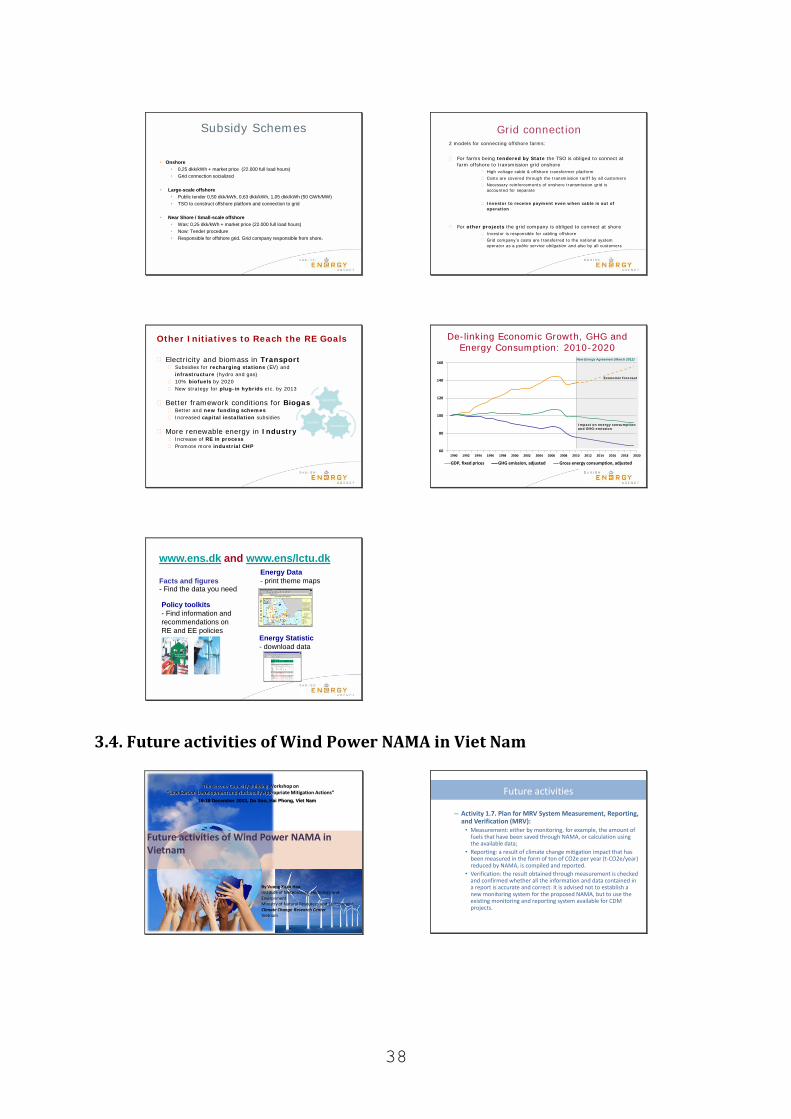
38
Subsidy Schemes
• Onshore
• 0,25 dkk/kWh + market price (22.000 full load hours)
• Grid connection socialized
• Large-scale offshore
• Public tender 0,50 dkk/kWh, 0,63 dkk/kWh, 1,05 dkk/kWh (50 GWh/MW)
• TSO to construct offshore platform and connection to grid
• Near Shore / Small-scale offshore
• Was: 0,25 dkk/kWh + market price (22.000 full load hours)
• Now: Tender procedure
• Responsible for offshore grid. Grid company responsible from shore.
Grid connect ion2 models for connect ing offshore farms:
For farms being tendered by State the TSO is obliged to connect at
farm offshore to t ransm ission gr id onshore
High voltage cable & offshore t ransformer plat form
Costs are covered through the t ransmission tar iff by all customers
Necessary reinforcements of onshore t ransmission gr id is
accounted for separate
I nvestor to receive paym ent even w hen cable is out of
operat ion
For other projects the gr id company is obliged to connect at shore
I nvestor is responsible for cabling offshore
Grid company‟s costs are t ransferred to the nat ional system
operator as a public service obligat ion and also by all customers
Other I nit iat ives to Reach the RE Goals
Elect r icity and biomass in Transport Subsidies for recharging stat ions (EV) and
infrastructure (hydro and gas)
10% biofuels by 2020
New st rategy for plug- in hybrids etc. by 2013
Bet ter framework condit ions for Biogas Bet ter and new funding schem es
I ncreased capital installat ion subsidies
More renewable energy in I ndust ry I ncrease of RE in process
Promote more industrial CHP
TRANSPORT
BI OGAS
I NDUSTRY
De- linking Economic Growth, GHG and
Energy Consumpt ion: 2010-2020
60
80
100
120
140
160
GDP, fixed prices GHG emission, adjusted Gross energy consumption, adjusted
New Energy Agreement (March 2012)
Econom ic forecast
I m pact on energy consum pt ion
and GHG- em ission
www.ens.dk and www.ens/lctu.dk
Energy Statistic
- download data
Energy Data
- print theme mapsFacts and figures- Find the data you need
Policy toolkits
- Find information and
recommendations on
RE and EE policies
3.4. Future activities of Wind Power NAMA in Viet Nam
NAMA potential of Vietnam
By Vuong Xuan HoaInstitute of Meteorology, Hydrology and EnvironmentMinistry of Natural Resources and EnvironmentClimate Change Research CenterVietnam
Future activities of Wind Power NAMA in Vietnam
The Second Capacity Building Workshop on “Low Carbon Development and Nationally Appropriate Mitigation Actions”
16-18 December 2013, Do Son, Hai Phong, Viet Nam
Future activities
– Activity 1.7. Plan for MRV System Measurement, Reporting, and Verification (MRV):
• Measurement: either by monitoring, for example, the amount of fuels that have been saved through NAMA, or calculation using the available data;
• Reporting: a result of climate change mitigation impact that has been measured in the form of ton of CO2e per year (t-CO2e/year) reduced by NAMA, is compiled and reported.
• Verification: the result obtained through measurement is checked and confirmed whether all the information and data contained in a report is accurate and correct. It is advised not to establish a new monitoring system for the proposed NAMA, but to use the existing monitoring and reporting system available for CDM projects.
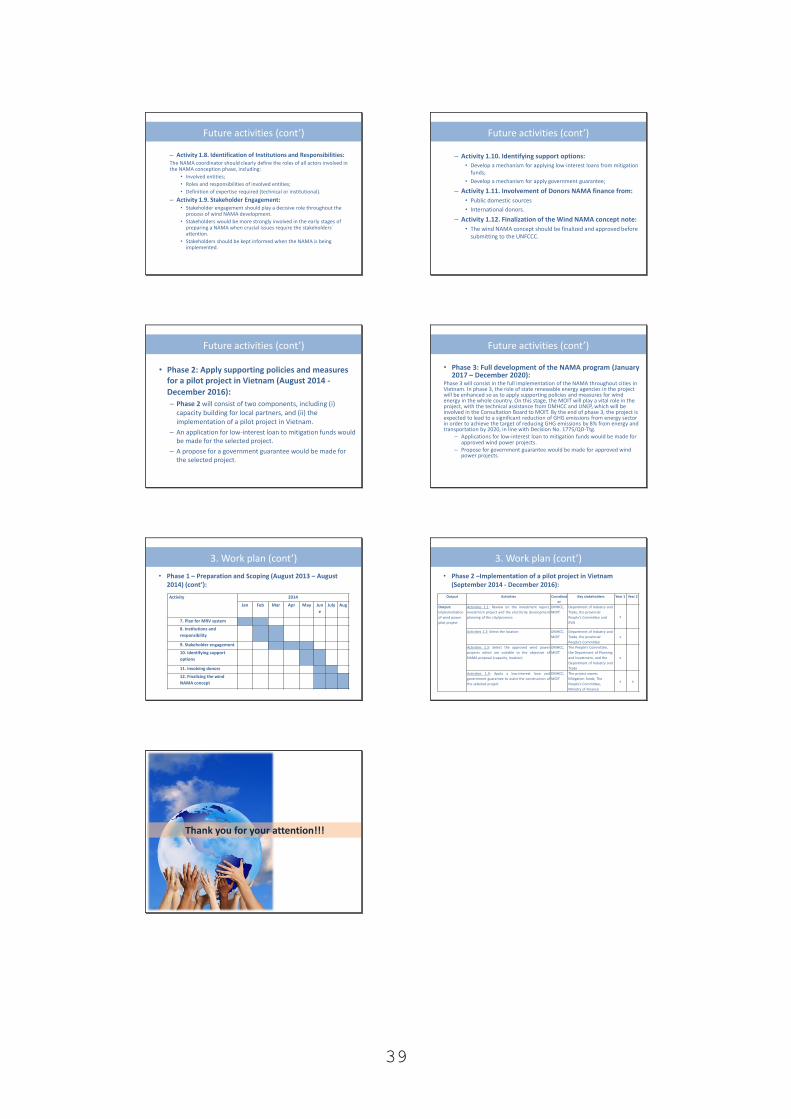
39
Future activities (cont’)
– Activity 1.8. Identification of Institutions and Responsibilities:The NAMA coordinator should clearly define the roles of all actors involved in the NAMA conception phase, including:
• Involved entities;
• Roles and responsibilities of involved entities;
• Definition of expertise required (technical or institutional).
– Activity 1.9. Stakeholder Engagement:• Stakeholder engagement should play a decisive role throughout the
process of wind NAMA development.
• Stakeholders would be more strongly involved in the early stages of preparing a NAMA when crucial issues require the stakeholders´attention.
• Stakeholders should be kept informed when the NAMA is being implemented.
Future activities (cont’)
– Activity 1.10. Identifying support options:• Develop a mechanism for applying low-interest loans from mitigation
funds;
• Develop a mechanism for apply government guarantee;
– Activity 1.11. Involvement of Donors NAMA finance from:
• Public domestic sources
• International donors.
– Activity 1.12. Finalization of the Wind NAMA concept note:
• The wind NAMA concept should be finalized and approved before submitting to the UNFCCC.
Future activities (cont’)
• Phase 2: Apply supporting policies and measures for a pilot project in Vietnam (August 2014 -
December 2016):– Phase 2 will consist of two components, including (i)
capacity building for local partners, and (ii) the implementation of a pilot project in Vietnam.
– An application for low-interest loan to mitigation funds would be made for the selected project.
– A propose for a government guarantee would be made for the selected project.
Future activities (cont’)
• Phase 3: Full development of the NAMA program (January 2017 – December 2020):
Phase 3 will consist in the full implementation of the NAMA throughout cities in Vietnam. In phase 3, the role of state renewable energy agencies in the project will be enhanced so as to apply supporting policies and measures for wind energy in the whole country. On this stage, the MOIT will play a vital role in the project, with the technical assistance from DMHCC and UNEP, which will be involved in the Consultation Board to MOIT. By the end of phase 3, the project is expected to lead to a significant reduction of GHG emissions from energy sector in order to achieve the target of reducing GHG emissions by 8% from energy and transportation by 2020, in line with Decision No. 1775/QD-Ttg.
– Applications for low-interest loan to mitigation funds would be made for approved wind power projects.
– Propose for government guarantee would be made for approved wind power projects.
3. Work plan (cont’)
• Phase 1 – Preparation and Scoping (August 2013 – August 2014) (cont’):
Activity 2014
Jan Feb Mar Apr May Jun
e
July Aug
7. Plan for MRV system
8. Institutions and
responsibility
9. Stakeholder engagement
10. Identifying support
options
11. Involving donors
12. Finalizing the wind
NAMA concept
3. Work plan (cont’)
• Phase 2 –Implementation of a pilot project in Vietnam (September 2014 - December 2016):
Output Activities Coordinat
or
Key stakeholders Year 1 Year 2
Output:
implementation
of wind power
pilot project
Activities 1.1: Review on the investment report,
investment project and the electricity development
planning of the city/province
DMHCC,
MOIT
Department of Industry and
Trade, the provincial
People’s Committee and
EVN
x
Activities 1.2: Select the location DMHCC,
MOIT
Department of Industry and
Trade, the provincial
People’s Committee
x
Activities 1.3: Select the approved wind power
projects which are suitable to the objective of
NAMA proposal (capacity, location)
DMHCC,
MOIT
The People’s Committee,
the Department of Planning
and Investment, and the
Department of Industry and
Trade
x
Activities 1.4: Apply a low-interest loan and
government guarantee to assist the construction of
the selected project
DMHCC,
MOIT
The project owner,
Mitigation funds, The
People’s Committee,
Ministry of Finance
x x
Thank you for your attention!!!
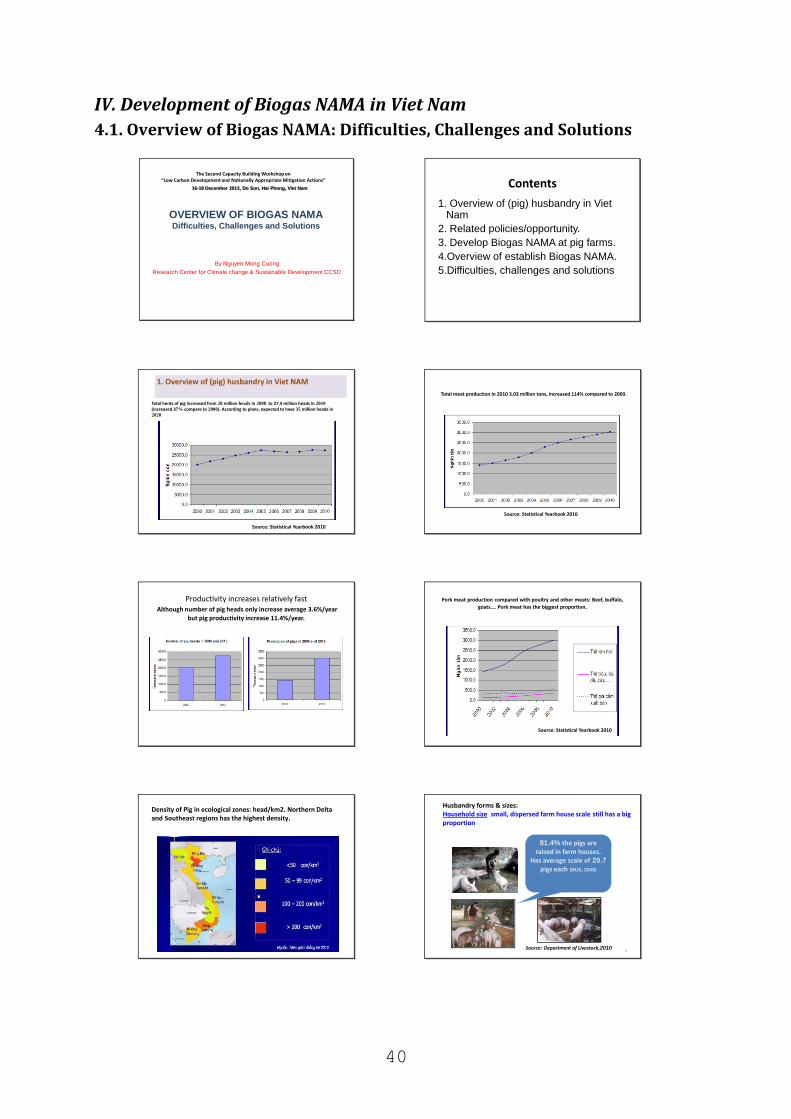
40
IV. Development of Biogas NAMA in Viet Nam
4.1. Overview of Biogas NAMA: Difficulties, Challenges and Solutions
OVERVIEW OF BIOGAS NAMADifficulties, Challenges and Solutions
By Nguyen Mong Cuong
Research Center for Climate change & Sustainable Development CCSD
The Second Capacity Building Workshop on “Low Carbon Development and Nationally Appropriate Mitigation Actions”
16-18 December 2013, Do Son, Hai Phong, Viet Nam
Contents
1. Overview of (pig) husbandry in Viet Nam
2. Related policies/opportunity.
3. Develop Biogas NAMA at pig farms.
4.Overview of establish Biogas NAMA.
5.Difficulties, challenges and solutions
Total herds of pig increased from 20 million heads in 2000 to 27.4 million heads in 2010
(increased 37% compare to 2000). According to plans, expected to have 35 million heads in2020
Source: Statistical Yearbook 2010
1. Overview of (pig) husbandry in Viet NAM
Total meat production in 2010 3.03 million tons, increased 114% compared to 2000.
Source: Statistical Yearbook 2010
Productivity increases relatively fastAlthough number of pig heads only increase average 3.6%/year
but pig productivity increase 11.4%/year.
Pork meat production compared with poultry and other meats: Beef, buffalo,
goats…. Pork meat has the biggest proportion.
Source: Statistical Yearbook 2010
Density of Pig in ecological zones: head/km2. Northern Delta and Southeast regions has the highest density.
8
Husbandry forms & sizes: Household size small, dispersed farm house scale still has a big proportion
81.4% the pigs are raised in farm houses.
Has average scale of 20.7
pigs each (BUS, 2009)
Source: Department of Livestock,2010
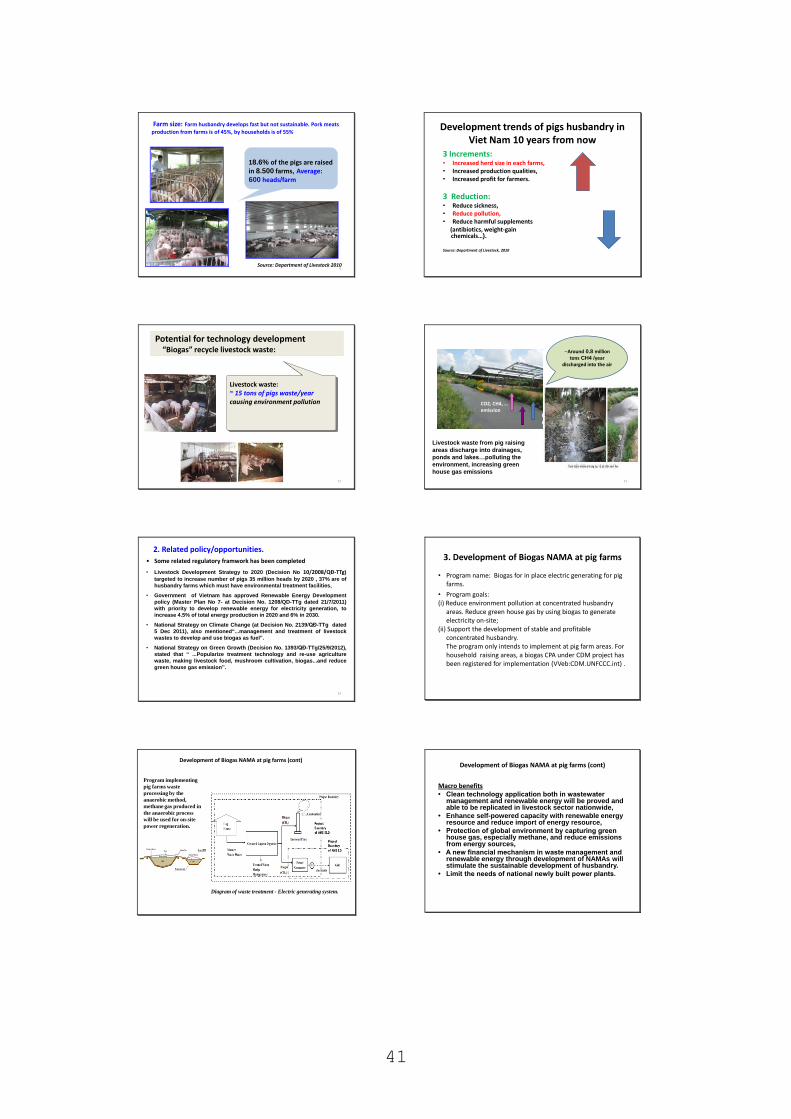
41
9
Farm size: Farm husbandry develops fast but not sustainable. Pork meats
production from farms is of 45%, by households is of 55%
18.6% of the pigs are raisedin 8.500 farms, Average:600 heads/farm
Source: Department of Livestock 2010
Development trends of pigs husbandry in Viet Nam 10 years from now
3 Increments:• Increased herd size in each farms,• Increased production qualities,• Increased profit for farmers.
3 Reduction:• Reduce sickness,• Reduce pollution,• Reduce harmful supplements
(antibiotics, weight-gain chemicals…).
Source: Department of Livestock, 2010
11
Potential for technology development“Biogas” recycle livestock waste:
Livestock waste: ~ 15 tons of pigs waste/yearcausing environment pollution
12
Livestock waste from pig raising
areas discharge into drainages,
ponds and lakes…polluting the
environment, increasing green
house gas emissions
Phát thảiCO2, CH4, …
CO2, CH4, …emission
~Around 0.8 million tons CH4 /year
discharged into the air
13
2. Related policy/opportunities.
• Some related regulatory framwork has been completed
• Livestock Development Strategy to 2020 (Decision No 10/2008/QĐ-TTg)
targeted to increase number of pigs 35 million heads by 2020 , 37% are of
husbandry farms which must have environmental treatment facilities,
• Government of Vietnam has approved Renewable Energy Development
policy (Master Plan No 7- at Decision No. 1208/QD-TTg dated 21/7/2011)
with priority to develop renewable energy for electricity generation, to
increase 4.5% of total energy production in 2020 and 6% in 2030.
• National Strategy on Climate Change (at Decision No. 2139/QĐ-TTg dated
5 Dec 2011), also mentioned“...management and treatment of livestock
wastes to develop and use biogas as fuel”.
• National Strategy on Green Growth (Decision No. 1393/QĐ-TTg/25/9/2012),
stated that “ ...Popularize treatment technology and re-use agriculture
waste, making livestock food, mushroom cultivation, biogas...and reduce
green house gas emission”.
3. Development of Biogas NAMA at pig farms
• Program name: Biogas for in place electric generating for pig farms.
• Program goals:(i) Reduce environment pollution at concentrated husbandry
areas. Reduce green house gas by using biogas to generate electricity on-site;
(ii) Support the development of stable and profitable concentrated husbandry. The program only intends to implement at pig farm areas. For household raising areas, a biogas CPA under CDM project has been registered for implementation (VVeb:CDM.UNFCCC.int) .
Development of Biogas NAMA at pig farms (cont)
Program implementing
pig farms waste
processing by the
anaerobic method,
methane gas produced in
the anaerobic process
will be used for on-site
power regeneration.
Diagram of waste treatment - Electric generating system.
Development of Biogas NAMA at pig farms (cont)
Macro benefits• Clean technology application both in wastewater
management and renewable energy will be proved and able to be replicated in livestock sector nationwide,
• Enhance self-powered capacity with renewable energy resource and reduce import of energy resource,
• Protection of global environment by capturing green house gas, especially methane, and reduce emissions from energy sources,
• A new financial mechanism in waste management and renewable energy through development of NAMAs willstimulate the sustainable development of husbandry.
• Limit the needs of national newly built power plants.
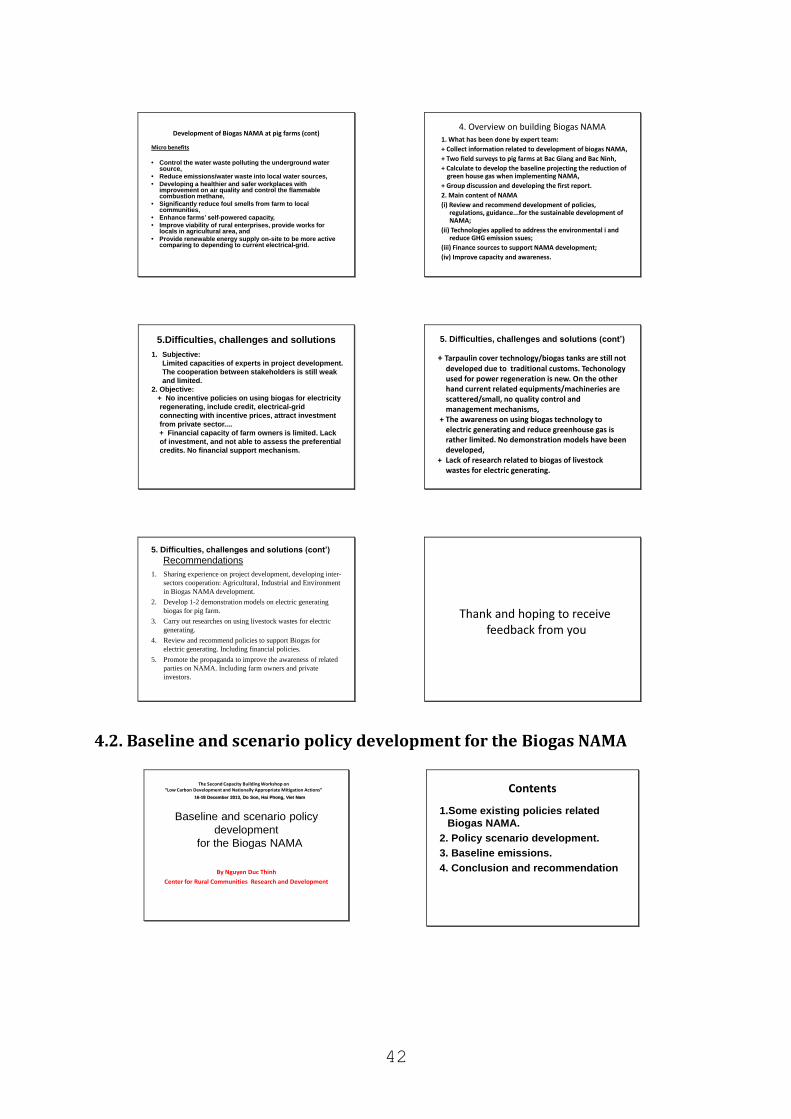
42
Development of Biogas NAMA at pig farms (cont)
Micro benefits
• Control the water waste polluting the underground water source,
• Reduce emissions/water waste into local water sources,
• Developing a healthier and safer workplaces with improvement on air quality and control the flammable combustion methane,
• Significantly reduce foul smells from farm to local communities,
• Enhance farms’ self-powered capacity,
• Improve viability of rural enterprises, provide works for locals in agricultural area, and
• Provide renewable energy supply on-site to be more active comparing to depending to current electrical-grid.
4. Overview on building Biogas NAMA1. What has been done by expert team:
+ Collect information related to development of biogas NAMA,
+ Two field surveys to pig farms at Bac Giang and Bac Ninh,
+ Calculate to develop the baseline projecting the reduction of green house gas when implementing NAMA,
+ Group discussion and developing the first report.
2. Main content of NAMA
(i) Review and recommend development of policies, regulations, guidance...for the sustainable development of NAMA;
(ii) Technologies applied to address the environmental i and reduce GHG emission ssues;
(iii) Finance sources to support NAMA development;
(iv) Improve capacity and awareness.
5.Difficulties, challenges and sollutions
1. Subjective:
Limited capacities of experts in project development.
The cooperation between stakeholders is still weak
and limited.
2. Objective:
+ No incentive policies on using biogas for electricity
regenerating, include credit, electrical-grid
connecting with incentive prices, attract investment
from private sector....
+ Financial capacity of farm owners is limited. Lack
of investment, and not able to assess the preferential
credits. No financial support mechanism.
5. Difficulties, challenges and solutions (cont’)
+ Tarpaulin cover technology/biogas tanks are still not developed due to traditional customs. Techonologyused for power regeneration is new. On the other hand current related equipments/machineries are scattered/small, no quality control and management mechanisms,
+ The awareness on using biogas technology to electric generating and reduce greenhouse gas is rather limited. No demonstration models have been developed,
+ Lack of research related to biogas of livestock wastes for electric generating.
5. Difficulties, challenges and solutions (cont’)
Recommendations
1. Sharing experience on project development, developing inter-
sectors cooperation: Agricultural, Industrial and Environment
in Biogas NAMA development.
2. Develop 1-2 demonstration models on electric generating
biogas for pig farm.
3. Carry out researches on using livestock wastes for electric
generating.
4. Review and recommend policies to support Biogas for
electric generating. Including financial policies.
5. Promote the propaganda to improve the awareness of related
parties on NAMA. Including farm owners and private
investors.
Thank and hoping to receive feedback from you
4.2. Baseline and scenario policy development for the Biogas NAMA
Baseline and scenario policy
development
for the Biogas NAMA
By Nguyen Duc Thinh
Center for Rural Communities Research and Development
The Second Capacity Building Workshop on “Low Carbon Development and Nationally Appropriate Mitigation Actions”
16-18 December 2013, Do Son, Hai Phong, Viet Nam
Contents
1.Some existing policies related
Biogas NAMA.
2. Policy scenario development.
3. Baseline emissions.
4. Conclusion and recommendation
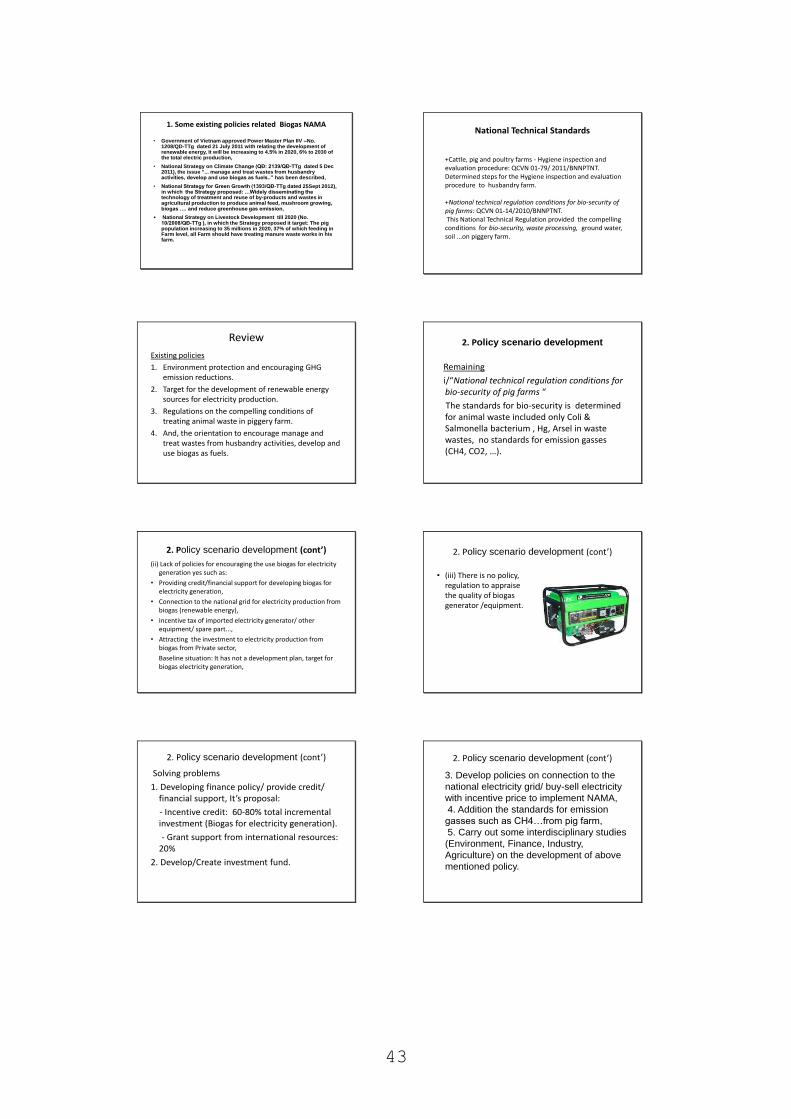
43
1. Some existing policies related Biogas NAMA
• Government of Vietnam approved Power Master Plan IIV –No.1208/QD-TTg dated 21 July 2011 with relating the development of renewable energy, It will be increasing to 4.5% in 2020, 6% to 2030 of the total electric production,
• National Strategy on Climate Change (QĐ: 2139/QĐ-TTg dated 5 Dec 2011), the issue “... manage and treat wastes from husbandry activities, develop and use biogas as fuels..” has been described,
• National Strategy for Green Growth (1393/QĐ-TTg dated 25Sept 2012), in which the Strategy proposed: …Widely disseminating the technology of treatment and reuse of by-products and wastes in agricultural production to produce animal feed, mushroom growing, biogas …. and reduce greenhouse gas emission,
• National Strategy on Livestock Development till 2020 (No.10/2008/QĐ-TTg ), in which the Strategy proposed it target: The pig population increasing to 35 millions in 2020, 37% of which feeding in Farm level, all Farm should have treating manure waste works in his farm.
National Technical Standards
+Cattle, pig and poultry farms - Hygiene inspection and evaluation procedure: QCVN 01-79/ 2011/BNNPTNT. Determined steps for the Hygiene inspection and evaluation procedure to husbandry farm.
+National technical regulation conditions for bio-security of pig farms: QCVN 01-14/2010/BNNPTNT.This National Technical Regulation provided the compelling conditions for bio-security, waste processing, ground water, soil ...on piggery farm.
Review
Existing policies
1. Environment protection and encouraging GHG emission reductions.
2. Target for the development of renewable energy sources for electricity production.
3. Regulations on the compelling conditions of treating animal waste in piggery farm.
4. And, the orientation to encourage manage and treat wastes from husbandry activities, develop and use biogas as fuels.
2. Policy scenario development
Remaining
i/“National technical regulation conditions for bio-security of pig farms “
The standards for bio-security is determined for animal waste included only Coli & Salmonella bacterium , Hg, Arsel in waste wastes, no standards for emission gasses (CH4, CO2, …).
2. Policy scenario development (cont’)
(ii) Lack of policies for encouraging the use biogas for electricity generation yes such as:
• Providing credit/financial support for developing biogas for electricity generation,
• Connection to the national grid for electricity production from biogas (renewable energy),
• Incentive tax of imported electricity generator/ other equipment/ spare part...,
• Attracting the investment to electricity production from biogas from Private sector,
Baseline situation: It has not a development plan, target for biogas electricity generation,
2. Policy scenario development (cont’)
• (iii) There is no policy, regulation to appraise the quality of biogas generator /equipment.
2. Policy scenario development (cont’)
Solving problems
1. Developing finance policy/ provide credit/ financial support, It’s proposal:
- Incentive credit: 60-80% total incremental investment (Biogas for electricity generation).
- Grant support from international resources: 20%
2. Develop/Create investment fund.
2. Policy scenario development (cont’)
3. Develop policies on connection to the
national electricity grid/ buy-sell electricity
with incentive price to implement NAMA,
4. Addition the standards for emission
gasses such as CH4…from pig farm,
5. Carry out some interdisciplinary studies
(Environment, Finance, Industry,
Agriculture) on the development of above
mentioned policy.
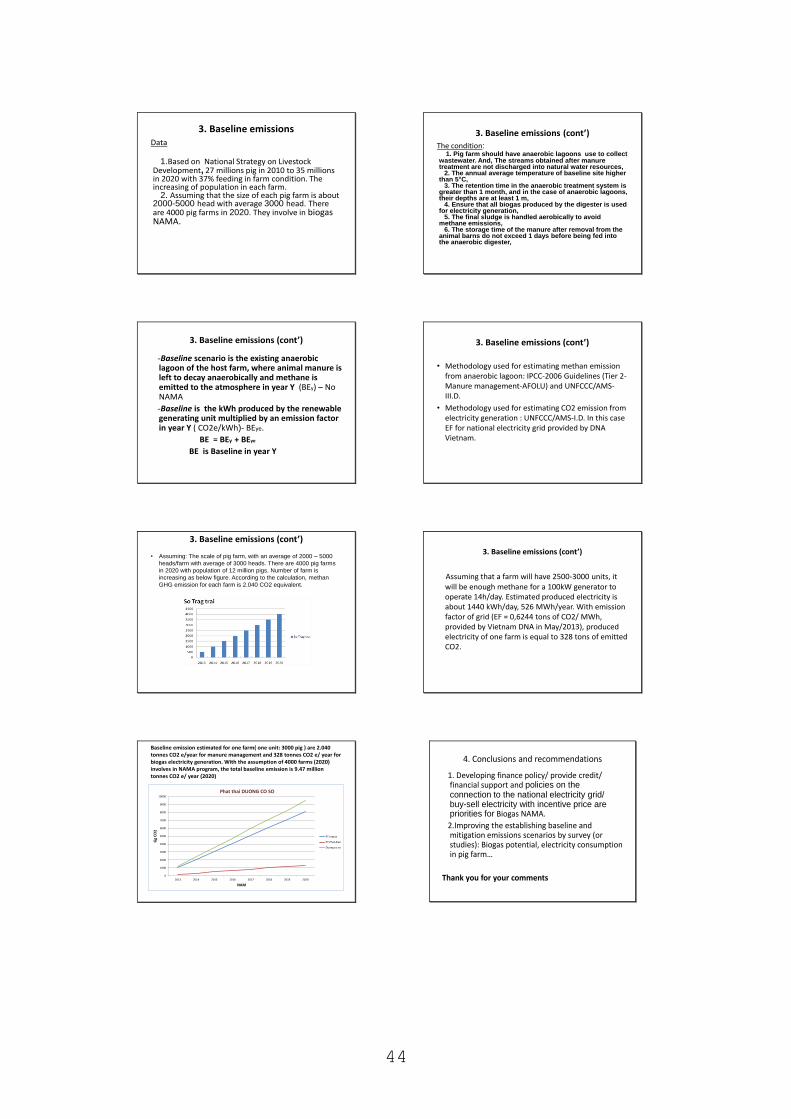
44
3. Baseline emissionsData
1.Based on National Strategy on Livestock Development, 27 millions pig in 2010 to 35 millions in 2020 with 37% feeding in farm condition. The increasing of population in each farm.
2. Assuming that the size of each pig farm is about 2000-5000 head with average 3000 head. There are 4000 pig farms in 2020. They involve in biogas NAMA.
3. Baseline emissions (cont’)
The condition:1. Pig farm should have anaerobic lagoons use to collect
wastewater. And, The streams obtained after manure treatment are not discharged into natural water resources,
2. The annual average temperature of baseline site higher than 5 C,
3. The retention time in the anaerobic treatment system is greater than 1 month, and in the case of anaerobic lagoons, their depths are at least 1 m,
4. Ensure that all biogas produced by the digester is used for electricity generation,
5. The final sludge is handled aerobically to avoid methane emissions,
6. The storage time of the manure after removal from the animal barns do not exceed 1 days before being fed into the anaerobic digester,
3. Baseline emissions (cont’)
-Baseline scenario is the existing anaerobic lagoon of the host farm, where animal manure is left to decay anaerobically and methane is emitted to the atmosphere in year Y (BEy) – No NAMA
-Baseline is the kWh produced by the renewable generating unit multiplied by an emission factor in year Y ( CO2e/kWh)- BEye.
BE = BEy + BEye
BE is Baseline in year Y
3. Baseline emissions (cont’)
• Methodology used for estimating methan emission from anaerobic lagoon: IPCC-2006 Guidelines (Tier 2-Manure management-AFOLU) and UNFCCC/AMS-III.D.
• Methodology used for estimating CO2 emission from electricity generation : UNFCCC/AMS-I.D. In this case EF for national electricity grid provided by DNA Vietnam.
3. Baseline emissions (cont’)
• Assuming: The scale of pig farm, with an average of 2000 – 5000
heads/farm with average of 3000 heads. There are 4000 pig farms
in 2020 with population of 12 million pigs. Number of farm is
increasing as below figure. According to the calculation, methan
GHG emission for each farm is 2.040 CO2 equivalent.
3. Baseline emissions (cont’)
Assuming that a farm will have 2500-3000 units, it will be enough methane for a 100kW generator to operate 14h/day. Estimated produced electricity is about 1440 kWh/day, 526 MWh/year. With emission factor of grid (EF = 0,6244 tons of CO2/ MWh, provided by Vietnam DNA in May/2013), produced electricity of one farm is equal to 328 tons of emitted CO2.
Baseline emission estimated for one farm( one unit: 3000 pig ) are 2.040 tonnes CO2 e/year for manure management and 328 tonnes CO2 e/ year for biogas electricity generation. With the assumption of 4000 farms (2020) involves in NAMA program, the total baseline emission is 9.47 million tonnes CO2 e/ year (2020)
0
1000
2000
3000
4000
5000
6000
7000
8000
9000
10000
2013 2014 2015 2016 2017 2018 2019 2020
Gg
CO
2
NAM
Phat thai DUONG CO SO
PT metan
PT Phat dien
Duong co so
4. Conclusions and recommendations
1. Developing finance policy/ provide credit/ financial support and policies on the connection to the national electricity grid/ buy-sell electricity with incentive price are priorities for Biogas NAMA.
2.Improving the establishing baseline and mitigation emissions scenarios by survey (or studies): Biogas potential, electricity consumption in pig farm…
Thank you for your comments
45
4.3. Biogas NAMA: Barriers and Measures for effective implementation in Viet Nam
Center for Rural Communities Research & Devvelopment
Center for Climate Change and Sustainable Development
(CCRD & CCSD)
Biogas NAMA
Barriers and Measures
for effective implementation in Vietnam
The Second Capacity Building Workshop on “Low Carbon Development and Nationally Appropriate Mitigation Actions”
16-18 December 2013, Do Son, Hai Phong, Viet Nam
Content
I. Barriers in implementing NAMA in
Vietnam
II. Proposal on measures for achieving
NAMA Objectives
1.1. Barriers on Policies:
There’re no policies on the use biogas to generate electricity including:+ Policies/Mechanisms for connecting electric generated from biogas to the national grid;
+ Policies on purchase-selling of biogas -electricity;
+ Preferential credited policies on producing electric by biogas.
There’s no management mechanism for market & quality of Biogas generator.
I. Barriers for implementing Biogas NAMA
in Vietnam
I. Barriers (cont’)
1.2. Barriers on Finance
Big investment for Biogas-generator technology is
beyond the capacity of pig farm owners.
Financial capacity of the Government in
management of infrastructure investment for
connecting bio-electric to national grid.
1.3. Barriers on technology
Bio-generator technology using biogas is a new one
in Vietnam.
Most of the current bio-generator systems have
low quality or self-produced/ by reusing old
generators.
Need high skills for effective
operation/management of bio-generator systems.
The electricity sources provided by bio-generator
systems are small and scattered.
I. Barriers (cont’)
1.4. Barriers on capacities:
* State management capacity:
No system of the state organization to manage,
implement and Monitor,
No experiences in management & implementation
* Capacity of pig farms:
No capacity in operation/management Bio-electricity
systems from biogas sources.
Limited capital investment.
I. Barriers (cont’)
1.5 Barriers on awareness:
Most of pig farm owners/investors/local
authorities do not have enough information and
knowledge on bio-generating using biogas,
GHG emission reduction, NAMAs, …
No good models for demonstration “Seeing is
Believing” to attract pig farm owners/potential
investors.
I. Barriers (cont’)
2.1. Measures on Policies:
Developing policies to encourage using biogas for
generating electricity at pig farms (Supporting the
construction of infrastructure, financial/credit,
Exemption/feed-in tariffs,...)
Developing mechanisms/policies on connecting bio-
electricity to the national grid;
Developing mechanisms/policies on purchase/selling
bio-electricity using biogas as renewable energy.
II. Proposed measures
46
2.2. Financial measures:
Attract/encourage national & international
organizations for providing grants/preferential loans.
Establish a National Investment Fund for attracting
different financial sources for promoting
infrastructure systems on implementation &
management;
To encourage investors from private sector with
incentively relevant policies.
II. Proposed measures (cont’)
2.3. Technology measures:
Carry out researches/assessment the current
technologies and markets of bio- generators using
biogas to recommend appropriate technology(s) for
Vietnam,
Establish a standard system for quality control (QC)
of bio-generators using biogas in Vietnam,
Encourage and support research agencies/ scientists,
investors ... in producing overall bio-generating
systems using biogas, to assure quality of bio-
generators in Vietnam.
II. Proposed measures(cont’)
2.4. Measures on increasing Capacity &
awareness:
Institutional arrangement for management and
implementation at levels.
Promoting propaganda and awareness raising on
(NAMA, RE, GHG..) for relevant stakeholders
(Govt agencies, farm owners, private sector,
NGOs, communities...);
Building capacity on operation/management of
bio-generator systems using biogas for pig farms;
Establish models for demonstration and
replication.
II. Proposed measures(cont’)
Thank You
For your attention !
4.3. NAMA for promoting use of Biogas
NAMA for promoting use of Biogas
By Dr. Sudhir Sharma, Senior Advisor, Climate Change
Second Capacity Building Workshop on LCD and NAMAs
Do Son, Hai Phong, Vietnam, 16 – 18 December 2013
Basic questions
• The starting point for NAMA is that present environmental regulation requires establishment of anaerobic treatment facility resulting in development of methane emissions. This raises following questions– Does the existing system of open pond disposal on land
meet the environmental regulation for disposal of waste in the water bodies?
– what is the environmental regulation requirement for BOD and COD for disposal of waste in water bodies?
– Does the anaerobic treatment based system result in waste treatment that meets the regulatory requirement for BOD and COD.
Scope of NAMA
• NAMA would cover only large farms to address the issue of use of biogas– because the small household farms already use the
biogas generated for self consumption (heat and cooking?)
– government strategy to use biogas energy as electricity generation resource, which is possible only on big size farms
• But how can the outcomes of the NAMA implementation achieve the larger goal of biogas generation and use in all animal waste based systems of all scales.
Scope of NAMA
• To generate electricity from the biogas for supply to grid
• Is not possible to look at other options– electricity generation for creating mini-grids where
grid coverage has not reached– use of biogas as heating and cooking energy source– bottling of biogas– model where private person buys biogas from farm
and produces electricity.
• Are there any technical or other challenges in using these options?
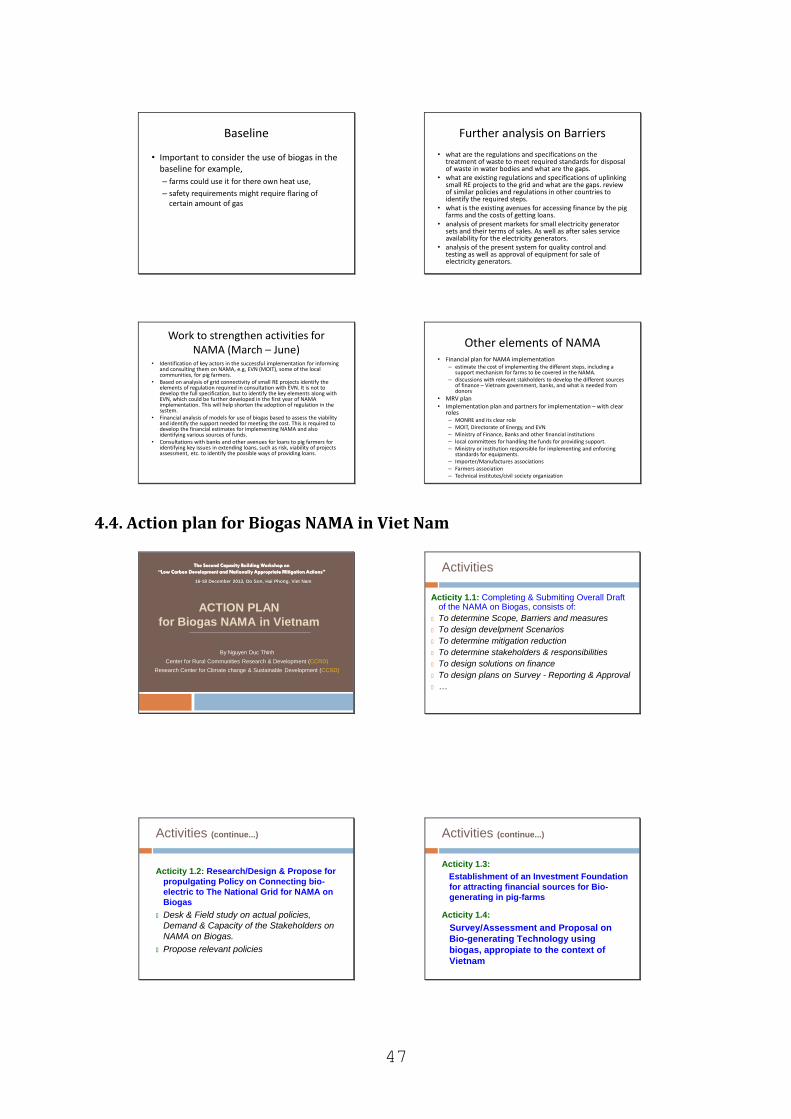
47
Baseline
• Important to consider the use of biogas in the baseline for example,
– farms could use it for there own heat use,
– safety requirements might require flaring of certain amount of gas
Further analysis on Barriers
• what are the regulations and specifications on the treatment of waste to meet required standards for disposal of waste in water bodies and what are the gaps.
• what are existing regulations and specifications of uplinkingsmall RE projects to the grid and what are the gaps. review of similar policies and regulations in other countries to identify the required steps.
• what is the existing avenues for accessing finance by the pig farms and the costs of getting loans.
• analysis of present markets for small electricity generator sets and their terms of sales. As well as after sales service availability for the electricity generators.
• analysis of the present system for quality control and testing as well as approval of equipment for sale of electricity generators.
Work to strengthen activities for NAMA (March – June)
• Identification of key actors in the successful implementation for informing and consulting them on NAMA, e.g, EVN (MOIT), some of the local communities, for pig farmers.
• Based on analysis of grid connectivity of small RE projects identify the elements of regulation required in consultation with EVN. It is not to develop the full specification, but to identify the key elements along with EVN, which could be further developed in the first year of NAMA implementation. This will help shorten the adoption of regulation in the system.
• Financial analysis of models for use of biogas based to assess the viability and identify the support needed for meeting the cost. This is required to develop the financial estimates for implementing NAMA and also identifying various sources of funds.
• Consultations with banks and other avenues for loans to pig farmers for identifying key issues in extending loans, such as risk, viability of projects assessment, etc. to identify the possible ways of providing loans.
Other elements of NAMA• Financial plan for NAMA implementation
– estimate the cost of implementing the different steps, including a support mechanism for farms to be covered in the NAMA.
– discussions with relevant stakholders to develop the different sources of finance – Vietnam government, banks, and what is needed from donors
• MRV plan• Implementation plan and partners for implementation – with clear
roles– MONRE and its clear role– MOIT, Directorate of Energy, and EVN– Ministry of Finance, Banks and other financial institutions– local committees for handling the funds for providing support.– Ministry or institution responsible for implementing and enforcing
standards for equipments.– Importer/Manufactures associations– Farmers association– Technical institutes/civil society organization
4.4. Action plan for Biogas NAMA in Viet Nam
ACTION PLAN
for Biogas NAMA in Vietnam
By Nguyen Duc Thinh
Center for Rural Communities Research & Development (CCRD)
Research Center for Climate change & Sustainable Development (CCSD)
The Second Capacity Building Workshop on
“Low Carbon Development and Nationally Appropriate Mitigation Actions”
16-18 December 2013, Do Son, Hai Phong, Viet Nam
Activities
Acticity 1.1: Completing & Submiting Overall Draft of the NAMA on Biogas, consists of:
To determine Scope, Barriers and measures
To design develpment Scenarios
To determine mitigation reduction
To determine stakeholders & responsibilities
To design solutions on finance
To design plans on Survey - Reporting & Approval
…
Acticity 1.2: Research/Design & Propose for
propulgating Policy on Connecting bio-
electric to The National Grid for NAMA on
Biogas
Desk & Field study on actual policies,
Demand & Capacity of the Stakeholders on
NAMA on Biogas.
Propose relevant policies
Activities (continue...)
Acticity 1.3:
Establishment of an Investment Foundation
for attracting financial sources for Bio-
generating in pig-farms
Acticity 1.4:
Survey/Assessment and Proposal on
Bio-generating Technology using
biogas, appropiate to the context of
Vietnam
Activities (continue...)
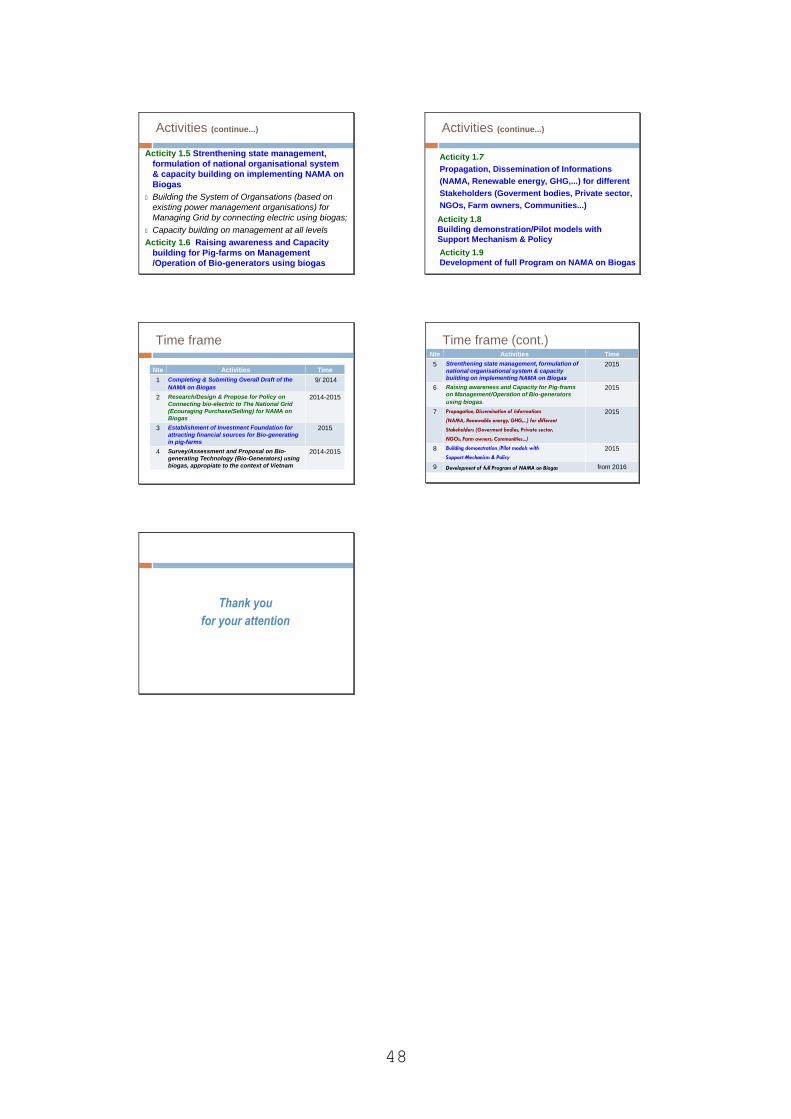
48
Acticity 1.5 Strenthening state management,
formulation of national organisational system
& capacity building on implementing NAMA on
Biogas
Building the System of Organsations (based on
existing power management organisations) for
Managing Grid by connecting electric using biogas;
Capacity building on management at all levels
Acticity 1.6 Raising awareness and Capacity
building for Pig-farms on Management
/Operation of Bio-generators using biogas
Activities (continue...)
Activities (continue...)
Acticity 1.7
Propagation, Dissemination of Informations
(NAMA, Renewable energy, GHG,...) for different
Stakeholders (Goverment bodies, Private sector,
NGOs, Farm owners, Communities...)
Acticity 1.8
Building demonstration/Pilot models with
Support Mechanism & Policy
Acticity 1.9
Development of full Program on NAMA on Biogas
Time frame
Nte Activities Time
1 Completing & Submiting Overall Draft of the
NAMA on Biogas
9/ 2014
2 Research/Design & Propose for Policy on
Connecting bio-electric to The National Grid
(Ecouraging Purchase/Selling) for NAMA on
Biogas
2014-2015
3 Establishment of Investment Foundation for
attracting financial sources for Bio-generating
in pig-farms
2015
4 Survey/Assessment and Proposal on Bio-
generating Technology (Bio-Generators) using
biogas, appropiate to the context of Vietnam
2014-2015
Time frame (cont.)Nte Activities Time
5 Strenthening state management, formulation of
national organisational system & capacity
building on implementing NAMA on Biogas
2015
6 Raising awareness and Capacity for Pig-frams
on Management/Operation of Bio-generators
using biogas.
2015
7 Propagation, Dissemination of Informations
(NAMA, Renewable energy, GHG,...) for different
Stakeholders (Goverment bodies, Private sector,
NGOs, Farm owners, Communities...)
2015
8 Building demonstration /Pilot models with
Support Mechanism & Policy
2015
9 Development of full Program of NAMA on Biogas from 2016
Thank you
for your attention
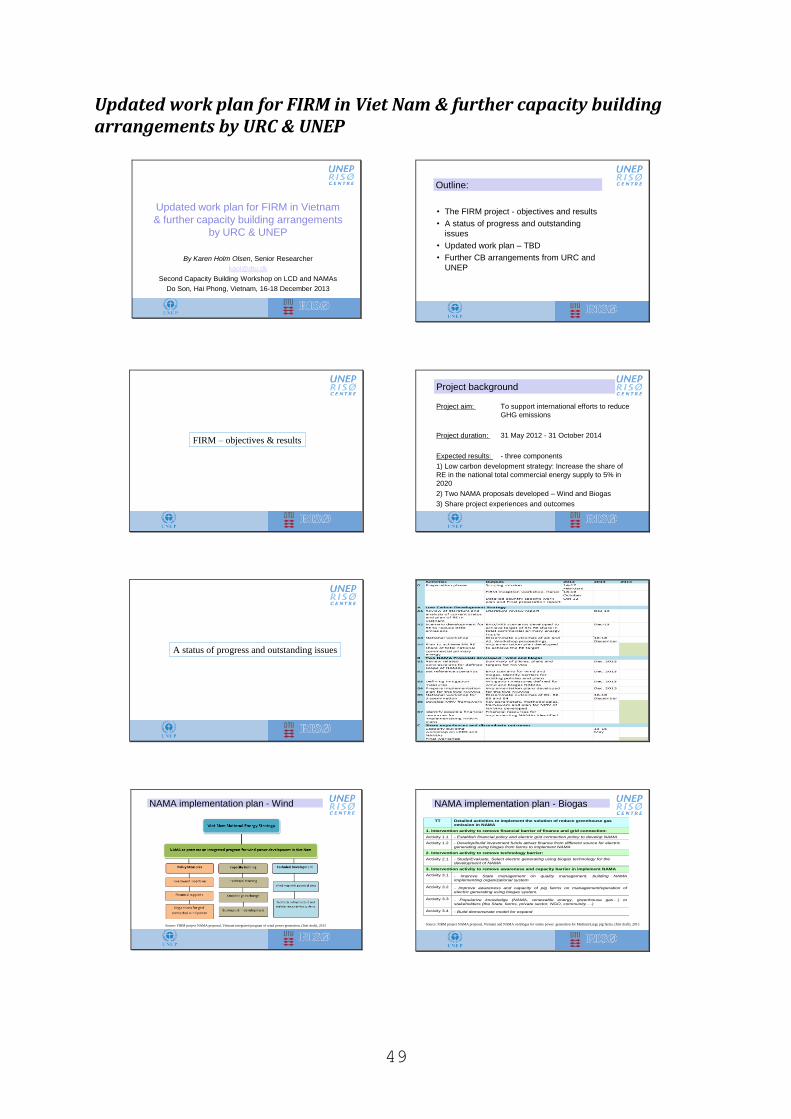
49
Updated work plan for FIRM in Viet Nam & further capacity building arrangements by URC & UNEP
Updated work plan for FIRM in Vietnam
& further capacity building arrangements
by URC & UNEP
By Karen Holm Olsen, Senior Researcher
Second Capacity Building Workshop on LCD and NAMAs
Do Son, Hai Phong, Vietnam, 16-18 December 2013
Outline:
• The FIRM project - objectives and results
• A status of progress and outstanding
issues
• Updated work plan – TBD
• Further CB arrangements from URC and
UNEP
FIRM – objectives & results
Project background
Project aim: To support international efforts to reduce
GHG emissions
Project duration: 31 May 2012 - 31 October 2014
Expected results: - three components
1) Low carbon development strategy: Increase the share of
RE in the national total commercial energy supply to 5% in
2020
2) Two NAMA proposals developed – Wind and Biogas
3) Share project experiences and outcomes
A status of progress and outstanding issues
NAMA implementation plan - Wind
Source: FIRM project NAMA proposal, Vietnam integrated program of wind power generation, (first draft), 2013
NAMA implementation plan - Biogas
Source: FIRM project NAMA proposal, Vietnam and NAMA on Biogas for onsite power generation for Medium/Large pig farms, (first draft), 2013
TT Detailed activities to implement the solution of reduce greenhouse gas emission in NAMA
1. Intervention activity to remove financial barrier of finance and grid connection:
Activity 1.1 - Establish financial policy and electric grid connection policy to develop NAMA
Activity 1.2 - Develop/build investment funds attract finance from different source for electric generating using biogas from farms to implement NAMA
2. Intervention activity to remove technology barrier:
Activity 2.1 - Study/Evaluate, Select electric generating using biogas technology for the development of NAMA
3. Intervention activity to remove awareness and capacity barrier in implement NAMA
Activity 3.1 - Improve State management on quality management, building NAMA implementing organizational system
Activity 3.2 - Improve awareness and capacity of pig farms on management/operation of electric generating using biogas system.
Activity 3.3 - Popularize knowledge (NAMA, renewable energy, greenhouse gas…) to stakeholders (the State, farms, private sector, NGO, community….)
Activity 3.4 - Build demonstrate model for expand
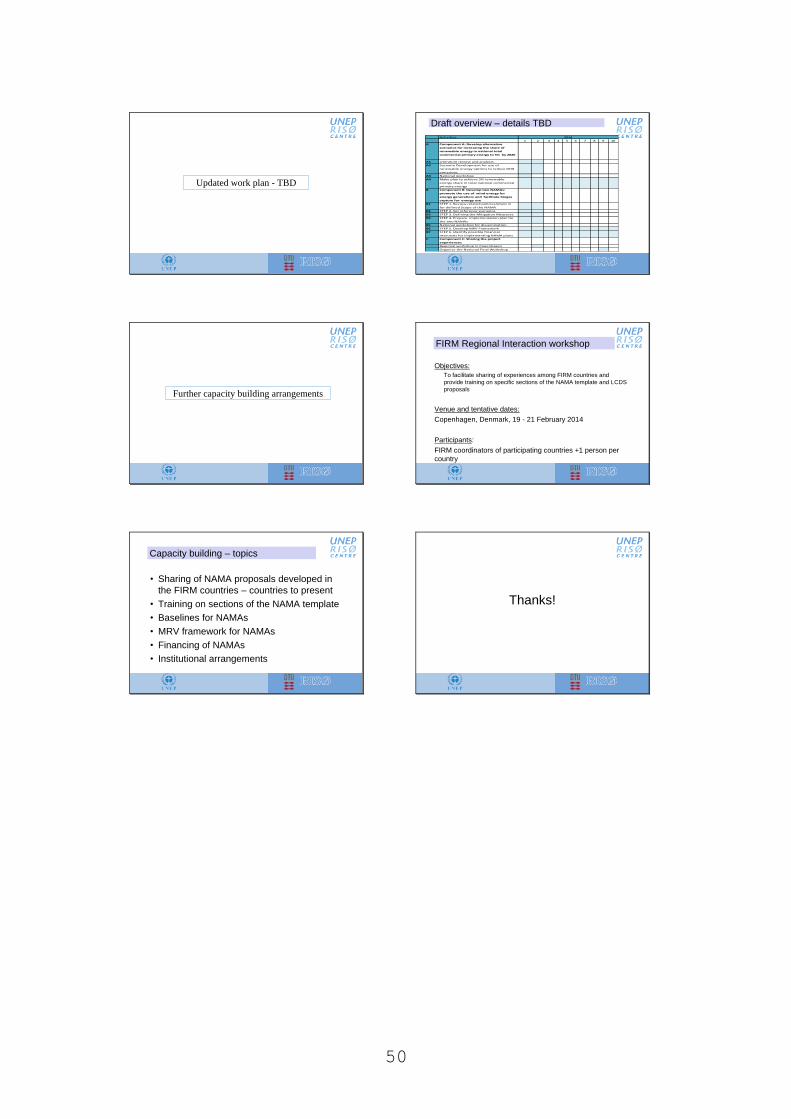
50
Updated work plan - TBD
Draft overview – details TBD
Activities
1 2 3 4 5 6 7 8 9 10
A Component A: Develop alternative
scenarios for increasing the share of
renewable energy in national total
commercial primary energy to 5% by 2020
A1 Literature review and analysis
A2 Scenario Development for use of
renewable energy options to reduce GHG
emissions
A3 National workshop
A4 Make plan to achieve 5% renewable
energy share in total national commercial
primary energy
B Component B: Develop two NAMAs:
promote the use of wind energy for
energy generation; and facilitate biogas
capture for energy use
B1 STEP 1. Review related policies/plans in
for defined Scope of the NAMA
B2 STEP 2. Set reference scenarios
B3 STEP 3. Defining the Mitigation Measures
B4 STEP 4. Prepare implementation plan for
the two NAMAs
B5 National workshop for dissemination
B6 STEP 5. Develop MRV Framework
B7 STEP 6. Identify possible financial
resources for implementing NAMA plans
C Component C: Sharing the project
experiences
Regional workshop in Copenhagen
Organise the National Final Workshop
2014
Further capacity building arrangements
FIRM Regional Interaction workshop
Objectives:
To facilitate sharing of experiences among FIRM countries and
provide training on specific sections of the NAMA template and LCDS
proposals
Venue and tentative dates:
Copenhagen, Denmark, 19 - 21 February 2014
Participants:
FIRM coordinators of participating countries +1 person per
country
Capacity building – topics
• Sharing of NAMA proposals developed in
the FIRM countries – countries to present
• Training on sections of the NAMA template
• Baselines for NAMAs
• MRV framework for NAMAs
• Financing of NAMAs
• Institutional arrangements
Thanks!

ANNEXES
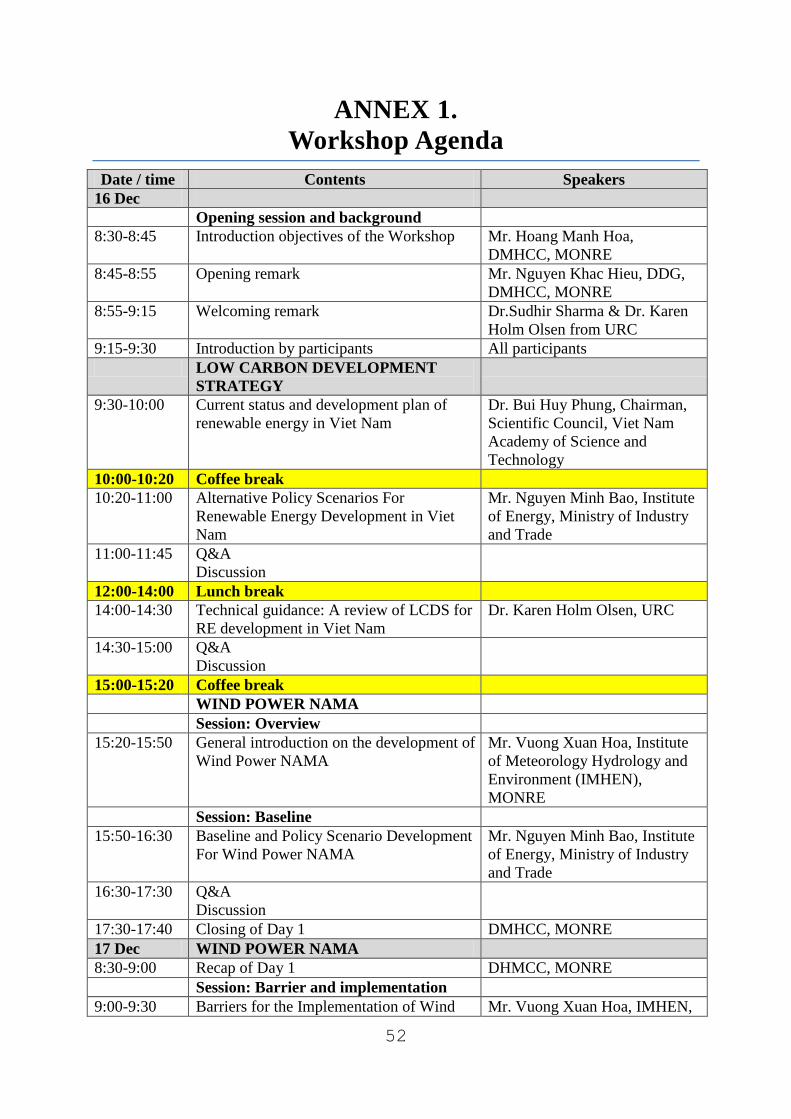
52
ANNEX 1.
Workshop Agenda
Date / time Contents Speakers
16 Dec
Opening session and background
8:30-8:45 Introduction objectives of the Workshop Mr. Hoang Manh Hoa,
DMHCC, MONRE
8:45-8:55 Opening remark Mr. Nguyen Khac Hieu, DDG,
DMHCC, MONRE
8:55-9:15 Welcoming remark Dr.Sudhir Sharma & Dr. Karen
Holm Olsen from URC
9:15-9:30 Introduction by participants All participants
LOW CARBON DEVELOPMENT
STRATEGY
9:30-10:00 Current status and development plan of
renewable energy in Viet Nam
Dr. Bui Huy Phung, Chairman,
Scientific Council, Viet Nam
Academy of Science and
Technology
10:00-10:20 Coffee break
10:20-11:00 Alternative Policy Scenarios For
Renewable Energy Development in Viet
Nam
Mr. Nguyen Minh Bao, Institute
of Energy, Ministry of Industry
and Trade
11:00-11:45 Q&A
Discussion
12:00-14:00 Lunch break
14:00-14:30 Technical guidance: A review of LCDS for
RE development in Viet Nam
Dr. Karen Holm Olsen, URC
14:30-15:00 Q&A
Discussion
15:00-15:20 Coffee break
WIND POWER NAMA
Session: Overview
15:20-15:50 General introduction on the development of
Wind Power NAMA
Mr. Vuong Xuan Hoa, Institute
of Meteorology Hydrology and
Environment (IMHEN),
MONRE
Session: Baseline
15:50-16:30 Baseline and Policy Scenario Development
For Wind Power NAMA
Mr. Nguyen Minh Bao, Institute
of Energy, Ministry of Industry
and Trade
16:30-17:30 Q&A
Discussion
17:30-17:40 Closing of Day 1 DMHCC, MONRE
17 Dec WIND POWER NAMA
8:30-9:00 Recap of Day 1 DHMCC, MONRE
Session: Barrier and implementation
9:00-9:30 Barriers for the Implementation of Wind Mr. Vuong Xuan Hoa, IMHEN,
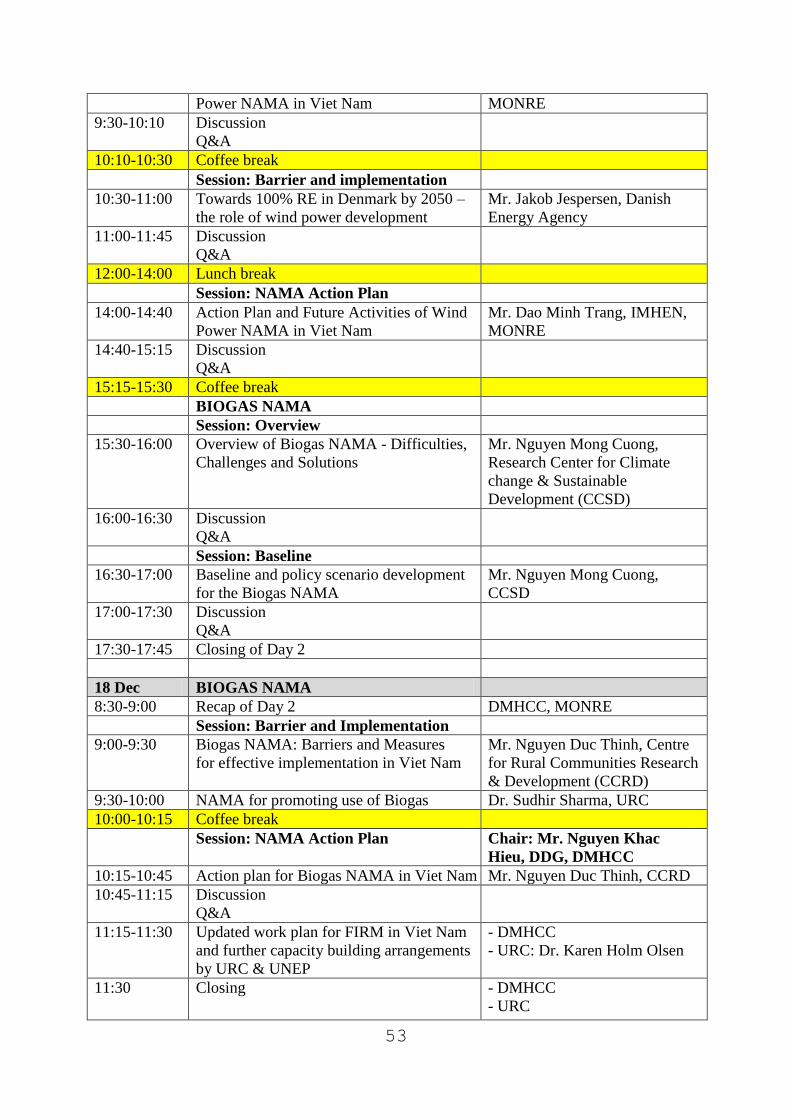
53
Power NAMA in Viet Nam MONRE
9:30-10:10 Discussion
Q&A
10:10-10:30 Coffee break
Session: Barrier and implementation
10:30-11:00 Towards 100% RE in Denmark by 2050 –
the role of wind power development
Mr. Jakob Jespersen, Danish
Energy Agency
11:00-11:45 Discussion
Q&A
12:00-14:00 Lunch break
Session: NAMA Action Plan
14:00-14:40 Action Plan and Future Activities of Wind
Power NAMA in Viet Nam
Mr. Dao Minh Trang, IMHEN,
MONRE
14:40-15:15 Discussion
Q&A
15:15-15:30 Coffee break
BIOGAS NAMA
Session: Overview
15:30-16:00 Overview of Biogas NAMA - Difficulties,
Challenges and Solutions
Mr. Nguyen Mong Cuong,
Research Center for Climate
change & Sustainable
Development (CCSD)
16:00-16:30 Discussion
Q&A
Session: Baseline
16:30-17:00 Baseline and policy scenario development
for the Biogas NAMA
Mr. Nguyen Mong Cuong,
CCSD
17:00-17:30 Discussion
Q&A
17:30-17:45 Closing of Day 2
18 Dec BIOGAS NAMA
8:30-9:00 Recap of Day 2 DMHCC, MONRE
Session: Barrier and Implementation
9:00-9:30 Biogas NAMA: Barriers and Measures
for effective implementation in Viet Nam
Mr. Nguyen Duc Thinh, Centre
for Rural Communities Research
& Development (CCRD)
9:30-10:00 NAMA for promoting use of Biogas Dr. Sudhir Sharma, URC
10:00-10:15 Coffee break
Session: NAMA Action Plan Chair: Mr. Nguyen Khac
Hieu, DDG, DMHCC
10:15-10:45 Action plan for Biogas NAMA in Viet Nam Mr. Nguyen Duc Thinh, CCRD
10:45-11:15 Discussion
Q&A
11:15-11:30 Updated work plan for FIRM in Viet Nam
and further capacity building arrangements
by URC & UNEP
- DMHCC
- URC: Dr. Karen Holm Olsen
11:30 Closing - DMHCC
- URC
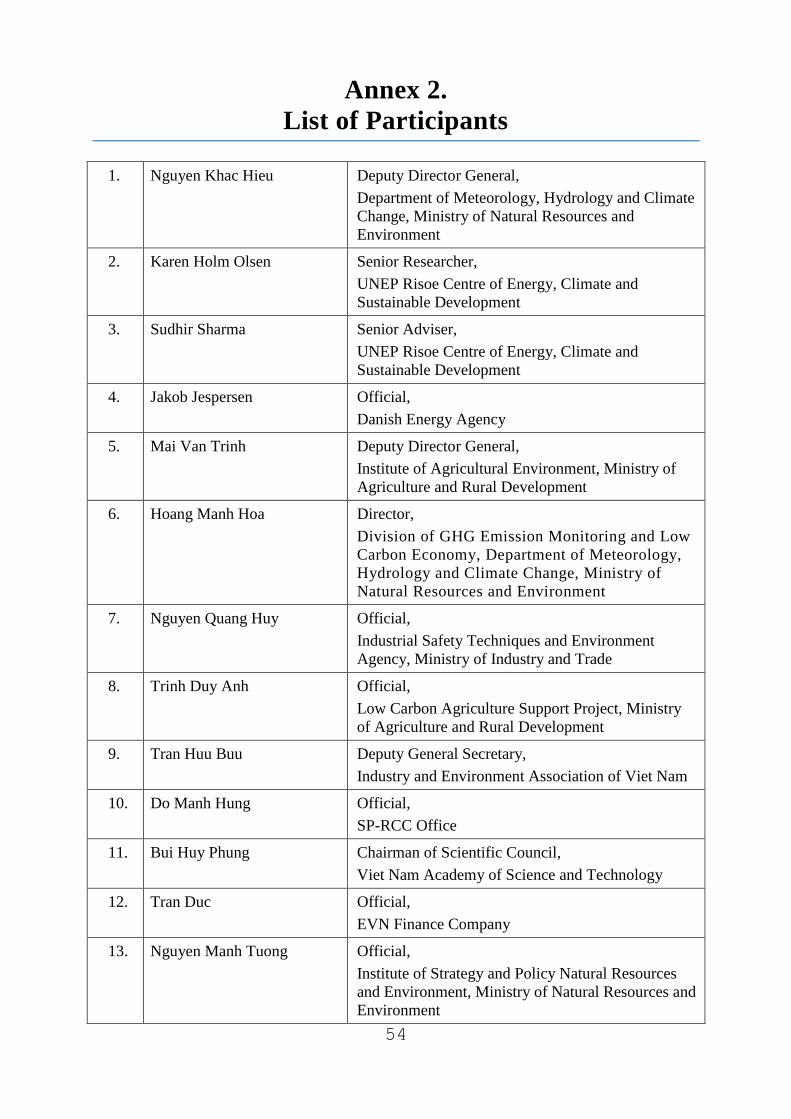
54
Annex 2.
List of Participants
1. Nguyen Khac Hieu Deputy Director General,
Department of Meteorology, Hydrology and Climate
Change, Ministry of Natural Resources and
Environment
2. Karen Holm Olsen Senior Researcher,
UNEP Risoe Centre of Energy, Climate and
Sustainable Development
3. Sudhir Sharma Senior Adviser,
UNEP Risoe Centre of Energy, Climate and
Sustainable Development
4. Jakob Jespersen Official,
Danish Energy Agency
5. Mai Van Trinh Deputy Director General,
Institute of Agricultural Environment, Ministry of
Agriculture and Rural Development
6. Hoang Manh Hoa Director,
Division of GHG Emission Monitoring and Low
Carbon Economy, Department of Meteorology,
Hydrology and Climate Change, Ministry of
Natural Resources and Environment
7. Nguyen Quang Huy Official,
Industrial Safety Techniques and Environment
Agency, Ministry of Industry and Trade
8. Trinh Duy Anh Official,
Low Carbon Agriculture Support Project, Ministry
of Agriculture and Rural Development
9. Tran Huu Buu Deputy General Secretary,
Industry and Environment Association of Viet Nam
10. Do Manh Hung Official,
SP-RCC Office
11. Bui Huy Phung Chairman of Scientific Council,
Viet Nam Academy of Science and Technology
12. Tran Duc Official,
EVN Finance Company
13. Nguyen Manh Tuong Official,
Institute of Strategy and Policy Natural Resources
and Environment, Ministry of Natural Resources and
Environment
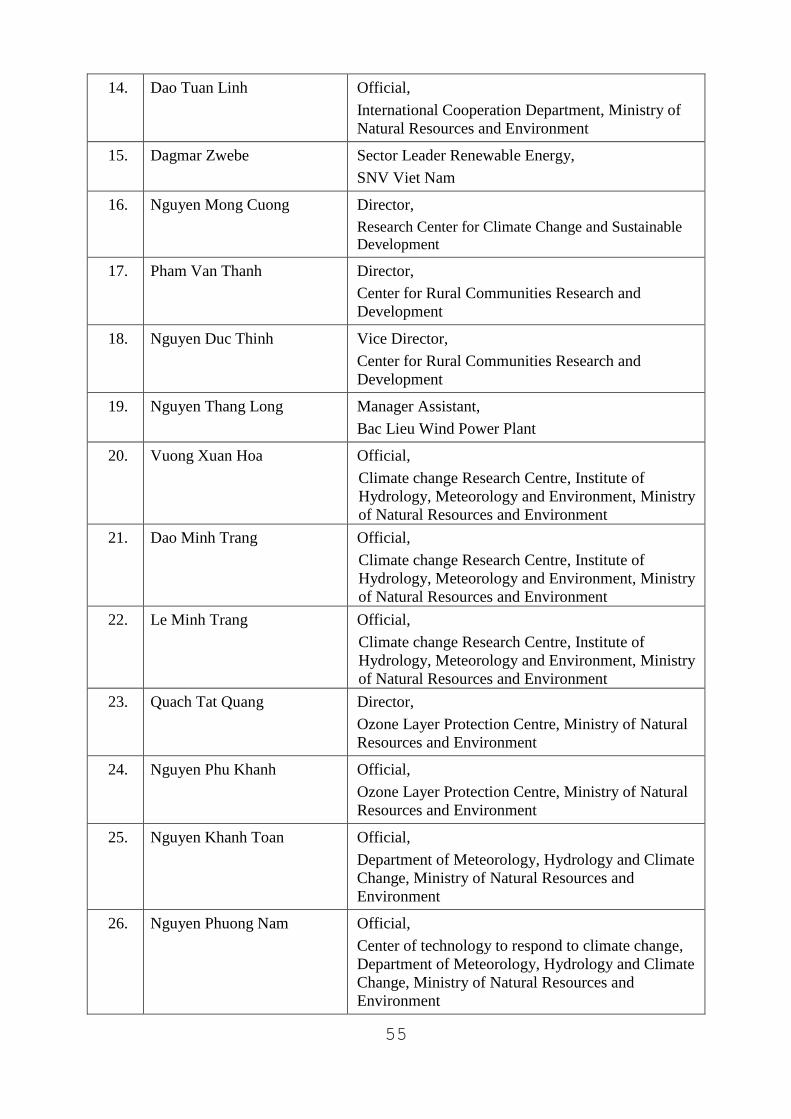
55
14. Dao Tuan Linh Official,
International Cooperation Department, Ministry of
Natural Resources and Environment
15. Dagmar Zwebe Sector Leader Renewable Energy,
SNV Viet Nam
16. Nguyen Mong Cuong Director,
Research Center for Climate Change and Sustainable
Development
17. Pham Van Thanh Director,
Center for Rural Communities Research and
Development
18. Nguyen Duc Thinh Vice Director,
Center for Rural Communities Research and
Development
19. Nguyen Thang Long Manager Assistant,
Bac Lieu Wind Power Plant
20. Vuong Xuan Hoa Official,
Climate change Research Centre, Institute of
Hydrology, Meteorology and Environment, Ministry
of Natural Resources and Environment
21. Dao Minh Trang Official,
Climate change Research Centre, Institute of
Hydrology, Meteorology and Environment, Ministry
of Natural Resources and Environment
22. Le Minh Trang Official,
Climate change Research Centre, Institute of
Hydrology, Meteorology and Environment, Ministry
of Natural Resources and Environment
23. Quach Tat Quang Director,
Ozone Layer Protection Centre, Ministry of Natural
Resources and Environment
24. Nguyen Phu Khanh Official,
Ozone Layer Protection Centre, Ministry of Natural
Resources and Environment
25. Nguyen Khanh Toan Official,
Department of Meteorology, Hydrology and Climate
Change, Ministry of Natural Resources and
Environment
26. Nguyen Phuong Nam Official,
Center of technology to respond to climate change,
Department of Meteorology, Hydrology and Climate
Change, Ministry of Natural Resources and
Environment
56
27. Le Thu Trang Official,
Center of technology to respond to climate change,
Department of Meteorology, Hydrology and Climate
Change, Ministry of Natural Resources and
Environment
28. Dao Thi Hien Official,
Viet Nam Energy and Environment Consultancy
Joint-Stock Company
29. Nguyen Quang Anh Official,
Department of Meteorology, Hydrology and Climate
Change, Ministry of Natural Resources and
Environment
30. Nguyen Van Anh Official,
Department of Meteorology, Hydrology and Climate
Change, Ministry of Natural Resources and
Environment
31. Nguyen Trong Hung Official,
Department of Meteorology, Hydrology and Climate
Change, Ministry of Natural Resources and
Environment
32. Pham Minh Khoa Official,
Department of Meteorology, Hydrology and Climate
Change, Ministry of Natural Resources and
Environment
33. Tran Ha Ninh Official,
Department of Meteorology, Hydrology and Climate
Change, Ministry of Natural Resources and
Environment
34. Tran Thi Bich Ngoc Official,
Department of Meteorology, Hydrology and Climate
Change, Ministry of Natural Resources and
Environment
The Facilitating Implementation and Readiness for Mitigation (FIRM) Project
THE SECOND CAPACITY BUILDING WORKSHOP
ON LOW CARBON DEVELOPMENT AND NATIONALLY APPROPRIATE MITIGATION ACTIONS
For more information please contact: Department of Meteorology, Hydrology and Climate Change Ministry of Natural Resources and Environment of Viet Nam
No. 10 Ton That Thuyet Str, Cau Giay District, Ha Noi, Viet Nam
Tel: 84-4-37759384 - Fax: 84-4-37759382 Email: [email protected]; [email protected]


