On Flowfield Periodicity in the NASA Transonic Flutter ... · PDF fileOn Flowfield Periodicity...
18
J. Lepicovsky Dynacs Engineering Company, Inc., Brook Park, Ohio E.R. McFarland, R.V. Chima, and J.R. Wood Glenn Research Center, Cleveland, Ohio On Flowfield Periodicity in the NASA Transonic Flutter Cascade, Part I—Experimental Study NASA/TM—2000-209934 March 2000 ASME 2000–GT–0572 https://ntrs.nasa.gov/search.jsp?R=20000052483 2018-05-09T04:31:09+00:00Z
-
Upload
truongminh -
Category
Documents
-
view
218 -
download
1
Transcript of On Flowfield Periodicity in the NASA Transonic Flutter ... · PDF fileOn Flowfield Periodicity...

J. LepicovskyDynacs Engineering Company, Inc., Brook Park, Ohio
E.R. McFarland, R.V. Chima, and J.R. WoodGlenn Research Center, Cleveland, Ohio
On Flowfield Periodicity in theNASA Transonic Flutter Cascade,Part I—Experimental Study
NASA/TM—2000-209934
March 2000
ASME 2000–GT–0572
https://ntrs.nasa.gov/search.jsp?R=20000052483 2018-05-09T04:31:09+00:00Z

The NASA STI Program Office . . . in Profile
Since its founding, NASA has been dedicated tothe advancement of aeronautics and spacescience. The NASA Scientific and TechnicalInformation (STI) Program Office plays a key partin helping NASA maintain this important role.
The NASA STI Program Office is operated byLangley Research Center, the Lead Center forNASA’s scientific and technical information. TheNASA STI Program Office provides access to theNASA STI Database, the largest collection ofaeronautical and space science STI in the world.The Program Office is also NASA’s institutionalmechanism for disseminating the results of itsresearch and development activities. These resultsare published by NASA in the NASA STI ReportSeries, which includes the following report types:
• TECHNICAL PUBLICATION. Reports ofcompleted research or a major significantphase of research that present the results ofNASA programs and include extensive dataor theoretical analysis. Includes compilationsof significant scientific and technical data andinformation deemed to be of continuingreference value. NASA’s counterpart of peer-reviewed formal professional papers buthas less stringent limitations on manuscriptlength and extent of graphic presentations.
• TECHNICAL MEMORANDUM. Scientificand technical findings that are preliminary orof specialized interest, e.g., quick releasereports, working papers, and bibliographiesthat contain minimal annotation. Does notcontain extensive analysis.
• CONTRACTOR REPORT. Scientific andtechnical findings by NASA-sponsoredcontractors and grantees.
• CONFERENCE PUBLICATION. Collectedpapers from scientific and technicalconferences, symposia, seminars, or othermeetings sponsored or cosponsored byNASA.
• SPECIAL PUBLICATION. Scientific,technical, or historical information fromNASA programs, projects, and missions,often concerned with subjects havingsubstantial public interest.
• TECHNICAL TRANSLATION. English-language translations of foreign scientificand technical material pertinent to NASA’smission.
Specialized services that complement the STIProgram Office’s diverse offerings includecreating custom thesauri, building customizeddata bases, organizing and publishing researchresults . . . even providing videos.
For more information about the NASA STIProgram Office, see the following:
• Access the NASA STI Program Home Pageat http://www.sti.nasa.gov
• E-mail your question via the Internet [email protected]
• Fax your question to the NASA AccessHelp Desk at (301) 621-0134
• Telephone the NASA Access Help Desk at(301) 621-0390
• Write to: NASA Access Help Desk NASA Center for AeroSpace Information 7121 Standard Drive Hanover, MD 21076

March 2000
National Aeronautics andSpace Administration
Glenn Research Center
Prepared for the45th International Gas Turbine and Aeroengine Technical Congresssponsored by the American Society of Mechanical EngineersMunich, Germany, May 8–11, 2000
J. LepicovskyDynacs Engineering Company, Inc., Brook Park, Ohio
E.R. McFarland, R.V. Chima, and J.R. WoodGlenn Research Center, Cleveland, Ohio
On Flowfield Periodicity in theNASA Transonic Flutter Cascade,Part I—Experimental Study
NASA/TM—2000-209934 ASME 2000–GT–0572

Acknowledgments
The authors would like to acknowledge the invaluable engineering and technical support provided by Mr. T.A. Jettand Mr. R. Torres of NASA Glenn Research Center. The help of Mr. K.E. Weiland with flow visualization and
Mr. T.J. Bencic with PSP data acquisition is also particularly appreciated. This program was supported byNASA Glenn Research Center under the Smart Green Engine program managed by Mr. K.C. Civinskas.
Available from
NASA Center for Aerospace Information7121 Standard DriveHanover, MD 21076Price Code: A03
National Technical Information Service5285 Port Royal RoadSpringfield, VA 22100
Price Code: A03

NASA/TM—2000-209934
ABSTRACT
An extensive study to improve flow uniformity andperiodicity in the NASA Transonic Flutter Cascade is presentedhere. The results are reported in two independent parts dealingwith the experimental approach and the analytical approach.The first part, the Experimental Study, focuses first on the datasets acquired in this facility in the past and explains severaldiscrepancies, particularly the questions of actual flow incidenceand cascade backpressure levels. Next, available means forcontrol and modifications of the cascade flowfield, boundarylayer bleed and tailboard settings are presented in detail. This isfollowed by experimental data sets acquired in modified testfacility configurations that were based on analytical predictionsof the cascade flowfield. Finally, several important conclusionsabout improving the cascade flowfield uniformity and bladeload periodicity are summarized. The important conclusionsare: (1) boundary layer bleed does not improve the cascadeflow periodicity; (2) tunnel wall contours must be carefullymatched to the expected shape of cascade streamlines; (3)actual flow incidence for each cascade configuration rather mustbe measured instead of relying on the tunnel geometry; and (4)the current cascade configuration exhibits a very high blade loaduniformity over six blades from blade #2 to blade #7, and thefacility is now ready for unsteady pressure data acquisition.
INTRODUCTION
Modern turbofan engines employ a highly-loaded, low-aspectratio fan stage with transonic or low-supersonic velocities in theblade-tip region. The tip-section airfoils of these fan blades arenoticeably different from the airfoils on the rest of the blade.
The tip-section airfoils are designed for precompression, with aconcave suction surface just downstream of the leading edge,and with very low overall camber. The airfoils have a sharpleading edge and are prone to flow separation at off-designconditions. Due to extreme flight envelope requirements, theengines are often operated near the stall flutter boundary of thefan, which occurs at high incidence angles and high subsonic ortransonic relative Mach numbers. Blade flutter and associatedhigh cycle fatigue problems are very detrimental to the enginehealth and must be avoided. Stall flutter and particularly bladelife prediction codes are not yet fully reliable; their verificationis hampered by a lack of reliable unsteady loading data,particularly for the airfoils in question. Therefore there has beengreat interest in fan blade stall flutter research in recent years.
Work at the NASA Glenn Research Center (GRC) on fanblade stall flutter has focused on improving the quality ofexperimental data acquired in the NASA Transonic FlutterCascade Facility. The work was thematically organized intothree groups. First, old data on symmetrical circular arc airfoilsand initial data on transonic fan blade airfoils were carefullyreviewed and analyzed with respect to the test facilityperformance. Then, the test facility configuration and itsmodifications were modeled computationally and thecomputational results analyzed. Finally, the test facility wasmodified accordingly and the experimental results werecompared with the predictions. The results were analyzed forflow periodicity and flow uniformity. Computational andexperimental work were sometimes run concurrently. Theresults achieved are described in two parts. The first paper,Experimental Study, presents the experimental effort.Computational work is presented in the second paper,Numerical Study, by Chima et al. (2000).
ON FLOWFIELD PERIODICITY IN THE NASA TRANSONIC FLUTTER CASCADE,PART I EXPERIMENTAL STUDY
E.R. McFarland, R.V. Chima, and J.R. WoodNational Aeronautics and Space Administration
Glenn Research CenterCleveland, Ohio 44135
J. LepicovskyDynacs Engineering Company, Inc.
Brook Park, Ohio 44142
1

NASA/TM—2000-209934
photograph of the cascade test section is in Fig. 2. As seen inFig. 1, the facility was provided with a complex bleed systemthat was intended to remove the boundary layer of the incomingflow and thus improve its uniformity. Fourteen independentvalves were available to adjust the bleed -- two for the lowerwall and lower scoop, two for the upper wall and upper scoop,and five valves for compartmentalized bleed manifolds on each(front and back) side wall. In addition, upper and lowertailboards allow angular adjustment for improving flowuniformity. A primary concern in this facility was to ensureuniformity of the flow ahead of the cascade, and periodicity ofthe flow within the cascade. It was hoped that tailboards andbleed control would help to achieve a high passage-to-passageblade load periodicity for steady flow conditions in the cascade.
UPPER WALLAND
UPPER SCOOPBLEED
LOWERWALL BLEED
CASCADEINFLOW
CASCADEOUTFLOW
SIDEWALL BLEEDEXHAUST PIPE
LOWER SCOOPBLEED
Fig. 1 Boundary layer bleed system of theNASA Transonic Flutter Cascade facility
Fig. 2 View of cascade test section
LOWER TAILBOARDLOWERSCOOP
In recent years, the facility has been used to investigatebehavior of a cascade of modern, low-aspect ratio fan bladesoperating near the stall flutter boundary that occurs at highincidence angles and high subsonic and transonic relative Machnumbers. The blades for this experiment were designed andmanufactured by Pratt&Whitney Engine Company. The airfoil
NOMENCLATURE
C [mm] airfoil chordcp [1] pressure coefficientFB [N] resulting force on bladeh [mm] blade heightiFL [dg] flow incidence angleiGM [dg] geometric incidence angleMa [1] Mach numberpw [kPa] wall static pressurep1t [kPa] tunnel inlet total pressureS [mm] blade pitchTB [Nm] resulting torque on blade (to pivot point)v [m.s-1] cascade inlet velocityW [mm] cascade test section width at x/C =Ð 0.355x [mm] axial distance (cascade)y [mm] pitchwise distance (cascade)z [mm] spanwise distance (cascade)∆cp [1] pressure coefficient deviation from blade #5γ [dg] blade stagger angle (from axial direction)λT [dg] lower tailboard angle (from horiz. direction)πET [1] empty tunnel pressure ratioπTB [1] cascade pressure ratioρ [kg.m-3] air densityθ [dg] leading edge camber angle (airfoil)ξ [mm] chordwise distance (airfoil)
Index:0 far upstream1 upstream2 downstream
average value over the range 0.2 < y/W< 0.8
Definitions:Pressure coefficient
Pressure ratio
PREVIOUS WORK ON NASA FLUTTER CASCADE
The NASA GRC Transonic Flutter Cascade is one of a veryfew test facilities dedicated to the unsteady aerodynamics ofoscillating airfoils. The facility is used to provide data formodeling aerodynamics of blade stall flutter. The facilitycombines a linear cascade wind tunnel with a high-speed drivesystem that imparts pitching oscillations to cascade blades. Thecascade consists of nine blades. All the blades or any singleblade can be oscillated at realistic reduced frequencies (Strouhalnumbers). Interblade phase angles can be varied in incrementsof 15 dg. The facility has been described in detail in works ofBoldman and Buggele (1978), Shaw et al. (1986), and Buffumet al. (1996). Only features relevant to the current investigationswill be emphasized here.
A schematic diagram of the original build of the NASATransonic Flutter Cascade facility is given in Fig. 1. A close-up
−
πTB = p2 / p1
vρ0.5
ppc
−=p 2ξ 1
1 1
2
Ð

NASA/TM—2000-209934 3
and cascade parameters are given in Fig. 3 and Tab. 1 (Buffumet al., 1996a). Previous measurements on these blades werereported by Buffum et al. (1996a, 1996b) at Mach numbersbetween 0.5 and 0.8, and chordal, geometric incidence angles,iGM, of 0 and 10 dg. Experimental blade-surface pressuredistributions for steady flow at inlet Mach numbers of up to 0.5were compared with various CFD predictions (Buffum et al.,1996a, 1996b), but good agreement was found only up to 85%of chord and only for the incidence angle of 0 dg. The cascadeflow periodicity was measured only for the three middle bladesand was found sufficient for unsteady surface-pressure data setsacquired at full-chord reduced frequencies of 0.4 and 0.8, andfor an interblade phase angle of 180 dg.
To ease the facility operation, it was decided to adopt amethod of influence coefficients for the future unsteady work inthis cascade. For the unsteady influence coefficient technique,only one blade in the cascade is oscillated at a time and theresulting unsteady pressures are measured on the remaining(nonmoving) blades. The unsteady aerodynamics of anequivalent cascade with all blades oscillating at a specifiedinterblade phase angle are then determined through a vectorsummation of unsteady data from individual blades (Buffumand Fleeter, 1988). It must be stated that the use of theinfluence coefficient technique has only been demonstrated forattached flow. This facility has the unique capability ofdemonstrating this technique for separated flow. This techniquerequires a high degree of flow periodicity within the cascade fora larger number of blades. It was decided to investigate allmeans available in the test facility to broaden the range of goodflow periodicity beyond the three middle blades.
Another problem was establishing the actual value of theflow incidence angle in the cascade. The previous work alwaysreported the geometric incidence angle,iGM, based on the facilityconfiguration. Actual flow incidence,iFL, just upstream of thecascade was not measured. Frequent comments from the CFDcommunity were that to achieve reasonably good agreementbetween the measured steady state pressure distribution on theblades and predicted distributions, the incidence angle for theCFD calculations had to be lowered by about 1.5 to 2.5 dg at thehigh incidence case. In addition, pressures measureddownstream of the cascade were generally inconsistent withCFD predictions. Both of these discrepancies are addressedhere.
TECHNICAL APPROACH TO IMPROVING CASCADEFLOW QUALITY
The approach to resolving reported discrepancies was at firstfocused on experimental work only. The inlet duct wasinstrumented with additional side-wall static taps. Flowvisualization and pressure sensitive paint (PSP) techniques wereemployed to assess the flow periodicity in the cascade. Avariety of bleed conditions and tailboard settings wereinvestigated. The flow uniformity was judged by evaluating theresults of detailed measurements of sidewall static pressures: farupstream, upstream, and downstream of the cascade.Measurement of flow incidence angle and exit flow parameterswere also performed. This effort, however, resulted in minorimprovements only. It became obvious that there is afundamental mismatch between the tunnel test sectionconfiguration and blade cascade performance resulting in astrong wall tunnel interference with the cascade flowfield. Allsubsequent modifications and changes were based on analyticalpredictions of the complete tunnel flowfield provided byMcFarland, and cascade flow analysis provided by Chima. Theanalytical approaches of McFarland and Chima are described indetail in the second part of this paper (Chima et al., 2000). Onlyexperimental results are reported in this part of the paper.
89.29.5 dg
0.048 C
60.0 dg0.625 C
0.5 C
958.4 mm1.52
95.9 mm
Cθt max
γ
SC/S
ξ max
ax
h
Leading edge camber angle,Maximum thickness,Location of maximum thickness,
Blade chord,
Stagger angle,Number of blades in the cascade,Blade pitch,Cascade solidity,Pitching axis,Blade height,
Tab. 1 Airfoil and cascade parameters
Fig. 3 Airfoil and cascade coordinate system
STAGGERLINE
INLET FLOW
S
C
γγγγ+iFL
+x
AXIALDIRECTION
+yC
PITCHWISE DIRECTION
UNRESOLVED PROBLEMS WITH FLUTTER CASCADEDATA
The unsteady data, reported by Buffum et al. (1996a, 1996b),were acquired for oscillations of all nine blades. The older workdone in this cascade (Buffum and Fleeter, 1991) reported thatthe oscillating cascade produced waves which for someinterblade phase angles reflected off the wind tunnel walls backinto the cascade and interfered with the cascade unsteadyaerodynamics. Later, the tunnel was provided with perforatedwalls at several locations and acoustic treatment. The efficiencyof this arrangement still has not been proven. Ott at al. (1998)recommended for their facility just the opposite: replacement ofslotted walls with solid ones.
3
ξ
ξ
θ

NASA/TM—2000-209934 44
A rigorous way to determine the flow periodicity is tocompare the pressure loadings of all blades in the cascade.However, only two blades are fully instrumented with 15 statictaps at the blade midspan height -- one blade with instrumentedsuction side and the other one with instrumented pressure side.Consequently, the instrumented blades must be marched alongthe cascade, which is a time consuming procedure. Therefore,
initially, the focus was on uniformity ofsidewall pressure distributions, mainlyupstream and downstream of the cascade.The main goal was to find a facilityconfiguration that would exhibit uniform wallstatic pressure distributions in the cascaderegion.
CASCADE CONFIGURATIONC_20.0 / 30.0
Effects of bleed rate and lower tail-board setting (C_20.0 / 30.0)
A schematic diagram of cascade con-figuration C_20.0 / 30.0 is shown in Fig. 4.This was the original build of the NASAflutter cascade. The first step in the currentinvestigation was to explore the effects ofavailable controls (bleed system andadjustable tailboards) on the uniformity offlow in the test facility. The flow uniformitywas judged based on pitchwise distributionsof wall static pressures at three measurementstations: far upstream (x/C = 1.854),upstream (x/C = 0.355), and downstream(x/C = +1.388) of the cascade. Themeasurement stations are indicated in Fig. 4;the dimensionless axial distance from thecascade leading-edge plane, x/C, is based onthe blade chord. It should be mentioned thatthe rows of static taps far upstream andupstream of the cascade are on the back sidewall, while the downstream row of static tapsis on the front side wall.
Figure 5 shows the wall static pressuresfor no and high sidewall bleeds (about 15%of the total mass flow). All three pressuredistributions are plotted with respect to thetest section width (W = 613 mm). Thelocation of the cascade blades is alsoindicated in the figure. The cascade inletMach number was 0.8. The inlet Machnumber was determined from the averagestatic pressure upstream of the cascade atx/C = 0.355 (using static taps in the range0.2 < y/W < 0.8) and the total pressure at theinlet into the test facility. As seen in Fig. 5,bleed significantly affects the static pressure
For easy orientation the three distinct configurations ofthe cascade facility, discussed in this paper, were labeledC_20.0 / 30.0, C_21.5 / 24.5, and C_20.0 / 24.0, where the firstnumber indicates inlet wall angle, and the second number is theangle of the exit wall. The wall angles are measured from thehorizontal direction.
Fig. 4. Cascade configuration C_20.0 / 30.0
Fig. 5. Effects of sidewall boundary layer bleed rate
0.2 0.6 1.0 0.2 0.6 1.0
TEST SECTION WIDTH, y / W [ 1 ]
FAR UPSTREAM UPSTREAM DOWNSTREAM
1.0
0.8
0.6
p/p
[1]
w1t
WA
LLS
TA
TIC
PR
ES
SU
RE
,
NO BLEED HIGH BLEEDMa = 0.79
ππππTB = 1.166
Ma = 0.79
ππππTB = 1.122
Fig. 6. Effects of lower scoop bleed rate for inlet Mach number of 0.8
0.2 0.6 1.0 0.2 0.6 1.0
TEST SECTION WIDTH, y / W [ 1 ]
1.0
0.8
0.6
p/p
[1]
w1t
WA
LLS
TA
TIC
PR
ES
SU
RE
,
FAR UPSTREAM UPSTREAM DOWNSTREAM
NO BLEED HIGH BLEEDMa = 0.79
ππππTB = 1.104
Ma = 0.79
ππππTB = 1.145

NASA/TM—2000-209934 55
far upstream of the cascade and to a smalldegree also the average pressure ratio overthe cascade (πTB = 1.122 versus πTB =1.166). In both cases, however, the cascadeis subjected to nonuniform inlet flow thatdecreases from Ma = 0.86 on the left-handside to Ma = 0.73 on the right-hand side ofthe cascade. Sidewall bleed did not improvethe incoming flow uniformity.
The effects of lower-scoop bleed areshown in the Fig. 6. For no lower-scoopbleed, the upstream static pressuredistribution exhibits a pressure rise in thelower-scoop vicinity (left-hand side of theplot). For high lower-scoop bleed, the flowclose to the lower scoop is noticeablyaccelerated (the lower scoop bleed is a localsink) which is manifested by the localpressure minimum in the scoop region. Inany case the effects of lower-scoop bleed arerestricted to a small region and do not affectthe bulk of the cascade inlet flow.
Finally, the effects of lower tailboardangle setting are shown in Fig. 7. When thelower tailboard was pitched toλT = 32.0 dgangle (diverging exit channel), the localminimum on the left side of the upstreamstatic pressure distribution deepened; whenthe same tailboard was set toλT = 24.0 dg(converging exit channel) a distinct pressurepeak appeared on the left side upstream ofthe cascade. A probable reason for the peakwas that the lip of the lower scoop nowprotruded into the flow (the tailboard pivotpoint is 45 mm downstream of the tailboardtip). More importantly, there was also anoticeable effect on the downstream pressuredistribution that became more uniform;however, the pressure distribution was nowsloped from left to right which indicatedincreasing loading of the blades from left toright. This exercise indicated that the tunnelflow exit direction, forced on the flow by theoriginal tailboard setting toλT = 30.0 dg, didnot properly match the cascade exit flowangle. A proper match of the flow andtailboard angles was incorporated in the newfacility configurations as discussed later.
In summary, none of the above controlsused -- boundary layer bleed or setting theleft tailboard alone -- substantially improvedoverall uniformity of the cascade staticpressure field. The changes observed weremostly of local character.
Fig. 7. Effects of setting angle of the lower tailboard
0.2 0.6 1.0 0.2 0.6 1.0
TEST SECTION WIDTH, y / W [ 1 ]
1.0
0.8
0.6
p/p
[1]
w1t
WA
LLS
TA
TIC
PR
ES
SU
RE
,
FAR UPSTREAM UPSTREAM DOWNSTREAM
LT = 32.0 dg LT = 24.0 dgMa = 0.79
ππππTB = 1.065
Ma = 0.79
ππππTB = 1.128
Fig. 8. Effects of sidewall bleed on spanwise Mach numberdistribution at y/W = 0.388 and x/C = 0.254
0.0-0.4 0.0 0.4
SPANWISE DISTANCE, z / h [ 1 ]
0.4 -0.4
1.0
0.2
LOC
AL
MA
CH
NU
MB
ER
,
0.6
Ma
[1]
NO BLEED HIGH BLEED
Ma = 0.79
ππππTB = 1.102
Ma = 0.79
ππππTB = 1.143
Fig. 9. Effects of bleed on spanwise distribution of flow incidenceangles at y/W = 0.388 and x/C = 0.254
0.0-0.4 0.0 0.4
SPANWISE DISTANCE, z / h [ 1 ]
0.4 -0.4
15
5
FLO
WIN
CID
EN
CE
AN
GLE
,
10
FL
[dg
]
0
i
NO BLEED HIGH BLEEDMa = 0.79
ππππTB = 1.102
Ma = 0.79
ππππTB = 1.143
λ λ

NASA/TM—2000-209934 66
Fig. 10. Effects of bleed on pitchwise distribution of flowincidence angles
HNO BLEED
14
10
6
FLO
WIN
CID
EN
CE
AN
GLE
,
FL
i[d
g]
0.2 0.6 1.0 0.2 0.6 1.0
TEST SECTION WIDTH, y / W [ 1 ]
HHIGH BLEED
Ma = 0.80Ma = 0.50
Fig. 11. Effects of bleed rate on blade loading
PRESSURE SIDE, BL. #7SUCTION SIDE, BL. #5
0.2 0.6 1.0 0.2 0.6 1.0
CHORDWISE POSITION, / C [ 1 ]ξ
0.4
0.0
-0.4
ST
AT
ICP
RE
SS
UR
E
p_
-0.8CO
EF
FIC
IEN
T,
c[1
]
NO BLEED HIGH BLEED
Ma = 0.79
ππππTB = 1.122
Ma = 0.79
ππππTB = 1.166
involved but there are indications that it wasnot very high; consequently, it can be safelyassumed that the actual flow incidenceangle for Buffum’s data was between 7.5 to9.0 dg. This assumption seems to beconfirmed by CFD results of Chima et al.(2000), where the best fit of calculated bladeloading diagrams with data of Buffum et al.(1996a, 1996b) was achieved for incidenceangles about 8 dg.
Blade loading and flow periodicity(C_20.0 / 30.0)
The effects of boundary layer bleed rateon blade loading diagrams are shown in Fig.11. The difference for no-bleed and high-bleed conditions is obvious. An unspecified,and possibly non repeatable bleed, can alterthe experimental data significantly. Becausethis cascade will also be used for flutterexperiments in transonic flows, several testsfor transonic flow operating conditions werealso carried out. Boundary layer bleedingsignificantly altered the shock wave patternin the cascade as shown by shadowgraphimages in Fig. 12. The shadowgraph pictureswere obtained using a dedicated double-passschlieren system as described by Boldmanand Buggele (1983).
Finally, Fig. 13 illustrates periodicity ofthe cascade flowfield for an inlet Machnumber of 1.35 with high bleed. Ashadowgraph picture of the cascade shockstructure is acompanied by a sidewall staticpressure field acquired using the technique ofpressure sensitive paints as described byBencic (1995) and Lepicovsky at al. (1997).
Spanwise Mach number and flow incidence(C_20.0 / 30.0)
The next series of experiments was aimed at measuringspanwise distributions of the upstream Mach numbers and flowangles directly using a traversing cobra probe. The effects ofbleed on these distributions were also measured. The facility isprovided with five upstream ports for spanwise traversing atx/C = 0.254. Results of these measurements are presented inFigs. 8 through 10.
As mentioned above, the test conditions were always set for aselected upstream inlet Mach number regardless of the bleedrate. Therefore, the effects of bleed on spanwise Mach numberprofiles are only manifested by changes in the thickness of thewall boundary layer (Fig. 8). However, the pressure ratio overthe cascade is noticeably effected by the rate of bleed (πTB =1.102 versusπTB = 1.143). Further, the rate of boundary layerbleed also noticeably affects the true incidence angle iFL. In the
previous investigations by Buffum et al. (1996a, 1996b), thestated incidence angle was the geometric incidence angle iGM
(difference between the inlet duct wall direction and the staggerangle of the blades). As will be shown below, in most cases thegeometric incidence angle differs from the true flow incidence.Fig. 9 shows the spanwise distributions of the flow incidenceangles without bleed and with high bleed as measured at y/W =0.388 for the geometric incidence of 10.0 dg. As seen here, themidspan flow incidence angle is less than the geometricincidence for both cases; 6.2 dg for no bleed, and 8.1 dg for thehigh bleed rate. Finally, Fig. 10 shows the midspan flowincidence angle at four locations along the cascade width forinlet flow Mach numbers of 0.5 and 0.8. The experiments ofBuffum et al. were carried out for the three middle blades (#4,#5, and #6). In this region (0.4 < y/W < 0.6) the flow incidencevaries by 2 to 3 dg across the blade passages, and it is alwayssmaller (by 1.5 to 2.5 dg) for the no bleed case than it is for thecase of the high bleed rate. Buffum did not report the bleed rate

NASA/TM—2000-209934 77
Fig. 12 Effects of sidewall bleed rateon shock-wave pattern for aninlet Mach number of 1.03
It can be observed here, that a periodic shockstructure is in a flowfield which exhibits an overallpositive pressure gradient in the pitchwisedirection from the left end of the cascade to theright. The increasing pressure gradient across thecascade is manifested by decreasing relative depthof wall pressure depressions above the blades justpast the blade leading edges. The slope of thesidewall pressure gradient is consistent with datapresented in Fig. 5.
It is obvious from the previous results thatboundary layer bleed noticeably affects theuniformity of the flow incidence angle ahead ofthe cascade (Figs. 9 and 10). Variations in theflow incidence cause non uniform blade loadings(Fig. 11). As demonstrated in Fig. 8, the Machnumber profile at the midspan section of thechannel, where most of the data is collected, is notaffected by boundary layer bleed. Consequently, adecision was made not to use the cascade bleedsystem for the future experiments.
Empty tunnel data (C_20.0 / 30.0)For the last experiment with this configuration,
all blades were removed and wall static pressureswere measured for the empty tunnel. The resultsare shown in Fig 14 for the inlet flow Machnumbers of 0.5 and 0.8. The distributions are verysimilar to those with blades in the tunnel (Fig. 5).This result confirmed that the flowfield in thiscascade configuration was driven mainly by thetunnel walls and that the cascade had a very littleeffect here. Obviously, the turning angle imposedby the tunnel walls on the flow was significantlylarger than the flow turning generated by thecascade. Similar results were predicted usingMcFarlandÕs panel code, and are discussed in thesecond part of this paper (Chima et al., 2000).Fig. 13. Cascade Flowfield for Mach Number 1.35
CASCADE VIEW
AIRFOIL CONTOURS
B5 B6
FLOWFIELDSTRUCTURE
60 kPa
50 kPa
40 kPa
30 kPa
20 kPa
WALL PRESSURE FIELD
NO BLEED HIGH BLEED
Ma = 1.03 πTB = 1.166 Ma = 1.03 πTB = 1.303
’

NASA/TM—2000-209934 8
CASCADE CONFIGURATION C_21.5 / 24.5
The next cascade configuration was based on calculation ofthe cascade turning angle using Chima’s viscous code (Chima etal., 2000). We tried to maintain a flow incidence angle similarto the actual flow incidence as measured for the previouscascade configuration C_20.0 / 30.0. previous data set; thereforewe selected the flow incidence of 8.5 dg. For this incidence,the cascade turning angle was expected to be about 3 dg.Consequently, the inlet duct was set to an angle of 21.5 dg andthe exit tailboards were set to 24.5 dg. This cascadeconfiguration, denoted C_21.5 / 24.5, is depicted in Fig. 15 (W= 607 mm).
Wall static pressure distr ibutions (C_21.5 / 24.5)First data sets were obtained for the empty tunnel; the results
for inlet Mach numbers of 0.5 and 0.8 are shown in Fig. 16.The static pressure field was quite uniform along the cascadewidth. This was a very encouraging result. When the bladeswere placed back in the tunnel, the downstream static pressuredistribution remained flat; however, the upstream static pressurefield exhibited a sudden increase at the left-hand end of thecascade (Fig. 17). The possibility that this pressure rise was
8
Fig. 14. Wall pressure distributions in an empty tunnelfor configuration C_20.0 / 30.0
0.2 0.6 1.0 0.2 0.6 1.0
TEST SECTION WIDTH, y / W [ 1 ]
FAR UPSTREAM UPSTREAM DOWNSTREAM
1.0
0.8
0.6
p/p
[1]
w1t
WA
LLS
TA
TIC
PR
ES
SU
RE
,
Ma = 0.49
ππππET = 1.048
Ma = 0.79
ππππET = 1.122
Fig. 15. Cascade configuration C_21.5 / 24.5
Blade loading and flow periodicity (C_21.5 / 24.5)Blade loading periodicity was verified by measuring load
diagrams for all blades in the cascade. As mentioned above, wehad only two blades instrumented with static taps at the blademidspan, and consequently these two blades had to be‘marched’ through the cascade. We kept tunnel operationconditions repeatable within 1% of the inlet Mach number foreach blade position. Two of the loading diagrams forinstrumented blade positions 4+5 and 5+6 are shown in Fig. 18.
To visualize differences in loading diagrams for individualblades, we plotted differences between pressure coefficientvalues of a particular blade and the blade in position #5. Theplots of measured differences (pressure coefficient deviations)are shown in Fig. 19 for an inlet Mach number of 0.8. First, thesketch at the top of the figure identifies individual blades withcolor coded numbers. The left half of the cascade consists ofblades 1 through 5 and the right half of blades 5 through 9. Ofthe four plots in Fig. 19, the two on the left are for the cascadeleft half, the two on the right are for the cascade right half, thetwo lower plots show data for blade pressure surfaces. Asmentioned above, the blade differences with respect to blade #5
caused by flow blockage in this cascadesection due to the proximity of the first bladeto the tunnel left wall (Fig. 15) wasconsidered. McFarland’s prediction of thecascade static pressure field (Chima et al.,2000) indicated that there is a pressuredisturbance propagating from the first bladeupstream of the cascade. The predictedlocation of this disturbance at the station ofthe upstream static taps coincided reasonablywell with the measured data. To verify thisprediction, we removed the first blade of thecascade and repeated the experiment. Theresult is in Fig. 17 (right-hand plot). Thelocation of the upstream static pressureincrease moved one blade pitch to the right,exactly as predicted by McFarland. Thecalculations and comparisons withexperimental data are discussed in the secondpart of this paper (Chima et al., 2000).
are plotted here. Blade #5 is represented by astraight, black, broken line. The actualloading diagram for blade #5 can seen in Fig.18. The deviation curves for the remainingblades in Fig. 19 are color coded inaccordance with the blade numbers in thesketch. For a perfectly periodic flow in thecascade, all deviation curves would collapseto the broken straight line of blade #5.Positive values of deviation indicate that aparticular blade has, at that chordwiseposition, a higher pressure coefficient valuethan the blade #5 at the same chord station.

NASA/TM—2000-209934 9
Fig. 16. Wall pressure distributions in an empty tunnelfor configuration C_21.5 / 24.5
0.2 0.6 1.0 0.2 0.6 1.0
TEST SECTION WIDTH, y / W [ 1 ]
FAR UPSTREAM UPSTREAM DOWNSTREAM
1.0
0.8
0.6
p/p
[1]
w1t
WA
LLS
TA
TIC
PR
ES
SU
RE
,
Ma = 0.79
ππππET = 1.057
Ma = 0.50
ππππET = 1.017
0.2 0.6 1.0 0.2 0.6 1.0
TEST SECTION WIDTH, y / W [ 1 ]
1.0
0.8
0.6
p/p
[1]
w1t
WA
LLS
TA
TIC
PR
ES
SU
RE
,
FAR UPSTREAM UPSTREAM DOWNSTREAM
ALL BLADESIN CASCADE
BLADE # 1REMOVED
Ma = 0.79
ππππTB = 1.003
Ma = 0.77
ππππTB = 0.954
Fig. 17. Effect of the first blade on wall pressure forconfiguration C_21.5 / 24.5
9
For a negative deviation value, the pressurecoefficient of a particular blade is smallerthan that on blade #5.
A comment must be made here aboutthe measuring accuracy. All pressures inthe cascade were measured with absolutepressure transducers with a range of100 kPa (15 psia), and an accuracy betterthan±0.4%. This translates to an accuracyof ±0.02 for the value of pressurecoefficient. Therefore, it is reasonableto expect that deviations of pressurecoefficient less than 0.04 may beconsidered as insignificant. In light ofthis, there is very good agreement inloading for suction surfaces of blades #4and 5, while blade #6 is marginal. On thepressure side, the agreement is very goodfor blades #3, 4, 5, and 6, and marginal forblade #7.
Finally, the distribution of blade forceand torque along the cascade is shownin Fig. 20. These quantities were integratedfrom the measured blade surface pressures.The blade force direction was perpendicularto the blade’s chord. The blade torque wascalculated relative to the chordmidpoint. As seen here, the blade loadingis not uniform. The first and the lastblades are highly loaded with respect to theother blades. Surprisingly, the right halfof the cascade is less loaded thanexpected. A comparison with predicteddata is discussed in the second part ofthis paper (Chima et al., 2000).
Overall results from this cascadeconfiguration indicated a slightimprovement in comparison with theoriginal configuration, however, the flowperiodicity and uniformity was still notsatisfactory. The major problem withthis configuration was that we wereunable to obtain transonic inlet flow inthe cascade. The maximum inlet Machnumber was 0.9. To obtain supersonicinlet flow in the tunnel we had to‘close’ the inlet duct which was doneby returning back to the headboard angleof 20 dg as discussed in the nextsection.0.2 0.6 1.0 0.2 0.6 1.0
CHORDWISE POSITION, / C [ 1 ]ξ
0.4
0.0
-0.4
ST
AT
ICP
RE
SS
UR
E
p_
-0.8CO
EF
FIC
IEN
T,
c[1
]
SUCTION SIDE PRESSURE SIDE
S-SIDE BL #4P-SIDE BL #5
S-SIDE BL #5P-SIDE BL #6
Ma = 0.79
ππππTB = 0.999
Ma = 0.79
ππππTB = 1.003
Fig. 18. Blade loading diagrams for configurationC_21.5 / 24.5

NASA/TM—2000-209934 10
65 97 8
4 51 32
Configuration C_21.5 / 24.5Ma = 0.79
ππππTB = 0.990
0.2 0.6 1.0 0.2 0.6 1.0
CHORDWISE POSITION, / C [ 1 ]ξ
0.2
0.0
-0.2
0.2
0.0
-0.2
PR
ES
SU
RE
CO
EF
FIC
IEN
TD
EV
IAT
ION
S,
c[1
]p_
∆
S1 � S5 S4 � S5S3 � S5S2 � S5
S9 � S5 S6 � S5S7 � S5S8 � S5
SUCTION SURFACELEFT HALF
SUCTION SURFACERIGHT HALF
PRESSURE SURFACERIGHT HALF
PRESSURE SURFACELEFT HALF
Fig. 19. Blade loading periodicity forconfiguration C_21.5 / 24.5
Fig. 20. Distribution of blade force and torquefor configuration C_21.5 / 24.5
80
40
20
BLA
DE
FO
RC
E,
F[N
]B
0
60
5
0
-10 BLA
DE
TO
RQ
UE
,T
[Nm
]B
-5
1 3 5 7
BLADE NUMBER
9
BLADEFORCE
BLADETORQUE
Wall static pressures distr ibutions(C_20.0 / 24.0)
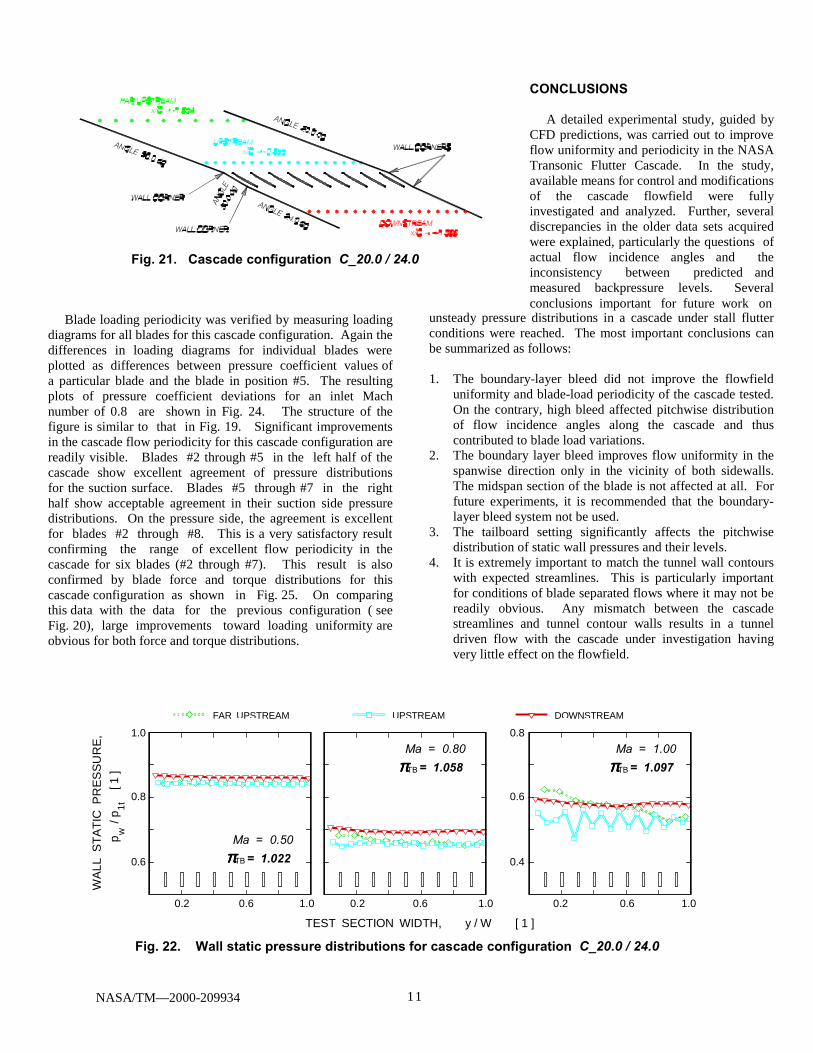
Wall static pressures distributions forthis configuration were very uniform asshown in Fig. 22 for three inlet Machnumbers of 0.5, 0.8, and 1.0. The saw toothcharacter of the upstream pressuredistribution for Ma = 1.0 indicates presenceof shock waves emanating from the bladeleading edges. The uniformity of wallstatic pressures in the pitchwise directionwas a good indicator of an improvedcascade flow periodicity for thisconfiguration.
Blade loading and flow periodicity(C_20.0 / 24.0)
Blade loading diagrams for blade #4(suction surface), blade #5 (suction andpressure surfaces) and blade #6 (pressuresurface) for three inlet Mach number of 0.5,0.8, and 1.0 are shown in Fig. 23. The firstinspection reveals that there are nosignificant differences in pressuredistributions for lower Mach numbers of0.5 and 0.8. The loading diagrams for theinlet Mach number of 1.0, however,indicate changes in the flow pattern as theflow becomes transonic.
CASCADE CONFIGURATION C_20.0 / 24.0
The final cascade facility configuration was basedon R. Chima’s suggestion to adjust the tunnel wall to theshape of streamlines of a perfectly periodiccascade. The configuration is shown in Fig. 21. Theheadboards were set to an angle of 20 dg, and thetailboards were set to 24 dg angle because CFD resultsshowed the cascade turns the flow by 4 dg for the flowincidence angle of 10 dg. The headboards and tailboardswere joined by an insert aligned with the blade settingangle of 30 dg. This insert approximated the streamlinesat blade passage midpitch. The cascade width wasW= 526 mm.
midpitch
NASA/TM—2000-209934 1111
Blade loading periodicity was verified by measuring loadingdiagrams for all blades for this cascade configuration. Again thedifferences in loading diagrams for individual blades wereplotted as differences between pressure coefficient values ofa particular blade and the blade in position #5. The resultingplots of pressure coefficient deviations for an inlet Machnumber of 0.8 are shown in Fig. 24. The structure of thefigure is similar to that in Fig. 19. Significant improvementsin the cascade flow periodicity for this cascade configuration arereadily visible. Blades #2 through #5 in the left half of thecascade show excellent agreement of pressure distributionsfor the suction surface. Blades #5 through #7 in the righthalf show acceptable agreement in their suction side pressuredistributions. On the pressure side, the agreement is excellentfor blades #2 through #8. This is a very satisfactory resultconfirming the range of excellent flow periodicity in thecascade for six blades (#2 through #7). This result is alsoconfirmed by blade force and torque distributions for thiscascade configuration as shown in Fig. 25. On comparingthis data with the data for the previous configuration ( seeFig. 20), large improvements toward loading uniformity areobvious for both force and torque distributions.
Fig. 21. Cascade configuration C_20.0 / 24.0
Fig. 22. Wall static pressure distributions for cascade configuration C_20.0 / 24.0
1.0
0.8
0.6
p/p
[1]
w1t
WA
LLS
TA
TIC
PR
ES
SU
RE
, 0.8
0.6
0.4
FAR UPSTREAM UPSTREAM DOWNSTREAM
0.2 0.6 1.0 0.2 0.6 1.0
TEST SECTION WIDTH, y / W [ 1 ]
1.00.60.2
Ma = 0.50
ππππTB = 1.022
Ma = 0.80
ππππTB = 1.058
Ma = 1.00
ππππTB = 1.097
unsteady pressure distributions in a cascade under stall flutterconditions were reached. The most important conclusions canbe summarized as follows:
1. The boundary-layer bleed did not improve the flowfielduniformity and blade-load periodicity of the cascade tested.On the contrary, high bleed affected pitchwise distributionof flow incidence angles along the cascade and thuscontributed to blade load variations.
2. The boundary layer bleed improves flow uniformity in thespanwise direction only in the vicinity of both sidewalls.The midspan section of the blade is not affected at all. Forfuture experiments, it is recommended that the boundary-layer bleed system not be used.
3. The tailboard setting significantly affects the pitchwisedistribution of static wall pressures and their levels.
4. It is extremely important to match the tunnel wall contourswith expected streamlines. This is particularly importantfor conditions of blade separated flows where it may not bereadily obvious. Any mismatch between the cascadestreamlines and tunnel contour walls results in a tunneldriven flow with the cascade under investigation havingvery little effect on the flowfield.
CONCLUSIONS
A detailed experimental study, guided byCFD predictions, was carried out to improveflow uniformity and periodicity in the NASATransonic Flutter Cascade. In the study,available means for control and modificationsof the cascade flowfield were fullyinvestigated and analyzed. Further, severaldiscrepancies in the older data sets acquiredwere explained, particularly the questions ofactual flow incidence angles and theinconsistency between predicted andmeasured backpressure levels. Severalconclusions important for future work on

NASA/TM—2000-209934 1212
5. Flow incidence angles should be measured for each newconfiguration of the cascade facility. It is very risky to relyon geometric angles in determining the actual flowincidence.
6. By carefully tailoring tunnel wall contours to the expectedstreamlines for the current flow incidence of 10 dg, theflowfield uniformity upstream and downstream of thecascade improved significantly. Further, a very high bladeload uniformity now extends over six blades from blade #2to blade #7.
Fig. 23. Blade loading diagrams for configurationC_20.0 / 24.0
0.2 0.6 1.0 0.2 0.6 1.0
CHORDWISE POSITION, / C [ 1 ]ξ
SUCTION SIDE PRESSURE SIDE
0.4
0.0
-0.4
p_
-0.8
ST
AT
ICP
RE
SS
UR
EC
OE
FF
ICIE
NT
,c
[1]
0.4
0.4
0.0
0.0
-0.4
-0.4
-0.8
-0.8
S-SIDE BL #4P-SIDE BL #5
S-SIDE BL #5P-SIDE BL #6
Ma = 0.50
ππππTB = 1.022
Ma = 0.50
ππππTB = 1.023
Ma = 1.00
ππππTB = 1.097
Ma = 1.00
ππππTB = 1.099
Ma = 0.80
ππππTB = 1.058
Ma = 0.80
ππππTB = 1.060
REFERENCES
Bencic, T.J., 1995, “Experience UsingPressure Sensitive Paint in NASA LewisResearch Center Propulsion Test Facilities”,AIAA Paper 95-2831.
Boldman, D.R. and Buggele, A.E., 1978,“Wind Tunnel Tests of a Blade Subjected toMidchord Torsional Oscillations at HighSubsonic Stall Flutter Conditions”, NASATM-78998.
Boldman, D.R. and Buggele, A.E., 1983,“Experimental Evaluation of ShocklessSupercritical Airfoils in Cascade”, AIAAPaper 83-0003.
Buffum, D.H. and Fleeter, S., 1988,“Investigation of Oscillating CascadeAerodynamics by an Experimental InfluenceCoefficient Technique”, NASA TM-101313.
Buffum, D.H. and Fleeter, S., 1991,“Wind Tunnel Wall Effects in a LinearOscillating Cascade”, NASA TM-103690.
Buffum, D.H., Capece, V.R., King, A.J.,and El-Aini, Y.M., 1996a, “OscillatingCascade Aerodynamics at Large MeanIncidence”, ASME Paper 96-GT-339; alsoNASA TM-107247.
Buffum, D.H., Capece, V.R., King, A.J.,and El-Aini, Y.M., 1996b, “ExperimentalInvestigation of Unsteady Flows at LargeIncidence Angles in a Linear OscillatingCascade”, AIAA Paper 96-2823, 1996; alsoNASA TM-107283.
Chima, R.V, McFarland, E.R., Wood,J.R., and Lepicovsky, J., 2000, “OnFlowfield Periodicity in the NASATransonicFlutter Cascade, Part II – Numerical Study”,ASME Paper 2000-GT-0573.
7. The facility is now ready for unsteady pressure dataacquisition to acquire benchmark data sets for validatingunsteady computational fluid dynamics codes used tomodel cascade stall flutter.
Lepicovsky, J., Bencic, T.C., andBruckner, R.J., 1997, “Application ofPressure Sensitive Paint to Confined Flowat Mach Number 2.5”, AIAA Paper 97-3214.
Ott, P., Norryd, M., and Bölcs, A.,1998, “The Influence of Tailboards onUnsteady Measurements in a LinearCascade”, ASME Paper 98-GT-572.
Shaw, L.M., Boldman, D.R., Buggele,A.E., and Buffum, D.H., 1986, “UnsteadyPressure Measurements on a BiconvexAirfoil in a Transonic Oscillating Cascade”,Journal of Engineering for Gas Turbinesand Power, Vol. 108, pp. 53-59.

NASA/TM—2000-209934 1313
65 97 8
4 51 32
Configuration C_20.0 / 24.0Ma = 0.80
ππππTB = 1.059
0.2 0.6 1.0 0.2 0.6 1.0
CHORDWISE POSITION, / C [ 1 ]ξ
0.2
0.0
-0.2
0.2
0.0
-0.2PR
ES
SU
RE
CO
EF
FIC
IEN
TD
EV
IAT
ION
S,
c[1
]p_
∆
S1 � S5 S4 � S5S3 � S5S2 � S5
S9 � S5 S6 � S5S7 � S5S8 � S5
SUCTION SURFACELEFT HALF
SUCTION SURFACERIGHT HALF
PRESSURE SURFACERIGHT HALF
PRESSURE SURFACELEFT HALF
Fig. 24. Blade loading periodicity forconfiguration C_20.05 / 24.0
80
40
20
BLA
DE
FO
RC
E,
F[N
]B
0
60
5
0
-10 BLA
DE
TO
RQ
UE
,T
[Nm
]B
-5
1 3 5 7
BLADE NUMBER
9
BLADEFORCE
BLADETORQUE
Fig. 25. Distribution of blade force and torquealong the cascade for configurationC_20.0 / 24.0

This publication is available from the NASA Center for AeroSpace Information, (301) 621–0390.
REPORT DOCUMENTATION PAGE
2. REPORT DATE
19. SECURITY CLASSIFICATION OF ABSTRACT
18. SECURITY CLASSIFICATION OF THIS PAGE
Public reporting burden for this collection of information is estimated to average 1 hour per response, including the time for reviewing instructions, searching existing data sources,gathering and maintaining the data needed, and completing and reviewing the collection of information. Send comments regarding this burden estimate or any other aspect of thiscollection of information, including suggestions for reducing this burden, to Washington Headquarters Services, Directorate for Information Operations and Reports, 1215 JeffersonDavis Highway, Suite 1204, Arlington, VA 22202-4302, and to the Office of Management and Budget, Paperwork Reduction Project (0704-0188), Washington, DC 20503.
NSN 7540-01-280-5500 Standard Form 298 (Rev. 2-89)Prescribed by ANSI Std. Z39-18298-102
Form Approved
OMB No. 0704-0188
12b. DISTRIBUTION CODE
8. PERFORMING ORGANIZATION REPORT NUMBER
5. FUNDING NUMBERS
3. REPORT TYPE AND DATES COVERED
4. TITLE AND SUBTITLE
6. AUTHOR(S)
7. PERFORMING ORGANIZATION NAME(S) AND ADDRESS(ES)
11. SUPPLEMENTARY NOTES
12a. DISTRIBUTION/AVAILABILITY STATEMENT
13. ABSTRACT (Maximum 200 words)
14. SUBJECT TERMS
17. SECURITY CLASSIFICATION OF REPORT
16. PRICE CODE
15. NUMBER OF PAGES
20. LIMITATION OF ABSTRACT
Unclassified Unclassified
Technical Memorandum
Unclassified
National Aeronautics and Space AdministrationJohn H. Glenn Research Center at Lewis FieldCleveland, Ohio 44135–3191
1. AGENCY USE ONLY (Leave blank)
10. SPONSORING/MONITORING AGENCY REPORT NUMBER
9. SPONSORING/MONITORING AGENCY NAME(S) AND ADDRESS(ES)
National Aeronautics and Space AdministrationWashington, DC 20546–0001
March 2000
NASA TM—2000-209934ASME 2000–GT–0572
E–12179
WU–523–26–13–00
19
A03
On Flowfield Periodicity in the NASA Transonic Flutter Cascade,Part I—Experimental Study
J. Lepicovsky, E.R. McFarland, R.V. Chima, and J.R. Wood
Transonic cascade testing; Cascade flow periodicity
Unclassified -UnlimitedSubject Categories: 02 and 09 Distribution: Nonstandard
Prepared for the 45th International Gas Turbine and Aeroengine Technical Congress sponsored by the American Societyof Mechanical Engineers, Munich, Germany, May 8–11, 2000. J. Lepicovsky, Dynacs Engineering Company, Inc.,2001 Aerospace Parkway, Brook Park, Ohio 44142 (work funded by NAS3–98008). E.R. McFarland, R.V. Chima, andJ.R. Wood, NASA Glenn Research Center. Responsible person, E. McFarland, organization code 5810, (216) 433–5915.
An extensive study to improve flow uniformity and periodicity in the NASA Transonic Flutter Cascade is presented here.The results are reported in two independent parts dealing with the experimental approach and the analytical approach.The first part, the Experimental Study, focuses first on the data sets acquired in this facility in the past and explainsseveral discrepancies, particularly the questions of actual flow incidence and cascade backpressure levels. Next, availablemeans for control and modifications of the cascade flowfield, boundary layer bleed and tailboard settings are presented indetail. This is followed by experimental data sets acquired in modified test facility configurations that were based onanalytical predictions of the cascade flowfield. Finally, several important conclusions about improving the cascadeflowfield uniformity and blade load periodicity are summarized. The important conclusions are: (1) boundary layer bleeddoes not improve the cascade flow periodicity; (2) tunnel wall contours must be carefully matched to the expected shapeof cascade streamlines; (3) actual flow incidence for each cascade configuration rather must be measured instead ofrelying on the tunnel geometry; and (4) the current cascade configuration exhibits a very high blade load uniformity oversix blades from blade #2 to blade #7, and the facility is now ready for unsteady pressure data acquisition.


![Influence of Transonic Flutter on the Conceptual Design of ......V? = Wing-perpendicularvelocity a = Acceleration b = Wingspan ... subsonic, and supersonic flow. Theodorsen [10],](https://static.fdocuments.in/doc/165x107/5e88fb902e59b70b946d6699/influence-of-transonic-flutter-on-the-conceptual-design-of-v-wing-perpendicularvelocity.jpg)