
On-Demand Energy Harvesting Techniques - A System Level Perspective
89
On-Demand Energy Harvesting Techniques – A System Level Perspective by James Ugwuogo A thesis presented to the University of Waterloo in fulfillment of the thesis requirement for the degree of Master of Applied Science in Electrical and Computer Engineering Waterloo, Ontario, Canada, 2012 © James Ugwuogo 2012
Transcript of On-Demand Energy Harvesting Techniques - A System Level Perspective

On-Demand Energy Harvesting Techniques – A System Level Perspective
by
James Ugwuogo
A thesis
presented to the University of Waterloo
in fulfillment of the
thesis requirement for the degree of
Master of Applied Science
in
Electrical and Computer Engineering
Waterloo, Ontario, Canada, 2012
© James Ugwuogo 2012

ii
Declaration
I hereby declare that I am the sole author of this thesis. This is a true copy of the thesis, including
any required final revisions, as accepted by my examiners.
I understand that my thesis may be made electronically available to the public.
iii
Abstract
In recent years, energy harvesting has been generating great interests among researchers,
scientists and engineers alike. One of the major reasons for this increased interest sterns from the
desire to have autonomous perpetual power supplies for remote monitoring sensor nodes
utilizing some of the already available and otherwise wasted energy in the environment in a very
innovative and useful way (and at the same time, maintaining a green environment).
Scientists and engineers are constantly looking for ways of obtaining continuous and
uninterrupted data from several points of interests especially remote or dangerous locations,
using sensors coupled with RF transceivers, without the need of ever replacing or recharging the
batteries that power these devices.
This is now made possible through energy harvesting technologies which server as suitable
power supply substitutes, in many cases, for low power devices. With the proliferation of
wireless energy in the environment through different radio frequency bands as well as natural
sources like solar, wind and heat energy, it has become a desirable thing to take advantage of
their availability by harvesting and converting them to useful electrical energy forms.
The energy so harnessed or harvested could then be utilized in sensor nodes. Now, since these
energy sources fluctuate from time to time, and from place to place, there is the need to have a
form of energy accumulation, conversion, conditioning and storage. The stored energy would
then be reconverted and used by the sensors nodes and/or RF transceivers when needed. The
process through which this is done is referred to as energy management.
In this research work, many types of energy harvesting transducers were explored including –
solar, thermal, electromagnetic and piezo/vibration. A proof of concept approach for an on-
demand electromagnetic power generator is then presented towards the end. While most, if not
all, of the energy harvesting techniques discussed needed some time to accumulate enough
charge to operate their respective systems, the on-demand energy harvester makes energy
available as at and when needed. In summary, a system level design is presented with suggested
future research works.

iv
Acknowledgements
First and foremost, I want to thank the Lord God almighty for the gift of life and for the grace
given me to combine both work and school. Secondly I want to thank my Company, the
Research In Motion (RIM) LTD for the academic assistance given me and the enabling
environment to apply my knowledge at the highest level of technological innovation. I want to
also express my gratitude to my supervisor, Professor S. Safavi-Naeini for this support,
inspiration and guidance. A big thank you also goes to Professor E. Abdel-Rahman and his team
for allowing me use his lab during my experiments.
Finally, I want to say an unreserved thank you to my lovely wife, Chiazor James Ugwuogo for
the comfort and support and for encouraging me to carry on with both work and school while she
takes care of our first baby. And finally, many thanks to our dear bundle of joy, Chimmeremnma
Ugwuogo for the smiles and giggles.
Thanks to you all for the great roles you have played in making my dream a reality.

v
Dedication
This Thesis is dedicated to Sunshine and Delight.

vi
Table of contents
Declaration .................................................................................................................................................... ii
Abstract ........................................................................................................................................................ iii
Acknowledgements ...................................................................................................................................... iv
Dedication ..................................................................................................................................................... v
Table of contents .......................................................................................................................................... vi
List of figures ............................................................................................................................................... ix
List of tables .................................................................................................................................................. x
List of Abbreviations ................................................................................................................................... xi
Chapter 1 ....................................................................................................................................................... 1
Introduction ................................................................................................................................................... 1
Energy Harvesting Definition ................................................................................................................... 1
Status Quo - Problem Statement ............................................................................................................... 4
Suggested Solution.................................................................................................................................... 5
Chapter 2 ....................................................................................................................................................... 6
Background/Related work - State of the Art ................................................................................................. 6
Solar Energy Harvesters ........................................................................................................................... 7
Acoustic Energy Harvesters .................................................................................................................... 11
Thermal Energy Harvesters ........................................................................................................................ 13
Mechanical/Piezoelectric Energy Harvesters .............................................................................................. 13
Radio Frequency (RF) Energy Harvesters .............................................................................................. 14
Hybrid Solar-Heat harvesters ...................................................................................................................... 18
Chapter 3 ..................................................................................................................................................... 20
History of Energy Harvesting ..................................................................................................................... 20
Chapter 4 ..................................................................................................................................................... 24
System Perspective of Energy Harvesting Technologies............................................................................ 24
DC to DC conversion .............................................................................................................................. 28
Maximum-power-point-tracking (MPPT) ............................................................................................... 29
Classification of MPPT ........................................................................................................................... 30
Strategy for efficient power management ......................................................................................... 31
Chapter 5 ..................................................................................................................................................... 32

vii
Piezoelectric Harvester attempt and MPG design ................................................................................... 32
Simulation of piezoelectric generator using COMSOL 3.5a .................................................................. 32
Boundary conditions ............................................................................................................................... 34
Study using PZT-4 .................................................................................................................................. 35
Study using Aluminum Nitride ............................................................................................................... 36
Study using Barium Sodium Niobate (BSN) .......................................................................................... 37
Study using Rochelle salt ........................................................................................................................ 38
System design ............................................................................................................................................. 39
Piezoelectric Harvester ....................................................................................................................... 39
Bridge rectifier .................................................................................................................................... 40
Energy harvesting module .................................................................................................................. 40
Remote control Transmitter/Receiver ................................................................................................ 41
Remote controlled electronics ............................................................................................................ 41
Lessons Learned – Deviation from Ideal Conditions ........................................................................... 41
Result of Piezoelectric design concept .................................................................................................... 42
Magnetic Power Generator (MPG) Design ................................................................................................. 42
Principle of operation .............................................................................................................................. 42
Description of the magnetic power generator ................................................................................... 48
Initial Design Fabrication Details ........................................................................................................... 49
The neodymium magnet ..................................................................................................................... 50
Stainless non-magnetic inner sleeve................................................................................................... 50
Copper outer sleeve ............................................................................................................................ 50
Stainless steel Iron-core ...................................................................................................................... 50
PCB bases and supports ...................................................................................................................... 51
Pair of insulated conducting wires ...................................................................................................... 51
Fabrication and testing of Proof of concept ................................................................................................ 51
Voltage rectification and filtering ............................................................................................................... 54
Full wave Voltage rectifiers ........................................................................................................................ 55
Voltage filtering and storage ................................................................................................................... 55
Summary ..................................................................................................................................................... 56
Chapter 6 ..................................................................................................................................................... 58
Conclusion and Future Work ...................................................................................................................... 58

viii
Challenges and future work ................................................................................................................ 61
Future research opportunities ............................................................................................................ 62
References .......................................................................................................................................... 63
Appendices .................................................................................................................................................. 66
Appendix A ................................................................................................................................................. 66
Appendix B ................................................................................................................................................. 69
Appendix C ................................................................................................................................................. 71
Appendix D ................................................................................................................................................. 72

ix
List of figures
Figure 1: General structure of a wireless sensor node [4] ............................................................................. 6
Figure 2: Schematic diagram of a generic self-powered device [24] ............................................................ 7
Figure 3: Solar energy reaching the earth’s surface. ..................................................................................... 8
Figure 4: An organic semiconductor-based small-molecule solar cell [4] .................................................... 9
Figure 5: Measured V-I characteristics of the solar World 4-4.0-100 solar panel ...................................... 10
Figure 6: A solar energy harvesting sensor node [7] .................................................................................. 11
Figure 7: Schematic of overall acoustic energy harvesting concept [12] ................................................... 12
Figure 8: Standard AC-DC harvesting circuit with piezoelectric generator ............................................... 14
Figure 9: Voltage doubler circuit diagram .................................................................................................. 15
Figure 10: Generic block diagram of an RF harvesting system .................................................................. 16
Figure 11: Schematic diagram showing the operation of an RF MEMS switch. ........................................ 17
Figure 12: RFID-enabled wireless sensor transmitter using inkjet-printing on paper ................................ 18
Figure 13: Silicon chip micro-reactors ........................................................................................................ 19
Figure 14: Original design of the Helmholtz resonator .............................................................................. 21
Figure 15a: Full wave rectifier circuit ......................................................................................................... 26
Figure 16: Boost converter .......................................................................................................................... 28
Figure 17: Charge pump converter ............................................................................................................. 28
Figure 18: Maximum power point tracker circuit diagram [26] ................................................................. 29
Figure 19: Piezoelectric material showing the fixed ends .......................................................................... 34
Figure 20: COMSOL view of piezoelectric material just before simulation .............................................. 34
Figure 21a: Force-Displacement plot of the PZT-4 .................................................................................... 35
Figure 22a: Force-displacement of the Aluminum Nitride ......................................................................... 36
Figure 23a: Force-displacement of the BSN ............................................................................................... 37
Figure 24a: Force-displacement of the Rochelle salt .................................................................................. 38
Figure 25: Block diagram of the battery-less remote controller ................................................................. 39
Figure 26: Equivalent circuit of the piezoelectric material ......................................................................... 41
Figure 27: Magnetic lines of force through a conductor ............................................................................. 43
Figure 28: MPG model for COMSOL simulation ...................................................................................... 45
Figure 29: Steel rod - iron core center piece - at '0'mm displacement ........................................................ 47
Figure 30: Dimension of the magnetic power generator ............................................................................. 51
Figure 31: MPG setup and mode of operation – push down mode ............................................................. 52
Figure 32: MPG setup and mode of operation – release mode ................................................................... 52
Figure 33a and b: Induced EMF phase ‘a’ .................................................................................................. 53
Figure 34a and b: Bridge rectifier on Breadboard ...................................................................................... 55
Figure 35: Full-wave rectifier and oscilloscope view of rectified voltage under some load condition ...... 55
Figure 36: RC configuration for calculating discharge time constant ........................................................ 56
Figure 37: Full diagram of the MPG energy harvesting RF transmitter circuit .......................................... 58
Figure 38: Full diagram of the MPG energy harvesting RF receiver circuit .............................................. 59
Figure 39c: The exploded diagram of the MPG generator assembly .......................................................... 61

x
List of tables
Table 1: Energy availability from different sources ................................................................................... 16
Table 2: Summary of strength and variability in each of the finger couplings and for simple grip across
the 100 subjects [31] ................................................................................................................................... 33
Table 3: Table 3: Summary of strength and variability in each of the finger couplings and for simple grip
classified by gender [31] ............................................................................................................................. 33
Table 4: Table 4: Result comparison after simulation ................................................................................ 39
Table 5: Table of Magnetic flux density ..................................................................................................... 47
Table 6: Comparison between homemade vs. machine fabricated prototypes ........................................... 71
Table 8: Table of Constants ........................................................................................................................ 72

xi
List of Abbreviations
Abbreviations Meaning
AC Alternating Current
ADS Advanced Design System
ASK Amplitude Shift Keying
BPF Band pass filter
CIGS Copper Indium Gallium Selenide
CMOS Complementary Metallic Oxide Semiconductor
DC Direct Current
FET Field Effect Transistor
GHz Giga Hertz
Hz Hertz
Inc. Incorporated
ISM Industrial Scientific and Medical
KHz Kilo Hertz
Km Kilometre
LPF Low pass filter
LTD Limited
MEMS Microelectromechanical System
MHz Mega Hertz
MIT Massachusetts Institute of Technology
mm² Millimetre Square
MPPT Maximum Power Point Tracking
mT MilliTesla
mW/cm² MilliWatt per centimetre square
Pb Lead
P-I-N Personal Identification Number
PZT Piezoelectric Transducer
RF Radio Frequency
RFID Radio Frequency Identification

xii
T Tesla
TEGs Thermoelectric Generators
Ti Texas instrument
TV Television
V Voltage
Vs Versus
W/cm² Watt per Centimetre square
WiFi Wireless Fidelity
w.r.t With respect to
Zn Zink
μW Micro Watt

1
Chapter 1
Introduction
Majority of wireless devices depend on battery power for their functions, and these batteries
must be replaced or recharged when depleted; this invariably is a major limitation for remotely
located systems [1]. This thesis seeks to eliminate this limitation using on-demand energy
harvesting technologies.
The world around us is full of one form of energy or another and are available in various forms
including solar, thermal, wind, mechanical and acoustic forms. However, most of these energy
sources are only available in ambient quantities that will not be able to supply enough energy to
power a useful system without some form of voltage conditioning. Even those available in large
useful quantities would still require conversion to a useful electrical form. The technology to
capture, condition and use these energy sources was not known until recently. This technology is
referred to as Energy harvesting.
Energy Harvesting Definition
Energy harvesting is the process of scavenging ambient amounts of energy from the
environmnet, accumulating and storing for use at a later time. Energy harvesting devices or
modules are efficiently and effectively used to trap or capture these ambient energies which are
then accumulated and stored for immediate or later use. When the demand arises, the stored
energies are processed and managed and then supplied in a form that can then be used to perform
useful tasks [21]. Energy harvesting/scavenging devices perform this harvesting task using
diverse forms of sensors and control circuitry. The harvested energy is used to charge up a super
capacitor or a rechargable battery that are in turn used to power sensor nodes or RF transceivers.
Another way to look at energy harvesting / scavenging is as the process whereby one form of
energy is derived from other sources. Often the energy said to be harvested is available in trace
amounts and would have otherwise been wasted. The term ‘energy recycling’ seems appropriate,
to some degree, as an alternative term for energy harvesting (since in many cases, the energy
harvested is entirely of a different form than the one it is converted into for final use, say
mechanical energy harvested and converted to electrical energy).

2
This thesis focuses on electrical energy harvesting which could be derived from free ambient
sources in the environment. Some of these sources include wind, solar, temperature gradient,
acoustic perturbations, Radio Frequency, fluid, Chemical, Biological and mechanical/motion.
And more importantly, the proof of concept presented here shows how we could harvest
electrical energy from a regular mechanical gesture used to operate everyday equipment in an
on-demand basis.
Energy harvesters provide electrical energy in limited quantities that can only power ultra-low
power transceivers or sensor nodes. Where low power, short range data communication
(especially non-continuous communication) is desirable, energy harvesters are the desirable
alternatives to other sources like battery or electricity from utility supply.
Sometimes sensors are deployed to remote or dangerous/hazardous locations or even hard to
reach areas, and in some cases they might even be installed in rural locations and used to
monitor, say, power outages or weather conditions. To limit the amount of round trips required to
change or recharge the batteries, or to eliminate this need entirely, energy harvesting techniques
come in handy.
Remote sensor nodes need sustainable or perpetual sources of energy to provide continuous
monitoring and maintain reliable and accurate information to data monitoring centres. One of
the greatest challenges then is the source of this perpetual renewable energy. Using power supply
from batteries or fixed utility supply voltages could be both technically and economically
challenging. So, in situations like this, we depend on energy harvesting technologies to fill in the
gap. These harvesters convert environmental energy whether solar, heat, wind, mechanical or
vibration into useful forms of electrical energy to be supplied to sensors.
Some of these ambient energy sources are not always available in unlimited quantities. They
fluctuate from time to time and from place to place depending on what time of day or season.
They change from one season to another and from one region to another. However, some forms
are fairly constant. Like temperature gradient – there is great likelihood of always having some
form of temperature gradient, one metal maintaining a different temperature with a dissimilar

3
metal. Likewise for RF energy, there is a high probability of always having abundant RF
radiation in the environment at every time of the day and this is even increasing with WiFi and
other hotspots been installed in several cities.
With an accurate knowledge of the environment where an energy need is required, one could
combine two or more energy harvesters to provide perpetual source of electrical energy to RF
transceivers or sensor nodes.
When a wireless node is deployed to a remote site where wall plug or battery is either unreliable
or unavailable, energy harvesting technology could be used to augument or replace the power
supply need. A remote control node running on energy harvesting power source can be
implemented as a self-powered electronic system. It is also possible to combine multiple energy
harvesting sources to enhance the overall efficiency and reliability of the system.
Combining two or more sources of energy harvesting technique increases the chance of having
constant power supply at all times such that when one form is not available in sufficient enough
quantity, the other will compliment the temporary shortage.
In this research, previous works of different energy harvesting techniques by other researchers
were explored and a novel idea called “on-demand magnetic energy harvesting” is presented.
The proof of concept portrays an approach that promises to eliminate the need of batteries in our
everyday household remote control systems such as the garage door openers or car remote
control systems. This could also be used in remote locations to monitor the activities of, say,
wild animals or enemy troops; when the subject being monitored steps on the on-demand
magnetic energy harvester, it harvests the mechanical energy, converts it into electrical energy
and uses it to power a senor and/or transceiver that will in turn send intelligent signal to the
control center. At the end, a future suggestion is made on improving the design to eliminate the
need of batteries in our household electronics.
In chapter 2, a review of the state of the art is presented showcasing some key advances and
breakthroughs in the field of energy harvesting. Many forms of energy harvesting technologies

4
were also reviewed from the earliest to the latest state of the art techniques. It concludes with a
review of independent and hybrid energy harvesting techniques.
In Chapter 3, a historical outlook was presented from the first known energy harvesting
technique known to man the present.
In chapter 4, a system perspective was presented, alongside power management techniques and
energy harvesting applications available to date.
In chapter 5, experimental proof of concept and summary were presented. Suggested
improvements and future works were also presented.
Status Quo - Problem Statement
The proliferation of miniaturized electronic systems and gadgets powered by ultra low power
CMOS integrated circuit designs has given rise to the miniaturization of power supplies for these
gadgets. Now, since these power supplies, namely batteries, have finite life, they need to be
replaced or recharged in order to maintain the usefulness of these electronics gadgets. But even
when recharged, these cells have limited cycle time at which point they need to be discarded and
replaced.
These electrochemical cells are more often than not disposed off in the environment further
adding to the environmental pollution that is currently plaguing the planet. Today we are being
confronted with the realities of global warming and its effects on earth’s climatic conditions; but
everyone could play an active role in preserving our planet by reducing the amount of waste
batteries disposed off in the environment. One less electrochemical cell/battery disposed in the
environment would mean a better planet by that much less contaminant and pollutant.
While not all batteries are classified as hazardous, many of them are still very dangerous for the
environment. It was shown that improper and illegal battery disposals are pollutants to our
drinking water and food produced from ingredients exposed to small and moderate levels of lead
content. A white paper on Active Power website [17] showed that humans are very susceptible to
the effects of lead and children are the most vulnerable.

5
We would win the battle on health and environmental impact caused by improper and illegal
battery disposal by simply replacing every battery-powered system with energy-efficient, self-
sufficient, energy-harvesting technology system.
Other existing scenarios where energy harvesting technology could easily be deployed are war
torn areas, nuclear plants or hard to reach places but which hold vital data that need to be
accessed. It will be undesirable for humans to visit such locations to replace sensor batteries due
to the danger they pose but using self-powered energy harvesting wireless sensor nodes will both
obviate the need for batteries as well as provide the monitoring required.
Suggested Solution
Energy scavengers are the best alternative to this problem of finite power. They are able to use
energy already available in the environment to power wireless nodes/sensors. The kind of power
they provide is clean, infinite and perpetually renewable. Ultra low power wireless sensors
abound today that would benefit from this kind of energy harvesting technology. Imaging being
able to power sensor nodes with energy harvested from the environment without unnecessarily
adding more power to the environment. This could be referred to as efficient energy eco-system,
where low energy dependent devices make use of ‘waste energy’ in the environment.
Several researches have been dedicated to the field of energy harvesting/scavenging in recent
times and many smart approaches have been proposed. This research work reviews some of
these great works; not only x-raying the different energy harvesting technologies there are but
also demonstrating a new on-demand idea that generates energy at the prompting of the operator.
It will also be suggested to be used in remote monitoring area where if someone or something
should step upon it, enough energy would be generated to trigger the monitoring system.

6
Chapter 2
Background/Related work - State of the Art
This section will be reviewing key advances and breakthroughs in the field of energy harvesting.
Many forms of energy harvesting technologies are reviewed from the works by other researchers
and scientists, from the earliest to the latest state of the art techniques. This chapter reviews
independent and hybrid energy harvesting techniques. It would later be shown in this thesis how
multiple energy harvesters could be combined to serve as perpetual autonomous electrical
voltage sources. Figure 1 shows the general structure of a wireless sensor node. In the center of
the structure is the processing unit which also houses the Maximum Power Point Tracking
(MPPT). The harvesting device is any of the energy harvesting transducers discussed while the
energy storage is either a super cap or a rechargeable battery. Figure 2 shows a similar
configuration for a self-powered system, highlighting optional components in red. The
importance of the difference highlighted goes to show that some systems may not require voltage
storage. The on-demand magnetic power generator presented later in this thesis will be one good
example of such system.
Figure 1: General structure of a wireless sensor node [4]

7
Figure 2: Schematic diagram of a generic self-powered device [24]
Solar Energy Harvesters
The most common form of energy harvesting in nature ever known to man was the solar energy
harvesting. Green plants are able to manufacture their foods in the presence of sunlight energy in
a process known as photosynthesis. Humans, on the other hand, have been able to harness solar
energy, radiant light and heat from the sun from the beginning of history. The technologies used
have evolved with time and we have only been limited by our own imagination. Solar radiation,
along with other secondary solar-powered resources such as wind and wave power,
hydroelectricity and biomass, account for most of the available renewable energy sources on
earth. However, only a fraction of the solar energy reaching the earth’s surface is used. Solar
energy harvesters rely mostly on heat engines and photovoltaic cells to generate electricity from
solar radiation.
Solar technologies are often classified as either passive or active depending on the way they
capture, convert and distribute solar energy. Photovoltaic cells and solar thermal collectors are
grouped under active solar technology while orienting a building to face the sun or using
selective materials with favorable thermal mass or light dispersing properties, and designing
spaces that naturally circulate air are grouped as passive solar technology.
Figure 3 below is an image showing the amount of solar energy reaching the earth’s surface and
how much is being reflected back and those used up. It was estimated that the earth receives 174
petawatts (PW) of incoming solar radiation at the upper atmosphere per year [20].

8
Figure 3: Solar energy reaching the earth’s surface.
It was also estimated that about 30% of this amount is reflected back to the space while the rest
is absorbed by the clouds, oceans and land masses. This is about 3,850,000 exajoules (EJ) per
year. The amount of solar energy dissipated on the earth in one day alone in 2005 was estimated
to be more than the amount of electrical energy consumed in one whole year. If the whole energy
is captured and converted, that would be more than our energy needs from other sources
including gas and hydrocarbons.
Solar cells take advantage of the photovoltaic effects to convert light energy into electrical
energy. These cells are mainly made of silicon doped with some impurities. When exposed to
light energy, the electrons in their structures break free from the silicon and flow through the
silicon surface to create direct current (DC) electricity. This process is referred to as the
photovoltaic effect.
Solar energy is one of the most abundant sources of energy for harvesting. The irradiance range
from 100µW/cm2 in brightly lit indoor environment to 100mW/ cm
2 in bright sunlight [4]. The
efficiency of solar energy harvesting is a measure of the ratio of the available solar energy to the
actual energy harvested.

9
Solar converters commonly used in calculators, with conventional single crystal and
polycrystalline structures, have efficiencies between 10 and 20 percent in direct sunlight [4].
Their efficiency, however, degrades rapidly with decrease in luminous intensity of the available
sunlight.
For ubiquitous energy harvesting solar panels, it is sometimes desirable to attach the harvesting
modules on non rigid surfaces. However, most existing solar panels are inflexible and difficult to
attach to non rigid surfaces. P. Peuman et al demonstrated an organic based semi-conductor solar
panel that solves this problem [14]. This type of solar cells operate with constant efficiency over
different brightness levels, the downside is the low overall efficiency level, usually around 1 to
1.5 percent. Another disadvantage of flexible organic solar cells is that they are reactive to water
and oxygen. Researchers have devised a means of overcoming this shortfall. One approach
followed is encapsulation against environmental degradation.
Recent advancements in photonic materials trade more area for less money or less area for better
efficiency [16]. Organic and copper indium gallium Selenide CIGS systems have demonstrated
flexibility and durability innate to their design with an at best efficiency range of 5 to 20 percent.
Figure 4 below shows an organic semi-conductor based small molecular solar cell.
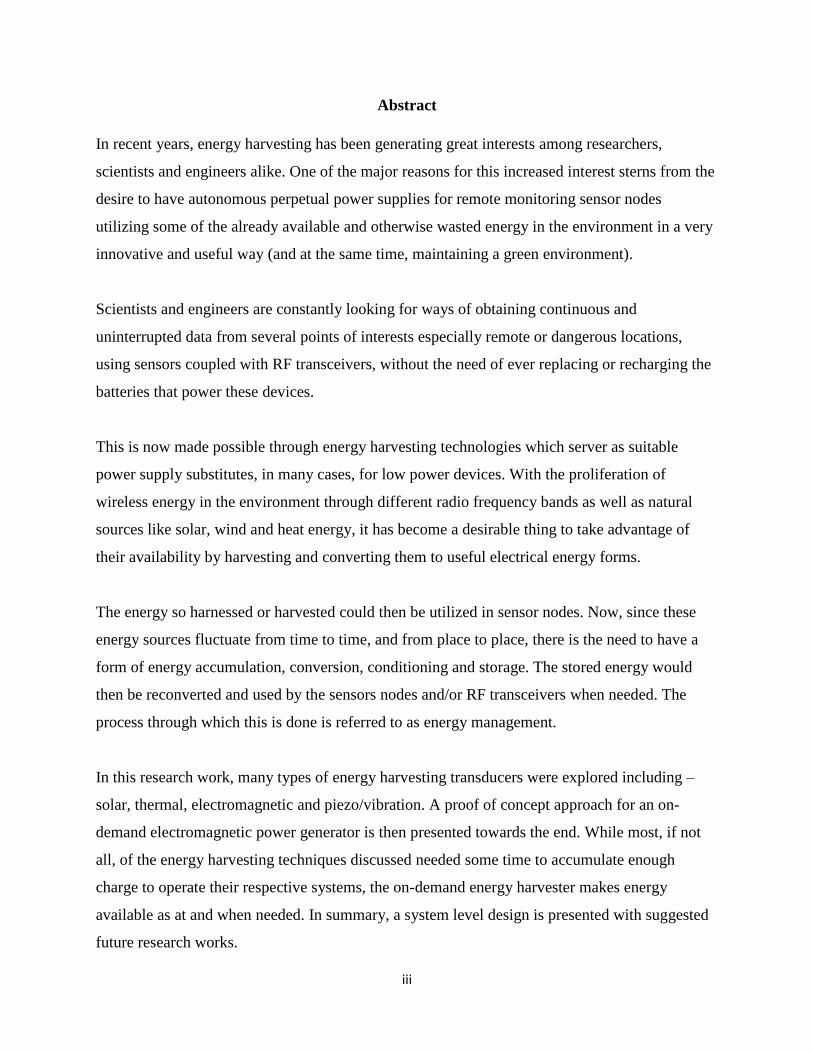
Vijay R. et al [7] demonstrated the contrast between the characteristics of the solar cells and that
of the battery. The V-I characteristics of the 4-4.0-100 solar panel (formed by a series/parallel
combination of solar cells) from Solar World Inc. is shown in Figure 5. The characterization was
performed on Nov. 28, 2004, with a panel that measured 3.75” x 2.5”.
Figure 4: An organic semiconductor-based small-molecule solar cell [4]
10
Figure 5: Measured V-I characteristics of the solar World 4-4.0-100 solar panel
Two parameters used to characterize solar panels in the paper report are the open circuit voltage
(Voc) and the short circuit current (Isc). These formed the x- and y- intercepts of the V-I curve,
respectively. The following three observations are derivable from the figure.
The first being that a solar panel behaves as a voltage limited current source (unlike the
battery which is a voltage source).
Secondly, there exists an optimal operating point at which the power extracted from the
panel is maximized.
Finally, while Voc maintains a constant value, the Isc varies directly with the amount of
incident solar radiation.
One important observation here is that it is difficult to power a target system directly from the
energy harvested from solar panels, since the supply voltage would depend on the time varying
load impedance [7]. For this reason, energy storage elements such as batteries or super capacitors
are used to store the energy harvested by the panel. This energy is then stored and used to
provide a stable voltage supply to the system on a need-to basis. This will further be discussed in
the power management section under maximum power point tracking (MPPT). Figure 6 below
shows a solar harvesting sensor node. It consists of an off-the-shelf sensor node and a custom
circuit board for solar harvesting.

11
Figure 6: A solar energy harvesting sensor node [7]
The paper demonstrated the feasibility of an almost perpetual harvesting aware, outdoor sensor
network.
Acoustic Energy Harvesters
Acoustic energy harvesters convert sound energy into electrical energy. The technology behind
this is the Helmholtz resonator which consists of an orifice, a cavity, and a piezoelectric
diaphragm.
When air is forced into a cavity, air pressure inside the cavity will increase in proportion to the
force of the outside air; however when the external force pushing the air into the cavity is
removed, the higher-pressure air inside will flow out. But this surge of air flowing out will tend
to over-compensate, due to the inertia of the air in the neck, and the cavity will be left at a
pressure slightly lower than the outside, causing air to be drawn back in. This process repeats,
creating acoustic energy whose magnitude changes decreasing each time until its effect is no
longer felt.
This acoustic energy so generated is then converted into mechanical energy when sound wave
incident on the orifice generates an oscillatory pressure in the cavity, which in turn causes the
vibration of the diaphragm. Piezoelectric transduction converts this acoustic energy into
electrical energy.

12
The forms of energy generated by acoustic harvesters are alternating current (AC) in nature [13]
which is then conditioned to supply direct current (DC) voltages to power a load. Acoustic power
generation have been proved to generate power conversion of the order of 70W/cm2 and
25W/cm2 using a pre-stressed stacked PZT ceramics operating at 16 KHz with an efficiency of
84% [13].
Acoustic converters take input signals with frequencies ranging from as low as less than 1 Hz to
10’s of KHz. The input signals could come from various sources including but not limited to
machines, humans or nature.
Figure 7 below shows an illustration of acoustic energy harvesting technology. The incident
wave/signal present at the plane wave tube input is converted by the energy harvester circled in
red below which is conditioned by the energy harvesting circuitry otherwise known as power
management circuit before it is used to charge a super-cap or battery where the energy is stored
until it is needed. This harvester normally requires some time to accumulate enough useful
energy to operate a electronic system.
A major competing technology to piezoelectric harvesting technology is the solar cell [12]
discussed in the section above. Now, for piezoelectric generators to remain viable in the solar
harvesting technology world, they must have a large acoustic power density in the structure such
that the generated power exceeds that of the photovoltaic’s; operate in an enclosed region such as
buildings, tunnels or automobiles and moving structures such as a rotating system.
Figure 7: Schematic of overall acoustic energy harvesting concept [12]

13
Thermal Energy Harvesters
Thermal harvesters, also known as thermoelectric generators, take advantage of the
thermoelectric effect in materials as the underlying principle to generate electricity.
At the core of the thermoelectric effect is the fact that there is a heat flow which arises due to a
temperature gradient in conducting materials; this phenomenon gives rise to a process known as
diffusion of charge carriers [12]. The resulting flow of charge carriers between two dissimilar
temperature regions brings about a voltage difference.
Based on this technology, a German based company, Micropelt, fabricated an efficient
thermoelectric energy harvesting device with up to 50 thermocouples per mm2. As a result the
voltage per mm2 is 200 to 400 times higher than that of legacy thermoelectric generators (TEGs),
giving an ideal starting point for efficient conversion to useful battery-like operating voltages
[11]. Micropelt developed a built-in chip thermo-generator which takes a few degrees of
temperature differential and harvests thermal energy to operate a wireless sensor node, enabling
unlimited battery-free operation.
Mechanical/Piezoelectric Energy Harvesters
Piezoelectricity is the form of electrical energy that is generated when a mechanical stress is
applied to a piezoelectric material. Alireza K et al [8] postulate different piezoelectric generators
based on diverse applications. They showed that harvesting power from human body motion for
implantable and wearable electronics have been studied. Drawing from the understanding that
human motion is capable of large-amplitudes and low frequencies, and that smaller objects
possess higher resonant frequency, they argued that it will be difficult if not impossible, with
known technologies, to design a miniature resonant energy scavenger that works on humans. “As
a result, for most piezoelectric generators in human applications, the piezoelectric patch is
coupled either through direct straining or by impacting the kinetic driving source.” [8]
The form of electrical energy generated by piezoelectric generators is AC in nature and would
normally require some form of AC to DC conversion. Figure 8 below shows a full wave bridge
rectifier coupled with a piezoelectric harvester. This voltage is then used to charge a storage
element and/or battery which would later be used to operate an electronic system. Much like the

14
previous harvesters, the piezoelectric harvester requires some time to accumulate enough useful
energy. Moreover, they work best when operating at resonance.
Figure 8: Standard AC-DC harvesting circuit with piezoelectric generator
Radio Frequency (RF) Energy Harvesters
Energy from radio frequency waves can be harvested using RF harvesters. These energy sources
are normally from high electromagnetic fields such as TV signals, Wireless Radio networks and
cell phone towers.
When an electromagnetic wave is intercepted by an electrical conductor, there is an induced
electrical energy. This induced energy is normally very weak in the order of microwatts or less
and would normally require amplification of the received signal for normal radio
communication. Now, because energy scavenged by RF harvesters is usually very weak, voltage
amplification is needed to boost the received signals. Figure 9 below shows the types of voltage
doubler circuits used to improve the harvested DC voltage.

15
Figure 9: Voltage doubler circuit diagram
RF harvesters make use of RF antennas to receive these emitted signals and then convert them to
dc voltage which is then stored in capacitors or other forms of energy storage devices. Figure 10
below shows a generic block diagram of an RF harvesting system. This type of harvester has
great advantage over solar, acoustic and mechanical vibration harvesters. This is because RF
energy is constantly available and therefore more reliable than these other sources, however, the
amount available for harvesting are not as much. Table 1 below shows a comparison of energy
available from different sources. It is possible to eliminate battery needs from sensor nodes that
require ultra low battery power and replace them with energy harvested from RF sources.

16
Table 1: Energy availability from different sources
Energy Source Harvested Power Energy Source Harvested Power
Vibration/Motion
Human 4 μW/cm2
Industry 100 μW/cm2
Temperature Difference
Human 25 μW/cm2
Industry 1–10 mW/cm2
Light
Indoor 10 μW/cm2
Outdoor 10 mW/cm2
RF
GSM 0.1 μW/cm2
WiFi 0.001 mW/cm2
Figure 10: Generic block diagram of an RF harvesting system
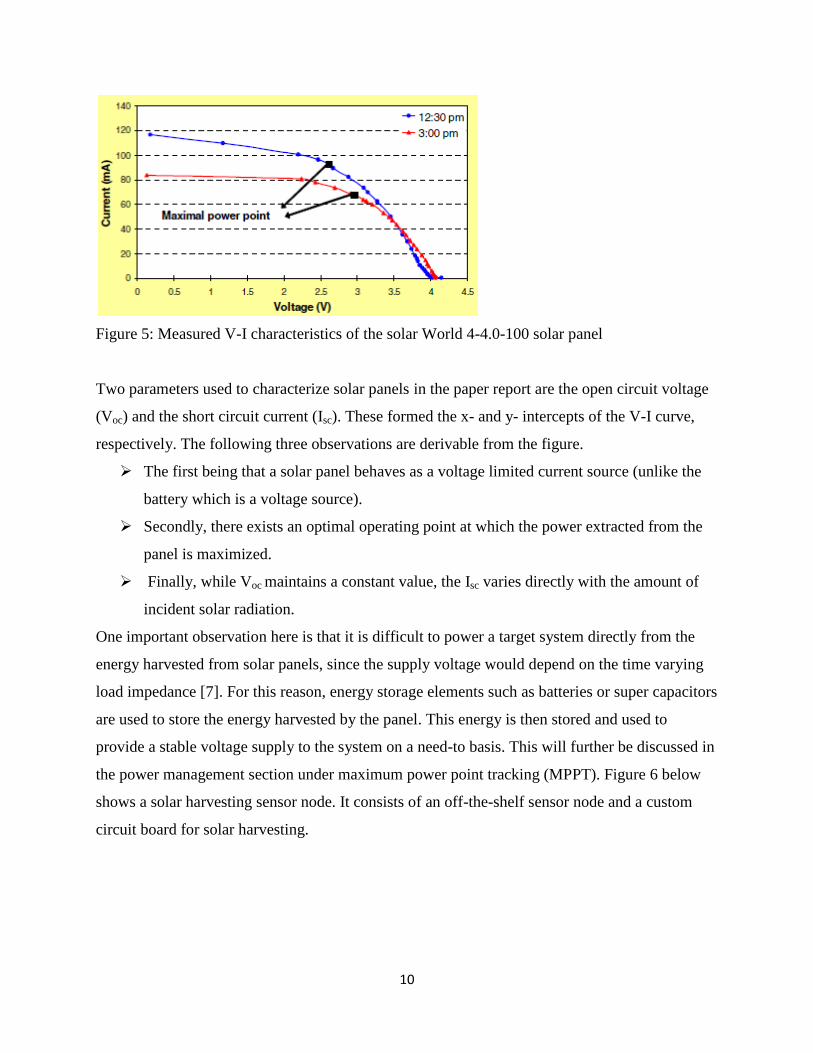
Yunhan H et al [9] discussed a capacitive radio frequency micro-electromechanical switch (RF
MEMS) which is a co-planar waveguide (CPW) shunt switch. See figure 11 below. They
demonstrated that the switch operates as a digitally tunable capacitor with two states. “When the
membrane is in the up position (switch-off), the signal line sees a small value of parasitic
17
capacitance, while when the membrane is pulled down by actuated voltage (switch-on), the
signal line sees a high value capacitor shunted to ground” [9].
Figure 11: Schematic diagram showing the operation of an RF MEMS switch.
Alanson Sample and Joshua R. Smith of Intel in their paper titled ‘Experimental Results with
two wireless power transfer systems’ demonstrated an RF harvester based on the principle of the
crystal radio receiver. Their Scavenger was able to harvest and convert energy from a TV station
over 4Km away up to 0.7V, which was then used to power a wall mounted house-hold weather
station [36].
Researchers from Georgia Tech School of Electrical and Computer Engineering demonstrated a
unique system of RF harvesting with an antenna printed by ordinary inkjet using nano-particle
ink as shown in figure 12 below. The substrate is either paper or a flexible polymer. The ink is
described as ‘a unique in-house recipe’ containing silver nano-particles and/or other nano-
particles in an emulsion [10]. This team’s harvesting device was able to scavenge energy over a
wide range of frequency band spanning all known useful radio frequency bands from as low as
100MHz up to and including 60GHz.

18
Figure 12: RFID-enabled wireless sensor transmitter using inkjet-printing on paper
In their work, they were able to make the system more environmentally friendly and they also
demonstrated an effort towards reducing the carbon foot print by eliminating the need for
batteries and replacing it with power scavenging techniques from the environment.
Hybrid Solar-Heat harvesters
Hybrid solar harvesting is a combination of more than one underlying technology to harvest
energy from the sun. Stanford and MIT each independently recently demonstrated a hybrid solar
harvesting technology. The technology involves using a new photovoltaic energy conversion
system that can be powered by heat, the sun’s rays, a hydrocarbon fuel, or a decaying
radioisotope.
Stanford’s version was able to produce 60 percent efficiency which is 3 times the harvesting
efficiency of existing models while MIT’s model was able to run 3 times longer than a lithium-
ion battery of the same weight.

19
MIT reveals that the science behind this technology was not necessarily new; however, a new
and more efficient method was introduced [5]. This breakthrough was enabled by a material with
billions of nano-scale pits etched on its surface. Heat absorbed by this pitted surface enables the
surface to radiate energy at precisely chosen wavelengths depending on the size of the pits.
Stanford’s research on the other hand, however, reasoned that existing solar panels degrade in
efficiency with increase in heat [6]. Their research then was focused on combining both light and
heat energy to increase efficiency. To actualize this they coated semi-conducting materials with
cesium which allows the semi-conducting materials to convert both light and heat into electrical
energy.
Figure 13: Silicon chip micro-reactors
Figure 13 above shows a variety of silicon chip micro-reactors developed by the MIT team. Each
of these contains photonic crystals on both flat faces, with external tubes for injecting fuel and
air and ejecting waste products. Inside the chip, the fuel and air react to heat up the photonic
crystals. In use, these reactors would have a photovoltaic cell mounted against each face, with a
tiny gap between, to convert the emitted wavelengths of light to electricity [5]. This type of
hybrid harvesting ensures a more steady power source by combining more than one source of
energy harvesting method.

20
Chapter 3
History of Energy Harvesting
Some say that progress is a relative term and this will be true in the field of science and
technology. In the past, technological progress was focused on building faster and bigger and
more power consuming gadgets but in recent times, there has been a paradigm shift of some sort
to what is now referred to as ‘smarter technologies’. These smarter technologies use power
consumption in the order of micro watts (µW) or less which have inspired interest in the field of
energy harvesting or scavenging. This section will not present an exhaustive history of all energy
harvesting technologies there are, but attempts to present a broad section of some sort.
Energy harvesting dates back to the time of windmill, water mills, waterwheel and passive solar
systems used from ancient times. Nowadays, energy harvesting technologies range from wider
variety of sources and researchers are finding ingenious and innovative applications for them.
A. Solar:
Solar energy is the most abundant natural form of renewable energy on earth. It is widely
believed that all forms of life on earth drive one form of energy or the other from the
sun’s energy. The first recorded man-made invention that used solar based technology in
history was in 200BC. Archimedes, the Greek Scientist, applied the reflective properties
of bronze shields to focus sunlight and set fire to Rome’s wooden ships, which was
besieging Syracuse [29]. Through history, many scientists have performed various
research works on solar energy.
B. Thermal:
Thomas Johann Seebeck, in 1821, discovered that a temperature gradient between two
dissimilar conductors produces a voltage. This is what is later known as the Seebeck
effect. The science behind this discovery is the fact that temperature gradient in
conducting materials results in heat flow which results in diffusion of charge carriers
[12]. This flow of charge carriers between hot and cold regions produces a voltage
difference.
21
In 1834, Jean Charles Athanase Peltier discovered the reverse Seebeck effect, named
after the discoverer, Peltier effect. He demonstrated that applying electric current through
dissimilar conductors, depending on the current direction, could create a heating or
cooling effect. This effect is directly proportional to the amount of current flowing
through.
20 years later, in 1854, a British physicist, William Thompson observed that when a
homogenous material of different temperatures along its length is subjected to electric
current that it emits or absorbs heat.
These are the underlying principles of thermoelectric generators – TEGs. Ideal
thermoelectric materials have a high Seebeck coefficient, high Electrical conductivity and
low thermal conductivity. Low thermal conductivity is necessary to maintain high
thermal gradient which ensures charge flow and hence voltage generation.
It is also possible to combine multiple TEGs to improve harvested power. Connecting the
voltages in series and the temperature gradients in parallel will ensure greater harvested
energy.
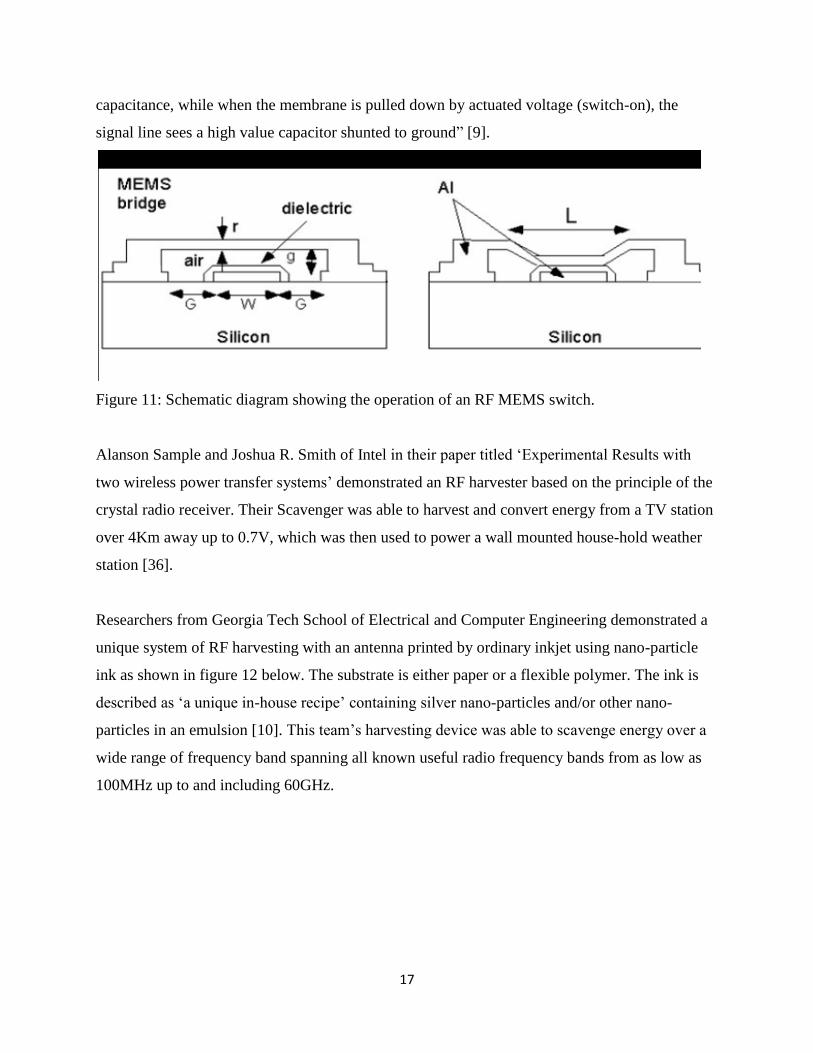
C. Acoustic:
The origin of the acoustic energy harvesting dates back to the 1850s when a German
Physicist and inventor, Hermann Von Helmholtz, invented the “Helmholtz resonator”
which he used to identify the various frequencies or musical pitches present in music or
other complex sounds. Figure 14 below shows the original design of the Helmholtz
resonator.
Figure 14: Original design of the Helmholtz resonator

22
D. Radio Frequency:
Wireless communication devices including Radio, Television and mobile phones make
use of Radio frequencies (RF) in communicating from one point to the other. These RF
signals contain electromagnetic energy in them. RF harvesters convert this
electromagnetic energy into useful direct current (DC) voltages.
The history of RF energy harvesting goes as far back as over 100 years ago when crystal
radio receivers were used to drive high impedance headphones. But these days, energy
harvested using RF harvesting technologies do more than just drive high impedance
headphones. They can be harnessed to drive ultra-low power sensor nodes.
In 1974, micro-electromechanical switches (MEMS) were used to switch low frequency
electrical signals [9]. Since then, switch designs have utilized cantilever, rotary and
membrane topologies to achieve good performance at RF and microwave frequencies.
This finds easy application because they have low loss, low power consumption and lack
inter-modulation distortion. RF MEMS based switches are an attractive alternative to
traditional field effect transistors (FET) or P-I-N diode switches in applications where
microseconds switching speed is sufficient. Capacitive membrane switches have shown
excellent performance through 40 GHz and for lifetimes in excess of 1 billion cycles,
which makes them attractive as harvesters.
E. Vibration/Piezo:
In 1880 Jacques and Pierre Curie discovered piezoelectricity while studying how
electricity could be generated when pressure is applied to a crystal. The materials with
piezoelectric properties studied include quartz and tourmaline. It gathered great interest
after its first notable application during the First World War where it was used as sonar in
submarines.
Ceramic materials dominate the piezoelectric industry these days, though polymeric and
single crystal based piezoelectric generator exist and find application in many
commercial products [18].

23
Ferroelectric ceramics came to limelight in 1940 with the discovery of the phenomenon
of Ferro-electricity as a source of the unusually high dielectric constant in ceramic
barium titanate capacitor [19]. Since then several technologies have come as an offshoot
of this discovery including high-dielectric constant capacitors to later developments in
piezoelectric transducers, positive temperature coefficient devices, and electro-optic light
valves. They also find application in medical ultrasonic composites, high displacement
piezoelectric actuators and thick/thin films.
Legislations for the reduction of the industrial use of lead-containing materials due to
environmental consciousness have led researchers to discover other new non-lead based
piezoelectric materials. Leaders in this effort are Japanese researchers whose impressive
research effort have uncovered new lead-free compositions that could one day potentially
be used as replacements in many applications [18].

24
Chapter 4
System Perspective of Energy Harvesting Technologies
Energy harvesting technologies are used to harness energy from ambient sources which are in
turn converted into electrical energy that are stored in storage devices in wireless sensor nodes.
This frequently refers to small autonomous micro energy harvesting devices ideal for substituting
batteries that are impractical, costly or dangerous to replace.
Integrated harvesting solutions have been demonstrated by a number of systems prototypes [16].
The authors have demonstrated system designs based on energy harvesters that take advantage of
solar, heat, vibration, and RF sources. Conventional batteries have not been able to keep pace
with the increasing demands placed on them by new technologies that depend on high efficiency
ultra low power supplies, while key advancement in low power electronics is making energy
harvesting technology an even more attractive alternative.
Applications of energy harvesting technology
There are many possible applications for energy harvesting technology which include but not
limited to the following:
Agricultural management
Structural monitoring
Home automation
Implantable sensors
Equipment monitoring
Remote patient monitoring
Efficient office energy control
Surveillance and security
Long range asset tracking
On-demand electronic systems
Types of energy harvesters studied
Solar harvesters: These take advantage of the photovoltaic effect to convert incident light
energy into electrical energy. They are mostly made of silicon with some impurities. In the

25
presence of light energy, electrons break free from the silicon in the presence of impurities.
These electrons then flow through the silicon surface and create DC voltage which are
stored/conditioned and later used to operate sensor nodes or target electronic devices.
Thermostatic harvesters: When a temperature gradient exists across a thermostatic device,
electrical energy is generated. This energy can then be used to charge up a storage device for use
when needed. The absence of moving parts in thermostatic devices means long lasting operation
for this type of harvesters.
Electromagnetic harvesters: This type of energy harvester makes use of the principle of
electromagnetic induction. Change in magnetic flux results in electromagnetic induction in the
linking conductors. Induced voltage is proportional to number of turns of the linking conductor
and inversely proportional to the time rate of change of the associated magnetic flux. The
induced voltage is alternating in nature and needs conversion for use in DC circuits.
Piezoelectric generators: This type converts pressure into electrical energy. A key factor with
this type of generator as gathered from the materials studied is that they have to be operated at
resonance to be able to maximize their efficiency. Low level, low frequency vibrations in the
surrounding environments and at or close to the resonant frequency of the piezo electric crystals
can cause electrical energies to be generated by the crystals. Again the voltage generated is
alternating in nature and needs some form of voltage conversion for DC circuit applications.
RF harvesters: RF harvesters convert radio frequency energy into useful voltage for use in low
power devices. One of the most available sources of energy studied but with the lowest
harvestable power. Voltage up-conversion is always required [36].
Power management
A system perspective involves a holistic view in which the designer utilizes one or more of the
energy harvesting techniques studied in a system design to achieve a set goal, which in most
cases would be sending and receiving intended information. To combine multiple energy-
harvesting technologies into one will require some kind of smart power management technique.

26
A simple approach involves the use of diodes to combine all available scavengers into a
maximum power point tracking (MPPT) circuit. Due to the fact that the output of many energy
harvesters are alternating in nature, a full wave rectification is employed to ensure that the final
output voltage is a DC voltage. Figure 15a below shows the full wave rectifier used in power
management circuits.
Figure 15a: Full wave rectifier circuit
Figure 15b Figure 15c
Figures 15b and 15c show the operation of the full wave rectifier during the positive and
negative half-cycles respectively. This configuration ensures that the output polarities are
maintained with respected to the load no matter the polarities of the input source(s).

27
The most challenging aspect of combining more than one source of energy harvesting
technology to power a sensor node lies with energy/power management which for most part
depends mainly on the specific application and the hardware used as well as the energy source’s
characteristics.
Many researchers have devoted their time and resources to finding efficient power management
schemes that address this challenge. The main approaches pursued included reducing power
consumption and improved energy sources.
The first approach takes advantage of the modern breakthroughs in semi-conductor and CMOS
technologies that consume less power and effective power management software. Hence a
dramatic reduction in the power consumption of electronic circuits which is as a result of
advancements in the fabrication techniques of VLSI and the reduction of a transistor’s dynamic
power consumption. Pervasive systems are therefore taking advantage of this intelligent power
management scheme to deliver greater capabilities on a fixed power budget or similar
capabilities on an even smaller power budget [15].
J. Rabaey et al [22] in their paper “energy harvesting a system perspective” stated that ‘at least
one of the power management circuitry (in a power management circuit) must run continuously’
bringing up the other loads in the system only on a need-to basis. This is because the efficiency
of the power processing and conversion at ultra-low power levels is of utmost importance. Using
an integrated circuit customized for this purpose will reduce standby power loss.
There is an apparent challenge when one attempts to combine several energy
harvesting/scavenging technologies into a common charging and energy storage circuit. This has
to be very effective and energy efficient. Ideally, no energy should be wasted at this stage; all
available energy should be effectively converted and used to charge up the storage element – a
super capacitor or a battery. Now, we know that in practical implementation, there exists a
deviation from ideal conditions. Here, a review of some available technologies is presented.

28
DC to DC conversion
Here two approaches to DC-DC conversions are discussed; these are the boost converter and the
charge pump converter [30]. These are shown respectively in Figures 16 and 17 below each
having unique advantages and disadvantages. To maximize the amount of power that could be
extracted from an energy harvesting source, it is recommended to have a flexible conversion
factor. A conversion factor is the ratio between the input and output voltages.
The Boost converters deliver a power range that goes from microwatts to megawatts and are
often used to deliver power to the load. They have intrinsic high efficiency coupled with flexible
conversion factor. Of the two DC-DC converters discussed, the boost converter is the one mostly
used in power management circuits (PMC).
Figure 16: Boost converter
Charge pump converter on the other hand, is used in very low power application where relatively
low conversion efficiency has little or no performance implication. Due to the losses inherent in
this type of design, they are not used in PMC just yet.
Figure 17: Charge pump converter

29
Maximum-power-point-tracking (MPPT)
Figure 18 below shows the complete schematic circuit diagram of an MPPT charger. This type of
charger is used in small energy harvesting power systems and they overcome the inherent
problems with conventional battery chargers.
Figure 18: Maximum power point tracker circuit diagram [26]
Ambient energy sources have complex and unpredictable behaviours, due to the time-varying
nature of the environments, which gives rise to non-linear output efficiency referred to as the I-V
curve. The best way to manage power efficiently and to avoid power wastage is to ensure
impedance matching of the voltage source and the load circuit – this technique is referred to as
maximum power transfer. In energy harvesting power management scheme, an MPPT system is
used as an excellent technique to do just that. They achieve this by sampling the output of the
energy harvester and applying an equivalent load to transfer maximum power for any given
environmental condition. The MPPT defines what power the load circuit, in this case sensor node
or RF transceivers, draws from the energy scavenger in order to get maximum power transferred.
They must do this with the least possible power overhead since the energy harvested is already
very small. Lu Chao et al [1] presented a batteryless vibration-based energy harvester. They were
able to achieve an efficiency of higher than 90% with the MPPT scheme presented with a power
utilization efficiency of the overall platform on the order of greater than 50%.

30
Classification of MPPT
There are three main classifications of the of the MPPT algorithm: perturb-and-observe,
incremental conductance and constant voltage [25]. The first two methods are often referred to as
hill climbing methods, because they depend on the fact that on the left side of the MPPT, the
curve is rising (dP/dV > 0) while on the right side of the MPPT the curve is falling (dP/dV < 0).
Perturb-and-observe (P&O) method
o This is the most common method of the three. The algorithm perturbs the voltage
in any given direction and samples dP/dV. If the result is positive, it continues the
perturbation until a negative reading is received.
o Advantage
Their advantage is that they are easy to implement
o Disadvantage
Sometimes they cause oscillation of the MPPT.
They have slow response time
They could track in the wrong direction under rapidly changing
atmospheric conditions.
Incremental conductance (INC) method
o When used in conjunction with the photovoltaic cells, it used the PV array’s
incremental conductance dI/dV to determine the sign of dP/dV.
o Advantage
It tracks the changing luminescence more accurately than the perturb-and-
observe approach
o Disadvantage
It can cause oscillation at the MPPT
Slows sampling frequency due to increased complexity
Could be misled by rapidly changing atmospheric condition.
Constant voltage (CV) method
o Based on the fact that the ratio of the maximum power point voltage is fairly
constant with respect to the open circuit voltage.
o Advantage
Simple to implement and usually less expensive than the preceding two.

31
o Disadvantage
Lower efficiency compared to P&O and INC
Strategy for efficient power management
To efficiently manage the power scavenged from the environment in order to avoid wastages,
three approaches are always followed; sensor nodes or radio transceivers are designed to operate
in any of these 3 modes: Active, listen and passive/sleep modes.
Active mode: The transceiver can both transmit and receive data simultaneously.
Listen mode: The transmitter is turned off while the receiver is turned on.
Sleep mode: Both transmitter and receiver are turned off and turned on at predetermined
intervals.
This management is performed by high efficient, high performance power management chips.
The advantage is prolonged power availability for use by the transceivers and/or sensor nodes.
Any energy harvesting application should exhibit some or all of the following characteristics:
They must exhibit lowest amount of leakage currents in order to maximize the harvested
energy
They must operate with ultra low to low voltage range
Analog capacity for sensor interfacing and measurements
Ability to operate with lowest standby current to maximize storage of energy
They must consume the lowest possible power when active
They must possess the ability to turn on and off instantaneously
Efficient operation with lowest duty cycle of active versus Standby modes

32
Chapter 5
Experimental proof of concept
This chapter is intended to demonstrate two on-demand energy harvesting proofs of concept. The
first is the experiment conducted with piezoelectric devices and the second is the design of an
on-demand magnetic power generator RF-based remote control system. At the end results are
presented and the advantage of one over the other is presented.
Piezoelectric Harvester attempt and MPG design
The design intent for both the piezoelectric and magnetic power generators was to make use of
the simple push-action of operating a remote control button to generate enough energy to power
the remote control electronics. While any of the preceding energy harvesting technologies could
easily be used in conjunction with appropriate electronic components to fulfill any specific task,
the goal here was to have an on-demand energy harvesting product. The term on-demand,
presuppose that the scavenging unit would respond almost instantaneously to the energy demand
of the operator. This obviates the preceding sections about energy accumulation and storage;
however, energy conditioning is still an indispensible requirement.
The research carried out here is on the possibility of using piezoelectric devices to produce
power that is high enough to operate an everyday house-hold remote control. This type of energy
harvester utilizes pressure to generate electricity.
Simulation of piezoelectric generator using COMSOL 3.5a
The approach in this section is design and simulation. For this section, four of the common
piezoelectric materials out there were studied to determine their electrical behavior under force
or pressure. Here are the 4 different piezo electric materials studied:
1. PZT-4
2. Aluminum Nitride
3. Rochelle Salt
4. Barium Sodium Niobate
This study demonstrates the Force-deflection and Force-Potential energy generations of the
above four piezoelectric materials. At the end, comparison and contrast is drawn. The piezo-

33
electric materials have the same physical dimensions to begin with and all have the same
boundary conditions. The only difference is their individual piezo electric characteristics.
Table 4 (shows the individual material characteristics of each of the above piezo electric
materials)
The tables below show a summary of strength and variability of the human finger when gripping
an object [31]. Data from these tables were factored in during the simulation to determine the
range of force to input in the COMSOL simulator as the required load boundary condition to
obtain a realistic view of an everyday use of the house hold remote controller.
Table 2: Summary of strength and variability in each of the finger couplings and for simple grip
across the 100 subjects [31]
Table 3: Table 3: Summary of strength and variability in each of the finger couplings and for
simple grip classified by gender [31]

34
Boundary conditions
The shape and size of the piezoelectric materials used in this simulation was 2.75 inches by 1.25
inches by 0.07 inches, this was based on the size of a commercially available prototype.
Mechanical boundary conditions for both ends ‘A’ and ‘B’ are fixed while all other ends have
floating boundary conditions. See figure 19 below.
In the same way, the top side of the material has a floating electrical boundary condition, while
the bottom side has a ground potential. All other electrical boundary conditions are floating.
Figure 19: Piezoelectric material showing the fixed ends
Figure 20: COMSOL view of piezoelectric material just before simulation
2.75”
1.25”
0.07”

35
Study using PZT-4
Figure 21a: Force-Displacement plot of the PZT-4
Figure 21b: Line plot of the PZT-4
Figure 21c: Force-Potential plot of the PZT-4
Figure 21a is the COMSOL image
of the PZT-4 showing Force-
Displacement simulation result. The
highest deflection occurred in the
middle of the piezo device to a
depth of 1.093e-3m. The ends of the
device show no deflection. This is
expected since both ends have fixed
mechanical boundary conditions.
Line plot of the PZT-4 showing
Force-Displacement simulation
result is shown in figure 21b. The
highest deflection of about 1.1e-3m
occurred at a force of 10e5 N/m.
The ends of the device show zero
deflections as expected.
The image of figure 21c shows the force
versus potential plot of the PZT-4. Note
that the unit of the potential is volts-
meter squared.
This unit stresses that the output voltage
is an integral of electric potential over
the size of the piezoelectric material
used. Different sizes would yield
corresponding integrals.
From this plot, the voltage ranges from 0
volts-m2 to -2.06 volts-m
2 for a force
range of 0 Newton to 10e5 Newton
Length (meters)
Force (N/m)
Inte
gra
l o
f V
(V
.m2)
To
tal
dis
pla
cem
ent
(m)

36
Study using Aluminum Nitride
Figure 22a: Force-displacement of the Aluminum Nitride
Figure 22b: Line plot of the Aluminum Nitride
Figure 22c: Force-Potential plot of the Aluminum Nitride Force (N/m)
Length (meters)
Figure 22c shows the force versus
potential plot for the aluminum nitride
piezoelectric material.
From this plot, the voltage ranges from
0 volts-m2 to -1.5 volts-m
2 for a force
range of 0 Newton to 10e5 Newton
Figure 22b is the line plot of the
Aluminum Nitride showing force-
Deflection simulation result; the
highest deflection of about 3.6e-4m
occurred at a force of 10e5 N/m.
The ends of the device show zero
deflections as expected.
The aluminum Nitride piezoelectric
material showing Force-Deflection
simulation result is shown on figure
22a; the highest deflection occurred
in the middle of the piezo device to
a depth of 3.571e-4m. The ends of
the device show no deflection. This
is expected since both ends have
fixed mechanical boundary
conditions.
Inte
gra
l o
f V
(V
.m2)
To
tal
dis
pla
cem
ent
(m)
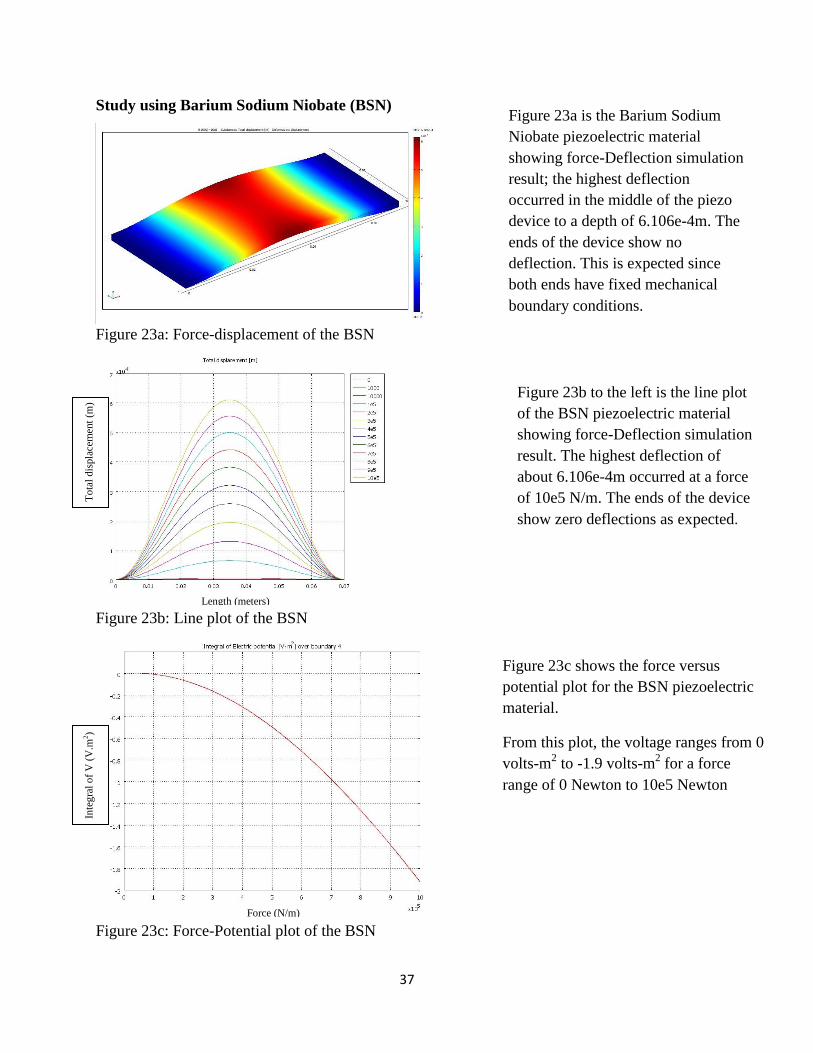
37
Study using Barium Sodium Niobate (BSN)
Figure 23a: Force-displacement of the BSN
Figure 23b: Line plot of the BSN
Figure 23c: Force-Potential plot of the BSN
Length (meters)
Force (N/m)
Figure 23c shows the force versus
potential plot for the BSN piezoelectric
material.
From this plot, the voltage ranges from 0
volts-m2 to -1.9 volts-m
2 for a force
range of 0 Newton to 10e5 Newton
Figure 23b to the left is the line plot
of the BSN piezoelectric material
showing force-Deflection simulation
result. The highest deflection of
about 6.106e-4m occurred at a force
of 10e5 N/m. The ends of the device
show zero deflections as expected.
Figure 23a is the Barium Sodium
Niobate piezoelectric material
showing force-Deflection simulation
result; the highest deflection
occurred in the middle of the piezo
device to a depth of 6.106e-4m. The
ends of the device show no
deflection. This is expected since
both ends have fixed mechanical
boundary conditions.
Inte
gra
l o
f V
(V
.m2)
To
tal
dis
pla
cem
ent
(m)

38
Study using Rochelle salt
Figure 24a: Force-displacement of the Rochelle salt
Figure 24b: Line plot of the Rochelle salt
Figure 24c: Force-Potential plot of the Rochelle salt
Length (meters)
Force (N/m)
Figure 24c shows the force versus
potential plot for the Rochelle salt
piezoelectric material.
From this plot, the voltage ranges from 0
volts-m2 to +3.25e-3 volts-m
2 for a force
range of 0 Newton to 10e5 Newton
Figure 24b to the left is the line plot
of the Rochelle salt piezoelectric
material showing force-Deflection
simulation result. The highest
deflection of about 2.7e-3m
occurred at a force of 10e5 N/m.
The ends of the device show zero
deflections as expected.
Rochelle salt piezoelectric material
showing force-Deflection simulation
result is shown in figure 24a; the
highest deflection occurred in the
middle of the piezo device to a
depth of 2.692e-3m. The ends of the
device show no deflection. This is
expected since both ends have fixed
mechanical boundary conditions.
Inte
gra
l o
f V
(V
.m2)
To
tal
dis
pla
cem
ent
(m)

39
Table 4: Table 4: Result comparison after simulation
Piezo Material Max displacement (m) Electric potential (v) Length (m) Max. Force (N/m)
PZT-4 1.1e-3 -2.06 0.07 10e5
Al3N 3.6e-4 -1.5 0.07 10e5
BSN 6.09e-4 -1.9 0.07 10e5
Rochelle salt 2.7e-3 0.00325 0.07 10e5
The table above shows some interesting results from the simulation conducted. For the same
length and applied force as well as similar boundary conditions:
The absolute value of the electric potential of the PZT-4 was the highest
The absolute value of the electric potential of the Rochelle salt was the least
The amount of displacement was highest with the Rochelle salt
The amount of displacement was least with the Aluminum nitrate
From the foregoing, the choice of material in designing a piezoelectric based energy harvester
will be down to the amount of force, the deflection anticipated or allowed in the design and the
amount of voltage requirement. The table above offers a quick guide to making such choice.
System design
Figure 25: Block diagram of the battery-less remote controller
Piezoelectric Harvester
Piezoelectric materials generate electricity when pressure is applied to them. Using COMSOL, a
finite element modelling software, the behaviour of different piezoelectric materials under
specific pressure and boundary conditions were determined. In the preceding section, the amount
of deflection and electric potential generated were demonstrated. The experiment conducted for
Piezo
harvester
Bridge
rectifier
Energy harvesting
module
Remote controller
Transmitter
Remote controller
Receiver Remote controlled
gadget

40
this proof of concept was done with a PZT based piezoelectric material. The choice of which was
informed by the result obtained in the simulation.
Bridge rectifier
The voltage generated by the piezo electric material is alternating in nature. This means that the
polarity could either be positive or negative depending on the material or direction of force.
Now, most electronic circuits require a direct current (DC) voltage for operation. To do this, a
bridge rectifier was used to convert the generated AC voltage into DC voltage. The bridge
rectifier contains 4 diodes in the full wave rectification configuration. Any voltage applied to the
input pins is converted to DC voltage at the output not minding the input polarity. For this
design, particular attention was paid on the choice of diode used. Every diode presents some
forward bias diode voltage drop. Silicon diodes typically have a forward voltage drop of between
0.6 and 0.7Volts while Germanium diodes present a typical drop between 0.25 and 0.3Volts.
Giving that the piezoelectric material used generates minute amounts of energy per applied force
per time, a choice of Schottky diode was made. This diode has a characteristic forward bias
voltage drop of about 0.15 to 0.2Volts. The choice was to ensure that the most voltage is passed
on to the load or a storage element/capacitor for later use.
Energy harvesting module
This module is used for voltage conditioning and storage. For the purpose of this design,
electrolytic capacitors were used as storage elements. The choice comes from the fact that most
remote controls are only operated on a need-to-use basis and enough energy was expected to be
generated to operate the specific function at each time a remote button was operated, any unused
portion of the generated energy was then stored for future use. To ensure power conservation, the
load (remote control electronics) was isolated from the storage elements and was only connected
when a push button switch is operated. This configuration also allows, whenever desired, for the
energy generation/harvesting operation to be performed - pumping up the storage element in
advance without discharging any of those energies through the load during that operation.

41
Remote control Transmitter/Receiver
For these proofs of concepts, both piezoelectric-based and MPG-based, the RF solutions’ QAM-
TX1-433 and QAM-RX2-433 from Digikey were used as the transmitter and receiver
respectively. The intent was to avoid the line-of-sight constraint always posed by the infra-red-
based transceivers. Please, see MPG section below for pictures and diagrams of both modules.
Remote controlled electronics
Here a simple 555 timer circuit configured as a monostable multivibrator was used to drive an
LED to indicate a signal has been received from the transmitter. This could be used to drive any
other circuit if required, like operate a garage door for instance or toggle a light bulb on and off.
The uses are entirely up to the designer’s needs.
Lessons Learned – Deviation from Ideal Conditions
The results obtained from the simulation were very encouraging and promising but the design
implementation was far from the ideal conditions. In real life, the load circuits have finite
impedances and are required to respond almost instantaneously to the operator’s demand. The
first lesson learned was that the piezoelectric devices have almost infinite DC output impedance
making maximum power transfer very difficult without additional complex circuitry which in
turn adds to power loss. The equivalents circuit in figure 26 below shows a complex impedance
component which can only be eliminated if the device is operated at resonance. Now, since the
concept is intended to be used as an on-demand micro electric power generator, this current
configuration of the piezoelectric harvester could not satisfy the requirement.
Figure 26: Equivalent circuit of the piezoelectric material
The second lesson learned was that, for all practical intents and purposes, the power generated
are ultra low in the order of nano to micro watts (a measured valued of 22µW was obtained at
one point), a maximum current rating for a load of 100kilo ohms was at one point determined to
R L
C
C

42
be 14.8µA. This setup generates about 1.5volts when connected to a load of 100kilo ohms.
Though, it could theoretically generate higher voltages from the simulation results above, it
quickly gets loaded when a resistive or inductive load was connected. This concept needs
custom design and may not be readily used in low impedance designs for the reasons above.
However, they could be used where ultra low power, high impedance, non-on-demand design is
required.
Result of Piezoelectric design concept
This concept failed to meet the set goal of an on-demand electric power harvester to control an
everyday electronics. Although there is the potential of using this to power ultra-low power, high
impedance remote controllers in the future, it was not able to power the off the shelf RF-
transmitter used in this proof of concept. If this were possible, it would have made the remote
controller design much slimmer compared to the MPG discussed and designed below. Since the
prototype did not meet the set goal, a final design concept was not developed.
Magnetic Power Generator (MPG) Design
This section was set out to take advantage of the Michael Faraday’s law of electromagnetic
induction to harvest electrical energy when a push button is operated. The energy so harvested
was then used to drive an RF transmitter which sends signal to an RF receiver that operates a
remote controlled gadget.
Principle of operation
When a magnetic flux crosses through a conductor or a conductor is moved into a region of
magnetic flux, see figure [27] below, there is an induction of electric energy called EMF. This is
the Michael Faraday’s law of electromagnetic induction. This law states that the electromotive
force (EMF) around a closed path is proportional to the negative of the time rate of change of the
magnetic flux enclosed by that path [33]. This is the same principle in operation in generators,
transformers, induction motors, electric motors, synchronous motors, and solenoids [33]. This
has more to do with time rate of change in magnetic flux than in the actual magnitude of the
magnetic flux itself. In orders words, the amount of change (difference between initial and final
values), and not the magnitude of the flux, determines the amount of electromagnetic induction.

43
Hence if one is able to create a great difference in the flux level within a minimum amount of
time possible then the amount of electromagnetic induction will be correspondingly high.
In mathematical form, Faraday's law could be represented as [33]:
...............................................................................................equation 1
This equation represents an electromagnetic generator with a coil of only one turn. In a situation
with N-turns tightly wound to each other, the equation is modified slightly as:
..................................................................................................equation 2
Where N is the number of turns,
is the electromotive force,
ΦB is the magnetic flux (also defined as the product of an area multiplied by the
magnetic field normal to that area).
The negative sign in the above equations is as a result of the Lenz law [33]: this law, which is as
a result of the effects of Faraday's Law, together with Ampère's law and Ohm's law, states that
the EMF induced in an electric circuit always acts in such a direction that the current it drives
around the circuit opposes the change in the magnetic flux which produces that EMF.
Figure 27: Magnetic lines of force through a conductor
Equation 2 above also demonstrates that if the time rate of change of magnetic flux is constant,
one can increase the induced EMF by a factor of N, where N is the number of turns.
Magnetic lines of flux
Insulated Copper wires/coils

44
Analysis of Concept
To proceed with this concept, a simulation was first carried out using COMSOL 3.5a. A disc
shaped neodymium magnet with the following spec was modeled as the source of magnetic field
Dimensions: D12.7 X5.08 mm
Material: Sintered Neodymium magnet
Plating/Coating: NiCuNi(Nickel)
Magnetization Direction: Axially magnetised (Poles on flat ends)
Pull Force: 9.49 lbs - 16.12 lbs
Surface Field: 3530 Gauss
Br: ≥ 12,600 Gauss
Several simulation analyses were conducted with different z-distances from the permanent
magnet taken. See table 5 below and appendix D for details. The major constraint that was borne
in mind while setting up the simulation environment was the intended size of the MPG. The
Original intent was to determine at what distance away from the permanent magnet there would
exist a significant change in magnetic flux density. Table 5 shows that any increase in z-axis
separation will result in magnetic flux change. Based on that result, the MPG was then designed
to have a maximum ‘travel’ of 6mm. However, the final concept was designed with a switch
travel of about 5mm. This change in distance resulted in lesser flux change and was accounted
for by increase in number of turns.
Property of steel rod used:
Dimension: 5.6mm X 10.15mm
Weight: 1.7 grams
Relative permeability: 440
Steel grade: 416
.............................................................................equation 3
.........................................................................equation 4

45
Where A is the Area containing the coil winding, N is the number coil windings, is the
change in magnetic flux density, dt is change in time and dz is change is distance w.r.t to z-axis.
Figure 28: MPG model for COMSOL simulation
Figure 28 above shows the area of coil windings in the cylinder. Note the area in the cylinder
above for the steel rod to pass through. This was intentional to improve magnetic flux linkage
between the magnet and the coil and would be factored in when calculating the induced EMF.
Now, to actually estimate the magnetic flux linkage within the coil, the area of the coil
perpendicular to the magnetic flux density was calculated using the formula below.
Area of a cylinder:
......................................................................equation 5
The area of the magnetic circuit (coil windings) is given by subtracting the area or the smaller
cylinder from the area of the bigger cylinder. From the concept used, the radius ‘r’ of the bigger
cylinder is 7.29mm while that of the smaller cylinder is 3.83mm and height ‘h’ for both is
7.32mm. Computing this value gives an effective area of 4.0088e-4m2. The core on which the

46
coil was wound was an off-the shelf piece of plastic ribbon; as a result the rest of the design
calculations was based on its dimensions.
It could be observed from table 5 that the flux change with respect to z between a point when the
steel rod was resting on the magnet and when it was 5mm away is about 3.341 mT. These two
important parameters (distance from magnet and change in flux) are essential in the actual design
implementation. Refer to equations 1, 2, 3 and 4 that give the EMF induced by change in
magnetic flux. The other two unknowns at this point are generated EMF and number of coil
windings. Well, they could be easily determined. The approach used was to assume a single turn
and estimate the resulting induced voltage. And based on the outcome, determine how many
turns are required to obtain any voltage of choice.
For N = 1, N2 = 1 (*assume the MPG is pushed ones per second), then the induced EMF would
be approximately 1.34 µVolts. Also note that when the switch travels further away from the
magnet to 6mm, the change in magnetic flux was even higher. Refer to table 5. This gives rise to
an induced voltage of about 10.9 µVolts, following the same formula and calculation. The trade-
off here would be between the z-stack up height of the MPG and number of turns. Both concepts
where experimented with and designed as shown in the appendixes below. The first prototype
used 6mm travel distance with 717 turns while the second prototype, more compact in size of
design with respect to z stack-up, used 5mm travel distance with much higher number of turns
(1996 turns) to obtain similar voltage. Another important theory to bear in mind is that for the
same gauge of wire, resistance is proportional to length. In order words, more number of turns
lead to more generator impedance. In fact, it is possible to design the generator to give exactly
the amount of dc resistance required by the load circuit following the simple formula:
............................................................................................................equation 6
Here R is the required resistance, is the resistivity of the material, l is the length and A is the
cross-sectional area of the conductor used.
*this assumption was based primarily on the image on figure ... where the peak of the generated
voltage appears between 750ms and 1s from the time the push button is operated.
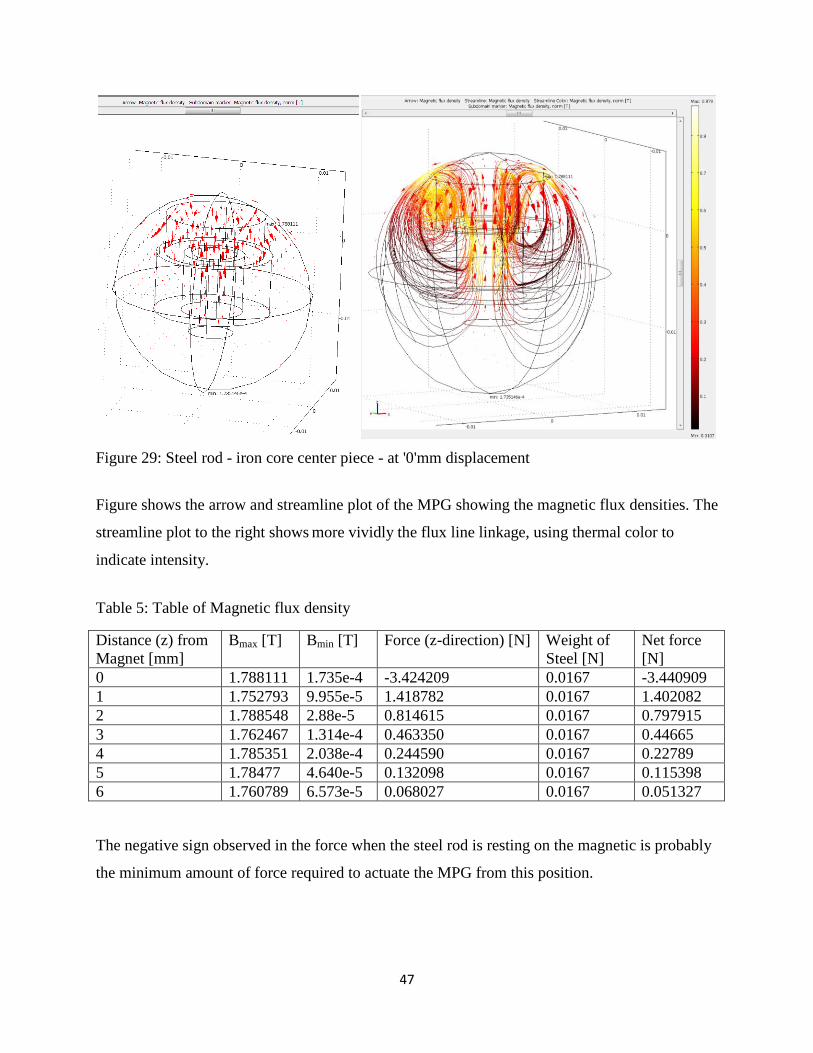
47
Figure 29: Steel rod - iron core center piece - at '0'mm displacement
Figure shows the arrow and streamline plot of the MPG showing the magnetic flux densities. The
streamline plot to the right shows more vividly the flux line linkage, using thermal color to
indicate intensity.
Table 5: Table of Magnetic flux density
Distance (z) from
Magnet [mm]
Bmax [T] Bmin [T] Force (z-direction) [N] Weight of
Steel [N]
Net force
[N]
0 1.788111 1.735e-4 -3.424209 0.0167 -3.440909
1 1.752793 9.955e-5 1.418782 0.0167 1.402082
2 1.788548 2.88e-5 0.814615 0.0167 0.797915
3 1.762467 1.314e-4 0.463350 0.0167 0.44665
4 1.785351 2.038e-4 0.244590 0.0167 0.22789
5 1.78477 4.640e-5 0.132098 0.0167 0.115398
6 1.760789 6.573e-5 0.068027 0.0167 0.051327
The negative sign observed in the force when the steel rod is resting on the magnetic is probably
the minimum amount of force required to actuate the MPG from this position.
48
Initial Design implementation
This MPG concept presented here was made with 717 turns and generates an output voltage up
to 6.0 Volts from the magnetic flux generated by the neodymium magnet when the push-button
is operated at a rate of 1 hertz or more to a travel distance of 6mm; notice that the simulated
result predicted about 5.6 Volts. With this information it is possible to design a custom
electromagnetic generator tailored to a specific output voltage. The measured output impedance
was 73 ohms. This presents an obvious advantage over the piezoelectric generator presented in
the section above. For one obvious reason, any load with higher impedance than the generator
impedance would not appear as a short circuit to the generator rather the generator would see
such loads as potential open circuit. This will allow more power to be coupled to the load unlike
the previous section which sees most loads as potential short circuits. Secondly, no complex
rectifying circuitry is required and this would easily work with off the shelf bridge rectifier,
unlike the piezoelectric harvester in the previous section.
Description of the magnetic power generator
This electromagnetic power generator is designed to work by pressing a push button. The push
button in turn drives an iron-core center piece away from the magnet. At rest position, the iron-
core center piece is in direct contact with the rare-earth magnet and passes through the middle of
the coil extending the magnetic flux through the entire coil. When the iron-core center piece is
then moved away from the magnet, the flux linkage breaks down. This breakdown or change in
flux is responsible for the electromagnetic induction (EMF), obeying the Faraday’s law of
electromagnetic induction. See figure 28a below for the direction of the induced EMF on the
oscilloscope image. Note that before the push button was activated, the magnet was at rest on the
core and coil, hence there was a magnetic flux linkage; however, since there was no change in
flux, there was zero electromagnetic induction. Refer to equations 1 and 2 above.
As the distance between the magnet and iron-core increases with the push of the button, the
magnetic flux decreases exponentially with a rate approximately equivalent to the inverse of the
square of the distance between them.
Magnetic flux = Ф = BA .......................................................................................equation 7
Where B is the magnetic field and A is the area perpendicular to the magnetic field B
49
With distance r, B ≡ 1/R2.......................................................................................equation 8
Equation 8 is a simplified form of the equation which is ignoring all other constants (including
magnetic permittivity). R is the distance between the magnet and the iron-core.
Now, this concept was fabricated in such a way that the iron-core center piece was still within
the magnetic force of attraction range of the neodymium magnet. This was observed
experimentally to be within about 6mm for the size of the iron-core center piece used. When the
force separating these two is removed, that is to say when the operator releases the push button,
the magnet pulls the iron-core back in and restores the original magnetic flux linkage with the
coil. This restoration of flux (change in flux linkage) also generates another EMF, this time
according figure 28b below has opposite phase as the one generated when the flux was initially
broken down as shown in figure 28a. It was determined experimentally that with a different
polarity of the magnet, the phase of the generated EMF was inverted for each of the preceding
actions. One other important novelty to this design approach was that the optimum placement of
the iron-core centre piece with respect to the permanent magnet creates a spring-like effect when
the push button was released. Moreover, unlike other magnetic energy harvesting devices that
require the operator to toggle the actuator back and forth to generate energy on both halves, no
user intervention is required for the concept in this thesis to restore the push button to its original
state. For every push-release action, the MPG generates electrical EMF energy on both cycles.
Initial Design Fabrication Details
This project was made up of 7 core components:
1. Neodymium magnet
2. 0.09mm (717 turns of enameled copper wire - Gauge 39 SWG wire coil)
3. Stainless non-magnetic inner sleeve
4. Copper outer sleeve
5. Stainless steel Iron-core
6. PCB bases and supports
7. Pair of insulated conducting wires

50
The neodymium magnet
This is one of the known most powerful permanent magnets around. It was discovered by
General Motors in conjunction with Sumitomo Special motors in 1982 [37]. It is an alloy of
neodymium, iron, and boron making it the strongest type of permanent magnet ever made. Its
choice in this concept was to achieve, on the same physical size as other permanent magnets, the
strongest magnetic force and hence highest magnetic flux, on a very small form factor. Size is a
very important consideration in this concept and all efforts are made to use smaller sizes of any
of the underlying components whenever possible. The size of magnet used here measures about
5mm in height and has approximately 200mT of magnetism on both poles measured from its
center.
0.09mm enamelled copper wire
Most paper publications indicate that copper wires are the most commonly used in
electromagnetic inductions because it has better conductivity and more cost effective than
competitions like gold [32]. The size choice was a compromise between size of design concept
and workmanship (ability to hand-wind the wire without breaking or twisting much of it).
Stainless non-magnetic inner sleeve
This sleeve is used to guide the coil while it slides through the outer sleeve. See appendix A.
Copper outer sleeve
This is used to transmit the force from the top piece to the bottom piece. See appendix A below.
Stainless steel Iron-core
This piece of metal is magnetic. The reason is to transmit the magnetic flux from the neodymium
magnet through the coil. At the bottom of the iron-core, a magnetic flux of about 20mT was
measured when the iron-core is tightly attracted to the magnet. Here, there is a bit of
experimental trials to determine which metal provides the highest amount of magnetic flux
transmission and the least to retain its magnetism after the source of magnetism has been
withdrawn. This is very important in this concept since the electromotive force (EMF) as defined
in equations 1 and 2 above is a function of flux change with respect to time, it is very imperative

51
that the core do not retain its magnetism, otherwise there would be minimal change in magnetic
flux when the core was pushed away from the coil. Although this assumption may sound
plausible at the time of the experiment, it could not be proved that indeed that was the case, since
all that is needed for electromagnetic induction was change in flux linkage not minding if the
source(s) is from a single magnet or pair of magnets.
PCB bases and supports
There are no special reasons for the choice of these materials other than their availability. Any
non-conductive rigid material would serve similar purpose. See appendix A below for more.
Pair of insulated conducting wires
This pair of wire is used to extend the very fine core windings to the rectifier circuit. The coil
wire size is very fine and handling would require utmost care. To prevent inadvertent breakage,
this pair of insulated wires was soldered within the coil area, one to each end of the coil, to
extend the leads to the other electronic circuits.
Fabrication and testing of Proof of concept
The dimension of the magnetic power generator is given in figure 28 below. While the complete
set up and modes of operation are given in figures 29 and 30.
Figure 30: Dimension of the magnetic power generator

52
When the top portion (top piece or button) of the MPG is pushed down as in figure 31 below
(this requires an average force of 8 Newton), it moves the bottom piece of the unit which is
attached to the iron-core of the MPG (see image 4 of Appendix A below). This causes a
separation between the magnet and the iron-core, this action creates a change in magnetic flux.
And since the magnetic flux through the coil changes, there is an electromagnetic induction
(EMF).
Figure 31: MPG setup and mode of operation – push down mode
Conversely, when the force is released, the neodymium earth magnet attracts the center piece
iron-core back to the original position as in figure 32a and b below. This action restores the
original flux linkage. This change in flux linkage in accordance with Faraday’s law creates
another EMF.
Figure 32: MPG setup and mode of operation – release mode
The voltages generated when the generator button is pushed down and when it is released show
opposite polarities in the oscilloscope images in figures 33a and 33b below, respectively. Notice
the phase difference between the two sets of generated voltages. It would be noted that since the
Figure 32a Figure 32b
Figure 31a Figure 31b

53
magnet is in a fixed polarity the explanation for the difference in phase of generated voltages
could only be attributed to the flux direction or flux interaction with the generator coil. In one
case, the flux linkage in the coil is collapsing as the metal core is being pushed away from the
magnet, this change in flux according Michael Faraday’s law, creates EMF energy; conversely,
when the force is released and the metal core is pulled in by the magnetic force of attraction,
there is another flux change, but this time the flux is building back up to the original level before
the push. The phases of the generated voltages are hereby linked to the direction of magnetic flux
linkage within the coils.
This concept has proven that not only does opposite poles of the magnet result in opposite EMF
phases, but so also does flux direction, either the build up or the collapse thereof. Another way
to look at this is to consider the iron-core centre piece as a piece of bar magnet with constant
polarity. As this ‘magnet’ moves in and out of the coil (by the push-release action) the direction
of the induced EMF changes accordingly.
Figure 33a and b: Induced EMF phase ‘a’
The voltage generated by this magnetic power generator is alternating current (AC) in nature as
could be clearly seen on the oscilloscope images above. To make this useful for most electronic
devices we need to convert this AC voltage to direct current (DC) voltage. Note that the scale on
the oscilloscope was set at 2 Volts per division. In the above images, the generated voltages are
between 4 and 6 volts AC.

54
Voltage rectification and filtering
There are a couple of rectification options available to convert an AC voltage to a DC voltage
namely, half wave, full-wave and voltage multiplication. Voltage multiplication types include
doublers, triplers, and quadruplers. But the fact that the output voltage and power generated from
this concept was high enough for many low power devices, especially the RF solutions’ QAM-
TX1-433 used in this proof of concept, there was no need for any such additional voltage
multiplication.
The images above in figure 33a and 33b showed that voltage generated by this magnetic power
generator could be positive-going or negative-going in nature. This makes the obvious choice of
voltage rectification a full-wave bridge rectifier (a bridge rectifier is a full wave rectifier for
systems without a center-tap transformer; it uses 4 diodes instead of 2 and a center-tap
transformer). The reason for this is to capture all phases of the voltage and to ensure there is no
loss of power on alternate phases. See figure 15 above for the operation of the full-wave bridge
rectifier.
For this generator, a full wave bridge rectifier from Fair Child electronics was used to convert
the AC voltage to DC voltage [34]. The choice of this part is because of its compactness and low
overall forward voltage drop. Discrete diodes would drop 0.6 to 0.7 volts each, a total of 1.2 to
1.4 volts would be lost in two-arm diode configuration used in a full-wave rectifier circuit [35]
but this is totally avoided with this integrated circuit bridge rectifier which drops only a total
overall 0.7volts.
Figures 32a and 32b below show the bridge rectifier in a breadboard. A 39 kilo ohm resistor was
connected across a 4.7µF/63volts capacitor to simulate a load. For this load with a single push-
release action of the MPG, the capacitor was able to store its charge for up to 183.3 milliseconds
before being fully discharged (assuming the initial voltage was 4.0 Volts). Equation 5 below
shows how to determine different capacitor values for different time constants.
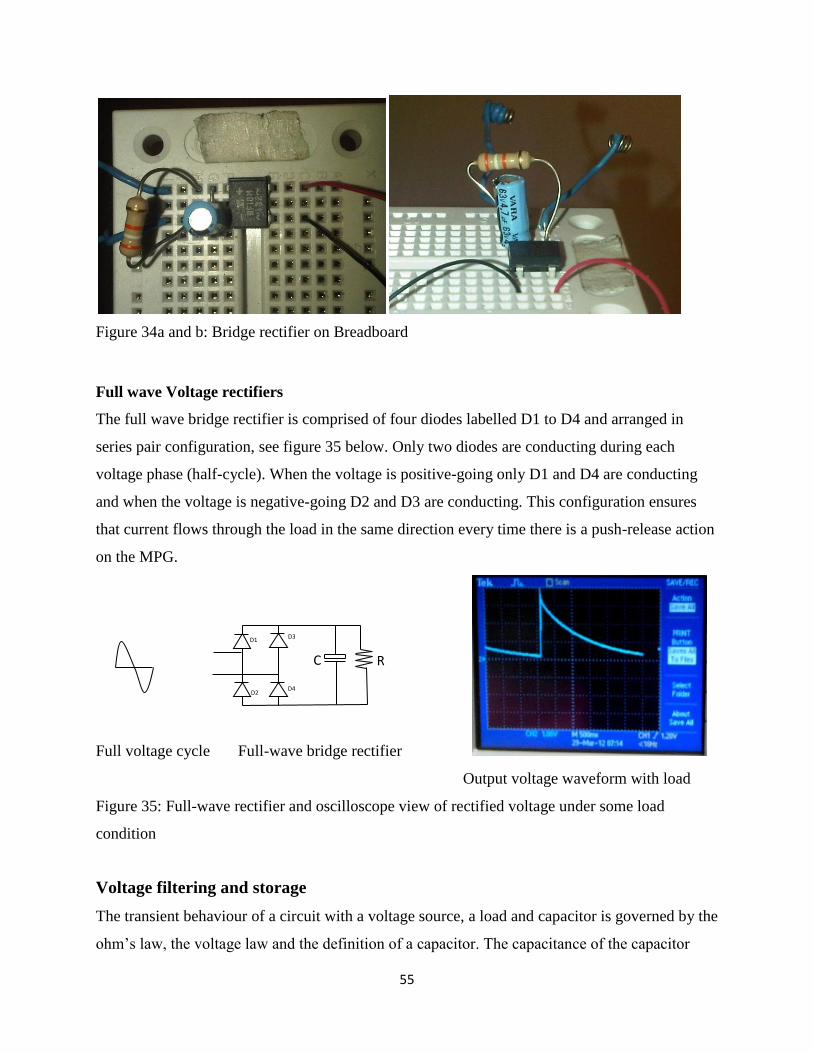
55
Figure 34a and b: Bridge rectifier on Breadboard
Full wave Voltage rectifiers
The full wave bridge rectifier is comprised of four diodes labelled D1 to D4 and arranged in
series pair configuration, see figure 35 below. Only two diodes are conducting during each
voltage phase (half-cycle). When the voltage is positive-going only D1 and D4 are conducting
and when the voltage is negative-going D2 and D3 are conducting. This configuration ensures
that current flows through the load in the same direction every time there is a push-release action
on the MPG.
Full voltage cycle Full-wave bridge rectifier
Output voltage waveform with load
Figure 35: Full-wave rectifier and oscilloscope view of rectified voltage under some load
condition
Voltage filtering and storage
The transient behaviour of a circuit with a voltage source, a load and capacitor is governed by the
ohm’s law, the voltage law and the definition of a capacitor. The capacitance of the capacitor
D3
D4 D2
D1
R C

56
being defined as the constant of proportionality between the quantity of charge Q and the
potential difference V. When these are all put together and simplified, we get equation 5 below.
The time constant Tau (τ), measured in seconds, is the time taken to charge up a capacitor from 0
volts to 63% of the source voltage. This is coincidentally the same equation used to calculate the
time it takes to discharge the capacitor to about 36% of its initial voltage.
τ = RC (where R is the load resistance and C is the output capacitor.)...........................equation 9
Figure 36: RC configuration for calculating discharge time constant
For this Circuit with the a load of 39 kilo ohms and capacitor value of 4.7µF, the time it will take
to fully discharge the capacitor from 4.0 Volts would be: τ = 39 * 103 * 4.7*10
-6 = 183.3ms
With a higher load resistance it takes longer to discharge the same amount of voltage from the
same capacitor value. When it is desirable to keep the charge longer, this equation is taken into
consideration to determine the optimum value of filtering capacitor to use. Now, it is worth
mentioning that the time it takes to discharge a capacitor is approximately the same amount of
time it takes to charge same capacitor. The only difference is that this time the resistance is
connected in series. For this type of generator setup, the only resistances are the complex
impedances of the conducting wires and would be very small or negligible for short wire lengths.
This is why the capacitor is charged up almost instantly when the MPG is operated. However,
different capacitor values are charged up at different rates, with the low value capacitors
receiving the most charge for the same amount of charge time.
Summary
The fabricated electromagnetic power generator’s size was 20.5mm by 20.5mm with a measured
maximum output DC voltage of 4.0V on a load of 39k ohms; this concept has the potential of
delivering up to 0.410milli watts into the connected load (It was also demonstrated to deliver up
R C V

57
to 3.0 Volts in a load as low as 220 ohms – output voltage is a function of the push-release cycle
time (equation 1) and the connected load).
The current proof of concept can easily be used in garage door openers and with more advanced
fabrication there is a very high possibility of using it in automobile or other smaller form factor
wireless remote controllers. There is a possibility that this could be further miniaturized and used
in the everyday household remote control systems.
Other magnetic based electromagnetic power generators today depend on a vibrating
environment to harvest its energy then accumulate and store them for later use, but the concept
demonstrated in this section is based on push-generate idea, hence, on-demand. Regular remote
controllers in existence today do not need energy sources when they are not being used and when
the need arises, we definitely do not have the time to vibrate them to their resonant frequencies,
harvest, accumulate and process the energy before opening or closing the garage door, for
instance.
This is the solution the concept presented in this thesis offers. Every push of the button was
capable of generating enough energy to drive the remote control electronics. Unlike many other
electromagnetic energy harvesters that require a constantly vibrating environment to function
[32], this concept makes the energy available with every single push of the button in an on-
demand basis. This makes it a great choice in non-vibrating environments while at the same time
eliminating the need for batteries. The future is here.

58
Chapter 6
Conclusion and Future Work
Practical application examples:
The final design implementation in the proof of concept presented here was used to power a
custom remote control system based on RF solution’s QAM-TX1-433 and QAM-RX2-433.
Figure 37 below shows the complete circuit diagram of the RF transmitter section. It consists
mainly of 3 parts; the MPG, the bridge rectifier and the RF transmitter. The MPG is the proof of
concept presented in this thesis as stated above. Likewise the bridge rectifier is the same as
describe in the sections above. Now, the RF transmitter has a unique configuration.
It was adopted from the ‘application circuit of the data sheet’ [34] where the data input pin (pin2)
was directly pulled up to VCC as opposed to connecting it through a data encoder which would
have consumed a lot more power and needs a steady regulated supply voltage.
The configuration here sends a high pulse to the data input line upon power up and this is
transmitted through the transmitting antennae to the receiving antennae as a ‘high’. The transmit
range is up to 50m with an operating voltage of 1.5 to 5.0Volts which is well within the power
supply capability of the MPG energy harvester. To operate the transmitter, a force of about 8N is
C
D3
D4 D2
D1
MPG Bridge rectifier RF transmitter
1 2 3 4
QAM-TX1-433
Figure 37: Full diagram of the MPG energy harvesting RF transmitter circuit
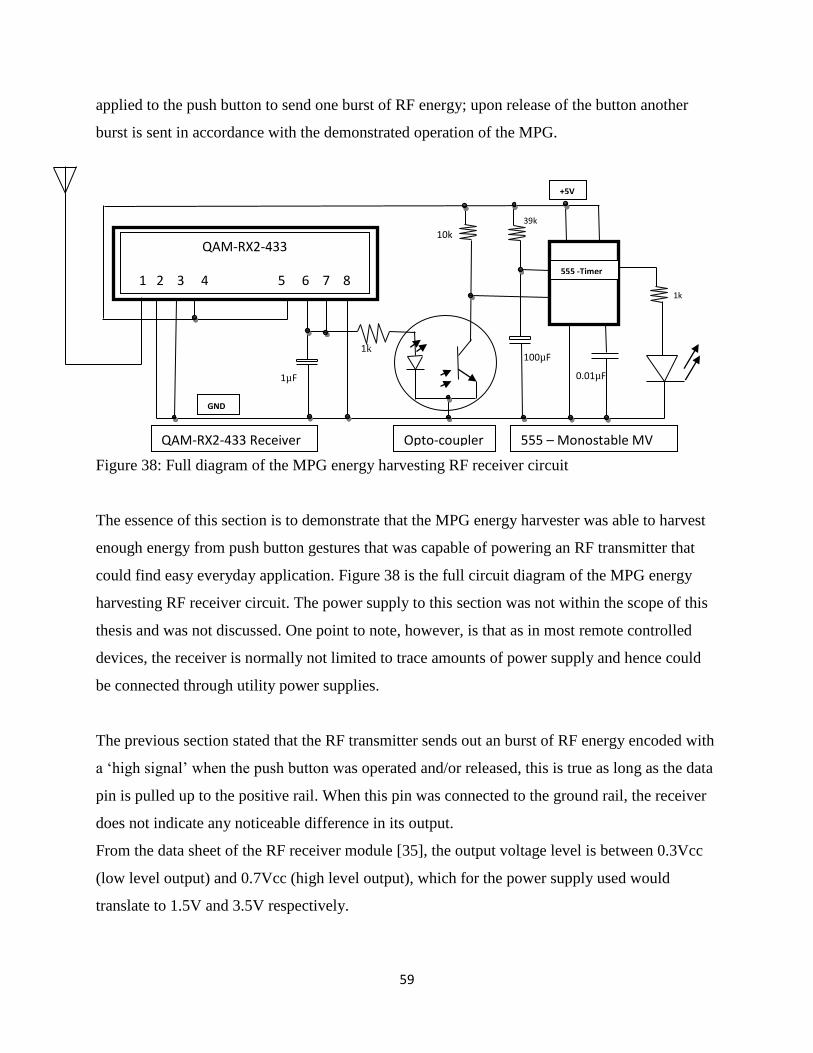
59
applied to the push button to send one burst of RF energy; upon release of the button another
burst is sent in accordance with the demonstrated operation of the MPG.
Figure 38: Full diagram of the MPG energy harvesting RF receiver circuit
The essence of this section is to demonstrate that the MPG energy harvester was able to harvest
enough energy from push button gestures that was capable of powering an RF transmitter that
could find easy everyday application. Figure 38 is the full circuit diagram of the MPG energy
harvesting RF receiver circuit. The power supply to this section was not within the scope of this
thesis and was not discussed. One point to note, however, is that as in most remote controlled
devices, the receiver is normally not limited to trace amounts of power supply and hence could
be connected through utility power supplies.
The previous section stated that the RF transmitter sends out an burst of RF energy encoded with
a ‘high signal’ when the push button was operated and/or released, this is true as long as the data
pin is pulled up to the positive rail. When this pin was connected to the ground rail, the receiver
does not indicate any noticeable difference in its output.
From the data sheet of the RF receiver module [35], the output voltage level is between 0.3Vcc
(low level output) and 0.7Vcc (high level output), which for the power supply used would
translate to 1.5V and 3.5V respectively.
0.01µF
1k
1k
1µF
10k
39k
Opto-coupler 555 – Monostable MV QAM-RX2-433 Receiver
GND
100µF
QAM-RX2-433
1 2 3 4 5 6 7 8 555 -Timer
+5V

60
An electrolytic capacitor was connected to the data output line to maintain a steady output
voltage from the receiver and to prevent false triggering of the load. Note that since the
transmitter was not encoded nor was the receiver connected to a decoder, the receiver is prone to
respond to any RF transmitter with similar modulation under the same frequency range of
433MHZ. It was also observed that the receiver would respond by increasing the output voltage
from 0.3Vcc when a hand is placed near the receiving antennae. Now the scope of this thesis was
limited to the MPG for the RF transmitter and would not go in details to describe how to encode
and decode RF receivers.
When the RF receiver receives a signal from the transmitter, the output voltage goes from low to
high driving the white LED on (which needs around 2.6Volts to turn on). A homemade opto-
coupler from a white LED and a Phototransistor was used to trigger the 555-timer based
monostable multivibrator to drive an LED at the output circuit on for the time determined by the
monostable period: 1.1*RC .................................................................................equation 10
The proof of concept used an R of value 39k and a C of value 100µF => 1.1*39*103*100*10
-6
= 4.29 seconds. For a 100K resistor and the same capacitor value, the period would be
11seconds. This time period was chosen to make the cycle time fast for demonstration purposes
but also long enough to clearly observe the operation of the MPG. This section helps to
demonstrate the MPG energy harvesting concept and by no means intended as an exclusive use
of the concept. The opto-coupler output, for instance, could be use to toggle a flip-flop circuit at
every push of the button. The flip-flop in turn could then be used to drive any other controlled
element or device.
Figure 39a is the image of the
completed MPG prototype while
figure 39b is the image of the
completed prototype of the RF
receiver circuit and control
circuitry.
Figure 39c shows the exploded
diagram of the Magnetic Power
generated.
Figure 39a Figure 39b

61
Figure 39c: The exploded diagram of the MPG generator assembly
Energy harvesting is an innovative and effective way of Energy recycling. It is a revolutionary
way of improving ‘energy eco-system’. Using energy sources available in the atmosphere in an
effective way, it is possible to power low power transceiver sensor nodes. This perpetual source
of energy obviates the need to change power sources/batteries for sensor nodes or remote control
systems. This has been proven in this MPG on-demand energy harvesting concept; a regular
gesture made to operate a remote control system has been utilized to operate the system
obviating the need for batteries.
Challenges and future work

62
There was a challenge of finding materials that could lose all magnetism after been pulled away
from the magnet but able to extend good amount of magnetic flux when on contact. This will
help to create the quality change in magnetic flux that is behind a good EMF induction. A second
challenge lies with making a compact design and the third challenge was with finding off- the-
shelf transceiver circuits that could work at ultra low power levels.
Future research opportunities
The size of this initial concept could still be reduced to find it attractive in ultra thin design
world. Making a micro design of the on-demand MPG should be explored, in conjunction with
ultra low power transmitter circuits, such that this concept will replace all forms of remote
control systems in the future. Finally, since this design has moving mechanical parts, they are
subject to tear and wear. Research should be dedicated to finding long lasting mechanical parts
that will last more or at least close to as long as the current battery-powered remote control
devices.
63
References
[1] Lu Chao, Chi-Ying Tsui and Wing-Hung Ki “A Batteryless Vibration-based Energy
Harvesting System for Ultra Low Power Ubiquitous Applications” Circuits and Systems, 2007,
ISCAS 2007. IEEE International Symposium, 27-30 May 2007 [2] Bruno Do Valle, Christian T.
Wentz, and Rahul Sarpeshkar “An Area and Power-Efficient Analog Li-Ion Battery Charger
Circuit.” IEEE transactions on biomedical circuits and systems, vol. 5, no. 2, April 2011
[3] http://muehlhaus.com/support/sonnet-examples - 2.45GHz antenna design (August 6, 2012)
[4] Maria Gorlatova, Peter Kinget, Ioannis Kymissis, Dan Rubenstein, Xiaodong Wang, and Gil
Zussman “Energy Harvesting Active Networked Tags (ENHANTS) For Ubiquitous Object
Networking.” Wireless Communications, IEEE, December 2010
[5] Sun-free photovoltaics - http://web.mit.edu/newsoffice/2011/sun-free-photovoltaics-
0728.html, August 2012
[6] Stanford Unveils Solar Tech That Harnesses Light and Heat http://inhabitat.com/stanford-
harnesses-light-and-heat-with-new-solar-tech/ August 2012
[7] Vijay Raghunathan, Aman Kansal, Jason Hsu, Jonathan Friedman, Mani B Srivastava,
"Design considerations for solar energy harvesting wireless embedded systems." IEEE
International Symposium on Information Processing in Sensor Networks (IPSN), April 2005
[8] Alireza Khaligh, Senior Member, IEEE, Peng Zeng, Student Member, IEEE, and Cong
Zheng, Student Member, IEEE “Kinetic Energy Harvesting Using Piezoelectric and
Electromagnetic Technologies – State of the Art.” IEEE Transactions ON INDUSTRIAL
ELECTRONICS, VOL. 57, NO. 3, MARCH 2010
[9] Yunhan Huang, Ravi Doraiswami, Michael Osterman, and Michael Pecht “Energy
Harvesting Using RF MEMS.” Electronic Components and Technology Conference (ECTC),
2010 Proceedings 60th: 1-4 June 2010
[10] Manos M. Tentzeris, Amin Rida, Anya Traille, Hoseon Lee, Vasilis Lakafosis and Rushi
Vyas “Inkjet-Printed Paper/Polymer-Based RFID and Wireless Sensor Nodes: The Final Step to
Bridge Cognitive Intelligence, Nanotechnology and RF?” School of ECE, Georgia Tech, Atlanta,
GA 30332-250, USA
[11] http://ca.mouser.com/thermal_energy_harvesting/ “Thermal Energy Harvesting – Infinite
Clean Power for Wireless Sensor Networks.”August 2012
[12] http://en.wikipedia.org/wiki/Energy_harvesting#Thermoelectrics

64
[13] Stewart Sherrit “The Physical Acoustics of Energy Harvesting” Advanced Technologies
Group, Instrument Mechanical Engineering Section, Jet Propulsion Laboratory, Pasadena, CA,
USA
[14] P. Peumans, A. Yakimov, and A. Forrest, “Small Molecular Weight Organic Thin-Film
Photodetectors and Solar Cells,” J. Appl. Phys., vol. 93, 2003, p. 3693.
[15] Roy Want, keith I. Farkas, Chandra Narayanaswami “Energy harvesting and conservation”
IEEE CS and IEEE ComSoc, 2005
[16] Samuel P. Subbarao, Matthias E. Bahlke and Ioannis Kymissis, “Laboratory Thin-Film
Encapsulation of Air-Sensitive Organic Semiconductor Devices,” IEEE Transactions On
Electron Devices, Vol. 57, no. 1, January 2010
[17] Disposal of Lead Acid Batteries (#104)
http://www.activepower.com/documents/white_papers/?resource=White%20Papers&lang=US&i
d=1&lightbox%5Bwidth%5D=40p&lightbox%5Bheight%5D=50p&lightbox%5Biframe%5D=tr
ue August 2012
[18] http://www.piezoinstitute.com/about/piezohistory/index.php “Piezo History”, August 2012
[19] http://www.mendeley.com/research/ferroelectric-ceramics-history-and-technology/
“Ferroelectric Ceramics: History and Technology”, August 2012
[20] http://en.wikipedia.org/wiki/Solar_energy “Solar energy”, August 2012
[21] http://www.energyharvesting.net/ “Energy Harvesting Electronic Solutions For Wireless
Sensor networks & Control Systems”
[22] J. Rabaey, F. Burghardt, D. Steingart, M. Seeman, and P Wright “Energy Harvesting – A
systems perspective”, Electron Devices Meeting, 2007. IEDM 2007. IEEE International. 10-12
Dec. 2007
[23] DF005M – DF10M – www.fairchildsemi.com/ds/DF/DF10M.pdf August 2012
[24] Loreto M. and Francesc M “System-level simulation of self-powered sensor with
piezoelectric energy harvesting”, Sensor Technologies and Applications, 2007. SensorComm
2007. International Conference, 14-20 Oct. 2007
[25] http://en.wikipedia.org/wiki/Maximum_power_point_tracking “Maximum power point
tracking” August 2012
[26] http://electronicdesign.com/article/power/maximum-power-point-tracking-solar-battery-
charger.aspx “Maximum-power-point-tracking solar battery charger”, August 2012

65
[27] Microwave engineering third edition by David Pozar’s. Wiley India, Pvt. LTD, 2009 ISBN
8126510498, 9788126510498
[28] 1N4001 – 1N4007 – www.fairchildsemi.com/ds/1N/1N4007.pdf August 2012
[29] https://sites.google.com/site/educationforsolarenergy/home/what-is-going-on-with-solar-
energy “What is going on with solar energy?”, August 2012
[30] Doms I.a,b
, Merken P.b, Van Hoof C.
a,b,
aK.U.Leuven, ESAT-INSYS, Kasteelpark Arenberg
10 “Comparison of DC-DC-converter Architectures of Power Management Circuits for
Thermoelectric Generators.” Power Electronics and Applications, 2007 European Conference on
2-5 Sept. 2007, page(s): 1 – 5
[31] Angela DiDomenico Astin “Finger force capability: measurement and prediction using
anthropometric and myoelectric measures” Master of Science in Industrial and Systems
Engineering, December 16, 1999.
[32] Seong-Il Kim, Dong Ho Lee, Yoon Pyo Lee, Young Soo Chang, and M.-C. Park, "Low
frequency properties of micro power generator using a gold electroplated coil and magnet"
Current Applied Physics 8, pp. 138–141, 2008.
[33] Clayton R. Paul “What Do We Mean by “Inductance?” Part I: Loop Inductance”, Page(s) 95
- 101. IEEE 2007
[34] AM TRANSMITTER MODULE www.quasaruk.co.uk/acatalog/DSQAM-TX1-1.pdf,
August 2012.
[35] AM SUPER REGEN RECEIVER www.quasaruk.co.uk/acatalog/DSQAM-RX2-1.pdf,
August 2012.
[36] Alanson Sample and Joshua R. Smith “Experimental Results with two Wireless Power
Transfer Systems” Intel Research Seattle, 1100 NE 45th Street, Seattle, WA 98105 2Department
of Electrical Engineering, PO Box 352500, University of Washington, Seattle, WA 98195
[37] Magnequench – patent information guide http://www.molycorp.com/wp-
content/uploads/Patent_Info_Guide_May11.pdf, August 2012.

66
Appendices
Appendix A
Part Fabrication
Image A1 is the bolt used as the iron core center piece. Image A2 is the support handle to support
the MPG when any force is applied. It was fabricated to withstand a force more than 15 Newton.
Image A3 is the bottom piece that drags the iron core center piece away from the neodymium
earth magnet when the force is applied while image A4 shows the combination of the previous 3
images.
Images A5a and A5b show the neodymium earth magnet.
A1 A2
A3 A4
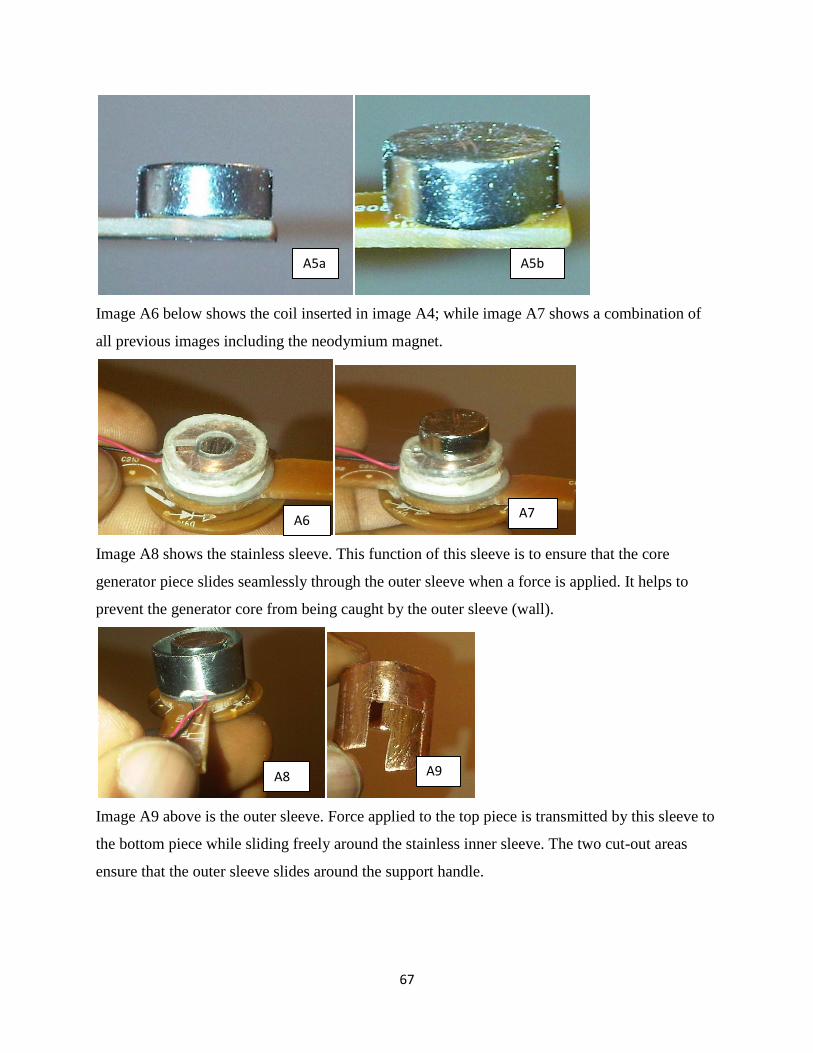
67
Image A6 below shows the coil inserted in image A4; while image A7 shows a combination of
all previous images including the neodymium magnet.
Image A8 shows the stainless sleeve. This function of this sleeve is to ensure that the core
generator piece slides seamlessly through the outer sleeve when a force is applied. It helps to
prevent the generator core from being caught by the outer sleeve (wall).
Image A9 above is the outer sleeve. Force applied to the top piece is transmitted by this sleeve to
the bottom piece while sliding freely around the stainless inner sleeve. The two cut-out areas
ensure that the outer sleeve slides around the support handle.
A5a A5b
A6 A7
A8 A9

68
Image A10 above shows the entire magnetic power generator without the top piece while image
A11 shows the generator with the top piece. The top piece is where the force is being applied.
A10 A11

69
Appendix B
Engineering drawing of the MPG energy harvesting switch
Image B1

70
3-D image of the fabricated MPG generator parts
Image B2
Handle Steel
Magnet Base
Coil Cap
Button
Screw
MPG full assembly – Profile view MPG full assembly – Angle view

71
Appendix C
Table 6: Comparison between homemade vs. machine fabricated prototypes
Parameters Proto1 (Home Fabrication) Proto2 (Machine Fabrication)
Dimension (mm) 20.5 X 20.5 21.0 X 22.0
Measured Max. Voltage (V) 6.0 4.0
Number of Turns 717 1996
Coil DC Resistance (Ω) ~73 ~210
Using many off-the-shelf parts impacted the size of both prototypes. The package style of the
machine fabricated prototype informed the reason behind the higher number of turns. This is to
ensure that enough voltage at every push of the button. The *travel for the home made prototype
was longer, between 6mm and 8mm while that of the machine fabricated prototype was between
5 and 6mm.
*Travel is the distance covered by the iron-piece center core (steel rod) when the MPG is
operated.

72
Appendix D
COMSOL 3.5a Simulation of the MPG
The geometry of the three core parts of this design was modelled as well as a sphere enclosing
them. Boundary conditions for the sphere were set as magnetic insulation and that of the other 3
sub-domain parts were set as continuity. The various data required to properly describe the sub-
domains for the simulation software were entered.
Table 7: Table of Constants
Image D1
This was modelled in a current free region such that
The scalar magnetic potential Vm could be defined from the relation
This resembles the definition of the electric potential for static electric fields. By using the
constitutive relation between the magnetic flux and magnetic field ( together
with the equation one can drive an equation for Vm,
The force experienced by the steel rod was calculated by COMSOL using the following
equation:

73
It takes into account the surface stress tensor all over the boundary of the steel rod (iron core
center piece), is the boundary normal pointing out from the steel and is the stress tensor of
air.
Image D2 shows the Figures of the MPG in the COMSOL software; the blue cylinder
represented the coil while the pink pieces are the magnet and the steel core.
Image D2
Image D3
The Arrow, sub-domain maker and streamline plots of the MPG after simulation. This was done
with the steel rod at ‘0’mm distance from the magnet. Notice the magnetic flux density
diminishing rapidly as the lines go further from the magnet. The legend to the right is the
streamline color legend for magnetic flux density.

74
Image D5
The Arrow, sub-domain maker and streamline plots of the MPG after simulation. This was done
with the steel rod at ‘1’mm distance from the magnet. Notice the magnetic flux density
diminishing rapidly as the lines go further from the magnet. The legend to the right is the
streamline color legend for magnetic flux density.
Image D6
The Arrow, sub-domain maker and streamline plots of the MPG after simulation. This was done
with the steel rod at ‘2’mm distance from the magnet. Notice the magnetic flux density
diminishing rapidly as the lines go further from the magnet. The legend to the right is the
streamline color legend for magnetic flux density.
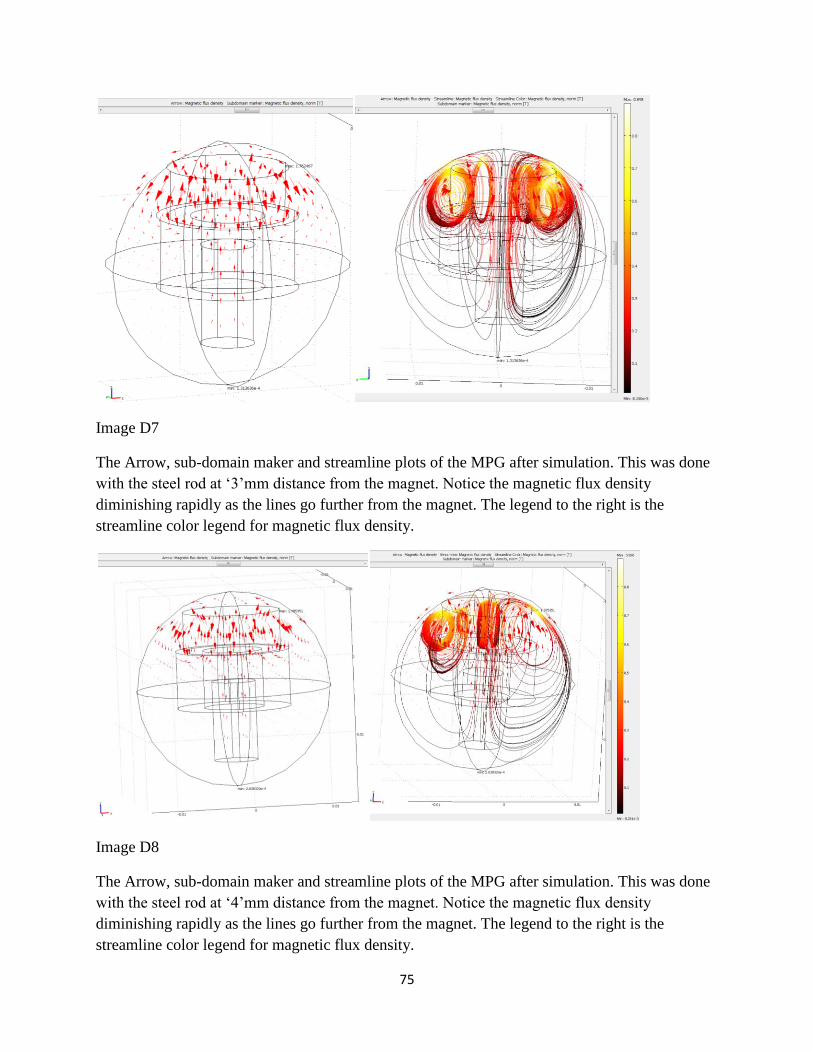
75
Image D7
The Arrow, sub-domain maker and streamline plots of the MPG after simulation. This was done
with the steel rod at ‘3’mm distance from the magnet. Notice the magnetic flux density
diminishing rapidly as the lines go further from the magnet. The legend to the right is the
streamline color legend for magnetic flux density.
Image D8
The Arrow, sub-domain maker and streamline plots of the MPG after simulation. This was done
with the steel rod at ‘4’mm distance from the magnet. Notice the magnetic flux density
diminishing rapidly as the lines go further from the magnet. The legend to the right is the
streamline color legend for magnetic flux density.

76
Image D9
The Arrow, sub-domain maker and streamline plots of the MPG after simulation. This was done
with the steel rod at ‘5’mm distance from the magnet. Notice the magnetic flux density
diminishing rapidly as the lines go further from the magnet. The legend to the right is the
streamline color legend for magnetic flux density.
Image D10
The Arrow, sub-domain maker and streamline plots of the MPG after simulation. This was done
with the steel rod at ‘6’mm distance from the magnet. Notice the magnetic flux density
diminishing rapidly as the lines go further from the magnet. The legend to the right is the
streamline color legend for magnetic flux density.

77
Consistently as the distance from the magnet increases, the magnetic flux density decreases. This
effect was exploited in designing the on-demand magnetic energy harvester which takes
advantage of the time rate of change in magnetic flux to generate useful electrical energy.


