ELLs in the Mainstream Staff Development M. Zeichick-Tessier [email protected] X5063.
date post
20-Dec-2015Category
view
217download
1
On-chip Monitoring Infrastructures and Strategies for
Many-core Systems
Russell Tessier, Jia Zhao, Justin Lu, Sailaja Madduri, and Wayne Burleson
Research supported by the Semiconductor Research Corporation

2
Outline• Motivation• Contributions• On-chip monitoring infrastructures• Extensions to 3D architectures• Monitoring for voltage droop prevention• Conclusion and future work
3
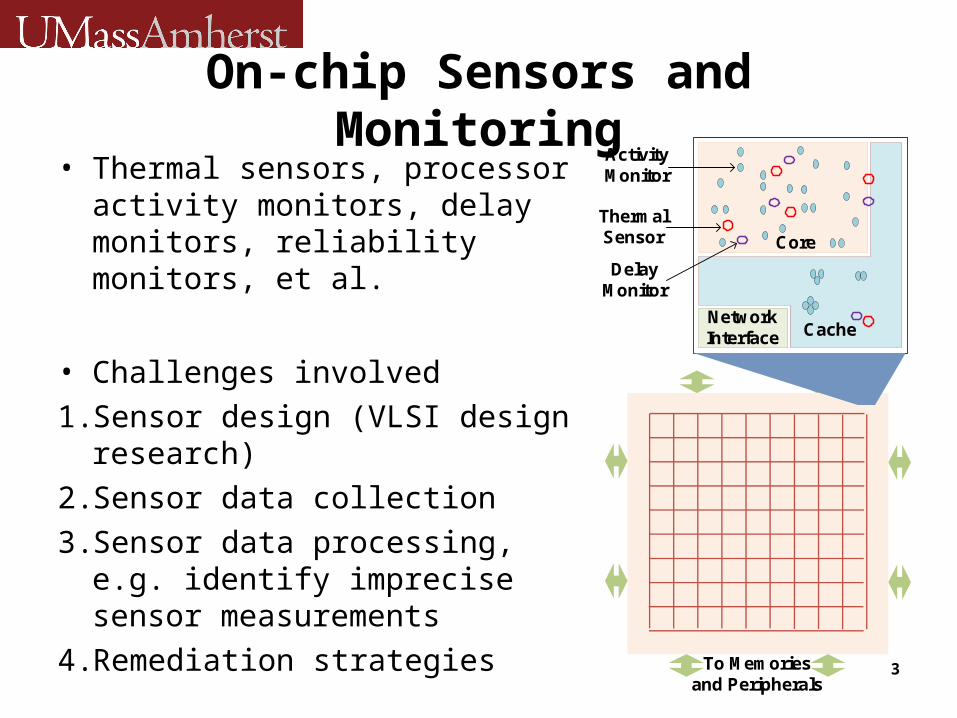
On-chip Sensors and Monitoring
• Thermal sensors, processor activity monitors, delay monitors, reliability monitors, et al.
• Challenges involved1. Sensor design (VLSI design
research)2. Sensor data collection 3. Sensor data processing, e.g.
identify imprecise sensor measurements
4. Remediation strategies
Core
Network Interface Cache
Thermal Sensor
Activity Monitor
To Memories and Peripherals
Delay Monitor

4
Multi-core and Many-core Systems
• From single core systems to multi-cores and many-cores
• Need to monitor system temperature, supply voltage fluctuation, reliability, among others
• Remediation strategies include voltage change, frequency change, error protection, et al. AMD FX-8150 8-Core Bulldozer Processor
Image courtesy: silentpcreview.com
5
System-Level Requirements
• Monitor data collected in a scalable, coherent fashion– Interconnect flexibility: Many different monitor
interfaces, bandwidth requirements– Low overhead: Interconnect should provide low
overhead interfaces (buses, direct connects) while integrating NoC
– Low latency: Priority data needs immediate attention (thermal, errors)
• Collate data with centralized processing – Focus on collaborative use of monitor data
• Validate monitoring system with applications– Layout and system-level simulation
6
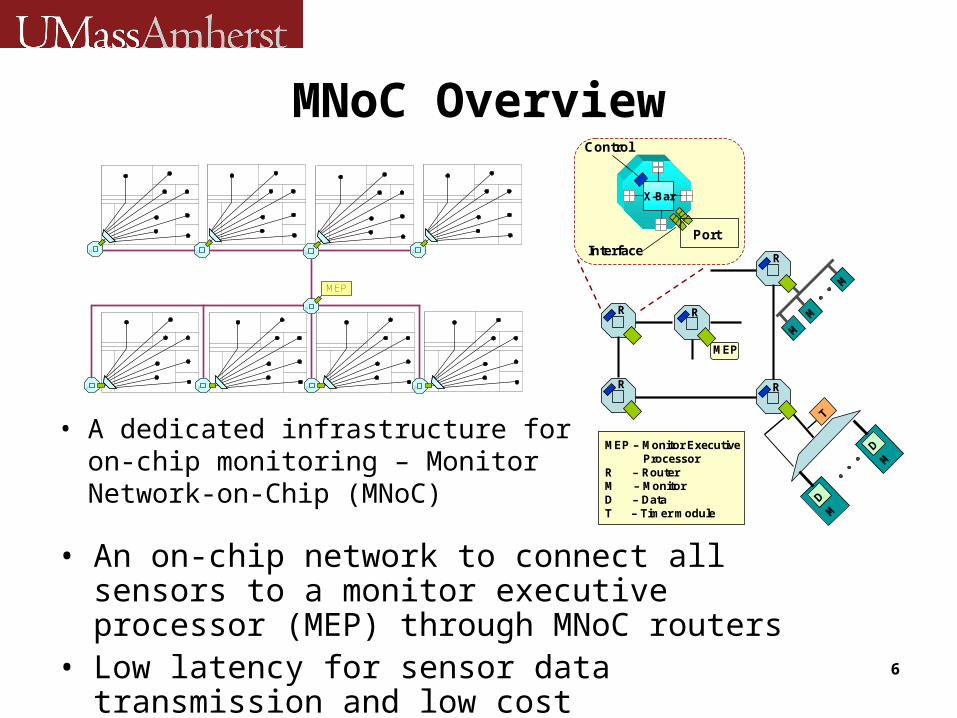
MNoC Overview
• A dedicated infrastructure for on-chip monitoring – Monitor Network-on-Chip (MNoC)
R R RR
R
MEP
R R R R
MEP
R R
R
RR
M
M
M
DM
DM
T
X-Bar
Port
Control
Interface
MEP – Monitor Executive Processor
R – RouterM – MonitorD – DataT – Timer module
• An on-chip network to connect all sensors to a monitor executive processor (MEP) through MNoC routers
• Low latency for sensor data transmission and low cost

7
Priority Based Interfacing
• Multiple transfer channels available for critical data • Interface synchronized with router via buffer• Time stamps used to prioritize/coordinate responses
HIGH PRIORITY CHANNEL
NETWORK ROUTER
MONITORS
BUS-ROUTER INTERFACE

8
MNoC Router and Monitor Interface
• Bus and multiplexer are both supported
• Data type:– Periodically sampled– Occasionally reported
• Critical monitor data is transferred in the priority channel
• A thermal monitor [1] interface example:– FSM controlled– Time stamp attached
to identify out-of-data data
MUX
Samplesignal
Monitorpacket
Network router interface (Master)
Thermal Monitor
8 bitdata
Torouter
Bufferfull
Dataready
Idle
Wait fordata
Wait forbuffer
Packetization
Sendout
Sample
Samplecounter
Bufferfull
Buffernot full
Buffernot full
Samplefinish
Priority
Regular channel
Priority channelFIFO
Monitordata
Monitoraddress
Dest.address
Timestamp
TimerM
UX
VCO
Freq-divider
Controller block
Digital Counter
T/H sensor-2
T/H sensor-1
T/H sensor-N
Select
Track/Hold
[1] B. Datta and W. Burleson, “Low-Power, Process-Variation Tolerant On-Chip Thermal Monitoring using Track and Hold Based Thermal Sensors,” in Proc. ACM Great Lakes Symposium on VLSI, pp. 145-148, 2009.

9
MNoC area with differing router parameters
Data width (bits)
Input buffer size
Gate count per
router
8 4 15017
8 8 15234
10 4 15505
10 8 15763
12 4 17902
12 8 18196
14 4 18871
14 8 19222
Total MNoC area for different buffer sizes and data widths at 65nm
0
0.25
0.5
0.75
1
1.25
1.5
1.75
2
2.25
6 8 10 12 14 16 18 20
Data width in bits
Are
a (
mm
2)
2
4
8
16
Buffer size
• Desirable to minimize interconnect data width to just meet latency requirements
• Most of router area consumed by data path– Each delay monitor generates 12 bit data + 6 bit header

10
Data Width Effect on Latency
Regular channel latencies for different data widths for buffer size = 4
0
500
1000
1500
2000
2500
3000
3500
4000
4500
0 100 200 300 400
Cycles between injection
Ne
two
rk l
ate
ncy
(C
lk c
ycle
s)
8
10
12
14
16
18
Bit width
Priority Channel latencies for different data widths for buffer size = 4
0
50
100
150
200
250
300
350
400
0 100 200 300
Cycles between injectionN
etw
ork
late
ncy
(Clk
cyc
les)
8
10
12
14
16
18
Bit width
• Regular channel latency (e.g. 100 cycles) tolerable for low priority data • Priority channel provides fast path for critical data (20 cycles)

11
NoC and MNoC Architectures• A shared memory multicore based on Tile64 [1] and TRIPS
OCN [2]– 4×4 mesh as in Tile64– 256 bit data width– 2 flits buffer size
• Monitors in the multicore system– Thermal monitor (1/800 injection rate)– Delay monitor (around 1/200 injection rate)
• MNoC configuration from the suggested design flow– 4×4 MNoC – 24-bit flit width– 2 virtual channels– 2 flits buffer size
[1] S. Bell, et al, “TILE64 Processor: A 64-Core SoC with Mesh Interconnect”, in the Proceedings of International Solid-State Circuits Conference, pp. 88-598, 2008.[2] P. Gratz, C. Kim, R. McDonald, S. Keckler and D. Burger, “Implementation and Evaluation of On-Chip Network Architectures”, in the Proceedings of International Conference on Computer Design, pp. 477-484, Oct. 2007.

12
MNoC vs. Regular Network-on-chip• Network-on-chip (NoC) is used in multi-cores• Why bother to use MNoC for monitor data?• Three cases
– NoC with MNoC – monitor data is transferred via MNoC. Inter-processor traffic (“application data”) in the multi-core NoC.
– MT-NoC (mixed traffic NoC) – All monitor and application traffic in four virtual channel (VC) NoC.
– Iso-NoC (isolated channel NoC) – monitor data in one VC. Application traffic in the remaining three VCs.
• Virtual channel: another lane on a road. Unfortunately only one lane in the intersections
13
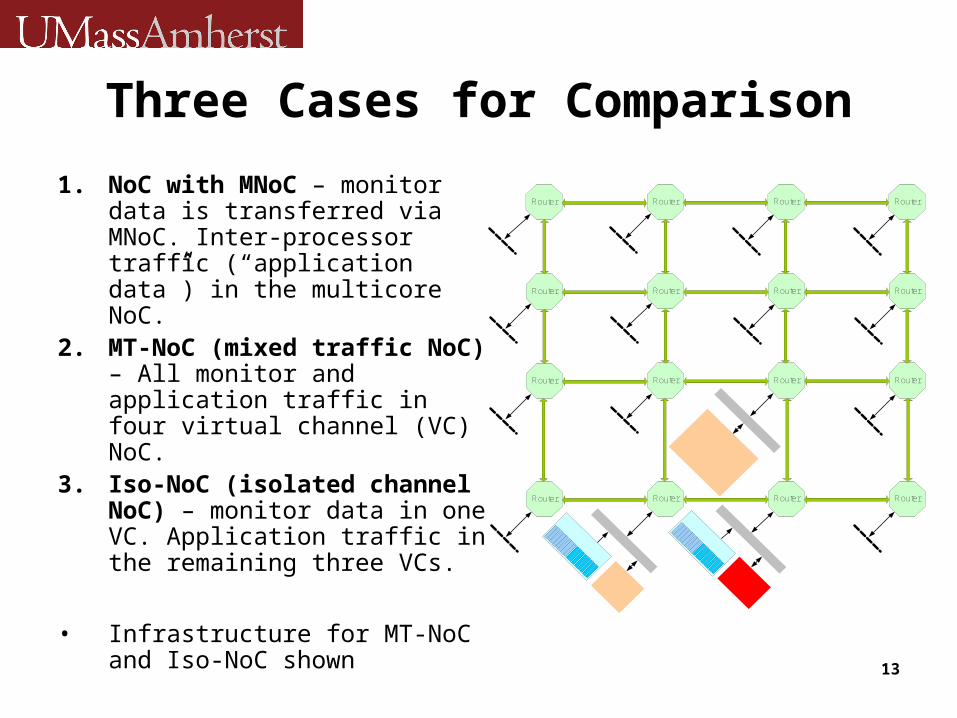
Three Cases for Comparison
1. NoC with MNoC – monitor data is transferred via MNoC. Inter-processor traffic (“application data”) in the multicore NoC.
2. MT-NoC (mixed traffic NoC) – All monitor and application traffic in four virtual channel (VC) NoC.
3. Iso-NoC (isolated channel NoC) – monitor data in one VC. Application traffic in the remaining three VCs.
• Infrastructure for MT-NoC and Iso-NoC shown
Router Router Router
Router Router Router
Router Router Router
Router
Router
Router
Router Router RouterRouter

14
Application Data Latency
1. NoC with MNoC: lowest latency2. Iso-NoC: highest latency3. MT-NoC: lower latency than case 3
• A standalone MNoC ensures low latency for application data

15
Monitor Data Latency
• Iso-NoC achieves low monitor data latency but has high application data latency
• A standalone MNoC ensures low latency for monitor data
• Modified Popnet network simulator

16
New On-chip Monitoring Requirement in Many-cores
• Many-core systems demand higher sensor data collecting and processing capability
• New remediation strategies in both local and global scales– Signature sharing for voltage droop compensation in the global
scale– Distributed and centralized dynamic thermal management (DTM)
• Three-dimensional (3D) systems add more complexity– Stacking memory layers on top of a core layer
• No previous on-chip monitoring infrastructures can address all these requirements– Simple infrastructures based on buses are not suitable– The MNoC infrastructure has no support for communications
between MEPs– Scaled to many-core systems with hundreds to a thousand cores?– Support for 3D systems?
17
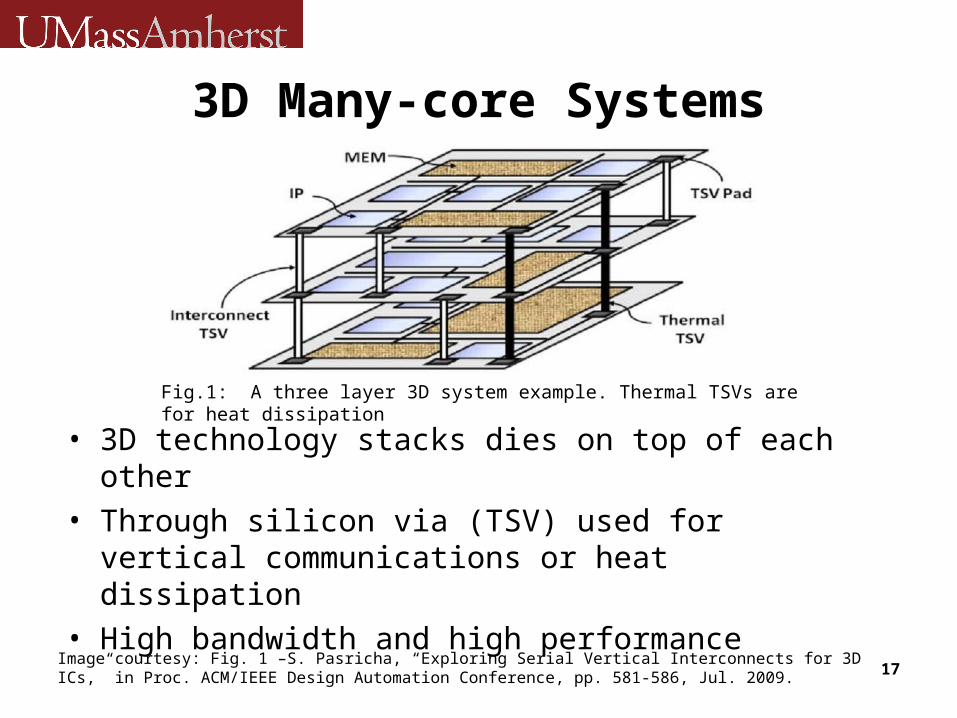
3D Many-core Systems
• 3D technology stacks dies on top of each other• Through silicon via (TSV) used for vertical
communications or heat dissipation• High bandwidth and high performance
Fig.1: A three layer 3D system example. Thermal TSVs are for heat dissipation
Image courtesy: Fig. 1 –S. Pasricha, “Exploring Serial Vertical Interconnects for 3D ICs,” in Proc. ACM/IEEE Design Automation Conference, pp. 581-586, Jul. 2009.

18
A Hierarchical Sensor Data Interconnect Infrastructure
• An example for a 36 core system
• One sensor NoC router per core
• Sensors are connected to sensor routers (similar to MNoC)
• Sensor routers send data to sensor data processors (SDPs)– Through the SDP routers – One SDP per 9 cores in
this example, may not be the optimal configuration
RR
R R
R
R
R R R
RR
R R
R
R
R R R
RR
R R
R
R
R
RR
R R
R
R
R R R
R R
SDPSDP
SDP SDP
Sensor router
SDP NoC router

19
A Hierarchical Sensor Data Interconnect Infrastructure (cont)
• SDP routers are connected by another layer of network, SDP NoC
• More traffic pattern are supported in the SDP NoC
• Both the sensor NoC and the SDP NoC have low cost– Small data width (e.g.
24 bits)– Shallow buffers (4-8
flits)
RR
R R
R
R
R R R
RR
R R
R
R
R R R
RR
R R
R
R
R
RR
R R
R
R
R R R
R R
SDPSDP
SDP SDP
Sensor router
SDP NoC router
20
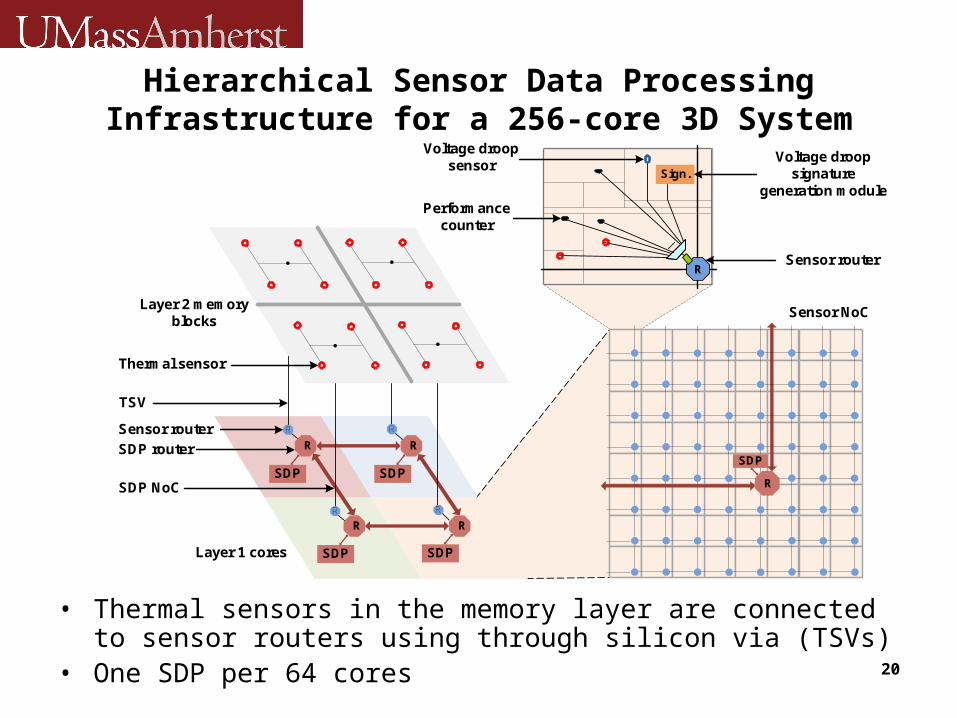
Hierarchical Sensor Data Processing Infrastructure for a 256-core 3D System
• Thermal sensors in the memory layer are connected to sensor routers using through silicon via (TSVs)
• One SDP per 64 cores
TSV
Layer 2 memory blocks
Layer 1 cores
R R
R R
SDP router
SDP NoC
SDP
Thermal sensor
RSensor router
R
Sign.
Performance counter
Voltage droop sensor
Voltage droop signature
generation module
SDP SDP
SDP SDP
Sensor router R R
R R
Sensor NoC

21
SDP Router Design
• SDP routers received packets from sensor routers
• SDP routers also support broadcast– Send broadcast
packets to SDP– Generate new
broadcast packets when necessary
• Two virtual channels supported
SDP
LC
LC
LC
LC
Switch
LC
LC
LC
LC
De-packetizationLC
Packetization
De-packetization
LC
LC
LC
LC
Routing and Arbitration
Broadcast Controller
Sensor NoC input
channels
SDP NoC input
channels
SDP NoC
output channels
LC Link Controller
Priority Virtual
Channel
Regular Virtual
Channel
Sensor NoC packet buffer

22
Packet Transmission in the SDP NoC
• Traffic in the sensor NoC is similar to MNoC
• SDP NoC supports more complicated traffic patterns– Hotspot, a global scale DTM [4]– Broadcast, a voltage droop
signature sharing method [5]• Hotspot traffic is supported by
most routing algorithms• A SDP router design that
supports a simple broadcast strategy with a broadcast controller– Send packet vertically first– Then send horizontally
(0,1) (3,1)(2,1)(1,1)
(0,0) (3,0)(2,0)(1,0)
(0,3) (3,3)(2,3)(1,3)
(0,2) (3,2)(2,2)(1,2)
[4] R. Jayaseelan, et. al., “A Hybrid Local-global Approach for Multi-core Thermal Management,” in Proc. International Conf. on Computer-Aided Design, pp. 314-320, Nov. 2009. [5] J. Zhao, et al., “Thermal-aware Voltage Droop Compensation for Multi-core Architectures,” in Proc. Great Lakes Symposium on VLSI, pp. 335-340, May 2010.
23
Experimental Approach
• Our infrastructure is simulated using a heavily modified Popnet simulator
• Simulated for 256, 512 and 1024 core systems– Packet transmission delay
• Synthesized using 45 nm technology– Hardware cost
• On-chip sensors– Thermal sensors– Performance counters– Voltage droop sensors– Signature-based voltage droop predictors
• A system level experiment is performed using the modified Graphite many-core simulator– Run-time temperature is modeled
24
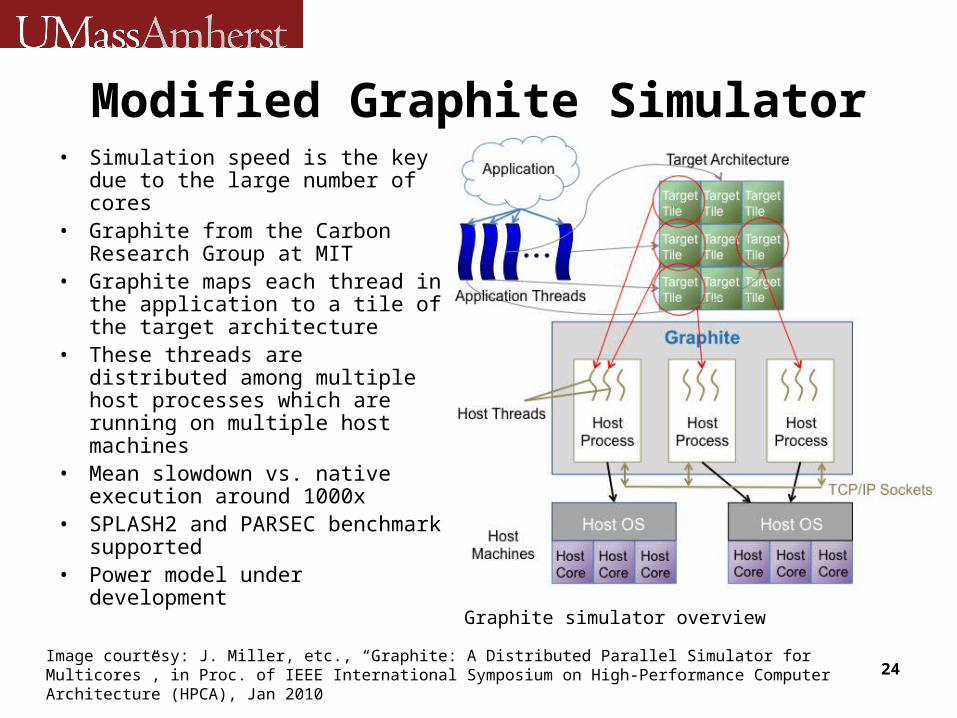
Modified Graphite Simulator• Simulation speed is the key
due to the large number of cores
• Graphite from the Carbon Research Group at MIT
• Graphite maps each thread in the application to a tile of the target architecture
• These threads are distributed among multiple host processes which are running on multiple host machines
• Mean slowdown vs. native execution around 1000x
• SPLASH2 and PARSEC benchmark supported
• Power model under development
Graphite simulator overview
Image courtesy: J. Miller, etc., “Graphite: A Distributed Parallel Simulator for Multicores”, in Proc. of IEEE International Symposium on High-Performance Computer Architecture (HPCA), Jan 2010
25
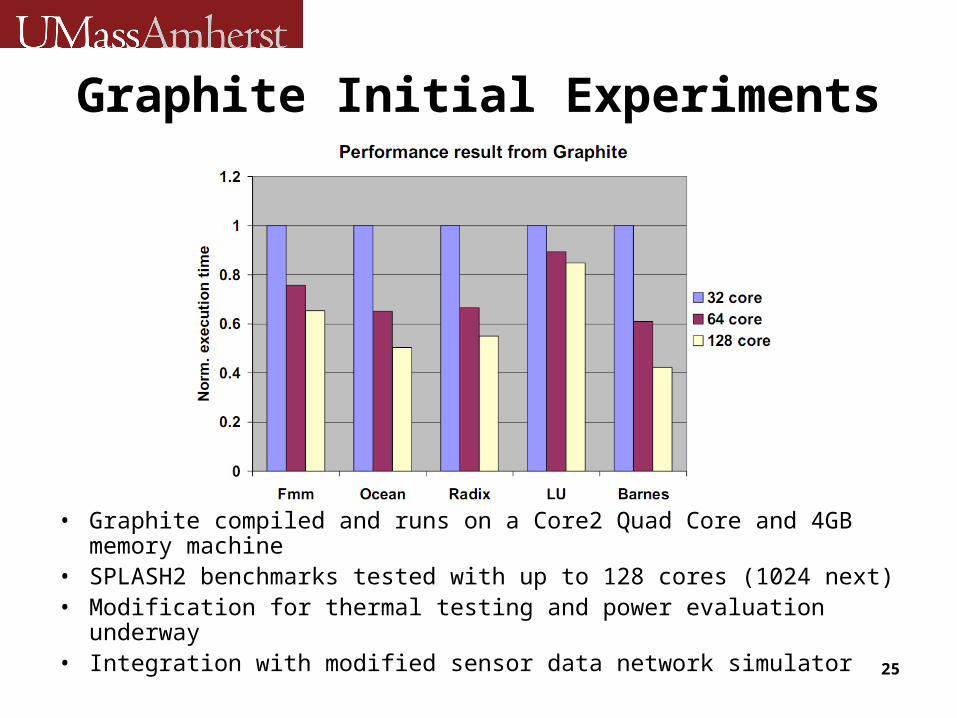
Graphite Initial Experiments
• Graphite compiled and runs on a Core2 Quad Core and 4GB memory machine
• SPLASH2 benchmarks tested with up to 128 cores (1024 next)• Modification for thermal testing and power evaluation underway• Integration with modified sensor data network simulator
26
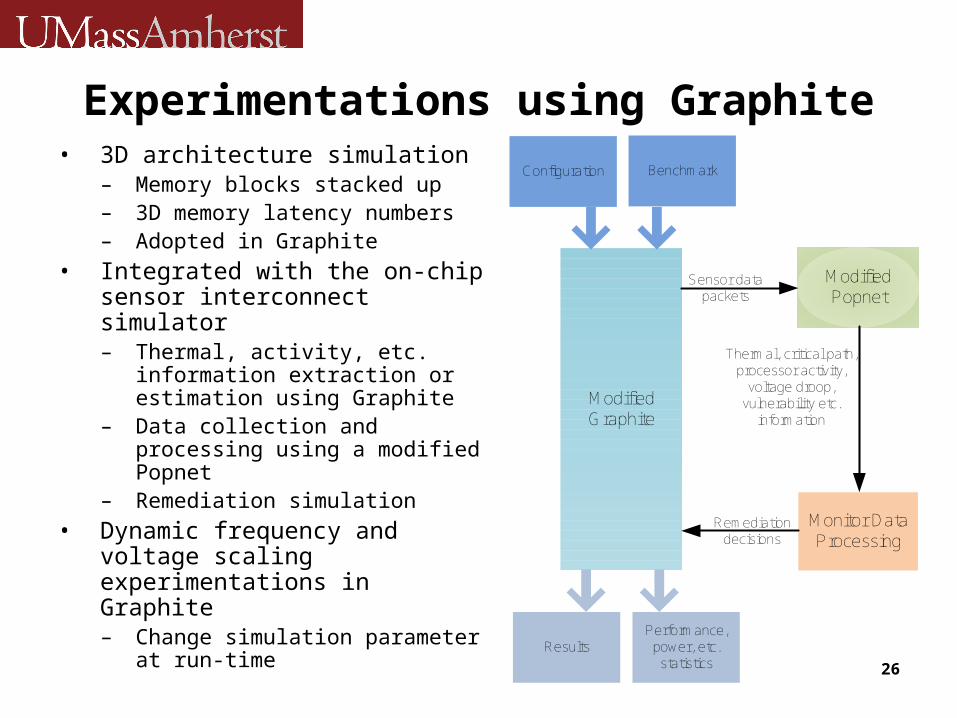
Experimentations using Graphite• 3D architecture simulation
– Memory blocks stacked up– 3D memory latency numbers– Adopted in Graphite
• Integrated with the on-chip sensor interconnect simulator– Thermal, activity, etc.
information extraction or estimation using Graphite
– Data collection and processing using a modified Popnet
– Remediation simulation• Dynamic frequency and
voltage scaling experimentations in Graphite– Change simulation
parameter at run-time
Modified Graphite
Modified Popnet
Monitor Data Processing
Sensor data packets
Thermal, critical path, processor activity,
voltage droop, vulnerability etc.
information
Remediation decisions
Configuration
ResultsPerformance,
power, etc. statistics
Benchmark

27
Comparison against a Flat Sensor NoC Infrastructure
• Simulated using a modified Popnet, one SDP per 64 core is chosen, sensor data from the memory layer included
• Compare the latency of our infrastructure versus a flat sensor NoC infrastructure– Only sensor routers, no SDP NoC– Packets between SDPs (inter-SDP) are transmitted using sensor routers
• Our infrastructure scientifically reduce the inter-SDP (>82%) and total latency (>59%)
• Hardware cost increase with respect to the flat sensor NoC less than 6%
• Our infrastructure provides higher throughput versus the flat sensor NoC
Core and SDP num.
Latency type Flat sensor NoC (cycles)
Our method (cycles)
Latency reduction w.r.t. flat sensor NoC (%)
256 core (4 SDP)
Inter-SDP 45.43 7.85 82.72
Total 62.82 25.24 59.82
512 core (8 SDP)
Inter-SDP 67.57 11.37 83.17
Total 84.96 28.76 66.15
1024 core (16 SDP)
Inter-SDP 90.36 14.38 84.08
Total 107.75 31.77 70.52

28
Core to SDP Ratio Experiment
• One SDP per 64 cores is chosen– Low latency– Moderate hardware cost, less than 6% versus only the sensor
NoC
Core num.
Core/ SDP ratio
SDP num.
Sensor NoC
latency
SDP latency
Total latency
SDP NoC to sensor NoC HW cost ratio
(%)
256 32 8 12.25 11.01 23.26 7.94
64 4 17.31 7.72 25.03 4.19
128 2 24.14 5.25 29.39 1.72
512 32 16 12.25 13.37 25.62 8.78
64 8 17.31 11.42 28.73 4.99
128 4 24.14 7.88 32.02 2.65
1024 32 32 12.25 20.87 33.12 9.20
64 16 17.31 15.48 32.79 5.46
128 8 24.14 11.84 35.98 3.15

29
Throughput Comparison
• Compare the throughput of the inter-SDP packet transmission– Same throughput for packet transmission in the sensor NoC
• Our infrastructure provides higher throughput versus the flat sensor NoC

30
Signature based Voltage Droop Compensation
• Event history table content is compared with signatures at run-time to predict emergencies– Large table -> more
accurate prediction
• Signature table– Larger table -> higher
performance– Larger table -> higher cost
• Extensively studied in Reddi, et al [1]
Event History Table
To MNoCRouter
TLB L1 Cache
Shared L2Cache
Page Table
SharedMemory
Processor
IF ID EX MEM WB
Signature TableFrequencyThrottling
Control Flowinstruction
Pipeline Flush
DTLB miss
DL1 miss
L2 miss
Match
Voltage DroopMonitors
Capture
Compare
[1] V. Reddi, M. Gupta, G. Holloway, M. Smith, G. Wei and D. Brooks. “Voltage emergency prediction: A signature-based approach to reducing voltage emergencies,” in Proc. International Symposium on High-Performance Computer Architecture, pp. 18-27, Feb. 2009.

31
A Thermal-aware Voltage Droop Compensation Method with Signature Sharing
• High voltage droops cause voltage emergencies
• Voltage droop prediction based on signatures– Signatures: footsteps of a serial of
instructions– Prediction of incoming high voltage
droops• Signature based method in single
core systems• Initial signature detection involves
performance penalty
• Idea 1: Signature sharing across cores
• Fewer penalties for initial signature detection
Shared Memory
L2 Cache
Processor
MEP
R
R
Shared Bus
R
R Router
MEP Monitor Executive Processor
MNoC
Processor
Signature Signature
ThermalMonitors
ThermalMonitors
VoltageDroop
Monitors
VoltageDroop
Monitors

32
Voltage Droop Signature Sharing in Multicore Systems
• 8 and 16 core systems simulated by SESC, 8 core results shown here
• Comparison between the signature sharing method and the local signature method
• Four benchmarks show significant reduction in signature number
• Performance benefit mainly come from lesser rollback penalty
Test bench
CaseSign. Num.
Sign. Num. reduction (%)
Water-spatial
Local only 18, 47472
Global sharing 5,167
Fmm Local only 83276
Global sharing 202
LU Local only 40,83862
Global sharing 15,655
Ocean Local only 271,17917
Global sharing 224,151
Test bench
Case Exec. Time (ms)
Exec. time reduction (%)
Water-spatial
Local only 14.59
2.44Global sharing
14.23
Fmm Local only 10.13
0Global sharing
10.13
LU Local only 17.20
4.48Global sharing
16.43
Ocean Local only 25.90
5.57Global sharing
24.46

33
A Thermal-aware Voltage Droop Compensation Method with Signature Sharing
(cont)
• Reduce system frequencies to combat high voltage droops– Previous research considers only one reduced frequency
• Our experiment show that voltage droop decreases as temperature increases with the same processor activity
• Idea 2: Choose different reduced frequencies according to temperature

34
Thermal-aware Voltage Compensation Method for Multi-core Systems
• 5 frequency cases, normal frequency is 2GHz
• Case 1 uses one reduced frequency
• Cases 2, 3 and 4 best show the performance benefits of the proposed method
• Performance benefits 5% on average (8 core and 16 core systems) [9]
Temp. range
Frequency table case
1 2 3 4 5
20-40°C 1GHz
1GHz 1GHz 1GHz 1.3GHz
40-60°C 1GHz
1GHz 1GHz 1.3GHz
1.3GHz
60-80°C 1GHz
1GHz 1.3GHz
1.3GHz
1.3GHz
80-100°C 1GHz
1.3GHz
1.3GHz
1.3GHz
1.3GHz
[9] J. Zhao, B. Datta, W. Burleson and R. Tessier, “Thermal-aware Voltage Droop Compensation for Multi-core Architectures,” in Proc. of ACM Great Lakes Symposium on VLSI (GLSVLSI’10), pp. 335-340, May 2010.
35
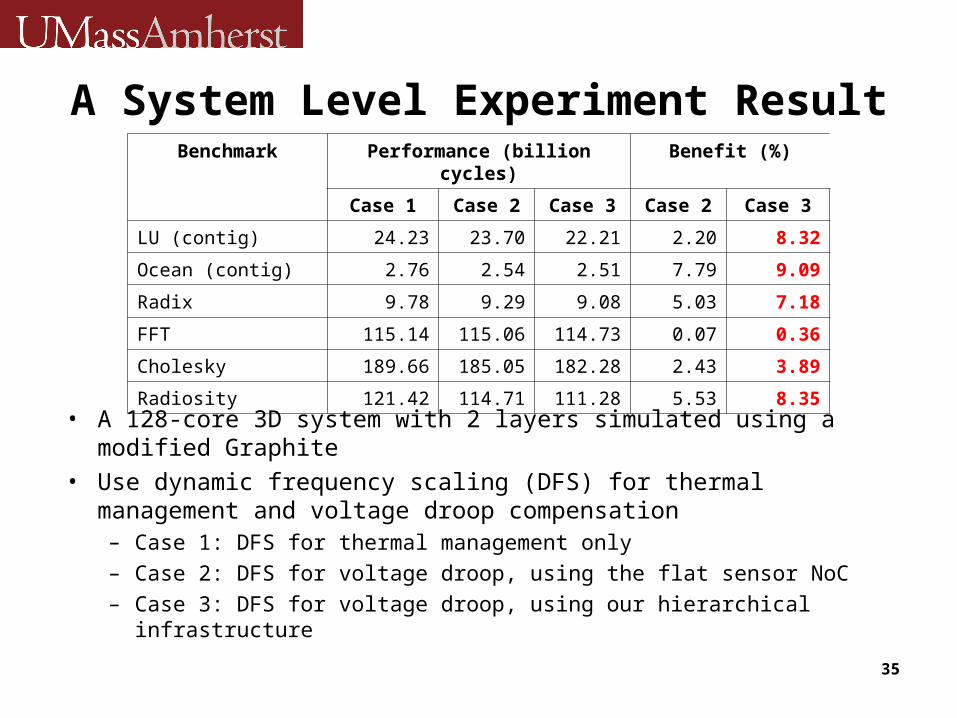
A System Level Experiment Result
• A 128-core 3D system with 2 layers simulated using a modified Graphite
• Use dynamic frequency scaling (DFS) for thermal management and voltage droop compensation– Case 1: DFS for thermal management only– Case 2: DFS for voltage droop, using the flat sensor NoC– Case 3: DFS for voltage droop, using our hierarchical infrastructure
Benchmark Performance (billion cycles) Benefit (%)
Case 1 Case 2 Case 3 Case 2 Case 3
LU (contig) 24.23 23.70 22.21 2.20 8.32
Ocean (contig) 2.76 2.54 2.51 7.79 9.09
Radix 9.78 9.29 9.08 5.03 7.18
FFT 115.14 115.06 114.73 0.07 0.36
Cholesky 189.66 185.05 182.28 2.43 3.89
Radiosity 121.42 114.71 111.28 5.53 8.35

36
Conclusion• On-chip monitoring of temperature, performance,
supply voltage and other environmental conditions• New infrastructures for on-chip sensor data
processing for multi-core and many-core systems– The MNoC infrastructure– A hierarchical infrastructure for many-core systems.
Significant latency reduction (>50%) versus a flat sensor NoC
• New remediation strategies using dedicated on-chip monitoring infrastructures– A thermal-aware voltage droop compensation method with
signature sharing. Performance benefit 5% on average
• Other monitoring efforts– Sensor calibration

37
Publications1. J. Zhao, J. Lu, W. Burleson and R. Tessier, Run-time Probabilistic Detection of
Miscalibrated Thermal Sensors in Many-core Systems, in the Proceedings of the IEEE/ACM Design Automation and Test in Europe Conference, Grenoble, France, March 2013
2. J. Lu, R. Tessier and W. Burleson, Collaborative Calibration of On-Chip Thermal Sensors Using Performance Counters, in the Proceedings of the IEEE/ACM International Conference on Computer-Aided Design, San Jose, CA, November 2012
3. J. Zhao, R. Tessier and W. Burleson, “Distributed Sensor Processing for Many-cores,” in Proc. of ACM Great Lakes Symposium on VLSI (GLSVLSI’12), to appear, 6 pages, May 2012.
4. J. Zhao, S. Madduri, R. Vadlamani, W. Burleson and R. Tessier, “A Dedicated Monitoring Infrastructure for Multicore Processors,” in IEEE Transactions on Very Large Scale Integration Systems (TVLSI), vol. 19. no. 6, pp. 1011-1022, 2011.
5. J. Zhao, B. Datta, W. Burleson and R. Tessier, “Thermal-aware Voltage Droop Compensation for Multi-core Architectures,” in Proc. Great Lakes Symposium on VLSI (GLSVLSI'10), pp. 335-340, May 2010.
6. R. Vadlamani, J. Zhao, W. Burleson and R. Tessier, “Multicore Soft Error Rate Stabilization Using Adaptive Dual Modular Redundancy”, in Proc. Design, Automation and Test Europe (DATE'10), pp. 27-32, Mar. 2009.
7. S. Madduri, R. Vadlamani, W. Burleson and R. Tessier, A Monitor Interconnect and Support Subsystem for Multicore Processors, in the Proceedings of the IEEE/ACM Design Automation and Test in Europe Conference, Nice, France, April 2009.