ON A ROBUST FOUNDATION - Sasol | A ROBUST FOUNDATION Sasol Limited Audited inancial Results 2017...
28
SASOL LIMITED Audited Financial Results for the year ended 30 June 2017 ON A ROBUST FOUNDATION
-
Upload
nguyencong -
Category
Documents
-
view
219 -
download
2
Transcript of ON A ROBUST FOUNDATION - Sasol | A ROBUST FOUNDATION Sasol Limited Audited inancial Results 2017...

SASOL LIMITEDAudited Financial Results
for the year ended 30 June 2017
ON A ROBUST FOUNDATION

Sasol Limited Audited Financial Results 2017
Sasol Limited Group
SALIENT FEATURES
Sales volumes• Base Chemicals up 3% and Performance
Chemicals up 2%• Liquid fuels sales volumes down 2%
Strong operational performance across most of the value chain• Secunda Synfuels Operations volumes up 1%,
to a new record production level• Eurasian Operations volumes up 6%, highest
since 2015
Strong cost and cash performance• Cash fixed costs, in real terms, remained flat
for three consecutive years• Achieved R5,4 billion per annum of
sustainable savings from our Business Performance Enhancement Programme, a year earlier than planned
• Delivered cumulative capital conservation and cash savings from low oil Response Plan of R69,4 billion
Delivering on our stakeholder commitments• Invested R1,6 billion in skills and socio-
economic development• Over R7 billion spent on preferential
procurement from black-owned enterprises in South Africa
Audited Financial Resultsfor the year ended 30 June 2017
Sasol is an international integrated chemicals and energy company. Through our talented people, we use selected technologies to safely and sustainably source, produce and market chemical and energy products competitively to create superior value for our customers, shareholders and other stakeholders.
Safety Recordable Case Rate (RCR), excluding illnesses, improved to
0,28, regrettably five
fatalities
Lake Charles Chemicals Project
74% complete, capital
expenditure to date of US$7,5 billion
and tracking revised estimate
Core headline earnings up
6%reflects sustainable
operations
Headline earnings per share down 15% to
R35,15; earnings per share up 54% to R33,36 in line
with market consensus

Sasol Limited Audited Financial Results 2017 1
2017 2016
Contribution to group operating profit (%)
20172016
Contribution to group turnover (%)
Segment reportfor the year ended 30 June
Turnover Operating profit/(loss)R million R million
2015 2016 2017 Segment analysis 2017 2016 2015
20 859 21 186 23 046 Operating Business Units 4 310 (6 975) 1 173
15 687 16 975 18 962 ƫ Mining 3 725 4 739 4 343
5 172 4 211 4 084 ƫ Exploration and
Production International 585 (11 714) (3 170)
187 312 173 042 170 413 Strategic Business Units 26 843 29 831 45 448
75 800 64 341 64 772 ƫ Energy 11 218 14 069 22 52639 728 35 067 35 755 ƫ Base Chemicals 5 625 4 486 10 20871 784 73 634 69 886 ƫ Performance Chemicals 10 000 11 276 12 714
221 108 516 ƫ Group Functions 552 1 383 (72)
208 392 194 336 193 975 Group performance 31 705 24 239 46 549
(23 126) (21 394) (21 568) Intersegmental turnover
185 266 172 942 172 407 External turnover

Sasol Limited Audited Financial Results 20172
Sasol Limited Group
Financial results overview1,3
Sasol delivered a strong business performance across most of the value chain, with our Secunda Synfuels Operations (SSO) reporting record volumes and our Eurasian Operations delivering their highest production volumes since 2015. However, continued volatility in the macro-economic environment, particularly the stronger rand and low oil price, has adversely impacted our financial performance.
Earnings attributable to shareholders for the year ended 30 June 2017 increased by 54% to R20,4 billion from R13,2 billion in the prior year. Headline earnings per share (HEPS) decreased by 15% to R35,15 and earnings per share (EPS) increased by 54% to R33,36 compared to the prior year. The prior year EPS was negatively impacted by the R9,9 billion partial impairment of our Canadian shale gas assets.
Core headline earnings² increased by 6% (R2,29 per share) compared to the prior year. The Sasol Limited Board (“the Board”) considers core headline earnings as an appropriate indicator of the sustainable operating performance of the group, as it adjusts for period close and once-off items as noted below.
Sasol’s headline earnings were impacted by the following notable once-off and period close items:
2017 2016
Headline earnings R35,15 R41,40Translation losses/(gains) (including foreign exchange contracts) arising from a stronger closing rand/US dollar market exchange rate at 30 June 2017 R2,70 (R0,86)Mark-to-market valuation of oil and foreign exchange derivatives using forward curves and other market factors at 30 June 2017 (R1,73) –Provision/(reversal of provision) for tax litigation matters R1,49 (R3,77)Impact of prolonged labour actions at Mining in the first half of the year R1,45 –
Core headline earnings R39,06 R36,77
Included in remeasurement items is a partial impairment of our US Gas-to-Liquids (GTL) project amounting to R1,7 billion (US$130 million) due to the uncertainty around the probability and timing of project execution and the reversal of a partial impairment of the Lake Charles Chemicals Project (LCCP) amounting to R0,8 billion
Joint President and Chief Executive Officer, Bongani Nqwababa said:Notwithstanding the volatile macro-economic environment in which we operate, Sasol delivered a resilient performance. This is testament to the robust foundation we have in place to position Sasol for long-term growth, since we are able to operate profitably and generate healthy free cash flows at oil prices of US$40/bbl. Our sound business fundamentals are further reflected in our record production volumes and earlier-than-anticipated realisation of the full Business Performance Enhancement Programme (BPEP) savings target. Our heightened focus on macro-economic risk mitigations to protect and strengthen our balance sheet and our ability to operate safe, reliable and sustainable operations positions us well for future value-based growth.
Joint President and Chief Executive Officer, Stephen Cornell said:Disciplined cost control, focused cash conservation and effective management of financial risks have enabled us to continue delivering shareholder value and achieving a competitive market position. These factors, integral to our DNA, attest to the underlying resilience of our business and our determination to provide shareholders with a world-class investment. To drive future growth, we will sustain this robust foundation through meticulous ongoing continuous improvements, while further enhancing our systems and capital allocation process. As we refine our long-term strategy, our objective is to ensure we have sufficient flexibility to deliver value-based growth under various scenarios. By identifying all opportunities that can contribute to increased total shareholder returns, Sasol is driving an exciting new era of growth for our shareholders and stakeholders.
Sasol Limited Audited Financial Results 2017 3
(US$65 million), which resulted from lower spot discount rates and the extension of the useful life of the project to 50 years.
The highlights of our operational performance can be summarised as follows:
Ʃ SSO increased production volumes by 1% to a record 7,83 million tons;
Ʃ Natref production volumes decreased by 5%. Planned plant shutdowns during the first half of the year contributed to a 3% decrease in production volumes and unplanned downtime during May 2017 led to a 2% reduction in production volumes;
Ʃ Our Eurasian Operations increased production volumes by 6% due to stronger product demand;
Ʃ ORYX GTL achieved a utilisation rate of 95%, compared to 81% in the prior year, which is higher than market guidance;
Ʃ Our Performance Chemicals business reported a 2% increase in sales volumes, which is at the upper end of our market guidance, mainly as a result of stronger demand and improved plant stability;
Ʃ Our Base Chemicals sales volumes increased by 3%, slightly below market guidance, due to extended shutdowns at our Chlor Vinyls and Polypropylene plants and a fire at a third party warehouse; and
Ʃ Liquid fuels sales volumes in our Energy Business decreased by 2% due to a greater portion of production volumes from SSO being allocated to our higher margin yielding chemical businesses and lower Natref production volumes. Excluding the effect of the Natref downtime and lower allocated volumes from SSO, our liquid fuels sales volumes increased by 1%.
The decrease in the effective corporate tax rate from 36,6% to 28,3% was mainly as a result of the R9,9 billion partial impairment of our Canadian shale gas assets in the prior year. The adjusted effective tax rate, excluding equity accounted investments, remeasurements and once-off items, is 26,5% compared to 28,2% in the prior year.
We have seen some recovery in global oil and product prices as average Brent crude oil prices were 15% higher compared to the prior year (average dated Brent was US$49,77/bbl for the year ended 30 June 2017 compared with US$43,37/bbl in the prior year). Despite softness in commodity chemical prices experienced at the start of the financial year, we have seen a steady increase in demand and robust margins in certain key markets. The average margin for our speciality chemicals business remains resilient, despite a margin squeeze in our ammonia business as a result of oversupply in global markets.
Excluding the effect of our hedging programme, the average rand/US dollar market exchange rate strengthened by 6% from R14,52 in 2016 to R13,61, and the closing rand/US dollar market exchange rate strengthened by 11% from R14,71 to R13,06. This resulted in translation losses of R2,3 billion on the valuation of the balance sheet compared to translation gains of R1,1 billion recognised in the prior year (including foreign exchange contracts).
We continued to deliver a strong cost performance and managed to contain our cash fixed costs to below inflation in nominal terms, despite the additional once-off costs incurred due to the Mining strike. Through our continued focus on cost control and the commitment of our people, we achieved our Business Performance Enhancement Programme (BPEP) sustainable savings exit run-rate target of R5,4 billion per annum in 2017, a year earlier than previous market guidance. We have now closed out our BPEP programme, having achieved the targeted sustainable savings. Going forward we are committed to further drive continuous improvement to identify opportunities to sustainably drive down costs and deliver improved returns to our shareholders and stakeholders.
Our comprehensive Response Plan (RP), to counter the effects of a low oil price by focusing on capital conservation and cash savings, has continued to yield positive results in line with our 2017 targets, despite margin contraction and the negative impact of a much stronger exchange rate. The RP realised capital conservation and cash savings of R32,3 billion in 2017, bringing our total cumulative cash conservation to R69,4 billion. The RP’s objective is to place the company in the best possible position to operate profitably in a US$40/bbl oil price environment and to proactively manage the balance sheet and our liquidity. We have increased our RP sustainable annual cash cost savings target from R2,5 billion to at least R3,0 billion by 2019,

Sasol Limited Audited Financial Results 20174
Sasol Limited Group Overview (continued)
in addition to the R5,4 billion sustainable savings from our BPEP. This takes our cumulative sustainable cost savings to R8,4 billion.
Actual capital expenditure, including accruals, amounted to R60,3 billion. This includes R36,8 billion (US$2,7 billion) relating to the LCCP. Our actual capital expenditure for the full year is below previous market guidance of R66 billion, largely due to the stronger exchange rate, re-phasing of the LCCP capital cash flow and active management of the capital portfolio.
During the current financial year, Sasol entered into a number of hedges to mitigate specific financial risks and provide protection against unforeseen movements in oil prices, interest rates, currency movements, and commodity and final product prices. Approximately 50% of the crude oil exposure was hedged with crude oil put options for 2017 and 2018 at a net price of ~US$48,15/bbl. A total net loss of R237 million (US$17 million) was recognised during the period. To manage the exposure to the US dollar, approximately 70% of the rand/US dollar exposure has been hedged with zero-cost collar instruments at a floor of ~R13,46 for 2018. A net gain of R1 608 million (US$118 million) was recognised during the period. Should appropriate hedges become available in the market at an acceptable cost, we will enter into additional hedges as mitigation against these financial risks.
Our net cash position decreased by 44%, from R52,2 billion in June 2016 to R29,3 billion as at 30 June 2017 mainly due to the funding of the LCCP and the effect of a stronger closing rand/US dollar exchange rate. Loans raised during the year amounted to R13,3 billion, mainly for the funding of our growth projects. We have sufficient liquidity in place to fund the LCCP and our business operations.
Cash generated by operating activities decreased by 19% to R44,1 billion compared with R54,7 billion in the prior year. This is largely attributable to purchases of crude oil options of R1,3 billion (US$103 million), increases in working capital as well as a stronger rand/US dollar exchange rate. Notwithstanding reduced cash flows, our balance sheet has the capacity to lever up, as we continue to execute our growth plans and return value to our shareholders. Accordingly, in support of our funding strategy, gearing increased to 27%, which is better than our previous market guidance of 30% to 35%. This provides us with additional headroom compared to our internal targets.
To manage the impact of price volatility and the lower oil price environment, the Board concluded that our internal gearing ceiling will remain at 44% until the end of the 2018 financial year. The net debt-to-EBITDA ratio is 1,13 times compared to 0,56 times in the prior year and is expected to remain below our target of 2,0 times. We actively manage our capital structure and funding plan to ensure that we maintain an optimum solvency and liquidity profile.
Our dividend policy is to pay dividends within a dividend cover range based on HEPS. Taking into account the current volatile macro-economic environment, capital investment plans, our cash conservation initiative, the current strength of our balance sheet, and the dividend cover range, the Board has declared a gross final dividend of R7,80 per share. The dividend cover was 2,8 times at 30 June 2017 (30 June 2016: 2,8 times).
¹ All comparisons to the prior year refer to the year ended 30 June 2016. Except for earnings attributable to shareholders and the RP cash conservation measures, all numbers are quoted on a pre-tax basis.
² Core headline earnings are calculated by adjusting headline earnings with once-off items, period close adjustments and depreciation and amortisation of significant capital projects, exceeding R4 billion which have reached beneficial operation and are still ramping up and share-based payments on implementation of BBBEE transactions. Once-off items relate to the impact of the prolonged labour actions at Mining as well as the Sasol Oil tax litigation matter. Period close adjustments in relation to the valuation of our derivatives at period end is to remove volatility from earnings as these instruments are valued using forward curves and other market factors at the reporting date and could vary from period to period. We believe core headline earnings is a useful measure of the group’s sustainable operating performance. However, this is not a defined term under IFRS and may not be comparable with similarly titled measures reported by other companies.
³ All non-GAAP measures (such as normalised operating profit, core headline earnings, adjusted effective tax rate, etc.) have not been audited and reported on by the company’s auditors.
4 Normalised operating profit is calculated by adjusting operating profit for translation effects relating to the closing exchange rate, valuation of hedges, remeasurement items, the reversal of the provision relating to Escravos (EGTL) in the prior year and the strike at Mining.

Sasol Limited Audited Financial Results 2017 5
Strong operational performance supported by sustained cost improvements1,3,4
Operating Business UnitsMining – uninterrupted supply to Secunda Synfuels Operations, however negatively impacted by strike actionOperating profit decreased by 21% to R3,7 billion compared to the prior year, primarily due to the impact of labour actions at our Secunda mining operations in the first half of the financial year. Notwithstanding the impact of labour actions, we delivered our full supply commitment of coal volumes to the integrated Sasol value chain through our own production and increased external coal purchases. SSO used additional gas during the strike period to limit the amount of coal required. The labour action resulted in additional once-off costs of R1 billion and external coal purchases of R0,4 billion to ensure continuous supply to SSO. The total cost amounts to R1,4 billion.
We are still ramping up our operations to achieve targeted production run-rates and flexibility in our operations. A business improvement programme to improve productivity and cost efficiency is currently underway. We expect to see our mines return to the targeted level of operational performance in the next 12 months. Due to the lower productivity, our normalised unit cost of production increased by 13% above inflation to R270/ton compared to the prior year. Our business improvement programme is further aimed at limiting these cost increases to inflation with a targeted unit cost of production between R260 – R270/ton for 2018.
Our export coal business benefited from higher global coal prices during the year; however a portion of the volumes were sent to SSO during the strike period.
Exploration and Production International – returning to profitability with focused management of the asset portfolioExploration and Production International (E&PI) recorded an operating profit of R585 million compared to an operating loss of R1,8 billion (excluding the impact of the partial impairment of our Canadian shale gas operations of R9,9 billion) in the prior year. This result was achieved through focused management of the asset portfolio and strict cost control. Operating profit includes a translation gain of R337 million versus a translation loss of R695 million in the prior year.
Operating profit from our Mozambican producing operations increased to R2,0 billion from R1,1 billion in the prior year, mainly due to a 2% increase in gas production volumes and the net positive impact of foreign currency translations.
Our Gabon asset recorded an operating profit of R295 million compared to an operating loss of R994 million in the prior year, mainly due to higher sales prices, the partial reversal of an impairment of R197 million and lower depreciation charges. This was offset by an 18% decrease in production volumes resulting from the deferral of drilling activities in line with our RP cash conservation initiatives.
Our Canadian shale gas asset in Montney generated a lower operating loss of R746 million, compared to an operating loss of R1,1 billion (excluding the impact of a partial impairment of R9,9 billion) in the prior year. Our Canadian gas production volumes increased by 6% compared to the prior year, mainly due to completion activities on existing wells. There were no drilling rigs in operation during the year in line with our RP cash conservation initiatives.

Sasol Limited Audited Financial Results 20176
Sasol Limited Group Overview (continued)
Strategic Business UnitsPerformance Chemicals – increased sales volumes, resilient margins Operating profit of R10 billion increased by 2% on a normalised basis and decreased by 11% in absolute terms compared to the prior year, mainly as a result of significantly lower margins on ammonia due to lower market prices, the impact of a stronger rand and a partial impairment of R527 million (US$38,4 million) relating to our US Phenolics cash generating unit.
Sales volumes increased by 2% compared to the prior year mainly due to an increase of 2% in Organics volumes. Our Fischer-Tropsch Wax facility in South Africa continues to ramp up and produced 92 thousand tons (kt) of hard wax in 2017, which is in line with our forecast. These additional wax volumes were offset by lower volumes from our European wax facility due to reduced demand.
The European organics products benefited from improved volumes and margins resulting from favourable market conditions. Our US assets benefited from higher ethylene sales prices during the first half of the financial year, but subsequently came under pressure as a result of reduced market prices. Cash fixed costs remained below inflation for the year.
Base Chemicals – increased sales volumes, stronger rand adversely impacted profitabilityOperating profit increased by 25% to R5,6 billion compared to the prior year and our operating margin increased from 13% to 16%.
Our normalised operating profit of R5,1 billion is at the mid-point of our previous market guidance, but is 13% lower compared to the prior year. This is largely due to the stronger exchange rate, which negatively impacted earnings by R2,5 billion in 2017.
Sales volumes increased by 3% mainly as a result of higher volumes from SSO and improved production due to the commissioning of the C3 Expansion project in the prior year. The US dollar basket price of our commodity chemicals improved by 6% compared to the prior year, but this was negated by the stronger rand/US dollar exchange rate. Cash fixed costs, normalised for new business set-up costs and higher costs resulting from the increased ratio of chemicals volumes from SSO, were contained well within inflation.
Energy – strong cost performance, margins remained robust Operating profit, including equity accounted earnings, of R11,2 billion decreased by R2,9 billion or 20% compared to the prior year. Normalised operating margins improved by 1% to 21% in 2017.
Normalised operating profit increased by 5% mainly due to higher crude oil prices, solid production performance of ORYX GTL, further positive contributions from our BPEP and RP initiatives, partially negated by a 19% decrease in petrol differentials, stronger rand/US dollar exchange rates and lower liquid fuel sales volumes. In nominal terms, our cash fixed costs increase was contained to less than 1%, well below inflation, due to strict cost control and lower costs allocated from SSO.
Gas sales volumes were 2% lower compared to the prior year mainly due to lower market demand. Our share of power produced at the Central Térmica de Ressano Garcia (CTRG) joint operation in Mozambique amounted to 658 gigaWatt-hours of electricity, 1% higher than the prior year.
ORYX GTL delivered an excellent production performance with an average utilisation rate of 95%, while maintaining a world class safety recordable case rate of zero. ORYX GTL contributed R839 million to operating profit with volumes increasing by 16% compared to the prior year. In Nigeria, Escravos GTL resumed operations after completion of the scheduled maintenance programme with both trains running as expected. The plant is expected to ramp up towards design capacity during the year.
Sasol Limited Audited Financial Results 2017 7
Advancing projects to enable future growth We are encouraged by the headway we are making in delivering on our project pipeline:
Ʃ Growing our footprint in North America: Ʃ Overall construction on the LCCP continues on all fronts, with most engineering and procurement
activities nearing completion. At 30 June 2017, capital expenditure amounted to US$7,5 billion, and the overall project completion was 74%. The total forecasted capital cost for the project remains within the approved US$11 billion budget and project progress is tracking the approved schedule. This budget includes a contingency which, measured against industry norms for this stage of project completion, is considered sufficient to effectively complete the project to beneficial operation (BO) within the approved budget. Various savings opportunities have been identified and are continuously being implemented to mitigate project risks. Although unplanned event-driven risks may still impact the execution and cost of the project, we are confident that the remaining construction, procurement, execution and business readiness risks can be managed within the budget. We continue to monitor the economics of the project against the backdrop of a challenging macro-economic environment. We rely extensively on the views of independent market consultants in formulating our views on our long-term assumptions. Their views differ significantly, from period to period, which again is indicative of the volatility in the market. For these reasons, the internal rate of return (IRR) for the LCCP, based on these different sets of price assumptions, varies between a range of returns which is both higher and lower than our weighted average cost of capital (WACC). At spot market prices, using the last quarter of 2017 as a reference, the IRR is between 8% to 8,5%. We are of the view that limited structural changes have occurred to market fundamentals since February 2017, when we last published the expected long-term IRR of the project, hence, based on our internal assessment, we are of the view that the IRR is in a range of 7% to 8% (Sasol WACC at 8% in US$ terms) based on conservative ethane prices. The cracker, however, remains cost competitive and is at the lower end of the cost curve for ethylene producers. We will continue to focus on factors that we can control, which are progressing the cost and schedule of the project according to plan. The updated economics, earnings profile, capital spend and sensitivities are detailed in the Analyst Book available on our website, www.sasol.com.
Ʃ Construction of our 50% joint venture high-density polyethylene plant with Ineos Olefins and Polymers USA is essentially complete and we are in the commissioning phase with start-up on track for quarter four in calendar year 2017. The plant will be the largest bi-modal high density polyethylene (HDPE) manufacturing facility in the US (470kt per annum) and is expected to produce some of the most cost competitive performance resins based on InnoveneTM S technology. The market conditions continue to be favourable with low feedstock cost and strong polyethylene market demand.
Ʃ Focusing on our asset base in Southern Africa: Ʃ Our strategic R14 billion mine replacement programme, which will ensure uninterrupted coal supply
to SSO in order to support Sasol’s strategy to operate its Southern African facilities until 2050, is nearing completion. Phase 2 of the Impumelelo Colliery project commenced during the first half of the 2016 calendar year and is on track to be completed within budget of R0,9 billion, late in the 2019 calendar year.
Ʃ The development of the Production Sharing Agreement (PSA) licence area in Mozambique remains on budget and schedule. We have successfully drilled and tested four oil wells and two gas wells, and captured 3D seismic over parts of the PSA. Gas reserves look promising and in line with expectations. We are now anticipating oil production between the mid to lower end of the range anticipated in the Field Development Plan. The surface facilities design and oil field development plan are being optimised in line with the lower volumes, and it is anticipated that substantial capital savings will be realised.

Sasol Limited Audited Financial Results 20178
Sasol Limited Group Overview (continued)
Maintaining our focus on sustainable value creation We continued to deliver on our broader sustainability and community contributions during the year:
Ʃ Safety remains a top priority for Sasol. Regrettably, we experienced the loss of five of our colleagues during the year. Our thoughts remain with our colleagues’ families and friends. Our safety RCR for employees and service providers, excluding illnesses, improved to 0,28 at 30 June 2017 (0,29 as at 30 June 2016). We retain our focus on safety and strive for zero harm.
Ʃ During the year, we invested R1,6 billion in skills development and socio-economic development, which includes our Ikusasa programme, bursaries, learnerships and artisan training programmes. The Ikusasa programme focuses on education, health and wellbeing, infrastructure, and safety and security in the Secunda and Sasolburg regions. In line with our commitment to support our fenceline communities, we increased our investment in Secunda and Sasolburg by 54% to R128 million.
Ʃ While we support the transition to a lower-carbon economy, we are concerned that the proposed carbon tax in South Africa will diminish the country’s competitiveness. It also does not address the structural issues that lie at the heart of the country’s carbon intensity. The proposed design of the carbon tax creates substantial regulatory and investment uncertainty as there is insufficient clarity relating to the phases of the tax, especially post 2020. This is exacerbated by the fact that the carbon tax is not aligned with the carbon budget system which is currently in the trial phase of implementation. Sasol continues to engage with the South African government on these policy issues.
Ʃ To ensure our ongoing compliance with new air quality regulations in South Africa, Sasol applied for certain postponements to manage our short-term challenges relating to the compliance timeframes. We have received decisions on our initial postponement applications from the National Air Quality Officer, which, while aligned with our requests, imposed stretched targets reflected in our atmospheric emission licences. In some cases shorter postponements were granted and further applications have been made to extend compliance timeframes in line with our committed environmental roadmaps.
Ʃ We continue to measure our comprehensive climate change response in accordance with our key performance indicators. Our total greenhouse gas (GHG) emissions for the financial year 30 June 2017 is 67,6 million tons compared to 69,3 million tons for the prior year. Our GHG emissions intensity (measured in carbon dioxide equivalent per ton of production) is relatively constant at 3,66 due to lower production resulting from planned shutdowns. GHG targets in South Africa are being developed in conjunction with the South African government’s process for setting carbon budgets.
Ʃ The improvement in our utility Energy Intensity Index (EII) of 4,2% exceeded our internal target of 1% improvement for the year for our operations in South Africa. Including our international operations, we improved our EII by 1,67% from the previous financial year.
Ʃ During the year, we paid R35,6 billion in direct and indirect taxes to the South African government. Sasol remains one of the largest corporate taxpayers in South Africa, contributing significantly to the country’s economy.
Ʃ The revised Mining Charter was published on 15 June 2017. It is intended to ensure alignment between the BBBEE Act and the Mining Charter and introduces a number of new requirements which may have a significant impact on Sasol. Amongst others, it increases the Black Economic Empowerment (BEE) ownership targets from 26% to 30% and requires an additional payment of 1% of the turnover generated by new mining rights to its BEE shareholders. The Chamber of Mines applied to the High Court for an urgent interdict to suspend the implementation of the revised Mining Charter until such a time as an application for a judicial review of the revised Mining Charter has been dealt with. The Minister of Mineral Resources announced on 12 July 2017 not to implement the revised Mining Charter pending the completion of the litigation. Sasol is assessing the impact of the revised Mining Charter on its business.

Sasol Limited Audited Financial Results 2017 9
Business performance outlook* – strong production performance and cost reductions to continueThe current economic climate continues to remain highly volatile and uncertain. While oil price and foreign exchange movements are outside our control and may impact our results, our focus remains firmly on managing factors within our control, including volume growth, security of feedstock supply, cost optimisation, effective capital allocation, focused financial risk management and maintaining an investment grade credit rating.
We expect an overall strong operational performance for 2018, with:
Ʃ Base Chemicals US dollar product prices to recover during the year and our South African Base Chemicals sales volumes to be between 3% to 5% higher than the prior year; in addition our US high-density polyethylene plant will contribute an additional 80kt to 110kt during the second half of the year. Normalised operating profit is estimated to be between R3 billion to R5 billion;
Ʃ Performance Chemicals sales volumes, excluding merchant ethylene which will now be accounted for in Base Chemicals, to be between 2% to 3% higher, with average margins for the business remaining resilient;
Ʃ Liquid fuels sales volumes to be marginally below 60 million barrels due to planned shutdowns at Natref;
Ʃ Gas production volumes from the Petroleum Production Agreement to be between 114 bscf and 118 bscf;
Ʃ Average utilisation rate at ORYX GTL in Qatar to exceed 90%;
Ʃ Normalised cash fixed costs to remain in line with SA PPI;
Ʃ Cumulative capital conservation and cash flow contribution from our RP to be close to the upper end of our targeted range of R65 billion to R75 billion by the end of FY18;
Ʃ Capital expenditure, including capital accruals, of R59 billion for 2018 and R37 billion for 2019 as we progress with the execution of our growth plan and strategy. Capital estimates may change as a result of exchange rate volatility and other factors;
Ʃ Our balance sheet gearing up to a level of between 35% and 44%;
Ʃ Rand/US dollar exchange rate to range between R13,00 and R14,50; and
Ʃ Average Brent crude oil prices to remain between US$45/bbl and US$55/bbl.
* The financial information contained in this business performance outlook is the responsibility of the directors and in accordance with standard practice, it is noted that this information has not been audited and reported on by the company’s auditors.
Competition law complianceThe South African Competition Commission is conducting proceedings against various petroleum products producers, including Sasol. The Competition Commission has finalised a market inquiry in the South African LPG market and Sasol is in the process of implementing the Commission’s recommendations. We continue to interact and co-operate with the South African Competition Commission in respect of the areas that are subject to the Commission’s investigations. To the extent appropriate, further announcements will be made in future.

Sasol Limited Audited Financial Results 201710
Sasol Limited Group Overview (continued)
Tax litigation and contingencyThe South African Revenue Service (“SARS”) has issued revised assessments for Sasol Oil (Pty) Ltd (“Sasol Oil”) relating to a dispute around its international crude oil procurement activities for the 2005 to 2012 tax years. These revisions could result in potential adjustments to the company’s taxable income and an additional tax liability including interest and penalties of approximately R1,2 billion for the periods 2005 to 2014. Sasol Oil has co-operated fully with SARS during the course of the audit related to these assessments. SARS' decisions to suspend the payment of this disputed tax for the periods 2005 to 2012 currently remain in force. The litigation process in the Tax Court, relating to the international crude oil procurement activities for the 2005 to 2007 years of assessment was concluded and judgement was delivered on 30 June 2017 in favour of SARS. As a result, a liability of R1,2 billion has been recognised in the annual financial statements in respect of the 2005 to 2014 matters that remain the subject of the ongoing litigation. Sasol Oil, in consultation with its tax and legal advisors, does not support the basis of the judgement and issued a Notice of Intention to Appeal to the Supreme Court of Appeal on 31 July 2017. The Tax Court granted Sasol Oil's application for leave to appeal to the Supreme Court of Appeal on 14 August 2017.
SARS has notified Sasol Oil of its intention to place on hold the field audit relating to this issue for the 1999 to 2004 tax years pending the outcome of the litigation. As a result of the judgement handed down on 30 June 2017, a possible obligation may arise from the field audit, which is regarded as a contingent liability.
In addition, there could be a potential tax exposure of R11,6 billion for the periods 2013 to 2014 on varying tax principles relating to the aforementioned activities. Supported by its specialist tax and external legal advisors, Sasol Oil disagrees with SARS' assessment for 2013 and 2014 periods. Accordingly, Sasol Oil has submitted an objection to the revised assessments and requested suspension of payment. Sasol Oil and SARS have come to a resolution with regards to the request for suspension of payment, resulting in SARS suspending payment for the significant majority of the disputed tax. Further based on the outcome of the Tax Court judgement, a possible obligation may arise for the tax years subsequent to 2014, which could give rise to a further contingent liability at 30 June 2017.
Change in directors Ms GMB Kennealy and Ms ME Nkeli were appointed as Non-executive Directors with effect from 1 March 2017.
Declaration of cash dividend number 76A final gross cash dividend of South African 780 cents per ordinary share (30 June 2016 – 910 cents per ordinary share) has been declared for the financial year ended 30 June 2017. The cash dividend is payable on the ordinary shares and the Sasol BEE ordinary shares. The Board is satisfied that the liquidity and solvency of the company, as well as capital remaining after payment of the dividend is sufficient to support the current operations for the ensuing year. The dividend has been declared out of retained earnings (income reserves). The South African dividend withholding tax rate is 20%. At the declaration date, there are 651 439 446 ordinary (including 8 809 886 treasury shares), 25 547 081 preferred ordinary and 2 838 565 Sasol BEE ordinary shares in issue. The net dividend amount payable to shareholders who are not exempt from the dividend withholding tax, is 624 cents per share, while the dividend amount payable to shareholders who are exempt from dividend withholding tax is 780 cents per share.

Sasol Limited Audited Financial Results 2017 11
The salient dates for holders of ordinary shares and Sasol BEE ordinary shares are:
Declaration date Monday, 21 August 2017
Last day for trading to qualify for and participate in the final dividend (cum dividend)
Tuesday, 5 September 2017
Trading ex dividend commences Wednesday, 6 September 2017
Record date Friday, 8 September 2017
Dividend payment date (electronic and certificated register) Monday, 11 September 2017
The salient dates for holders of our American Depository Receipts are1:
Ex dividend on New York Stock Exchange (NYSE) Wednesday, 6 September 2017
Record date Friday, 8 September 2017
Approximate date for currency conversion Tuesday, 12 September 2017
Approximate dividend payment date Thursday, 21 September 2017
1 All dates are approximate as the NYSE sets the record date after receipt of the dividend declaration.
On Monday, 11 September 2017, dividends due to certificated shareholders on the South African registry will either be electronically transferred to shareholders’ bank accounts or, in the absence of suitable mandates, dividend cheques will be posted to such shareholders. Shareholders who hold dematerialised shares will have their accounts held by their CSDP or broker credited on Monday, 11 September 2017. Share certificates may not be dematerialised or rematerialised between 6 September 2017 and 8 September 2017, both days inclusive.
On behalf of the Board
Mandla Gantsho Bongani Nqwababa Stephen Cornell Paul VictorChairman Joint President and Chief
Executive OfficerJoint President and Chief Executive Officer
Chief Financial Officer
Sasol Limited
18 August 2017

Sasol Limited Audited Financial Results 201712
Sasol Limited Group
Income statementfor the year ended 30 June
2015 2016 2017 2017 2016 2015US$m* US$m* US$m* Rm Rm Rm
16 181 11 911 12 668 Turnover 172 407 172 942 185 266
(7 002) (4 912) (5 249)Materials, energy and consumables used (71 436) (71 320) (80 169)
(528) (476) (471) Selling and distribution costs (6 405) (6 914) (6 041)(666) (582) (636) Maintenance expenditure (8 654) (8 453) (7 628)
(1 930) (1 647) (1 794) Employee-related expenditure (24 417) (23 911) (22 096)
(48) (20) (36)Exploration expenditure and feasibility costs (491) (282) (554)
(1 185) (1 127) (1 190) Depreciation and amortisation (16 204) (16 367) (13 567)(866) (625) (922) Other expenses and income (12 550) (9 073) (9 912)
(84) 10 (88) Translation (losses)/gains** (1 201) 150 (959)
(782) (635) (834)Other operating expenses and income (11 349) (9 223) (8 953)
(70) (888) (119) Remeasurement items (1 616) (12 892) (807) 179 35 79 Equity accounted profits net of tax 1 071 509 2 057
4 065 1 669 2 330 Operating profit 31 705 24 239 46 549 112 125 115 Finance income 1 568 1 819 1 274
(195) (161) (240) Finance costs (3 265) (2 340) (2 230) 3 982 1 633 2 205 Profit before tax 30 008 23 718 45 593(1 260) (598) (624) Taxation (8 495) (8 691) (14 431) 2 722 1 035 1 581 Profit for the year 21 513 15 027 31 162
Attributable to 2 595 911 1 497 Owners of Sasol Limited 20 374 13 225 29 716
127 124 84Non-controlling interests in subsidiaries 1 139 1 802 1 446
2 722 1 035 1 581 21 513 15 027 31 162
US$ US$ US$ Earnings per share Rand Rand Rand
4,25 1,49 2,45 Basic earnings per share 33,36 21,66 48,714,25 1,49 2,44 Diluted earnings per share 33,27 21,66 48,70
* Supplementary non-IFRS information. US dollar convenience translation, converted at average exchange rate of R13,61/US$1 (30 June 2016 – R14,52/US$1; 30 June 2015 – R11,45/US$1).
** A loss of R1 107 million (30 June 2016 – R920 million gain; 30 June 2015 – R156 million loss) arising from foreign exchange contracts (FECs) has been reclassified from translation (losses)/gains, to other operating expenses and income, in accordance with the recognition of other derivative gains and losses.
The summarised financial statements are presented on a consolidated basis.
Sasol Limited Audited Financial Results 2017 13
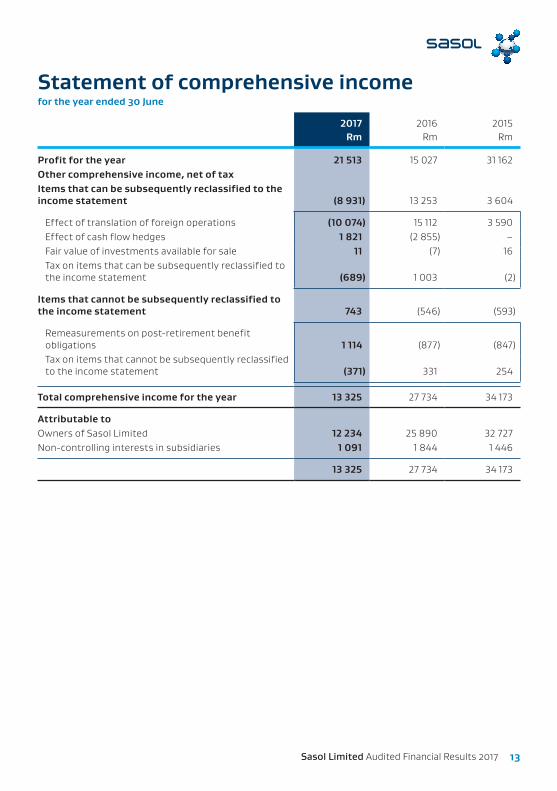
Statement of comprehensive income for the year ended 30 June
2017 2016 2015 Rm Rm Rm
Profit for the year 21 513 15 027 31 162Other comprehensive income, net of tax Items that can be subsequently reclassified to the income statement (8 931) 13 253 3 604
Effect of translation of foreign operations (10 074) 15 112 3 590Effect of cash flow hedges 1 821 (2 855) –Fair value of investments available for sale 11 (7) 16Tax on items that can be subsequently reclassified to the income statement (689) 1 003 (2)
Items that cannot be subsequently reclassified to the income statement 743 (546) (593)
Remeasurements on post-retirement benefit obligations 1 114 (877) (847)Tax on items that cannot be subsequently reclassified to the income statement (371) 331 254
Total comprehensive income for the year 13 325 27 734 34 173
Attributable to Owners of Sasol Limited 12 234 25 890 32 727Non-controlling interests in subsidiaries 1 091 1 844 1 446
13 325 27 734 34 173

Sasol Limited Audited Financial Results 201714
Sasol Limited Group
Statement of financial position at 30 June
2016 2017 2017 2016US$m* US$m* Rm Rm
Assets 10 541 12 157 Property, plant and equipment 158 773 155 0547 071 10 010 Assets under construction 130 734 104 011
182 181 Goodwill and other intangible assets 2 361 2 680892 904 Equity accounted investments 11 813 13 118
42 48 Post-retirement benefit assets 622 614230 236 Deferred tax assets 3 082 3 389252 276 Other long-term assets 3 600 3 715
19 210 23 812 Non-current assets 310 985 282 58172 17 Assets in disposal groups held for sale 216 1 064
1 618 1 943 Inventories 25 374 23 7982 102 2 310 Trade and other receivables 30 179 30 913
3 210 Short-term financial assets 2 739 42158 138 Cash restricted for use 1 803 2 331
3 398 2 117 Cash 27 643 49 9857 351 6 735 Current assets 87 954 108 133
26 561 30 547 Total assets 398 939 390 714 Equity and liabilities
14 072 16 211 Shareholders’ equity 211 711 206 997368 423 Non-controlling interests 5 523 5 421
14 440 16 634 Total equity 217 234 212 4185 303 5 690 Long-term debt 74 312 78 0151 279 1 275 Long-term provisions 16 648 18 810864 847 Post-retirement benefit obligations 11 069 12 703
43 70 Long-term deferred income 910 631193 56 Long-term financial liabilities 733 2 844
1 611 1 980 Deferred tax liabilities 25 860 23 6919 293 9 918 Non-current liabilities 129 532 136 694
136 744 Short-term debt 9 718 2 00058 57 Short-term financial liabilities 740 855
2 625 3 185 Other current liabilities 41 592 38 6119 9 Bank overdraft 123 136
2 828 3 995 Current liabilities 52 173 41 602
26 561 30 547 Total equity and liabilities 398 939 390 714
* Supplementary non-IFRS information. US dollar convenience translation, converted at closing rate of R13,06/US$1 (30 June 2016 – R14,71/US$1).
Sasol Limited Audited Financial Results 2017 15
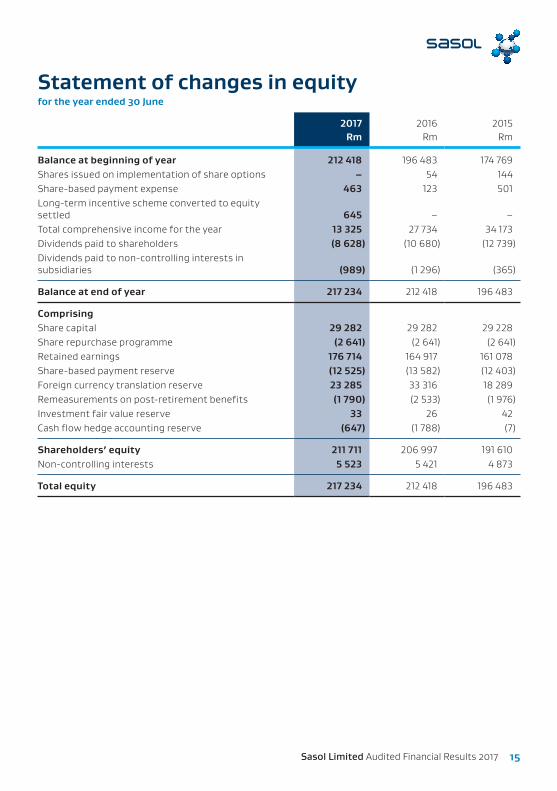
Statement of changes in equityfor the year ended 30 June
2017 2016 2015 Rm Rm Rm
Balance at beginning of year 212 418 196 483 174 769Shares issued on implementation of share options – 54 144Share-based payment expense 463 123 501Long-term incentive scheme converted to equity settled 645 – –Total comprehensive income for the year 13 325 27 734 34 173Dividends paid to shareholders (8 628) (10 680) (12 739)Dividends paid to non-controlling interests in subsidiaries (989) (1 296) (365)
Balance at end of year 217 234 212 418 196 483
Comprising Share capital 29 282 29 282 29 228Share repurchase programme (2 641) (2 641) (2 641)Retained earnings 176 714 164 917 161 078Share-based payment reserve (12 525) (13 582) (12 403)Foreign currency translation reserve 23 285 33 316 18 289Remeasurements on post-retirement benefits (1 790) (2 533) (1 976)Investment fair value reserve 33 26 42Cash flow hedge accounting reserve (647) (1 788) (7)
Shareholders’ equity 211 711 206 997 191 610Non-controlling interests 5 523 5 421 4 873
Total equity 217 234 212 418 196 483

Sasol Limited Audited Financial Results 201716
Sasol Limited Group
Statement of cash flowsfor the year ended 30 June
2017 2016 2015 Rm Rm Rm
Cash receipts from customers 172 061 175 994 186 839Cash paid to suppliers and employees (127 992) (121 321) (125 056)
Cash generated by operating activities 44 069 54 673 61 783Dividends received from equity accounted investments 1 539 887 2 812Finance income received 1 464 1 633 1 234Finance costs paid (3 612) (3 249) (2 097)Tax paid (6 352) (9 329) (10 057)Dividends paid (8 628) (10 680) (12 739)
Cash retained from operating activities 28 480 33 935 40 936
Total additions to non-current assets (56 812) (70 497) (42 645)
Additions to non-current assets (60 343) (73 748) (45 106)Increase in capital project related payables 3 531 3 251 2 461Additional cash contributions to equity accounted investments (444) (548) (588)Proceeds on disposals and scrappings 788 569 1 210Other net cash flow from investing activities (209) (558) (62)
Cash used in investing activities (56 677) (71 034) (42 085)
Share capital issued on implementation of share options – 54 144Dividends paid to non-controlling shareholders in subsidiaries (989) (1 296) (365)Proceeds from long-term debt 9 277 34 008 14 543Repayments of long-term debt (2 364) (3 120) (1 663)Proceeds from short-term debt 4 033 2 901 2 686Repayments of short-term debt (1 410) (3 369) (2 280)
Cash generated by financing activities 8 547 29 178 13 065
Translation effects on cash and cash equivalents (3 207) 7 069 3 095
(Decrease)/increase in cash and cash equivalents (22 857) (852) 15 011
Cash and cash equivalents at beginning of year 52 180 53 032 38 021
Cash and cash equivalents at end of year 29 323 52 180 53 032

Sasol Limited Audited Financial Results 2017 17
Salient featuresfor the year ended 30 June
2017 2016 2015
Selected ratios
Return on equity % 9,7 6,6 16,4Finance costs cover times 9,2 8,0 22,8Net borrowings to shareholders’ equity (gearing) % 26,7 14,6 (2,8)Dividend cover – Headline earnings per share times 2,8 2,8 2,7
Share statistics
Total shares in issue million 679,8 679,8 679,5Sasol ordinary shares in issue million 651,4 651,4 651,1Treasury shares (share repurchase programme) million 8,8 8,8 8,8Weighted average number of shares million 610,7 610,7 610,1Diluted weighted average number of shares million 612,4 610,7 610,2Share price (closing) Rand 366,50 397,17 450,00Market capitalisation – Sasol ordinary shares Rm 238 738 258 717 292 995Market capitalisation – Sasol BEE ordinary shares Rm 866 892 994Net asset value per share Rand 348,27 340,51 315,36Dividend per share Rand 12,60 14,80 18,50
– interim Rand 4,80 5,70 7,00– final Rand 7,80 9,10 11,50
Other financial information Total debt (including bank overdraft) Rm 84 153 80 151 42 919
– interest bearing Rm 82 849 79 175 42 187– non-interest bearing Rm 1 304 976 732
Finance expense capitalised Rm 2 764 2 253 1 118Capital commitments (subsidiaries and joint operations) Rm 90 736 137 286 116 236
– authorised and contracted for Rm 154 739 143 380 109 448– authorised but not yet contracted for Rm 61 673 95 590 66 266– less expenditure to the end of year Rm (125 676) (101 684) (59 478)

Sasol Limited Audited Financial Results 201718
Sasol Limited Group Salient features (continued)
2017 2016 2015
Capital commitments (equity accounted investments) Rm 584 608 648
– authorised and contracted for Rm 292 175 716– authorised but not yet contracted for Rm 573 756 691– less expenditure to the end of year Rm (281) (323) (759)
Significant items in operating profit Directors' remuneration, excluding long-term incentives Rm 77 71 91Share appreciation rights with performance targets granted to directors – cumulative3 000 147 518 535Long-term incentive rights granted to directors – cumulative3 000 303 290 195Sasol Inzalo share rights granted to directors – cumulative3 000 20 25 25Effective tax rate % 28,3 36,6 31,7Adjusted effective tax rate1 % 26,5 28,2 33,0Number of employees2 number 30 900 30 100 30 919Average crude oil price – dated Brent US$/barrel 49,77 43,37 73,46Average rand/US$ exchange rate 1US$ = Rand 13,61 14,52 11,45Closing rand/US$ exchange rate 1US$ = Rand 13,06 14,71 12,17
1 Effective tax rate adjusted for equity accounted investments, remeasurement items and once-off items.
2 The total number of employees includes permanent and non-permanent employees and the group’s share of employees within joint operations, but excludes contractors and equity accounted investments’ employees.
3 Ms VN Fakude resigned as director with effect from 31 December 2016, long-term incentive rights, share appreciation rights and Inzalo share rights attributable to her are retained, subject to appropriate service penalties, with unchanged vesting periods.

Sasol Limited Audited Financial Results 2017 19
2017 2016 2015 Rm Rm Rm
Reconciliation of headline earnings Earnings attributable to owners of Sasol Limited 20 374 13 225 29 716Effect of remeasurement items for subsidiaries and joint operations 1 616 12 892 807
Impairment of property, plant and equipment 415 8 424 294Impairment of assets under construction 1 942 3 586 2 555Impairment of goodwill and other intangible assets 120 310 3Impairment of other assets – – 1Reversal of impairment (1 136) – (2 036)Fair value write down – assets held for sale 64 – –Profit on disposal of non-current assets (21) (389) (93)(Profit)/loss on disposal of investments in businesses (51) 226 410Scrapping of non-current assets 283 1 099 549Write-off of unsuccessful exploration wells – (3) –Realisation of foreign currency translation reserve – (361) (876)
Tax effects and non-controlling interests (539) (846) (165)Effect of remeasurement items for equity accounted investments 14 13 (1)
Headline earnings 21 465 25 284 30 357
Headline earnings adjustments per above
ƫ Mining 6 31 31 ƫ Exploration and Production International (6) 9 963 3 126 ƫ Energy 1 844 1 267 (104) ƫ Base Chemicals (901) 1 723 93 ƫ Performance Chemicals 663 55 (1 804) ƫ Group Functions 10 (147) (535)
Remeasurement items 1 616 12 892 807
Headline earnings per share Rand 35,15 41,40 49,76Diluted headline earnings per share Rand 35,05 41,40 49,75
The reader is referred to the definitions contained in the 2017 Sasol Limited financial statements.

Sasol Limited Audited Financial Results 201720
Sasol Limited Group
Basis of preparation The summarised consolidated financial statements are prepared in accordance with the JSE Limited's (JSE) Listings Requirements for summary financial statements, and the requirements of the Companies Act applicable to summary financial statements. The JSE requires summary financial statements to be prepared in accordance with the framework concepts and the measurement and recognition requirements of International Financial Reporting Standards as issued by the International Accounting Standards Board (IFRS), the SAICA Financial Reporting Guides as issued by the Accounting Practices Committee and Financial Pronouncements as issued by the Financial Reporting Standards Council and to also, as a minimum, contain the information required by IAS 34, Interim Financial Reporting.
The summarised consolidated financial statements do not include all the disclosure required for complete annual financial statements prepared in accordance with IFRS as issued by the International Accounting Standards Board. These summarised consolidated financial statements have been prepared in accordance with the historic cost convention except that certain items, including derivative instruments, liabilities for cash-settled share-based payment schemes, financial assets at fair value through profit or loss and available-for-sale financial assets, are stated at fair value. The summarised consolidated financial statements are presented in South African rand, which is Sasol Limited’s functional and presentation currency. The accounting policies applied in the preparation of these summarised consolidated financial statements are in terms of IFRS and are consistent with those applied in the consolidated annual financial statements for the year ended 30 June 2017. The summarised consolidated financial statements appearing in this announcement are the responsibility of the directors. The directors take full responsibility for the preparation of the summarised consolidated financial statements. Paul Victor CA(SA), Chief Financial Officer, is responsible for this set of summarised consolidated financial statements and has supervised the preparation thereof in conjunction with the Senior Vice President: Financial Control Services, Brenda Baijnath CA(SA).
Related party transactionsThe group, in the ordinary course of business, entered into various sale and purchase transactions on an arm’s length basis at market rates with related parties.
Financial instruments
Fair valueFair value is determined using valuation techniques as outlined unless the instrument is listed in an active market. Where possible, inputs are based on quoted prices and other market determined variables.
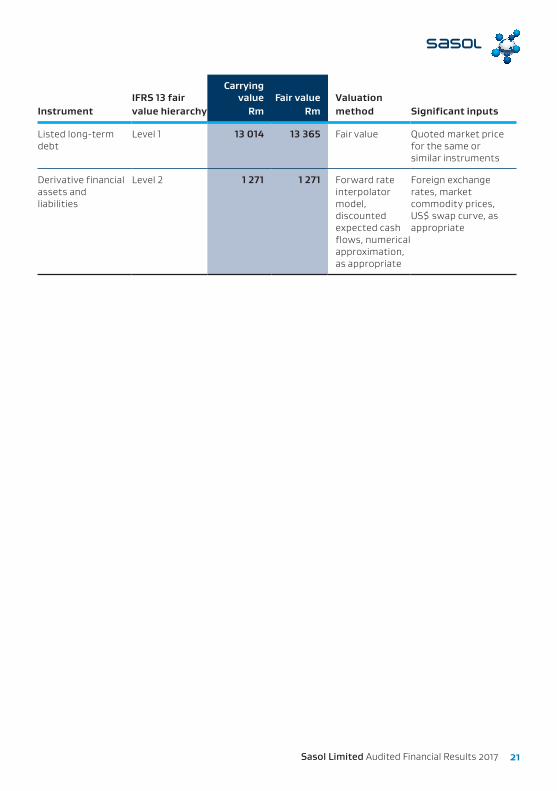
Fair value hierarchy The table below represents significant financial instruments measured at fair value at reporting date, or for which fair value is disclosed at 30 June 2017. The US dollar bond, the interest rate swap, the crude oil put options, the zero-cost foreign exchange collars and the coal swaps were considered to be significant financial instruments for the group based on the amounts recognised in the statement of financial position and the fact that these instruments are traded in an active market. The calculation of fair value requires various inputs into the valuation methodologies used. The source of the inputs used affects the reliability and accuracy of the valuations. Financial instruments have been classified into the hierarchical levels in line with IFRS 13.Level 1 Quoted prices in active markets for identical assets or liabilities.Level 2 Inputs other than quoted prices that are observable for the asset or liability (directly or indirectly).Level 3 Inputs for the asset or liability that are unobservable.
Sasol Limited Audited Financial Results 2017 21
IFRS 13 fair Carrying
value Fair value Valuation Instrument value hierarchy Rm Rm method Significant inputs
Listed long-term debt
Level 1 13 014 13 365 Fair value Quoted market price for the same or similar instruments
Derivative financial assets and liabilities
Level 2 1 271 1 271 Forward rate interpolator model, discounted expected cash flows, numerical approximation, as appropriate
Foreign exchange rates, market commodity prices, US$ swap curve, as appropriate
Sasol Limited Audited Financial Results 201722
Sasol Limited Group
Independent auditor’s report on the summary consolidated financial statementsTo the Shareholders of Sasol Limited
OpinionThe summary consolidated financial statements of Sasol Limited, set out on pages 1 to 21 of the Sasol Limited Financial Results, which comprise the summary consolidated statement of financial position as at 30 June 2017, the summary consolidated income statement, the summary consolidated statements of comprehensive income, changes in equity and cash flows for the year then ended, and related notes, are derived from the audited consolidated financial statements of Sasol Limited for the year ended 30 June 2017.
In our opinion, the accompanying summary consolidated financial statements are consistent, in all material respects, with the audited consolidated financial statements, in accordance with the JSE Limited’s (JSE) requirements for summary financial statements, as set out in the “Basis of preparation” section on page 20 to the summary consolidated financial statements, and the requirements of the Companies Act of South Africa as applicable to summary financial statements.
Summary Consolidated Financial StatementsThe summary consolidated financial statements do not contain all the disclosures required by International Financial Reporting Standards and the requirements of the Companies Act of South Africa as applicable to annual financial statements. Reading the summary consolidated financial statements and the auditor’s report thereon, therefore, is not a substitute for reading the audited consolidated financial statements and the auditor’s report thereon.
The Audited Consolidated Financial Statements and Our Report ThereonWe expressed an unmodified audit opinion on the audited consolidated financial statements in our report dated 18 August 2017. That report also includes communication of key audit matters. Key audit matters are those matters that, in our professional judgement, were of most significance in our audit of the consolidated financial statements of the current period.
Director’s Responsibility for the Summary Consolidated Financial StatementsThe directors are responsible for the preparation of the summary consolidated financial statements in accordance with the requirements of the JSE’s requirements for summary financial statements, set out in the “Basis of preparation” section on page 20 to the summary consolidated financial statements, and the requirements of the Companies Act of South Africa as applicable to summary financial statements.

Sasol Limited Audited Financial Results 2017 23
Auditor’s ResponsibilityOur responsibility is to express an opinion on whether the summary consolidated financial statements are consistent, in all material respects, with the audited consolidated financial statements based on our procedures, which were conducted in accordance with International Standard on Auditing (ISA) 810 (Revised), Engagements to Report on Summary Financial Statements.
Other matter We have not audited future financial performance and expectations, normalised financial information, including core headline earnings, production and sales volumes, selected ratios, share statistics, other non-financial information and information not required by International Financial Reporting Standard, (IAS) 34, Interim Financial Reporting, expressed by the directors in the accompanying summary consolidated financial statements and accordingly do not express an opinion thereon.
PricewaterhouseCoopers Inc.Director: PC HoughRegistered Auditor
Sunninghill
18 August 2017

Sasol Limited Audited Financial Results 201724
Sasol Limited Group
Registered office: Sasol Place, 50 Katherine Street, Sandton, Johannesburg 2090PO Box 5486, Johannesburg 2000, South Africa
Share registrars: Computershare Investor Services (Pty) Ltd, 15 Biermann Avenue, Rosebank 2196PO Box 61051, Marshalltown 2107, South Africa, Tel: +27 11 370 5000 Fax: +27 11 688 5248
JSE Sponsor: Deutsche Securities (SA) Proprietary Limited
Directors (Non-executive): Dr MSV Gantsho* (Chairman), Mr C Beggs*, Mr MJ Cuambe (Mozambican)*, Mr HG Dijkgraaf (Dutch)^, Ms GMB Kennealy*, Ms NNA Matyumza*, Ms IN Mkhize*, Mr ZM Mkhize*, Mr MJN Njeke*, Ms ME Nkeli*, Mr PJ Robertson (British and American)*, Mr S Westwell (British)*
Directors (Executive): Mr SR Cornell (Joint President and Chief Executive Officer) (American), Mr B Nqwababa (Joint President and Chief Executive Officer), Mr P Victor (Chief Financial Officer)
*Independent ^Lead independent director
Company Secretary: Mr VD Kahla
Company registration number: 1979/003231/06, incorporated in the Republic of South Africa
Income tax reference number: 9520/018/60/8 JSE NYSEOrdinary shares Share code: SOL SSLISIN: ZAE000006896 US8038663006 Sasol BEE Ordinary shares Share code: SOLBE1 ISIN: ZAE000151817 American depository receipts (ADR) program: Cusip number 803866300 ADR to ordinary share 1:1
Depositary: The Bank of New York Mellon, 22nd Floor, 101 Barclay Street, New York, NY 10286, United States of America
Disclaimer – Forward-looking statements: Sasol may, in this document, make certain statements that are not historical facts and relate to analyses and other information which are based on forecasts of future results and estimates of amounts not yet determinable. These statements may also relate to our future prospects, developments and business strategies. Examples of such forward-looking statements include, but are not limited to, statements regarding exchange rate fluctuations, volume growth, increases in market share, total shareholder return, executing our growth projects (including LCCP) oil and gas reserves and cost reductions, including in connection with our BPEP, RP and our business performance outlook. Words such as “believe”, “anticipate”, “expect”, “intend", “seek”, “will”, “plan”, “could”, “may”, “endeavour”, “target”, “forecast” and “project” and similar expressions are intended to identify such forward-looking statements, but are not the exclusive means of identifying such statements. By their very nature, forward-looking statements involve inherent risks and uncertainties, both general and specific, and there are risks that the predictions, forecasts, projections and other forward-looking statements will not be achieved. If one or more of these risks materialise, or should underlying assumptions prove incorrect, our actual results may differ materially from those anticipated. You should understand that a number of important factors could cause actual results to differ materially from the plans, objectives, expectations, estimates and intentions expressed in such forward-looking statements. These factors are discussed more fully in our most recent annual report on Form 20-F filed on 27 September 2016 and in other filings with the United States Securities and Exchange Commission. The list of factors discussed therein is not exhaustive; when relying on forward-looking statements to make investment decisions, you should carefully consider both these factors and other uncertainties and events. Forward-looking statements apply only as of the date on which they are made, and we do not undertake any obligation to update or revise any of them, whether as a result of new information, future events or otherwise. Please note: A billion is defined as one thousand million. All references to years refer to the financial year ended 30 June. Any reference to a calendar year is prefaced by the word “calendar”.Comprehensive additional information is available on our website: www.sasol.com


www.sasol.com