On: 29 June 2015, At: 04:35 Anda Huna etoposide , … · To cite this article: Anda Huna, Kristine...
52
This article was downloaded by: [University of Southampton Highfield] On: 29 June 2015, At: 04:35 Publisher: Taylor & Francis Informa Ltd Registered in England and Wales Registered Number: 1072954 Registered office: Mortimer House, 37-41 Mortimer Street, London W1T 3JH, UK Click for updates Cell Cycle Publication details, including instructions for authors and subscription information: http://www.tandfonline.com/loi/kccy20 Role of stress-activated OCT4A in the cell fate decisions of embryonal carcinoma cells treated with etoposide Anda Huna a , Kristine Salmina a , Jekaterina Erenpreisa a , Alejandro Vazquez-Martin a , Jekabs Krigerts a , Inna Inashkina a , Bogdan I Gerashchenko ad , Paul A Townsend b , Mark S Cragg c & Thomas R Jackson b a Latvian Biomedical Research and Study Centre, Rātsupītes 1, k-1, Latvia, Riga, LV-1067 b Institute of Cancer Sciences, Manchester Cancer Research Centre, University of Manchester Manchester Academic Health Science Centre, Manchester, M13 9WL, UK c Cancer Sciences Unit, University of Southampton, Faculty of Medicine, General Hospital, Southampton, SO16 6YD, UK d R.E. Kavetsky Institute of Experimental Pathology, Oncology and Radiobiology, National Academy of Sciences of Ukraine, Vasylkivska Str. 45, Kyiv 03022, Ukraine Accepted author version posted online: 23 Jun 2015. To cite this article: Anda Huna, Kristine Salmina, Jekaterina Erenpreisa, Alejandro Vazquez-Martin, Jekabs Krigerts, Inna Inashkina, Bogdan I Gerashchenko, Paul A Townsend, Mark S Cragg & Thomas R Jackson (2015): Role of stress- activated OCT4A in the cell fate decisions of embryonal carcinoma cells treated with etoposide, Cell Cycle, DOI: 10.1080/15384101.2015.1056948 To link to this article: http://dx.doi.org/10.1080/15384101.2015.1056948 Disclaimer: This is a version of an unedited manuscript that has been accepted for publication. As a service to authors and researchers we are providing this version of the accepted manuscript (AM). Copyediting, typesetting, and review of the resulting proof will be undertaken on this manuscript before final publication of the Version of Record (VoR). During production and pre-press, errors may be discovered which could affect the content, and all legal disclaimers that apply to the journal relate to this version also. PLEASE SCROLL DOWN FOR ARTICLE Taylor & Francis makes every effort to ensure the accuracy of all the information (the “Content”) contained in the publications on our platform. However, Taylor & Francis, our agents, and our licensors make no representations or warranties whatsoever as to the accuracy, completeness, or suitability for any purpose of the Content. Any opinions and views expressed in this publication are the opinions and views of the authors, and are not the views of or endorsed by Taylor & Francis. The accuracy of the Content should not be relied upon and should be independently verified with primary sources of information. Taylor and Francis shall not be liable for any losses, actions, claims, proceedings, demands, costs, expenses, damages, and other liabilities whatsoever or howsoever caused arising directly or indirectly in connection with, in relation to or arising out of the use of the Content. This article may be used for research, teaching, and private study purposes. Any substantial or systematic reproduction, redistribution, reselling, loan, sub-licensing, systematic supply, or distribution in any
Transcript of On: 29 June 2015, At: 04:35 Anda Huna etoposide , … · To cite this article: Anda Huna, Kristine...
This article was downloaded by: [University of Southampton Highfield]On: 29 June 2015, At: 04:35Publisher: Taylor & FrancisInforma Ltd Registered in England and Wales Registered Number: 1072954 Registered office: Mortimer House,37-41 Mortimer Street, London W1T 3JH, UK
Click for updates
Cell CyclePublication details, including instructions for authors and subscription information:http://www.tandfonline.com/loi/kccy20
Role of stress-activated OCT4A in the cell fatedecisions of embryonal carcinoma cells treated withetoposideAnda Hunaa, Kristine Salminaa, Jekaterina Erenpreisaa, Alejandro Vazquez-Martina, JekabsKrigertsa, Inna Inashkinaa, Bogdan I Gerashchenkoad, Paul A Townsendb, Mark S Craggc &Thomas R Jacksonb
a Latvian Biomedical Research and Study Centre, Rātsupītes 1, k-1, Latvia, Riga, LV-1067b Institute of Cancer Sciences, Manchester Cancer Research Centre, University of ManchesterManchester Academic Health Science Centre, Manchester, M13 9WL, UKc Cancer Sciences Unit, University of Southampton, Faculty of Medicine, General Hospital,Southampton, SO16 6YD, UKd R.E. Kavetsky Institute of Experimental Pathology, Oncology and Radiobiology, NationalAcademy of Sciences of Ukraine, Vasylkivska Str. 45, Kyiv 03022, UkraineAccepted author version posted online: 23 Jun 2015.
To cite this article: Anda Huna, Kristine Salmina, Jekaterina Erenpreisa, Alejandro Vazquez-Martin, Jekabs Krigerts,Inna Inashkina, Bogdan I Gerashchenko, Paul A Townsend, Mark S Cragg & Thomas R Jackson (2015): Role of stress-activated OCT4A in the cell fate decisions of embryonal carcinoma cells treated with etoposide, Cell Cycle, DOI:10.1080/15384101.2015.1056948
To link to this article: http://dx.doi.org/10.1080/15384101.2015.1056948
Disclaimer: This is a version of an unedited manuscript that has been accepted for publication. As a serviceto authors and researchers we are providing this version of the accepted manuscript (AM). Copyediting,typesetting, and review of the resulting proof will be undertaken on this manuscript before final publication ofthe Version of Record (VoR). During production and pre-press, errors may be discovered which could affect thecontent, and all legal disclaimers that apply to the journal relate to this version also.
PLEASE SCROLL DOWN FOR ARTICLE
Taylor & Francis makes every effort to ensure the accuracy of all the information (the “Content”) containedin the publications on our platform. However, Taylor & Francis, our agents, and our licensors make norepresentations or warranties whatsoever as to the accuracy, completeness, or suitability for any purpose of theContent. Any opinions and views expressed in this publication are the opinions and views of the authors, andare not the views of or endorsed by Taylor & Francis. The accuracy of the Content should not be relied upon andshould be independently verified with primary sources of information. Taylor and Francis shall not be liable forany losses, actions, claims, proceedings, demands, costs, expenses, damages, and other liabilities whatsoeveror howsoever caused arising directly or indirectly in connection with, in relation to or arising out of the use ofthe Content.
This article may be used for research, teaching, and private study purposes. Any substantial or systematicreproduction, redistribution, reselling, loan, sub-licensing, systematic supply, or distribution in any

form to anyone is expressly forbidden. Terms & Conditions of access and use can be found at http://www.tandfonline.com/page/terms-and-conditions
Dow
nloa
ded
by [
Uni
vers
ity o
f So
utha
mpt
on H
ighf
ield
] at
04:
36 2
9 Ju
ne 2
015

1
Role of stress-activated OCT4A in the cell fate decisions of
embryonal carcinoma cells treated with etoposide
Anda Huna1*, Kristine Salmina1, Jekaterina Erenpreisa1*, Alejandro Vazquez-Martin1, Jekabs Krigerts1, Inna Inashkina1,
Bogdan I Gerashchenko1,4, Paul A Townsend2, Mark S Cragg3, Thomas R Jackson2*
1. Latvian Biomedical Research and Study Centre, Rātsupītes 1, k-1, Latvia, Riga, LV-1067
2. Institute of Cancer Sciences, Manchester Cancer Research Centre, University of Manchester, Manchester
Academic Health Science Centre, Manchester, M13 9WL, UK.
3. Cancer Sciences Unit, University of Southampton, Faculty of Medicine, General Hospital, Southampton, SO16
6YD, UK.
4. R.E. Kavetsky Institute of Experimental Pathology, Oncology and Radiobiology, National Academy of Sciences of
Ukraine, Vasylkivska Str. 45, Kyiv 03022, Ukraine
*Corresponding authors
Dow
nloa
ded
by [
Uni
vers
ity o
f So
utha
mpt
on H
ighf
ield
] at
04:
36 2
9 Ju
ne 2
015

2
Abstract
Tumour cellular senescence induced by genotoxic treatments has recently been found to be paradoxically linked to the
induction of “stemness”. This observation is critical as it directly impinges upon the response of tumours to current chemo-
radio-therapy treatment regimens. Previously, we showed that following etoposide (ETO) treatment embryonal carcinoma
PA-1 cells undergo a p53-dependent upregulation of OCT4A and p21Cip1 (governing self-renewal and regulating cell
cycle inhibition and senescence, respectively). Here we report further detail on the relationship between these and other
critical cell-fate regulators. PA-1 cells treated with ETO display highly heterogeneous increases in OCT4A and p21Cip1
indicative of dis-adaptation catastrophe. Silencing OCT4A suppresses p21Cip1, changes cell cycle regulation and
subsequently suppresses terminal senescence; p21Cip1-silencing did not affect OCT4A expression or cellular
phenotype. SOX2 and NANOG expression did not change following ETO treatment suggesting a dissociation of OCT4A
from its pluripotency function. Instead, ETO-induced OCT4A was concomitant with activation of AMPK, a key component
of metabolic stress and autophagy regulation. p16ink4a, the inducer of terminal senescence, underwent autophagic
sequestration in the cytoplasm of ETO-treated cells, allowing alternative cell fates. Accordingly, failure of autophagy was
accompanied by an accumulation of p16ink4a, nuclear disintegration, and loss of cell recovery. Together, these findings
imply that OCT4A induction following DNA damage in PA-1 cells, performs a cell stress, rather than self-renewal, function
by moderating the expression of p21Cip1, which alongside AMPK helps to then regulate autophagy. Moreover, this data
indicates that exhaustion of autophagy, through persistent DNA damage, is the cause of terminal cellular senescence.
Dow
nloa
ded
by [
Uni
vers
ity o
f So
utha
mpt
on H
ighf
ield
] at
04:
36 2
9 Ju
ne 2
015

3
Key words: p53, OCT4A/POU5F1, p21Cip1, p16ink4a, p62, self-renewal, tumour cells, DNA damage, pluripotency,
senescence, cell-fate
Abbreviations used: Baf, bafilomycin; EC, embryonal carcinoma; ES, embryonic stem; ETO, Etoposide; IF,
immunofluorescent; LC3, microtubule associated protein 1 light chain 3; NT, non-treated; NT2, NTera 2; ntg, non-target;
pCHK2, phosphorylated CHK2; PI, propidium iodide; siRNA, small interfering RNA; shRNA, small hairpin RNA; Sa-b-gal,
senescence associated beta-galactosidase; AMP-activated protein kinase (AMPK)
Dow
nloa
ded
by [
Uni
vers
ity o
f So
utha
mpt
on H
ighf
ield
] at
04:
36 2
9 Ju
ne 2
015
4
Introduction
The relationship between cancer cells, normal stem cells, and cancer stem cells represents a question of substantial
current interest.1 It has been proposed that transcription networks that confer stem cell properties such as self-renewal,
plasticity, or an increased resistance to genotoxic stimuli in normal stem cells may perform a similar function in cancer
cells.2 This hypothesis is supported by the growing clinical evidence that expression of key embryonal stem cell (ESC)
transcription factors POU1F5 (OCT4A), NANOG and SOX2, are associated with poorer prognosis through tumour
resistance, recurrence and progression in a wide variety of cancers.3-9 Furthermore, it has been demonstrated by several
groups that ESC transcription factors can be upregulated in response to DNA damage where they likely play a role in
regulating survival.10-12
Conversely, accelerated cellular senescence is a phenomenon that has also been shown to be induced by genotoxic
treatments of cancer cells.13 Cellular senescence has traditionally been considered a terminal cell fate.13,14 However, more
recently it has been shown to be reversible at early stages, at least in tumour cells.15-18 Furthermore, a direct link between
senescence and “stemness”, essential cytological characteristics of a stem cell that distinguishes it from ordinary somatic
cells, emerged in experiments where pluripotency is induced in normal cells.19,20
The molecular regulators of these processes in normal embryonal development, such as p21Cip1, are slowly becoming
discerned.21 One intriguing observation is that embryonal cellular senescence is associated with upregulation of the same
Dow
nloa
ded
by [
Uni
vers
ity o
f So
utha
mpt
on H
ighf
ield
] at
04:
36 2
9 Ju
ne 2
015

5
pathways which govern the epithelial-mesenchymal transition (EMT) .22 This, apparently paradoxical, link between
opposites in cell fate provides a challenge for scientific reasoning.
We have previously observed in IMR90 fibroblasts that a pre-senescent phenotype is associated with the appearance of
self-renewal and senescence markers coupled to DNA damage.23 We also demonstrated co-incident p53-dependent
upregulation of two opposing cell fate regulators, p21Cip1 and OCT4A in embryonal carcinoma PA-1 cells treated with
Etoposide (ETO).24 We hypothesised that this bi-potential state favours DNA damage repair (DDR) whilst preventing full
commitment to either senescence or self-renewal. In this system, p53 silencing promoted terminal senescence and
premature mitosis. Together these data support the presence of a pre-senescent cell state which can arise in response to
both senescence and stemness programmes being coactivated in response to genotoxic damage.
In the present study, we asked how key regulators of stemness (OCT4A, SOX2 and NANOG) and senescence
(p16inka4a) behave in individual PA-1 cells during the response of ETO-induced DNA damage. Using siRNA silencing
approaches we addressed the effect of OCT4A and p21Cip1 expression on each other and subsequent cell fates,
determining the role of autophagy and how OCT4A activation impacts on the energy and genomic stress sensor and
master metabolic regulator and activator of autophagy AMP-activated protein kinase (AMPK).
Dow
nloa
ded
by [
Uni
vers
ity o
f So
utha
mpt
on H
ighf
ield
] at
04:
36 2
9 Ju
ne 2
015
6
Results
Etoposide-treatment elicits a senescence-like phenotype in PA-1 cells
Following ETO treatment many PA-1 cells undergo gradual cell apoptosis and anoikis, while the remainder arrest in G2M
and upregulate p53 and p21Cip.24 G2M arrest and nuclear swelling were evident on day 3 after ETO treatment, with
restoration of normal cell cycle and nuclear size 4 days later (Fig 1A and B). Concurrent nuclear area assessments and
DNA content measurements demonstrate that the nuclei of ETO treated cells increased in size irrespective of the stage of
the cell cycle, but was most evident in G2M and polyploid cells (Fig 1C and D). Increased nuclear area and DNA content
were also accompanied by an increase in cellular granularity, as determined by an increase in side scatter detected by
flow cytometry analysis (Fig 1E), and autophagy (see below). The majority of cells displayed flattened morphology (Fig
1F), but only a proportion displayed p16Ink4a nuclear positivity (Fig 1 G, H). Furthermore, p16Ink4a expression was
largely confined to the cytoplasm (Fig 1 G). All of these features are indicative of senescence.
Heterogeneous expression of OCT4A and p21Cip1 following Etoposide treatment
We previously showed that the senescence marker p21Cip1 and the stemness marker OCT4A simultaneously increase
and co-exist in the same cells following ETO treatment.24 After confirming the pre-senescent phenotype of these cells, we
next wished to explore how these critical factors for cell fate were dynamically regulated, integrated and diversified. As
judged by flow cytometry ~ 60% of the cells become positive for both markers at the peak of the response (day 5),
thereafter the expression of both markers and the proportion of double positive cells gradually decreases (Fig2A) as
Dow
nloa
ded
by [
Uni
vers
ity o
f So
utha
mpt
on H
ighf
ield
] at
04:
36 2
9 Ju
ne 2
015

7
clonogenic, mitotic division ensues. To exclude the possible impact of the senescence-associated cytoplasmic and
nuclear area changes on the flow cytometry measurements, semi-automatic image cytometry was undertaken, measuring
the expression of both factors in the cell nucleus (apoptotic cells possessing very high p21Cip1 positivity lacking OCT4A
were deliberately excluded from this analysis as distorting stoichiometry of measurements). Both the expression and
variation of expression of OCT4A and p21Cip1 increased on day 3 after ETO treatment; and increased further on day 5
(Fig2B and C, Supplementary Fig. 1) and a high number of double-positive cells confirmed (Fig. 2B).
OCT4A upregulation is not accompanied by changes in SOX2 or NANOG
In its function as a master regulator of pluripotency and self-renewal, OCT4A cooperates with SOX2 and NANOG whose
expression are therefore required for maintaining the embryonic stem cell phenotype.25 We thus explored the expression
of these transcription factors in the DNA damage response of PA-1 cells. Immunoblotting confirmed that p53 increased in
response to ETO from day 1, resulting in the induction of p21Cip1, which reached its maximum on day 5 (Fig 3A). As
documented previously, OCT4A expression was present in control cells and increased following ETO treatment,
coincident with p53 upregulation.24 Weak expression of SOX2 was found in untreated cells but did not alter following ETO-
treatment (Fig3A); a result confirmed by image cytometry measurements in individual cells (Fig3B, Supplementary Fig. 1).
NANOG was not detected in PA-1 cells by immunoblotting (Fig 3A) although rare NANOG positive cells (less than 5%)
were found in control and ETO-treated samples by three different antibodies (Supplementary Fig. 1). Intriguingly, SOX2
failed to show unambiguous antagonism with p21Cip1, which has previously been reported as directly inhibiting SOX2 in
Dow
nloa
ded
by [
Uni
vers
ity o
f So
utha
mpt
on H
ighf
ield
] at
04:
36 2
9 Ju
ne 2
015

8
neurodifferentiation.26 Furthermore, SOX2 expression did not show significant correlation with its self-renewal partner
OCT4A (data not shown). Together, these data suggest a dissociation of OCT4A from its self-renewal capacity when it is
induced by p53 (in the presence of p21Cip1) in response to DNA damage.
OCT4A suppresses p21Cip1 and promotes an enhanced senescence phenotype
Given its potential lack of self-renewal capacity, we next investigated the role of OCT4A in PA-1 cells following ETO
treatment using siRNA. Prior to this analysis, we first established which OCT4 isoforms were expressed in PA-1 cells.
Using a panel of specific mAb, immunoblotting revealed that OCT4B was undetectable in these cells both before and after
ETO treatment (Supplementary Fig. 2), consistent with published previously RT-PCR data.24
Having established that OCT4B was not expressed in PA-1 cells, siRNA silencing was used to assess the role of OCT4A
in their response to ETO treatment. Efficient (80-95%) knock-down of OCT4A was confirmed with three different siRNA, in
addition to a three siRNA pool (Supplementary Fig. 3) and the molecular response to ETO was then examined by
immunoblotting (Fig 4A) for key regulators of DNA damage, (pCHK2, p53, p21Cip1, and RAD51). These experiments
revealed p53, RAD51 and pCHK2 were all upregulated from day 1 independently of OCT4A expression. p21Cip1
expression rose gradually from day 1 throughout the course of experiment as seen in previous experiments. Silencing of
OCT4A resulted in a marked increase in p21Cip1 expression from day 1. These results imply that the presence of OCT4A
induced by DNA damage suppresses p21Cip1 expression despite comparable levels of p53 expression and equivalent
DNA damage as judged by RAD51 and pCHK2 expression.
Dow
nloa
ded
by [
Uni
vers
ity o
f So
utha
mpt
on H
ighf
ield
] at
04:
36 2
9 Ju
ne 2
015

9
When investigating the cell cycle response, loss of OCT4A caused an almost identical phenotype to that previously
reported with p53 silencing24 i.e. OCT4A-silenced cells underwent a profound G2M arrest with apoptosis being greatly
reduced (Figure 4B and C). The cells displayed the large, flattened morphology and Sa--gal staining associated with
senescence on day 5 (Figure 4D), identical to that previously reported when silencing p53. Thus, the increase in G2M
arrest and increased accelerated senescence previously observed with p53 silencing appears to be entirely due to the
loss of the induction of OCT4A. Prolonged loss of OCT4A lead to the polyploidisation of these senescent cells and a
reduction in clonal recovery (Figure 5). The absence of off target effects was confirmed by repeating silencing and cell
cycle analysis experiments with 3 separate siRNA molecules targeting different sequences of OCT4A mRNA
(Supplementary Figure 4).
p21Cip1 silencing does not affect OCT4A expression or cell cycle arrest
Having established that OCT4A suppresses p21Cip1 and a senescent phenotype we sought to investigate the possibility
of a reciprocal suppression of OCT4A by p21Cip1. To do this p21Cip1 was silenced using siRNA. Silencing of p21Cip1
was efficient as judged by immunoblotting but was not found to affect the expression of OCT4A in the presence or
absence of ETO treatment (Figure 6). Furthermore, we detected no difference in the cell cycle profiles of p21Cip1-
silenced cells compared to control siRNA treated cells following ETO treatment.
In summary, we found that OCT4A tempers p21Cip1 upregulation, restricting entry into senescence, indicating that co-
expression defines the pre-senescent state. Whilst p21Cip1 did not regulate OCT4A expression or change the cell cycle,
Dow
nloa
ded
by [
Uni
vers
ity o
f So
utha
mpt
on H
ighf
ield
] at
04:
36 2
9 Ju
ne 2
015

10
depletion of OCT4A profoundly impacted it. We also found that p53-activated OCT4A does not support the pluripotency
network in pre-senescent cells (owing to the lack of SOX2/NANOG co-ordination), leaving its biological role unclear. We,
therefore, interrogated its possible role as a stress responder where one of these stresses may be metabolic. AMPK is a
key sensor of metabolism and energy status.27 Therefore, we next explored the activation of AMPK by virtue of its
phosphorylation at Threonine 172 (pAMPKThr172), in relation to OCT4A expression.
AMPK and OCT4A are coordinately activated in response to ETO-treatment
The results of this comparative study are shown in Fig.7. Microscopy of control, untreated, cells revealed heterogeneous
pAMPKThr172 activation with expression in some cell nuclei and also in centrosomes, central spindle and mid-bodies of
mitotic cells as described previously, 28 and rarely ( <1% cells), in the cytoplasm (Fig.7A, upper row). In ETO-treated cells
the staining for AMPK increased and strikingly coincided with the localisation and intensity of staining for OCT4A in most
cells (Fig. 7A, second row) as also confirmed by IF measurements, where clear correlation was shown (Fig.7B). However,
while OCT4A is seen homogenously throughout the nucleus pAMPKThr172 staining revealed a fine (euchromatic) nuclear
pattern, which indicates binding to chromatin, unlike OCT4A.
Intense staining of pAMPKThr172 was also found in apoptotic cell nuclei and bodies, while OCT4A was not (Fig. 7C). In
arrested metaphases appearing after ETO on day 4, pAMPKThr172 was localised to multiple centrosomes, while OCT4A
was not (Fig.7A, second row). This difference in staining was confirmed by co-staining for -tubulin and AURORA B
kinase (not shown). Together, these data indicate that OCT4A is co-ordinately regulated alongside pAMPKThr172 in
Dow
nloa
ded
by [
Uni
vers
ity o
f So
utha
mpt
on H
ighf
ield
] at
04:
36 2
9 Ju
ne 2
015

11
interphase cells but that in apoptotic cells their functions may differ. Moreover, the concordant expression of OCT4A and
pAMPKThr172 in interphase cells suggests that the p53-dependent OCT4A induction is a result of a stress response
following ETO treatment.
As a part of its role as a central metabolic regulator, AMPK is directly involved in the regulation of autophagy.29 In this
regard, previous studies have shown that autophagy is implicated in the chemo-resistance to ETO and this effect is
reversed by inhibition of AMPK, which led to cell death by apoptosis.30
Conversely, cellular senescence is also associated with autophagy30 representing another potential cell fate phenotype
following ETO-treatment.24 p16ink4a is believed to drive irreversible senescence. 31 Therefore, we next decided to explore
the relationship of p16ink4a and macroautophagy.
p16ink4a is sequestered by autophagy in ETO-treated cells
Autophagy was verified using immunofluorescence for p62 as a marker of autophagy. Post ETO treatment, an increase in
the number of p62 foci/cell was observed by immunofluorescence (Fig. 8A and B) and mean number of p62 foci/cell in
three independent experiments was shown to increase > five-fold (Fig 8C). Bafilomycin A (Baf) halted autophagic flux in
ETO-treated cells (shown as an accumulation of LC3B in relation to LC3A), confirming functional autophagy and its
suppression (Fig. 8D). Baf treatment also enhanced cell death preventing clonogenic recovery only in ETO-treated cells
(Supplementary Fig. 5), which indicates the importance of autophagy for cell survival after DNA damage.
We then assessed immunostaining for p16ink4a and LAMP2 in the presence and absence of Baf post ETO treatment.
LAMP2 is an important regulator of lysosomal biogenesis, required for the maturation of functional autophagosomes. In
Dow
nloa
ded
by [
Uni
vers
ity o
f So
utha
mpt
on H
ighf
ield
] at
04:
36 2
9 Ju
ne 2
015

12
control, untreated cells, p16ink4a was observed in ~5% of cells as small aggresomes, surrounded by LAMP2-positive foci
(data not shown). In ETO-treated cells (day 4), the cytoplasm was highly enriched with LAMP2, while p16ink4a-positive
aggresomes (larger and more numerous than in control) were sequestered in autophago-lysosomes (Fig. 9 A and B).
Approximately 30% of cells were seen to accumulate large amounts of p16ink4a in multiple aggresomes, as measure by
>3 aggresomes and/or diffusely detected within cytoplasm, or in large vacuoles (Fig.9A-C), and often showed DNA in
cytoplasm (Fig. 9C). The proportion of such cells, with high levels of p16ink4a, increased two-fold (29±6.5and 58 ±3.5, +/-
Baf, respectively) as measured on day 4. These observations indicate the important role of autophagy in sequestering and
degrading p16ink4a in ETO-treated PA-1 cells, thus preventing senescence. They also show that a considerable
proportion of ETO-treated cells suffer from exhaustion of autophagy.
Failure of autophagy to sequester p16ink4a in the cytoplasm is accompanied by drastic nuclear changes and
loss of DNA
In ETO-treated samples counterstained with DAPI, we noted that the failure of macroautophagy to control and sequester
p16ink4a in the cytoplasm coincided with prominent changes in cell nuclei, particularly following Baf treatment. Nuclei
became thinner, less intensely DAPI-stained (e.g. Fig. 9C), or, more frequently, displaced to one of the cell poles by large
autophagic vacuoles (Fig.9B). Twisting, thinning, and disintegrating cell nuclei were the main phenotypes of ETO+Baf-
treated cells. As detailed above, in their extreme distortions, the cell nuclei were displaced and squeezed by large
autophagic vacuoles and attained a sickle-like shape (Fig. 9D). It remains possible that the loss of sequestration of
Dow
nloa
ded
by [
Uni
vers
ity o
f So
utha
mpt
on H
ighf
ield
] at
04:
36 2
9 Ju
ne 2
015

13
p16ink4a, distortion of cell nuclei and loss of DNA are all linked, belonging to a related series of processes associated
with exhausted autophagy, which is further exaggerated by Baf where full disintegration of the cell nucleus and alveolar
LC3-positive cytoplasm are evident (Fig10 A).
Trying to understand how the penetrability of the cell nuclei was related to DNA damage we stained with an antibody
(PL2-6) which detects a unique epitope involving a ternary complex of histones H2A and H2B and DNA at the site of the
chromatin attachment to lamin B1.32 We applied it to ETO-treated cell nuclei (day 4) combining it with a label for DNA
damage (pCHK2). The result shows (Fig. 10 B) bright nuclear staining with PL2-6 in cell nuclei without DNA damage and
its reduction in cell nuclei containing DNA damage, possibly suggesting that binding to lamin B receptors in compromised.
In view of this data, we decided to use detailed stoichiometric DNA image cytometry following ETO treatment in the
presence or absence of Baf. Typical histograms from one representative experiment are shown in Fig.10 C, while in
Supplementary Fig. 6 comparative DNA histograms of selected normal- and sickle-shaped cell nuclei from ETO+Baf
treatment are presented. Measurements from ETO-treated cells revealed a peak of delay in late S-phase, which was
augmented after Baf treatment showing apparent redistribution from G2 (4C) into <4C, which was exaggerated in selected
sickle-type nuclei of ETO+Baf-treated cells (Supplementary Fig. 6). These data support our microscopic observations that
DNA is preferentially lost from the sickle-like shape nuclei in the cells as a result of failed autophagic processing with the
proportion of sickle-like nuclei cells with sickle-like nuclei in ETO-treated samples increased more than two-fold (2.38±0.2)
following Baf treatment (n=3).
Dow
nloa
ded
by [
Uni
vers
ity o
f So
utha
mpt
on H
ighf
ield
] at
04:
36 2
9 Ju
ne 2
015

14
Discussion
In this study, we expanded our investigation of the response of PA-1 embryonal carcinoma cells to DNA damaging
chemotherapy. We previously observed,24 a concurrent p53-dependent increase in OCT4A and p21Cip1 protein
expression after ETO-treatment, with the resulting cells transiting through an apparently bi-potential state with hallmarks
of both premature multi-centriolar mitoses and senescence. Herein, we extended our analysis and highlight a hitherto
unobserved DNA damage response (DDR) function of OCT4A following ETO treatment, which is different from its
established pluripotency and self-renewal functions. This p53-dependant DDR-induced OCT4A is not coordinated with
SOX2 or NANOG activity, but does serve to suppress p21Cip1. This finding is in accord with the previously shown
observation that OCT4A can directly repress p21Cip1 expression by binding its promoter in the absence of SOX2 and
NANOG. 33 Although not yet confirmed in other cell types or following different stimuli, this phenomenon likely relates to
properties evidenced during embryonal ‘stemness’, as similar nuclear accumulation of OCT4A was similarly recently
reported following laser beam damage of live ESC cells.34
Our measurements of OCT4A and p21Cip1 expression in individual cells revealed that cell fate, in response to extensive
DNA damage, occurs with high levels of heterogeneity. Both factors increase coordinately with huge variations in
expression, covering (at day 5) a wide spectrum of p21Cip1 and OCT4A expression.35 These observations demonstrate a
typical characteristic of self-organising, adapting systems, using heterogeneity over time to provide bifurcations of cell fate
choice.36,37 The increased variance in both factors – from day 3 until day 7 – corresponds to the period with most
Dow
nloa
ded
by [
Uni
vers
ity o
f So
utha
mpt
on H
ighf
ield
] at
04:
36 2
9 Ju
ne 2
015

15
prominent cell death (99% cells will die and only <1% has the chance to survive, likely representing the degree of
challenge that they must overcome ).24 When OCT4A is silenced the level of p21Cip1 increases, more cells enter
senescence and mitotic recovery is reduced, abrogating fragile balance in bifurcation point and removing the possibility for
rare cells to choose survival as their fate. It is worth noting that this response was phenotypically identical to that seen
when silencing p53.24 We hypothesise that the loss of p53 or OCT4A in silencing experiments causes the loss of the
embryonal G2M checkpoint leading to increased mitotic slippage, ultimately ending in terminal senescence rather than
executing the G2M checkpoint function via apoptosis. Continued silencing of OCT4A inhibited clonogenic recovery post
ETO treatment highlighting the importance of the pre-senescent G2M arrest for clonogenic recovery of the small
percentage of cells that are able to repair their DNA damage. Silencing of OCT4A also leads to endoreplication in
senescent cells further eluding to the presence of mitotic slippage.38 p21Cip1 silencing experiments demonstrated that the
observed G2M arrest was independent of p21Cip1 expression.
Mitotic survival of the ETO-treated cells ultimately originates from metastable pre-senescence. Theoretically, this means
that the self-renewal function of OCT4A is finally restored. The attractor of self-renewal fate in individual cells is high
NANOG,39 released from direct suppression by p5340 and activated by OCT4A-SOX2 heterodimer. Although NANOG is
only found in a very small number of PA-1 cells, its role requires further exploration.
This moderator function of DDR-induced OCT4A occurs alongside activation of AMPK. AMPK is an evolutionary
conserved low-energy checkpoint that operates as a master regulator of cellular metabolism and activator of autophagy.
AMPK also acts as a genomic stress sensor that is required for the adaptation of metabolism switches and the DDR for
Dow
nloa
ded
by [
Uni
vers
ity o
f So
utha
mpt
on H
ighf
ield
] at
04:
36 2
9 Ju
ne 2
015

16
efficient repair of DNA.41 We previously observed a bidirectional relationship between AMPK and ATM/CHK2 pathways
that integrates both the metabolic and DNA damage stress signalling.42 AMPK activation was previously shown as
necessary for maximal stress-induced transcription of p53-dependent genes that promote cell survival. 43 Interestingly,
AMPK has also been shown to activate and stabilise p53.44,45 Thus, the energetic stress-response of AMPK is tightly
linked to the DDR of p53. The role of AMPK in the autophagy and cell death response after ETO has previously been
reported.30
We previously revealed the p53-dependant DDR-induced elevation in OCT4A in PA-1 cells following ETO treatment.
Therefore, it was not unexpected that DDR-induced OCT4A and AMPK activation should be coordinately regulated by
ETO as we observed here. We found that while autophagy apparently remains functional, cells retaining both AMPK and
DDR-induced OCT4A in cell nuclei are capable of preventing terminal senescence. This data are in accordance with the
report by Chitikova and colleagues, 46 who demonstrated that silencing mTOR (the antagonist of AMPK suppressing
autophagy) in irradiated, apoptosis-resistant cells caused a reversal of senescence. Thus OCT4A moderating p21Cip1 in
collaboration with pAMPKThr172, supporting cells with metabolites and energy through autophagy and other means,
channel cells through disadaptation chaos caused by high DNA damage towards a survival phenotype. ETO-treated PA-1
cells struggle against terminal senescence in particular by autophagic sequestration and removal of its regulator
p16ink4a.
Dow
nloa
ded
by [
Uni
vers
ity o
f So
utha
mpt
on H
ighf
ield
] at
04:
36 2
9 Ju
ne 2
015
17
There is much controversy regarding markers of terminal senescence and even what the process really is. It has become
recently apparent that terminal senescence is not only growth arrest,47 moreover, it is intrinsically associated with the
origin of EMT22 and predicts poor clinical outcome after cancer treatment.48
In our previous and current article we have partly unravelled a mechanism showing that in response to DNA damage p53
induces two regulators of opposite cell fates. The setting is interesting: although they both are positively regulated by the
same up-stream inducer, OCT4A suppresses p21Cip1, while the latter does not directly suppress OCT4A. Nevertheless,
the scattering of the cells in expression of both through the phase space ending up in one of two cell fates presumes their
reciprocity. The observation of cell-to-cell variability can also be a result from biological oscillations in time.49 The best
documented example of this is the p53-mdm2 oscillating system in which p53 oscillations are, indeed, crucial for cell
recovery after DNA damage.50 It is, therefore, possible that heterogeneity in p53 due to oscillations results in downstream
heterogeneity of both OCT4A and p21Cip1 in PA-1 cells.
Senescence is intrinsically associated with macroautophagy induction (regulated by AMPK and persistent DNA damage).
51 Here, we found that persistent DNA damage was associated with destruction of the ternary complex of histones (H2A
and H2B) and DNA in their attachment to nuclear lamin B1 using a unique antibody reagent.32 This observation is in
keeping with data of the thinning and disassembly of lamin B1 and leakage of DNA from cells as a feature of terminal
senescence.52
Our DNA cytometric observations revealed a delay in late S-phase after ETO, augmented by BafA1. The consequence of
this delay would be under-replication of heterochromatin,53 appearance of single strand DNA breaks, demethylation and
Dow
nloa
ded
by [
Uni
vers
ity o
f So
utha
mpt
on H
ighf
ield
] at
04:
36 2
9 Ju
ne 2
015

18
activation of the transposable elements (TE) ALU/LINE 1, whose mobility after ETO has already been described.54 As
sequestering ALU mRNA and LINE 1 by autophagy in the cytoplasm has been reported as a mechanism for protecting
against transposition,55 it therefore remains possible, (although purely speculative) that functional autophagy prevents
terminal senescence in this manner also. The model with the scenario of terminal senescence occurring due to activation
of TE as discussed in several other studies.56-58 It follows then that terminal senescence may in fact be mainly triggered by
several mechanisms , which potentiate each other and result from failure of autophagy. Thus, autophagy should be a key
target for preventing resistance of cancer stem cells to genotoxic therapies, a supposition supported by others.59,60
Dow
nloa
ded
by [
Uni
vers
ity o
f So
utha
mpt
on H
ighf
ield
] at
04:
36 2
9 Ju
ne 2
015

19
Materials and methods
Cells
PA-1 is an ovarian teratocarcinoma (a germline tumour) cell-line, obtained from ATCC, with a stable near-diploid
karyotype.61 It possesses functional p53, in spite of possible acquisition of one mutated allele reported at passages over
407.62 Importantly it retains the ability to differentiate into all three tissue types, thus possessing the features of embryonal
carcinoma.61 The NTera 2 (NT2) cell line, obtained from ATCC and used as a positive control for pluruipotency genes
OCT4A, SOX2 and NANOG.
Antibodies
Primary antibodies and their uses are detailed in Table 1. Secondary antibodies and their uses are detailed in Table 2.
Cell culture and treatment
PA-1 cells were cultured in Dulbecco’s modified Eagle’s media (DMEM) supplemented with 10% foetal bovine serum
(FBS) if not otherwise stated. NT2 cells were cultured in Dulbecco’s modified Eagle’s media (DMEM) supplemented with
10% foetal bovine serum (FBS). Cells were grown without antibiotics in 5% CO2 at 37°C. Exponentially growing PA-1 cells
were incubated with 4-8 μM ETO for 20 h. Following ETO treatment, cells were maintained by replenishing culture
medium every 48h. Bafilomycin A (Baf A, Cayman Chemicals) 50 nM was added to the culture medium for 24h between
day 3 to 4 after 20h treatment with 8 µM ETO.
Dow
nloa
ded
by [
Uni
vers
ity o
f So
utha
mpt
on H
ighf
ield
] at
04:
36 2
9 Ju
ne 2
015
20
Flow cytometry
Cells were harvested at relevant time points, washed in cold PBS and fixed with 70% ethanol for 20 min at room
temperature. After two washes in tris buffered saline (TBS), cells were permeabilised with TBS/4% bovine serum albumin
(BSA)/0.1% Triton X-100 for 10 min at room temperature. Samples were then incubated with mouse monoclonal anti-
OCT4 antibody solution (Santa Cruz) and rabbit polyclonal p21Cip1 (Pierce) in TBS/4% BSA/0.1% Triton X-100 for 1h at
room temperature. Following two washes in TBS, cells were incubated with goat anti-rabbit- IgG-Alexa Fluor 488
(A31627, Invitrogen) and Chicken anti-mouse IgG-Alexa Fluor 647 (A21463, Invitrogen) (1:200) in TBS/4% BSA/0.1%
Triton X 100, for 30 min in the dark. DNA was counterstained with 10 μg/ml propidium iodide (PI) in PBS, and assessed
by flow cytometry using a FACS Aria (BD Biosciences) using Cell Quest Pro Software). Data was analyses using FlowJo
analysis software.
Immunofluorescence
Cells were suspended in warm FBS and cytospun onto glass slides. Cytospins were fixed in methanol for 7 min at -20°C
and dipped 10 times in ice cold acetone. Slides were then washed thrice in TBS 0.01% Tween 20 (TBST) for 5 min. Slides
were subsequently blocked for 15 min in TBS, 0.05% Tween 20%, 1% BSA at room temperature. Samples were covered
with TBS, 0.025% Tween 20%, 1% BSA containing primary antibody and incubated overnight at 4°C in a humidified
chamber. Samples were then washed thrice in TBST and covered with TBST containing the appropriate secondary
antibodies (Goat anti-mouse IgG Alexa Fluor 488 (A31619, Invitrogen) and Goat anti-rabbit- IgG Alexa Fluor 594
Dow
nloa
ded
by [
Uni
vers
ity o
f So
utha
mpt
on H
ighf
ield
] at
04:
36 2
9 Ju
ne 2
015

21
(A31631, Invitrogen)) and incubated for 40 min at room temperature in the dark. Slides were washed thrice for 5 min with
TBST and once for 2 min in PBS. Samples were then counterstained with 0.25 μg/ml DAPI for 2 min, and finally
embedded in Prolong Gold (Invitrogen). When staining for p-AMPKα1/2 (alone or in combination with the antibody for
OCT4), fixation in 4% paraformaldehyde for 15 min was used, followed by washing thrice in PBS 0,1% glycine. Primary
antibodies and their source are listed in Table 1.
Microscopy and immunofluorescence image cytometry
Slides were evaluated using a Leitz Ergolux L03-10 microscope equipped with Sony DXC 390P colour video camera, for
microscopic observations; in addition to separate optical filters, a three-band BRG (blue, red, green) optical filter (Leica)
was used. Image cytometry was carried out by semi-automatic measuring fluorescence values for each cell nuclei in all
three channels and analysed using Image-Pro Plus 4.1 software (Media Cybernetics). Apoptotic cells, determined by
nuclear morphology, were omitted from measurements.
DNA image cytometry
For DNA cytometry measurements, stoichiometric toluidine blue DNA staining was performed as previously.63 In brief,
cytospins were fixed in ethanol:acetone (1:1) for >30 min at 4°C and air dried. Slides were then treated with 5N HCl for 20
min at room temperature, washed in distilled water (5 x 1 min) and stained for 10 min with 0.05% toluidine blue in 50%
citrate-phosphate McIlvain buffer pH 4. Slides were rinsed with distilled water, blotted dry and dehydrated in butanol for
2x3 min at 37°C. Samples were then incubated twice in xylene for 3 min each at room temperature and embedded in DPX
Dow
nloa
ded
by [
Uni
vers
ity o
f So
utha
mpt
on H
ighf
ield
] at
04:
36 2
9 Ju
ne 2
015
22
(Sigma). DNA content was measured as the integral optical density with a calibrated Sony DXC 390P video camera in the
green channel. Nuclear area was calculated using Image-Pro Plus 4.1 software (Media Cybernetics). Apoptotic cells were
omitted from measurements. The stoichiometry of DNA staining was verified using the values obtained for metaphases
compared to anaphases and telophases (ratio 2.0); the summary error of the method and device was estimated to be less
than 5%.
DNA flow cytometry
Cells (including those in media) were harvested at indicated time points, washed in PBS and re-suspended in hypotonic
fluorochrome solution [50 µg/ml propidium iodide (PI), 0.1% (w/v) sodium citrate, 0.1% (v/v) Triton-X-100] and stored for at
least 1 h in the dark at 4°C. Flow cytometry was performed using a FACScan (BD Biosciences) or Accuri™ C6 Cytometer
(BD Biosciences). Data was analyses using FlowJo analysis software.
Detection of sa-β-galactosidase activity
The senescence β-galactosidase (sa-β-gal) staining kit (Cell Signaling Technology, UK) was used to detect sa-β-gal
activity in cells according to the manufacturer’s protocol.
Immunoblotting
For whole-cell lysates, cells were harvested, washed once with PBS and lysed using RIPA buffer containing protease
inhibitor cocktail (Sigma P8340). Protein concentrations were determined by Bradford assay (Thermo Scientific), with 10-
Dow
nloa
ded
by [
Uni
vers
ity o
f So
utha
mpt
on H
ighf
ield
] at
04:
36 2
9 Ju
ne 2
015
23
30 μg of total protein separated on 20% SDS polyacrylamide gels followed by electrophoretic transfer onto BA85
nitrocellulose membranes (Schleicher & Schuell GmbH) overnight. Equal protein loading in each lane was confirmed by
Ponceau S staining. Blots were probed with appropriate antibodies primary and secondary detected using ECL Western
Blotting Substrate (Pierce™ , 32106).
For comparison of OCT4 isoforms protein was transferred onto immobilon-FC transfer membrane and probed with
primary antibodies. Blots were then probed with fluorescent secondary antibodies and the signal was visualized using a
LICOR Odyssey imaging system.
Small interfering RNA (siRNA) silencing
FlexiTube siRNA (SI04950274, SI04950267, SI04153835 and SI00690382; Qiagen) was used to silence OCT4A
expression, and FlexiTube siRNA (SI00604905, SI00604898 and SI00299810; Qiagen) was used to silence p21Cip1
expression. ON-TARGET plus non-targeting siRNA #1 (Dharmacon) was used as a negative control. Cells were
transfected with siRNA using HiPerfect (Qiagen) according to the manufacturer’s protocol.
Methods of statistical analysis
Statistical analysis was performed in GraphPad (GraphPad Software Ltd). Student t-test was used to calculate the
statistical significance of difference of means where appropriate. Statistical significance was accepted when p < 0.05.
Graphs were plotted in GraphPad Prism 5 and IBM SPSS statistics 22.
Dow
nloa
ded
by [
Uni
vers
ity o
f So
utha
mpt
on H
ighf
ield
] at
04:
36 2
9 Ju
ne 2
015

24
Acknowledgements
The authors would like to thank Professor Hao and Dr Zhao, Dept of Histology and Embryology, Shandong University
School of Medicine for the kind gift of the OCT4A and OCT4A-Psg-1 vector constructs and Ada and Donald Olins for
providing the antibody for epichromatin. The project was funded through an MRC PhD studentship and the Gerald Kerkut
Charitable Trust, the University of Manchester Project Diamond and the Manchester Cancer Research Centre and by the
Europe Social Fund Project, project No. 2013/0023/1DP/1.1.1.2.0/13/APIA/VIAA/037. The publishing costs associated
with this article are in part provided by the Manchester Project Diamond and by the Europe Social Fund Project, project
No. 2013/0023/1DP/1.1.1.2.0/13/APIA/VIAA/037.
Dow
nloa
ded
by [
Uni
vers
ity o
f So
utha
mpt
on H
ighf
ield
] at
04:
36 2
9 Ju
ne 2
015

25
Reference List
1. Ben-Porath, I., Thomson, M. W., Carey, V. J., Ge, R., Bell, G. W., Regev, A., and Weinberg, R. A. An embryonic stem
cell-like gene expression signature in poorly differentiated aggressive human tumors. Nature Genetics
2008; 40(5): 499-507.
2. Reya, T., Morrison, S. J., Clarke, M. F., and Weissman, I. L. Stem cells, cancer, and cancer stem cells. Nature 2001;
414(6859): 105-111.
3. Chiou, S. H., Yu, C. C., Huang, C. Y., Lin, S. C., Liu, C. J., Tsai, T. H., Chou, S. H., Chien, C. S., Ku, H. H., and Lo, J.
F. Positive correlations of Oct-4 and Nanog in oral cancer stem-like cells and high-grade oral squamous cell
carcinoma. Clinical Cancer Research 2008; 14(13): 4085-4095.
4. Meng, H. M., Zheng, P., Wang, X. Y., Liu, C., Sui, H. M., Wu, S. J., Zhou, J., Ding, Y. Q., and Li, J. M. Overexpression
of nanog predicts tumor progression and poor prognosis in colorectal cancer. Cancer Biology & Therapy
2010; 9(4): 295-302.
5. Du, L. T., Yang, Y. M., Xiao, X. Y., Wang, C. X., Zhang, X. H., Wang, L. L., Zhang, X., Li, W., Zheng, G. X., Wang, S.
and others. Sox2 nuclear expression is closely associated with poor prognosis in patients with histologically
node-negative oral tongue squamous cell carcinoma. Oral Oncology 2011; 47(8): 709-713.
6. Lengerke, C., Fehm, T., Kurth, R., Neubauer, H., Scheble, V., Muller, F., Schneider, F., Petersen, K., Wallwiener, D.,
Kanz, L. and others. Expression of the embryonic stem cell marker SOX2 in early-stage breast carcinoma.
Bmc Cancer 2011; 11.
7. He, W., Li, K., Wang, F., Qin, Y. R., and Fan, Q. X. Expression of OCT4 in human esophageal squamous cell
carcinoma is significantly associated with poorer prognosis. World Journal of Gastroenterology 2012; 18(7):
712-719.
8. Huang, P., Chen, J., Wang, L., Na, Y. Q., Kaku, H., Ueki, H., Sasaki, K., Yamaguchi, K., Zhang, K., Saika, T. and
others. Implications of transcriptional factor, OCT-4, in human bladder malignancy and tumor recurrence.
Medical Oncology 2012; 29(2): 829-834.
9. Lin, T., Ding, Y. Q., and Li, J. M. Overexpression of Nanog protein is associated with poor prognosis in gastric
adenocarcinoma. Medical Oncology 2012; 29(2): 878-885.
10. Lagadec, C., Vlashi, E., Della Donna, L., Dekmezian, C., and Pajonk, F. Radiation-Induced Reprogramming of Breast
Cancer Cells. Stem Cells 2012; 30(5): 833-844.
Dow
nloa
ded
by [
Uni
vers
ity o
f So
utha
mpt
on H
ighf
ield
] at
04:
36 2
9 Ju
ne 2
015

26
11. Abubaker, K., Latifi, A., Luwor, R., Nazaretian, S., Zhu, H. J., Quinn, M. A., Thompson, E. W., Findlay, J. K., and
Ahmed, N. Short-term single treatment of chemotherapy results in the enrichment of ovarian cancer stem
cell-like cells leading to an increased tumor burden. Molecular Cancer 2013; 12.
12. Salmina, K., Jankevics, E., Huna, A., Perminov, D., Radovica, I., Klymenko, T., Ivanov, A., Jascenko, E., Scherthan,
H., Cragg, M. and others. Up-regulation of the embryonic self-renewal network through reversible polyploidy
in irradiated p53-mutant tumour cells. Exp.Cell Res 2010; 316(13): 2099-2112.
13. Roninson, I. B. Tumor cell senescence in cancer treatment. Cancer Research 2003; 63(11): 2705-2715.
14. Roninson, I. B., Broude, E. V., and Chang, B. D. If not apoptosis, then what? - Treatment-induced senescence and
mitotic catastrophe in tumor cells. Drug Resistance Updates 2001; 4(5): 303-313.
15. Sherman, M. Y., Meng, L., Stampfer, M., Gabai, V. L., and Yaglom, J. A. Oncogenes induce senescence with
incomplete growth arrest and suppress the DNA damage response in immortalized cells. Aging Cell 2011;
10(6): 949-961.
16. Puig, P. E., Guilly, M. N., Bouchot, A., Droin, N., Cathelin, D., Bouyer, F., Favier, L., Ghiringhelli, F., Kroemer, G.,
Solary, E. and others. Tumor cells can escape DNA-damaging cisplatin through DNA endoreduplication and
reversible polyploidy. Cell Biol.Int 2008; 32(9): 1031-1043.
17. Roberson, R. S., Kussick, S. J., Vallieres, E., Chen, S. Y. J., and Wu, D. Y. Escape from therapy-induced accelerated
cellular senescence in p53-null lung cancer cells and in human lung cancers. Cancer Research 2005; 65(7):
2795-2803.
18. Sabisz, M. and Skladanowski, A. Cancer stem cells and escape from drug-induced premature senescence in human
lung tumor cells Implications for drug resistance and in vitro drug screening models. Cell Cycle 2009; 8(19):
3208-3217.
19. Banito, A., Rashid, S. T., Acosta, J. C., Li, S., Pereira, C. F., Geti, I., Pinho, S., Silva, J. C., Azuara, V., Walsh, M. and
others. Senescence impairs successful reprogramming to pluripotent stem cells. Genes Dev. 2009; 23(18):
2134-2139.
20. Jaenisch, R. Nuclear cloning and direct reprogramming: the long and the short path to Stockholm. Cell Stem Cell
2012; 11(6): 744-747.
Dow
nloa
ded
by [
Uni
vers
ity o
f So
utha
mpt
on H
ighf
ield
] at
04:
36 2
9 Ju
ne 2
015
27
21. Storer, M., Mas, A., Robert-Moreno, A., Pecoraro, M., Ortells, M. C., Di, Giacomo, V, Yosef, R., Pilpel, N.,
Krizhanovsky, V., Sharpe, J. and others. Senescence is a developmental mechanism that contributes to
embryonic growth and patterning. Cell 2013; 155(5): 1119-1130.
22. Kishi, S., Bayliss, P. E., and Hanai, J. I. A prospective epigenetic paradigm between cellular senescence and
epithelial-mesenchymal transition in organismal development and aging. Translational Research 2015;
165(1): 241-249.
23. Huna, A., Salmina, K., Jascenko, E., Duburs, G., Inashkina, I., and Erenpreisa, J. Self-Renewal Signalling in
Presenescent Tetraploid IMR90 Cells. J Aging Res 2011; 2011: 103253.
24. Jackson, T. R., Salmina, K., Huna, A., Inashkina, I., Jankevics, E., Riekstina, U., Kalnina, Z., Ivanov, A., Townsend, P.
A., Cragg, M. S. and others. DNA damage causes TP53-dependent coupling of self-renewal and
senescence pathways in embryonal carcinoma cells. Cell Cycle 2013; 12(3): 430-441.
25. Boyer, L. A., Lee, T. I., Cole, M. F., Johnstone, S. E., Levine, S. S., Zucker, J. R., Guenther, M. G., Kumar, R. M.,
Murray, H. L., Jenner, R. G. and others. Core transcriptional regulatory circuitry in human embryonic stem
cells. Cell 2005; 122(6): 947-956.
26. Marques-Torrejon, M. A., Porlan, E., Banito, A., Gomez-Ibarlucea, E., Lopez-Contreras, A. J., Fernandez-Capetillo,
O., Vidal, A., Gil, J., Torres, J., and Farinas, I. Cyclin-Dependent Kinase Inhibitor p21 Controls Adult Neural
Stem Cell Expansion by Regulating Sox2 Gene Expression. Cell Stem Cell 2013; 12(1): 88-100.
27. Sun, Y., Connors, K. E., and Yang, D. Q. AICAR induces phosphorylation of AMPK in an ATM-dependent, LKB1-
independent manner. Molecular and Cellular Biochemistry 2007; 306(1-2): 239-245.
28. Vazquez-Martin, A., Lopez-Bonet, E., Oliveras-Ferraros, C., Perez-Martinez, M. C., Bernado, L., and Menendez, J. A.
Mitotic kinase dynamics of the active form of AMPK (phospho-AMPK alpha(Thr172)) in human cancer cells.
Cell Cycle 2009; 8(5): 788-791.
29. Kim, J., Kundu, M., Viollet, B., and Guan, K. L. AMPK and mTOR regulate autophagy through direct phosphorylation
of Ulk1. Nature Cell Biology 2011; 13(2): 132-U71.
30. Xie, B. S., Zhao, H. C., Yao, S. K., Zhuo, D. X., Jin, B., Lv, D. C., Wu, C. L., Ma, D. L., Gao, C., Shu, X. M. and others.
Autophagy inhibition enhances etoposide-induced cell death in human hepatoma G2 cells. International
Journal of Molecular Medicine 2011; 27(4): 599-606.
Dow
nloa
ded
by [
Uni
vers
ity o
f So
utha
mpt
on H
ighf
ield
] at
04:
36 2
9 Ju
ne 2
015

28
31. Rayess, H., Wang, M. B., and Srivatsan, E. S. Cellular senescence and tumor suppressor gene p16. International
Journal of Cancer 2012; 130(8): 1715-1725.
32. Olins, A. L., Langhans, M., Monestier, M., Schlotterer, A., Robinson, D. G., Viotti, C., Zentgraf, H., Zwerger, M., and
Olins, D. E. An epichromatin epitope Persistence in the cell cycle and conservation in evolution. Nucleus-
Austin 2011; 2(1): 47-60.
33. Lee, J., Go, Y., Kang, I., Han, Y. M., and Kim, J. Oct-4 controls cell-cycle progression of embryonic stem cells.
Biochemical Journal 2010; 426: 171-181.
34. Bartova, E., Sustackova, G., Stixova, L., Kozubek, S., Legartova, S., and Foltankova, V. Recruitment of Oct4 Protein
to UV-Damaged Chromatin in Embryonic Stem Cells. Plos One 2011; 6(12).
35. Gorban, A. N., Smirnova, E. V., and Tyukina, T. A. Correlations, risk and crisis: From physiology to finance. Physica
A-Statistical Mechanics and Its Applications 2010; 389(16): 3193-3217.
36. Stuart A.Kauffman., "The origins of order: Self-organization and selection in evolution.,"in (Oxford university press,
2013).
37. Huang, S. Non-genetic heterogeneity of cells in development: more than just noise. Development 2009; 136(23):
3853-3862.
38. Edgar, B. A. and Orr-Weaver, T. L. Endoreplication cell cycles: More for less. Cell 2001; 105(3): 297-306.
39. Kalmar, T., Lim, C., Hayward, P., Munoz-Descalzo, S., Nichols, J., Garcia-Ojalvo, J., and Arias, A. M. Regulated
Fluctuations in Nanog Expression Mediate Cell Fate Decisions in Embryonic Stem Cells. Plos Biology 2009;
7(7).
40. Lin, T. X., Chao, C., Saito, S., Mazur, S. J., Murphy, M. E., Appella, E., and Xu, Y. P53 induces differentiation of
mouse embryonic stem cells by suppressing Nanog expression. Nature Cell Biology 2005; 7(2): 165-U80.
41. Sanli, T., Steinberg, G. R., Singh, G., and Tsakiridis, T. AMP-activated protein kinase (AMPK) beyond metabolism A
novel genomic stress sensor participating in the DNA damage response pathway. Cancer Biology &
Therapy 2014; 15(2): 156-169.
42. Vazquez-Martin, A., Oliveras-Ferraros, C., Cufi, S., Martin-Castillo, B., and Menendez, J. A. Metformin activates an
Ataxia Telangiectasia Mutated (ATM)/Chk2-regulated DNA damage-like response. Cell Cycle 2011; 10(9):
1499-1501.
Dow
nloa
ded
by [
Uni
vers
ity o
f So
utha
mpt
on H
ighf
ield
] at
04:
36 2
9 Ju
ne 2
015

29
43. Bungard, D., Fuerth, B. J., Zeng, P. Y., Faubert, B., Maas, N. L., Viollet, B., Carling, D., Thompson, C. B., Jones, R.
G., and Berger, S. L. Signaling Kinase AMPK Activates Stress-Promoted Transcription via Histone H2B
Phosphorylation. Science 2010; 329(5996): 1201-1205.
44. Jones, R. G., Plas, D. R., Kubek, S., Buzzai, M., Mu, J., Xu, Y., Birnbaum, M. J., and Thompson, C. B. AMP-activated
protein kinase induces a p53-dependent metabolic checkpoint. Molecular Cell 2005; 18(3): 283-293.
45. Lee, C. W., Wong, L. L. Y., Tse, E. Y. T., Liu, H. F., Leong, V. Y. L., Lee, J. M. F., Hardie, D. G., Ng, I. O. L., and
Ching, Y. P. AMPK Promotes p53 Acetylation via Phosphorylation and Inactivation of SIRT1 in Liver Cancer
Cells. Cancer Research 2012; 72(17): 4394-4404.
46. Chitikova, Z. V., Gordeev, S. A., Bykova, T. V., Zubova, S. G., Pospelov, V. A., and Pospelova, T. V. Sustained
activation of DNA damage response in irradiated apoptosis-resistant cells induces reversible senescence
associated with mTOR downregulation and expression of stem cell markers. Cell Cycle 2014; 13(9): 1424-
1439.
47. Blagosklonny, M. V. Cell cycle arrest is not senescence. Aging-Us 2011; 3(2): 94-101.
48. Wang, Q., Wu, P. C., Dong, D. Z., Ivanova, I., Chu, E., Zeliadt, S., Vesselle, H., and Wu, D. Y. Polyploidy road to
therapy-induced cellular senescence and escape. International Journal of Cancer 2013; 132(7): 1505-1515.
49. Brock, A., Chang, H., and Huang, S. OPINION Non-genetic heterogeneity - a mutation-independent driving force for
the somatic evolution of tumours. Nature Reviews Genetics 2009; 10(5): 336-342.
50. Purvis, J. E., Karhohs, K. W., Mock, C., Batchelor, E., Loewer, A., and Lahav, G. p53 Dynamics Control Cell Fate.
Science 2012; 336(6087): 1440-1444.
51. Capparelli, C., Chiavarina, B., Whitaker-Menezes, D., Pestell, T. G., Pestell, R. G., Hulit, J., Ando, S., Howell, A.,
Martinez-Outschoorn, U. E., Sotgia, F. and others. CDK inhibitors (p16/p19/p21) induce senescence and
autophagy in cancer-associated fibroblasts, "fueling" tumor growth via paracrine interactions, without an
increase in neo-angiogenesis. Cell Cycle 2012; 11(19): 3599-3610.
52. Ivanov, A., Pawlikowski, J., Manoharan, I., van, Tuyn J., Nelson, D. M., Rai, T. S., Shah, P. P., Hewitt, G., Korolchuk,
V. I., Passos, J. F. and others. Lysosome-mediated processing of chromatin in senescence. J Cell Biol.
2013; 202(1): 129-143.
53. Nagl, Walter. Endopolyploidy and polyteny in differentiation and evolution. 1978.
Dow
nloa
ded
by [
Uni
vers
ity o
f So
utha
mpt
on H
ighf
ield
] at
04:
36 2
9 Ju
ne 2
015
30
54. Hagan, C. R., Sheffield, R. F., and Rudin, C. M. Human Alu element retrotransposition induced by genotoxic stress.
Nature Genetics 2003; 35(3): 219-220.
55. Guo, H. S., Chitiprolu, M., Gagnon, D., Meng, L. R., Perez-Iratxeta, C., Lagace, D., and Gibbings, D. Autophagy
supports genomic stability by degrading retrotransposon RNA. Nature Communications 2014; 5.
56. Wang, J. R., Geesman, G. J., Hostikka, S. L., Atallah, M., Blackwell, B., Lee, E., Cook, P. J., Pasaniuc, B., Shariat, G.,
Halperin, E. and others. Inhibition of activated pericentromeric SINE/Alu repeat transcription in senescent
human adult stem cells reinstates self-renewal. Cell Cycle 2011; 10(17): 3016-3030.
57. Baker, D. J. and Sedivy, J. M. Probing the depths of cellular senescence. J Cell Biol. 2013; 202(1): 11-13.
58. Cecco, M., Criscione, S. W., Peckham, E. J., Hillenmeyer, S., Hamm, E. A., Manivannan, J., Peterson, A. L., Kreiling,
J. A., Neretti, N., and Sedivy, J. M. Genomes of replicatively senescent cells undergo global epigenetic
changes leading to gene silencing and activation of transposable elements. Aging Cell 2013; 12(2): 247-
256.
59. Sui, X., Chen, R., Wang, Z., Huang, Z., Kong, N., Zhang, M., Han, W., Lou, F., Yang, J., Zhang, Q. and others.
Autophagy and chemotherapy resistance: a promising therapeutic target for cancer treatment. Cell Death &
Disease 2013; 4.
60. Dorr, J. R., Yu, Y., Milanovic, M., Beuster, G., Zasada, C., Dabritz, J. H. M., Lisec, J., Lenze, D., Gerhardt, A.,
Schleicher, K. and others. Synthetic lethal metabolic targeting of cellular senescence in cancer therapy.
Nature 2013; 501(7467): 421-+.
61. Zeuthen, J., Norgaard, J. O. R., Avner, P., Fellous, M., Wartiovaara, J., Vaheri, A., Rosen, A., and Giovanella, B. C.
Characterization of A Human Ovarian Teratocarcinoma-Derived Cell-Line. International Journal of Cancer
1980; 25(1): 19-32.
62. Gao, C., Miyazaki, M., Li, J. W., Tsuji, T., Inoue, Y., and Namba, M. Cytogenetic characteristics and p53 gene status
of human teratocarcinoma PA-1 cells in 407-445 passages. International Journal of Molecular Medicine
1999; 4(6): 597-600.
63. Erenpreisa, J. and Freivalds, T. Anisotropic staining of apurinic acid with toluidine blue. Histochemistry 1979; 60(3):
321-325.
Dow
nloa
ded
by [
Uni
vers
ity o
f So
utha
mpt
on H
ighf
ield
] at
04:
36 2
9 Ju
ne 2
015
31
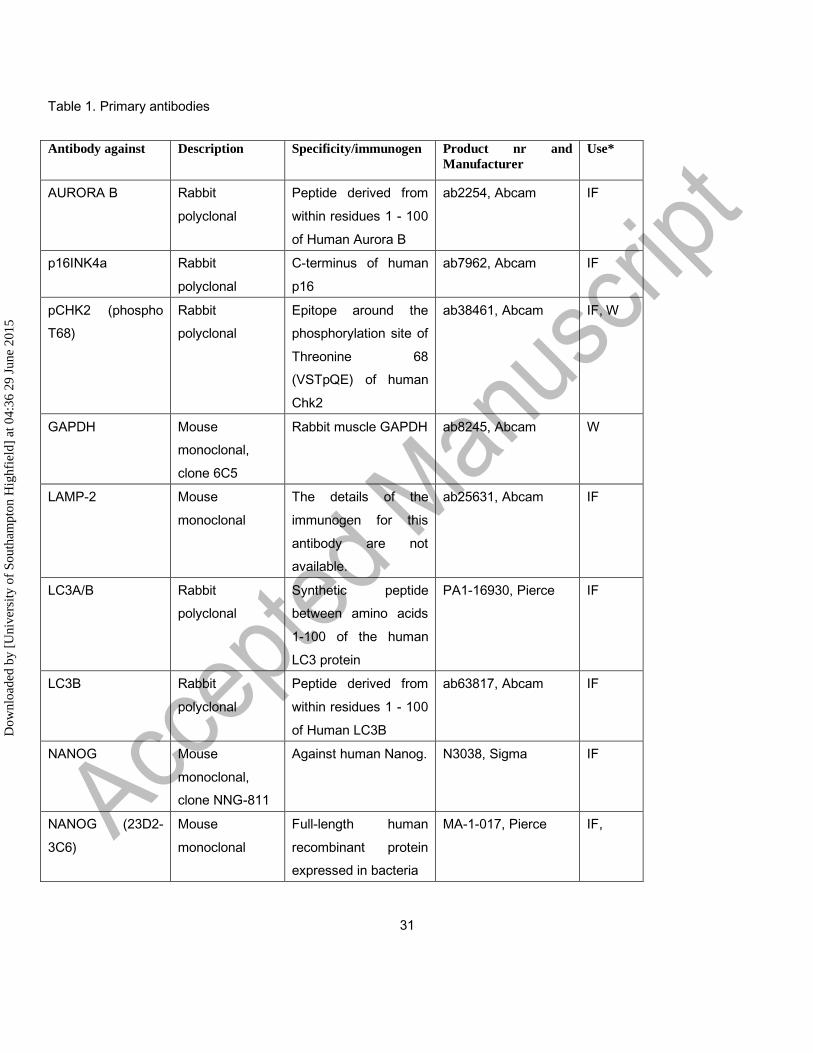
Table 1. Primary antibodies
Antibody against Description Specificity/immunogen Product nr and
Manufacturer
Use*
AURORA B Rabbit
polyclonal
Peptide derived from
within residues 1 - 100
of Human Aurora B
ab2254, Abcam IF
p16INK4a Rabbit
polyclonal
C-terminus of human
p16
ab7962, Abcam IF
pCHK2 (phospho
T68)
Rabbit
polyclonal
Epitope around the
phosphorylation site of
Threonine 68
(VSTpQE) of human
Chk2
ab38461, Abcam IF, W
GAPDH Mouse
monoclonal,
clone 6C5
Rabbit muscle GAPDH ab8245, Abcam W
LAMP-2 Mouse
monoclonal
The details of the
immunogen for this
antibody are not
available.
ab25631, Abcam IF
LC3A/B Rabbit
polyclonal
Synthetic peptide
between amino acids
1-100 of the human
LC3 protein
PA1-16930, Pierce IF
LC3B Rabbit
polyclonal
Peptide derived from
within residues 1 - 100
of Human LC3B
ab63817, Abcam IF
NANOG Mouse
monoclonal,
clone NNG-811
Against human Nanog. N3038, Sigma IF
NANOG (23D2-
3C6)
Mouse
monoclonal
Full-length human
recombinant protein
expressed in bacteria
MA-1-017, Pierce IF,
Dow
nloa
ded
by [
Uni
vers
ity o
f So
utha
mpt
on H
ighf
ield
] at
04:
36 2
9 Ju
ne 2
015

32
NANOG H-155 Rabbit
polyclonal
epitope corresponding
to amino acids 151-
305 mapping at the C-
terminus of Nanog of
human origin
sc-33759, Santa Cruz IF
OCT3/4 Mouse
monoclonal
Peptide raised against
amino acids 1-134 of
Oct-3/4 of human
origin non cross-
reactive with Oct-3/4
isoforms B and B1
sc-5279, Santa Cruz IF, F, W
OCT4 Rabbit
polyclonal, ChIP
Grade
Peptide derived from
within residues 300 to
the C-terminus of
Human Oct4
ab19857, Abcam IF, W
p21Cip1 Rabbit
polyclonal
Raised against a
peptide mapping at the
C-terminusof p21 of
human origin
sc-397, Santa Cruz IF
p21Cip1 Rabbit
monoclonal
Synthetic peptide
corresponding to
residues near the
carboxy-terminus of
human p21
MA5-14949, Pierce IF, F, W
p-AMPKα1/2
(Thr183/172)
Rabbit
polyclonal
Epitope corresponding
to phosphorylated Thr
172 of AMPKα1 of
human origin
sc-101630, Santa
Cruz
IF
Dow
nloa
ded
by [
Uni
vers
ity o
f So
utha
mpt
on H
ighf
ield
] at
04:
36 2
9 Ju
ne 2
015

33
PL2-6 Mouse
monoclonal
autoimmune anti-
nucleosome antibody
specifically recognizes
the peripheral surface
of interphase
chromatin and mitotic
chromosomes,
epichromatin epitope
A kind gift from
Olins.32
IF
SOX2 Mouse
monoclonal
Full-length human
recombinant protein
expressed in bacteria
MA1-014, Pierce IF, W
SOX2 Rabbit
polyclonal
Epitope corresponding
to amino acids 131-
195 of Sox-2 of human
origin
sc-20088x, Santa
Cruz
IF
SQSTM1 (p62) Rabbit
polyclonal
Epitope corresponding
to amino acids 151-
440 of SQSTM1 of
human origin.
sc-25575, Santa Cruz IF
*W, western; IF, immunofluorescent staining; F, flow cytometry.
Dow
nloa
ded
by [
Uni
vers
ity o
f So
utha
mpt
on H
ighf
ield
] at
04:
36 2
9 Ju
ne 2
015

34
Table 2. Secondary antibodies
Antibody Conjugate Product No.and
Manufacturer
Use*
Goat anti-mouse IgG Alexa Fluor 488 A31619, Invitrogen IF
Chicken anti-mouse
IgG
Alexa Fluor 647 A21463, Invitrogen F
Goat anti-rabbit- IgG Alexa Fluor 488 A11008, Invitrogen F
Goat anti-rabbit- IgG Alexa Fluor 594 A31631, Invitrogen IF
Goat anti-rabbit IgG HRP 32460,Thermo Fisher
Scientific
W
Rabbit anti-mouse IgG HRP 61-6520, Invitrogen W
Goat anti-rabbit IgG IRDye 800CW 926-32211, IRDye
Antibodies
W
Goat anti-mouse IgG IRDye 800CW 926-32210, IRDye
Antibodies
W
Goat anti-rabbit IgG Goat anti-rabbit
IgG
926-68021, IRDye
Antibodies
W
*W, western; IF, immunofluorescent staining; F, flow cytometry.
Dow
nloa
ded
by [
Uni
vers
ity o
f So
utha
mpt
on H
ighf
ield
] at
04:
36 2
9 Ju
ne 2
015
35
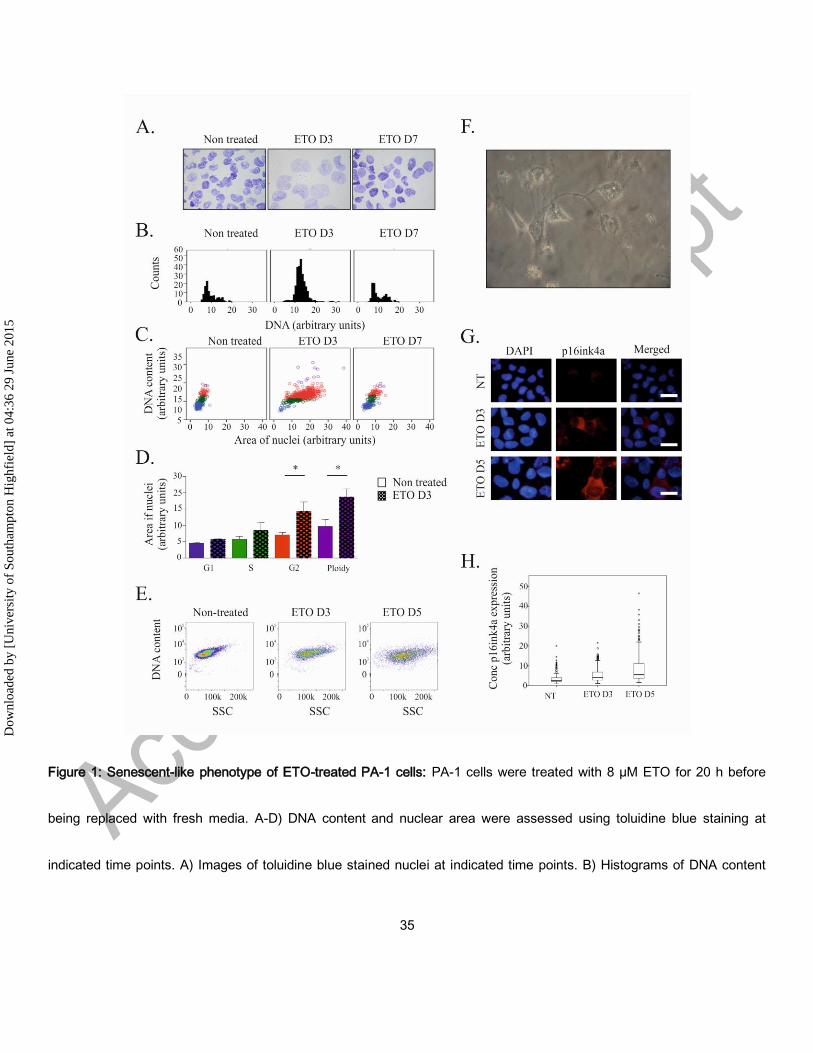
Figure 1: Senescent-like phenotype of ETO-treated PA-1 cells: PA-1 cells were treated with 8 µM ETO for 20 h before
being replaced with fresh media. A-D) DNA content and nuclear area were assessed using toluidine blue staining at
indicated time points. A) Images of toluidine blue stained nuclei at indicated time points. B) Histograms of DNA content
Dow
nloa
ded
by [
Uni
vers
ity o
f So
utha
mpt
on H
ighf
ield
] at
04:
36 2
9 Ju
ne 2
015

36
were produced and used to determine the cell cycle stage of individual cells. C) Dot-plots of DNA content versus nuclei
area with each cell coloured according to cell cycle stage as determined by DNA content histograms: G1 (blue); S phase
(green); G2 (red); purple (polyploid). A statistically significant difference in nuclear size between treated and non-treated
cells was observed in G2 and polyploid fractions (*p <0.05, n=3). E) Granularity of cells (SSC) was measured at indicated
time points by flow cytometry. F) Phase contrast microscopy of PA-1 cells displaying a flattened morphology. G)
Immunofluorescence staining for p16ink4a (red) and counterstained with DAPI at indicated time points demonstrating an
increase in p16ink4a following ETO treatment. H) Quantification of p16ink4a expression determined in individual cells by
image cytometry displayed as a box plot showing its increase after ETO treatment. Images are representative for at least
3 individual experiments.
Dow
nloa
ded
by [
Uni
vers
ity o
f So
utha
mpt
on H
ighf
ield
] at
04:
36 2
9 Ju
ne 2
015

37
Figure 2: Expression of OCT4A and p21Cip1 following ETO treatment of PA-1 cells. A) Dual staining for OCT4A and
p21cip1 by immunofluorescence 3 days after ETO treatment. B) Quantitation of OCT4A and p21Cip1 expression on day 3
and day 5 after ETO treatment as measured by image cytometry. C) Detection of OCT4A and p21Cip1 by flow cytometry
after ETO treatment. Data collected over 11 days indicate an increasing expression and heterogeneity, with numerous
Dow
nloa
ded
by [
Uni
vers
ity o
f So
utha
mpt
on H
ighf
ield
] at
04:
36 2
9 Ju
ne 2
015

38
double positive cells at the time of maximal increase (day 5). Starting from day 7 their expression, double-positive
population and degree of heterogeneity gradually decreases during the recovery of clonogenic growth.
Dow
nloa
ded
by [
Uni
vers
ity o
f So
utha
mpt
on H
ighf
ield
] at
04:
36 2
9 Ju
ne 2
015

39
Figure 3: Analysis of pluripotency transcription factors in response to ETO treatment in PA-1 cells. A) Protein expression
of p53, p21Cip1, OCT4A, SOX2 and NANOG were analysed by immunoblotting at indicated time points after ETO-
treatment. GAPDH was used as a loading control NT2 cells were used as a positive control for pluripotency genes
OCT4A, SOX2 and NANOG. p53 and p2Cip1 protein expression was upregulated in the DNA damage response. An
upregulation of the OCT4A protein was detected from day 1 post ETO treatment, while SOX2 remained low and
unchanged post ETO expression. NANOG was not detected in NT or ETO treated PA-1 cells. Results are representative
of 3 independent experiments. B) Semi-automatic image cytometry of SOX2 expression was performed on the nuclei of
individual cells. Box-plots indicate the heterogeneity and expression levels measured. The data show that SOX2 remains
unresponsive to ETO-treatment.
Dow
nloa
ded
by [
Uni
vers
ity o
f So
utha
mpt
on H
ighf
ield
] at
04:
36 2
9 Ju
ne 2
015
40
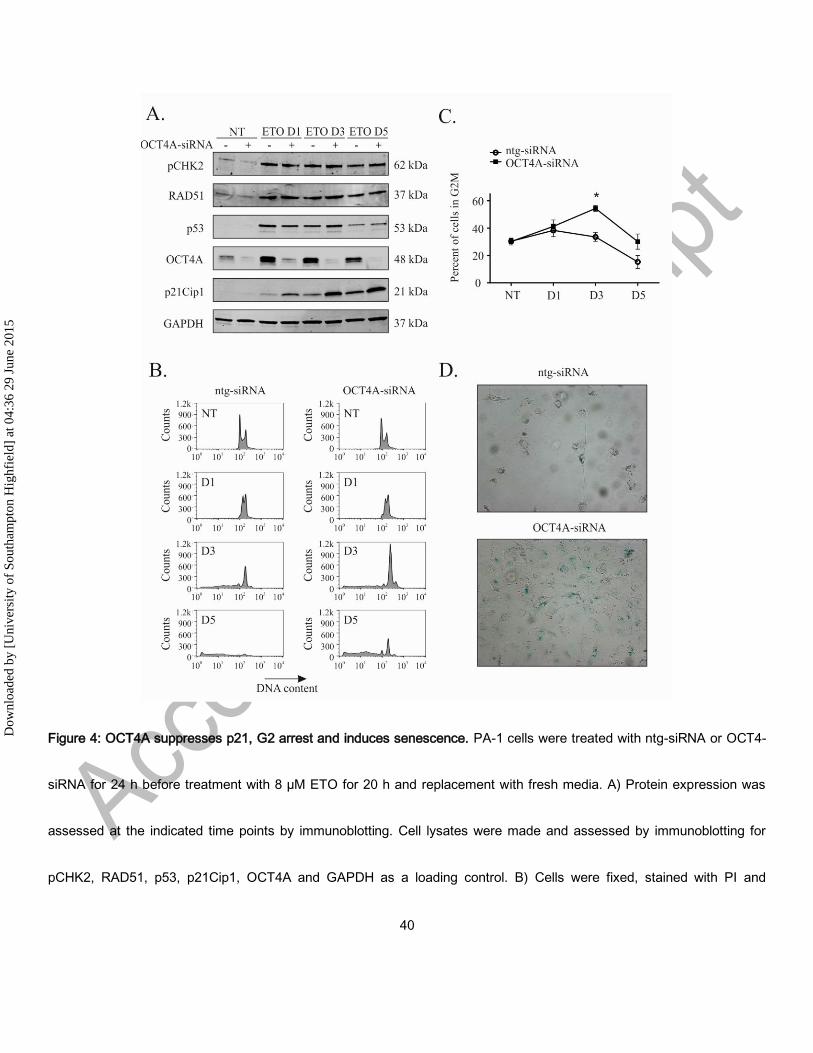
Figure 4: OCT4A suppresses p21, G2 arrest and induces senescence. PA-1 cells were treated with ntg-siRNA or OCT4-
siRNA for 24 h before treatment with 8 µM ETO for 20 h and replacement with fresh media. A) Protein expression was
assessed at the indicated time points by immunoblotting. Cell lysates were made and assessed by immunoblotting for
pCHK2, RAD51, p53, p21Cip1, OCT4A and GAPDH as a loading control. B) Cells were fixed, stained with PI and
Dow
nloa
ded
by [
Uni
vers
ity o
f So
utha
mpt
on H
ighf
ield
] at
04:
36 2
9 Ju
ne 2
015

41
analysed by flow cytometry. Both ntg-siRNA treated and OCT4-siRNA treated cells underwent a G2M arrest followibg
ETO treatment, which is more profound at day 3 and 5 in OCT4A-siRNA-treated cells. There is subsequently a much
lower extent of cell death (sub G1) in OCT4A-siRNA treated cells. C) The G2M arrest was calculated from the DNA
histograms shown in B) and demonstrate significantly higher levels in OCT4A-silenced cells (*p <0.05, n=3). D) PA-1 cells
were treated with ETO as above and assessed for Sa-β-gal activity after 5 days. Senescence, as monitored by Sa-β-gal
activity, was increased by OCT4A-silencing. Both ntg-siRNA and OCT4A-siRNA treated cells became large following ETO
treatment but non-silenced cells lacked Sa-β-gal activity.
Dow
nloa
ded
by [
Uni
vers
ity o
f So
utha
mpt
on H
ighf
ield
] at
04:
36 2
9 Ju
ne 2
015

42
Figure 5: OCT4A silencing inhibits clonal recovery of ETO-treated PA-1 cells. PA-1 cells were treated with ntg-siRNA or
OCT4A-siRNA for 24 h before treatment with 8 µM ETO for 20 h and replacement with fresh media. Cells were
maintained until day 11. Clonal recovery was observed in non-silenced cells but not in OCT4A-silenced cells, which
maintained a flat senescent like morphology. B) Cells were fixed, stained with PI and analysed by flow cytometry. A return
of the G1 peak was observed in non-silenced ntg cells whereas OCT4A-silenced cells maintained a profound G2 arrest.
OCT4A-silenced cells entered rounds of endoreduplication with genomes as large as 32C observed.
Dow
nloa
ded
by [
Uni
vers
ity o
f So
utha
mpt
on H
ighf
ield
] at
04:
36 2
9 Ju
ne 2
015
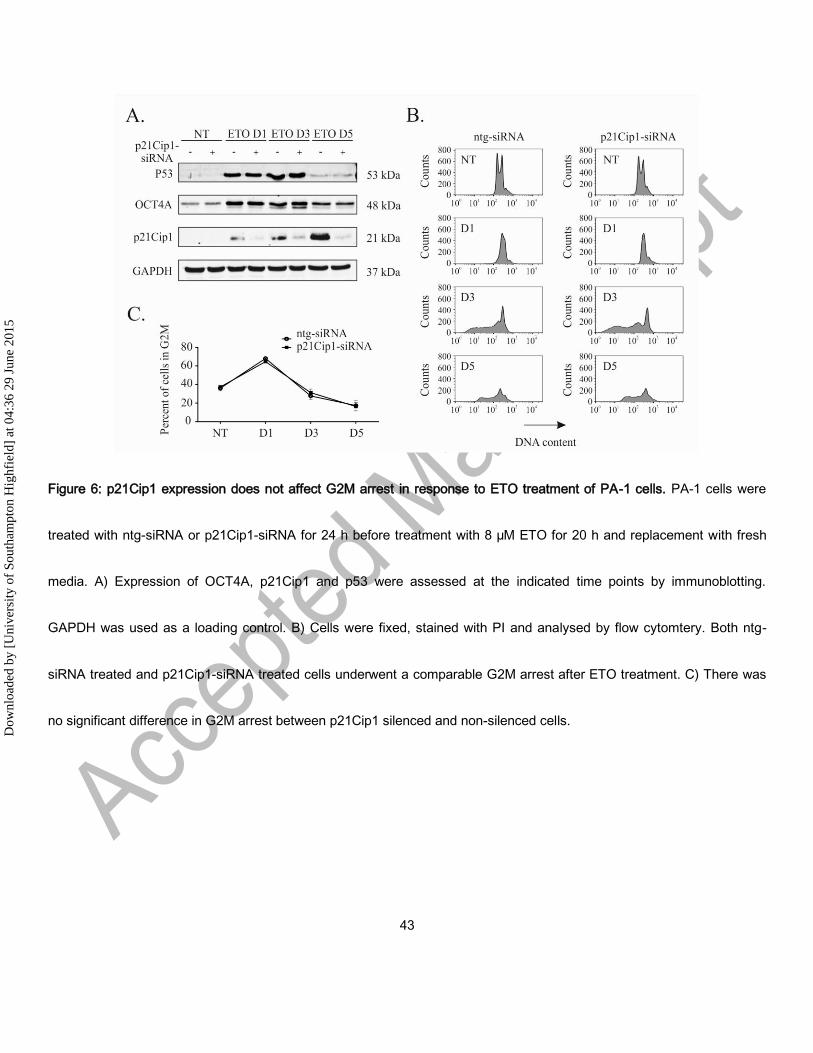
43
Figure 6: p21Cip1 expression does not affect G2M arrest in response to ETO treatment of PA-1 cells. PA-1 cells were
treated with ntg-siRNA or p21Cip1-siRNA for 24 h before treatment with 8 µM ETO for 20 h and replacement with fresh
media. A) Expression of OCT4A, p21Cip1 and p53 were assessed at the indicated time points by immunoblotting.
GAPDH was used as a loading control. B) Cells were fixed, stained with PI and analysed by flow cytomtery. Both ntg-
siRNA treated and p21Cip1-siRNA treated cells underwent a comparable G2M arrest after ETO treatment. C) There was
no significant difference in G2M arrest between p21Cip1 silenced and non-silenced cells.
Dow
nloa
ded
by [
Uni
vers
ity o
f So
utha
mpt
on H
ighf
ield
] at
04:
36 2
9 Ju
ne 2
015

44
Figure 7: Activation of AMPK and OCT4A in response to ETO-treatment. PA-1 cells were treated with 8 µM ETO for 20 h
and replacement with fresh media. Cells were harvested after 4 days before immunofluorescent staining for OCT4A,
pAMPKThr172 and DAPI. A) Non-treated (upper panel) and ETO-treated (lower panel) samples were compared. AMPK and
OCT4 are both activated by ETO (day 4) in interphase cells, however pAMPK is located in multiple centrosomes of
arrested metaphases, while OCT4A does not; (B) Scatterplot of image cytometry of OCT4A and pAMPK in individual cells
assessed on day 4. There is a clear correlation between enhanced expression of OCT4A and pAMPKThr172 of ETO-treated
Dow
nloa
ded
by [
Uni
vers
ity o
f So
utha
mpt
on H
ighf
ield
] at
04:
36 2
9 Ju
ne 2
015

45
cells; (C) OCT4A and pAMPKThr172 immunofluorescence in PA-1 cells 4 days after ETO-treatment. OCT4A and
pAMPKThr172 are mostly expressed in the same interphase nuclei, but an extremely high signal of pAMPK but not OCT4A
is found within apoptotic cells. Staining of pAMPKThr172 is associated with euchromatin, while the pattern of OCT4A
staining is karyoplasmic (not bound to the chromatin). BRG – a three-band optical filter. Bars =20 µm.
Dow
nloa
ded
by [
Uni
vers
ity o
f So
utha
mpt
on H
ighf
ield
] at
04:
36 2
9 Ju
ne 2
015
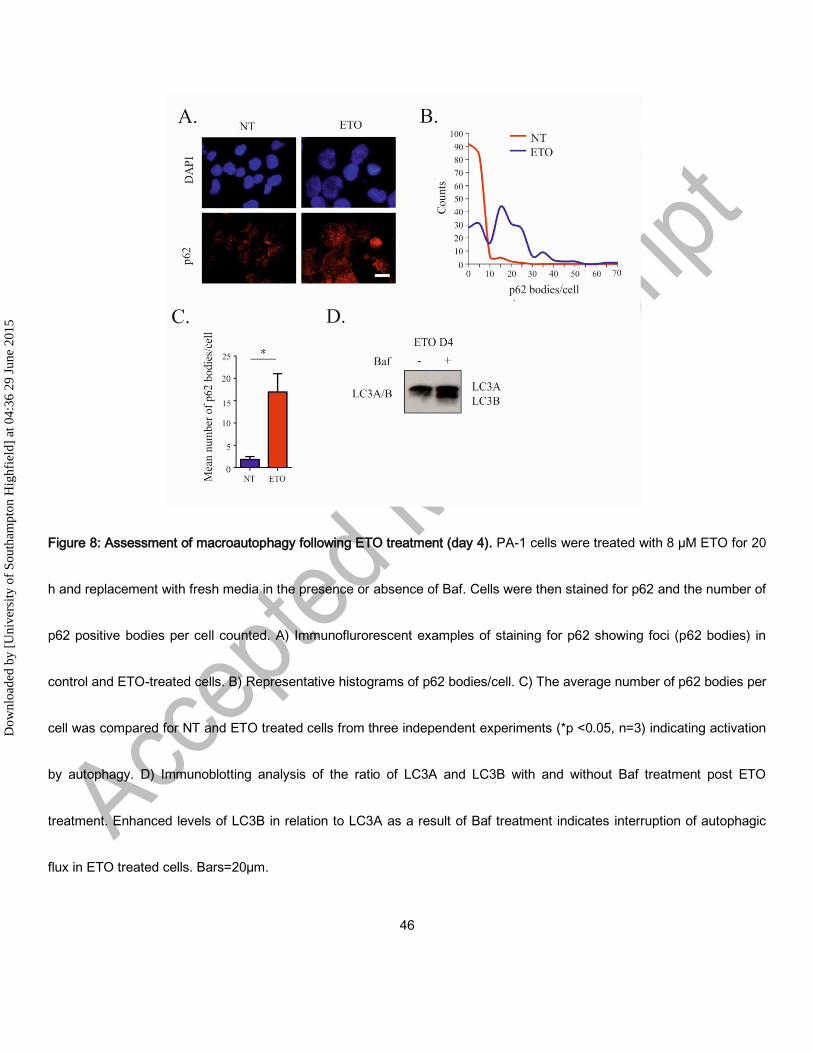
46
Figure 8: Assessment of macroautophagy following ETO treatment (day 4). PA-1 cells were treated with 8 µM ETO for 20
h and replacement with fresh media in the presence or absence of Baf. Cells were then stained for p62 and the number of
p62 positive bodies per cell counted. A) Immunoflurorescent examples of staining for p62 showing foci (p62 bodies) in
control and ETO-treated cells. B) Representative histograms of p62 bodies/cell. C) The average number of p62 bodies per
cell was compared for NT and ETO treated cells from three independent experiments (*p <0.05, n=3) indicating activation
by autophagy. D) Immunoblotting analysis of the ratio of LC3A and LC3B with and without Baf treatment post ETO
treatment. Enhanced levels of LC3B in relation to LC3A as a result of Baf treatment indicates interruption of autophagic
flux in ETO treated cells. Bars=20µm.
Dow
nloa
ded
by [
Uni
vers
ity o
f So
utha
mpt
on H
ighf
ield
] at
04:
36 2
9 Ju
ne 2
015

47
Dow
nloa
ded
by [
Uni
vers
ity o
f So
utha
mpt
on H
ighf
ield
] at
04:
36 2
9 Ju
ne 2
015

48
Figure 9: The relationship between autophagy functionality and senescence marker p16ink4ain ETO-treated PA-1 cells.
PA-1 cells were treated with 8 µM ETO for 20 h without or with Baf, prior to media being removed and replaced with fresh
media; cells were harvested 48h later (day 4). (A,B) imunofluorescent staining for p16ink4a (red), LAMP2 (green) or DAPI
(blue). (A) As shown via the BRG optical filter, (B) only the green filter for LAMP2 demonstrating high level of functional
autophagy sequestrating p16ink4a- containing aggresomes. (B,C) show examples of autophagic failure, where on (B)
sequestration of p16ink4a is partly lost, diffusing in to the cytoplasm, while on (C) the dysfunction of autophagy is
evidenced by a large vacuole overloaded with undigested p16ink4a. In all three cases, the nuclei are impaired: (B) ‘laced’;
(C) displaced and twisted by a large autophagic vacuole with some DNA lost from cell nucleus observed. These
processes were observed both in ETO-treated (B) and more commonly in ETO+BAF(c) treated cells. (D) An image
showing cell nuclei of normal and sickle-type shape as stained specifically for DNA with Toluidine bluein the ETO-teated
specimen (sickle-like shaped nuclei are shown with arrows).
Dow
nloa
ded
by [
Uni
vers
ity o
f So
utha
mpt
on H
ighf
ield
] at
04:
36 2
9 Ju
ne 2
015

50
Figure 10: ETO and ETO+Baf impair cell nuclear integrity causing a delay in late S-phase in a proportion of cells with
persistent DNA damage. (A) Disintegration of the nucleus is observed in ETO treated cells following prolonged Baf
exposure (72h), where impaired autophagic flux is confirmed by alveolar structure of LC3B-positive cytoplasm in the
absence of LC3 foci; Bars= 20 µm. (B) Persistent DNA damage leads to destruction of the epichromatin ternary complex
(a specific conformation of nucleosomes attached to lamin B1) seen by a decrease in staining by the Pl2-6 antibody
where Chk2-positive foci is detected in ETO-treated PA1 cells at day 4. (C) Representative DNA histograms obtained by
image cytometry of ETO-treated and ETO+BAF-treated cells samples (day 4 after treatment); one of three independent
experiments. BafA alone causes partial arrest in G1 in control (NT)cells and a subsequent decrease of the G2 fraction;
Dow
nloa
ded
by [
Uni
vers
ity o
f So
utha
mpt
on H
ighf
ield
] at
04:
36 2
9 Ju
ne 2
015

51
ETO-treatment induces G2-arrest, however, a proportion of cells remain delayed in late S-phase (<4C). Cells with the
DNA content <4C and 4C(G2) still reach peaks of corresponding doubling, <8C and 8C. Suppression of autophagy by Baf
in ETO-treated cells favours an increase of the proportion of cells in the <4C fraction and reduces the number of cells.
Dow
nloa
ded
by [
Uni
vers
ity o
f So
utha
mpt
on H
ighf
ield
] at
04:
36 2
9 Ju
ne 2
015