On 25 February 2011 - Structure Engineering and Earth Quake · called the Mentawai Islands. The...
54
(Project Rainbow I) NATURAL HAZARD AND RISK ENGINEERING (NHRE) WS 2010/2011 By Firdaus (91128) This report is submitted as a part of subject of Geographical Information System (GIS) and Building Stock Survey On 25 February 2011
Transcript of On 25 February 2011 - Structure Engineering and Earth Quake · called the Mentawai Islands. The...
(Project Rainbow I)
NATURAL HAZARD AND RISK ENGINEERING (NHRE) WS 2010/2011
By Firdaus (91128)
This report is submitted as a part of subject of Geographical Information System (GIS) and Building Stock Survey
On 25 February 2011

CONTENTS
1. General 1 2. Political Overview 1
2.1 Population Density 1
2.2 Important Cities 3
2.3 Lakes and Rivers in Indonesia 8
3. Earthquake Catalogs 11
3.1 Historical Earthquakes 11
3.2 Seismicity at Important Cities 13
4. Shaking Maps 15
5. PGA Map from GSHAP 18
6. Map of National Building Code 20
6.1 Type of soil and propagation of earthquake wave 22
7. Geological and Topographic Maps 24
7.1 Geological Maps 24
7.2 Topographical Maps 28
8. Shearwave Velocity Maps 30
9. Building Stock 33
9.1 Typical Building Types 33
9.2 Macroseismic Intensity Scale 33
9.3 Vulnerability Class 34
9.4 Example of Building Stock in Center of Jakarta 39
10. Conclusions and Recommendations 45
11. References 46
12. Annex 1 47

Project Rainbow I | 1
1. General
Administratively, Indonesia consists of 33 provinces, five of which have special status. Each province has
its own political legislature and governor. The provinces are subdivided into regencies and cities, which
are further subdivided into sub districts, and again into village groupings. The provinces of Aceh,
Jakarta, Yogyakarta, and West Papua have greater legislative privileges and a higher degree of autonomy
from the central government than the other provinces.
Indonesia lies between latitudes 11°S and 6°N, and longitudes 95°E and 141°E. It consists of 17,508
islands, about 6,000 of which are inhabited. These are scattered over both sides of the equator. The
largest are Java, Sumatra, Borneo (shared with Brunei and Malaysia), New Guinea (shared with Papua
New Guinea), and Sulawesi. Indonesia shares land borders with Malaysia on Borneo, Papua New Guinea
on the island of New Guinea, and East Timor on the island of Timor. Indonesia shares maritime borders
across narrow straits with Singapore, Malaysia, and the Philippines to the north, and with Australia to
the south. The capital, Jakarta, is on Java and is the nation's largest city, followed by Surabaya, Bandung,
Medan, and Semarang.
Indonesia Region that famous as "supermarket of disaster" is located in a tectonically very complex and
very active area, this region consists of three large tectonic plates and nine small tectonic plates. The
plate with different types of movement that has created subduction zones and fault zones which is
continuously active.
2. Political Overview
2.1 Population Density
The population of Indonesia according to the 2010 national census is 237.6 million, with 58% living on
the island of Java, the world's most populous island. Despite a fairly effective family planning program
that has been in place since the 1960s, the population is expected to grow to around 254 million by
2020 and 288 million by 2050. Based on the updated database from official website of government
(http://bps.go.id), detail of inhabitants in Indonesia are:

Project Rainbow I | 2
Table 1. Population density for each province
ID Province 2000 2010 Population
Density at 2010 1 Nanggroe Aceh Darussalam 3,929,234 4,031,589 712 Sumatera Utara 11,642,488 12,450,911 1743 Sumatera Barat 4,248,515 4,566,126 1094 Riau 3,907,763 4,579,219 515 Jambi 2,407,166 2,635,968 536 Sumatera Selatan 6,210,800 6,782,339 797 Bengkulu 1,455,500 1,549,273 738 Lampung 6,730,751 7,116,177 2119 Kep. Bangka Belitung 899,968 1,043,456 6410 Kepulauan Riau 1,040,207 1,274,848 14111 DKI Jakarta 8,361,079 8,860,381 1274312 Jawa Barat 35,724,093 38,965,440 104913 Jawa Tengah 31,223,258 31,977,968 93014 DI Yogyakarta 3,121,045 3,343,651 105815 Jawa Timur 34,765,993 36,294,280 75316 Banten 8,098,277 9,028,816 96417 Bali 3,150,057 3,383,572 59718 Nusa Tenggara Barat 4,008,601 4,184,411 21119 Nusa Tenggara Timur 3,823,154 4,260,294 9020 Kalimantan Barat 4,016,353 4,052,345 2721 Kalimantan Tengah 1,855,473 1,914,900 1222 Kalimantan Selatan 2,984,026 3,281,993 8823 Kalimantan Timur 2,451,895 2,848,798 1424 Sulawesi Utara 2,000,872 2,128,780 14425 Sulawesi Tengah 2,175,993 2,294,841 3826 Sulawesi Selatan 7,159,170 7,509,704 16127 Sulawesi Tenggara 1,820,379 1,963,025 5328 Gorontalo 833,496 922,176 7629 Sulawesi Barat 891,618 969,429 5930 Maluku 1,166,300 1,251,539 2731 Maluku Utara 815,101 884,142 2832 Irian Jaya Barat 529,689 643,012 733 Papua 1,684,144 1,875,388 6 Total 205,132,458 218,868,791 20,161
DKI Jakarta, as capital city of Indonesia, is the highest ranking of population density in Indonesia and
probably in the world since the number of population is relatively really big, whereas the size of area is
really small. This situation is really common in Indonesia, where people are interested to find a job in the

Project Rainbow I | 3
big city since they are expecting to find a new good life in the big city. It causes urbanization problem in
some cities.
Figure 1. Population density map of Indonesia
2.2 Important Cities
2.2.1 Aceh Province
Aceh, generally anglicized as is a special territory of Indonesia, located on the northern tip of the
island of Sumatra. Aceh was the closest point of land to the epicenter of the massive 2004 Indian
Ocean earthquake, which triggered a tsunami that devastated much of the western coast of the
region, including part of the capital of Banda Aceh. Approximately 170,000 Indonesians were killed
or went missing in the disaster, and approximately 500,000 were left homeless, with almost all the
damage occurring in Aceh.
The Figure below describes the population density at Aceh Province which was surveyed at 2010.

Project Rainbow I | 4
`
Figure 2. Population density map of Aceh Province
2.2.2 West Sumatera Province
West Sumatra lies in the middle of the western coast of Sumatra, and has an area of 42,130.82 km².
Geographic features include plains, mountainous volcanic highlands formed by the
Barisan mountain range that runs from north‐west to south‐east, and an offshore island archipelago
called the Mentawai Islands. The West Sumatran coastline faces the Indian Ocean and stretches
375 km from North Sumatra province in the north‐west to Bengkulu in the south‐east. The Figure
below describes the population density at West Sumatera Province which was surveyed at 2010.
Figure 3. Population density map of West Sumatera Province
Project Rainbow I | 5
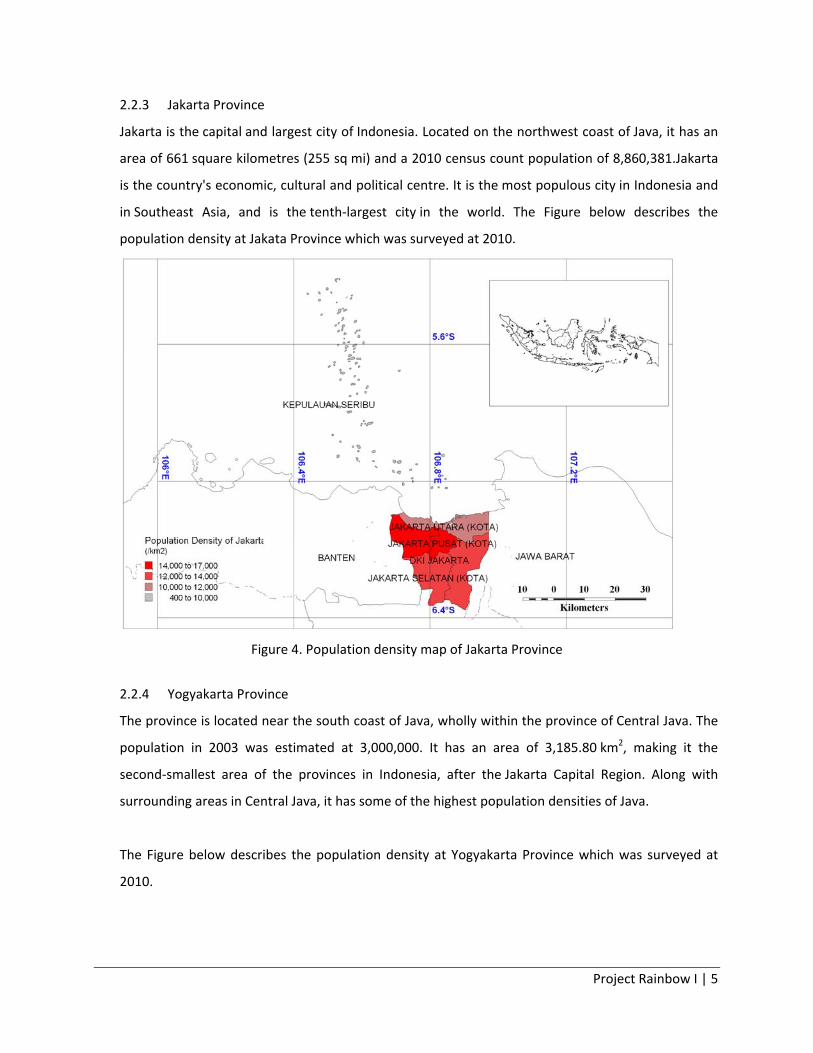
2.2.3 Jakarta Province
Jakarta is the capital and largest city of Indonesia. Located on the northwest coast of Java, it has an
area of 661 square kilometres (255 sq mi) and a 2010 census count population of 8,860,381.Jakarta
is the country's economic, cultural and political centre. It is the most populous city in Indonesia and
in Southeast Asia, and is the tenth‐largest city in the world. The Figure below describes the
population density at Jakata Province which was surveyed at 2010.
Figure 4. Population density map of Jakarta Province
2.2.4 Yogyakarta Province
The province is located near the south coast of Java, wholly within the province of Central Java. The
population in 2003 was estimated at 3,000,000. It has an area of 3,185.80 km2, making it the
second‐smallest area of the provinces in Indonesia, after the Jakarta Capital Region. Along with
surrounding areas in Central Java, it has some of the highest population densities of Java.
The Figure below describes the population density at Yogyakarta Province which was surveyed at
2010.

Project Rainbow I | 6
Figure 5. Population density map of Yogyakarta Province
2.2.5 South Sulawesi Province
South Sulawesi is a province of Indonesia, located on the western southern peninsula of Sulawesi
Island. The province is bordered by Central Sulawesi province to the north, South East
Sulawesi province to the east and West Sulawesi province to the west (West Sulawesi province was
split from South Sulawesi in 2004). It is the most populated and densest province on Sulawesi Island.
The Figure below describes the population density at South Sulawesi Province which was surveyed
at 2010.
Figure 6. Population density map of South Sulawesi Province
Project Rainbow I | 7
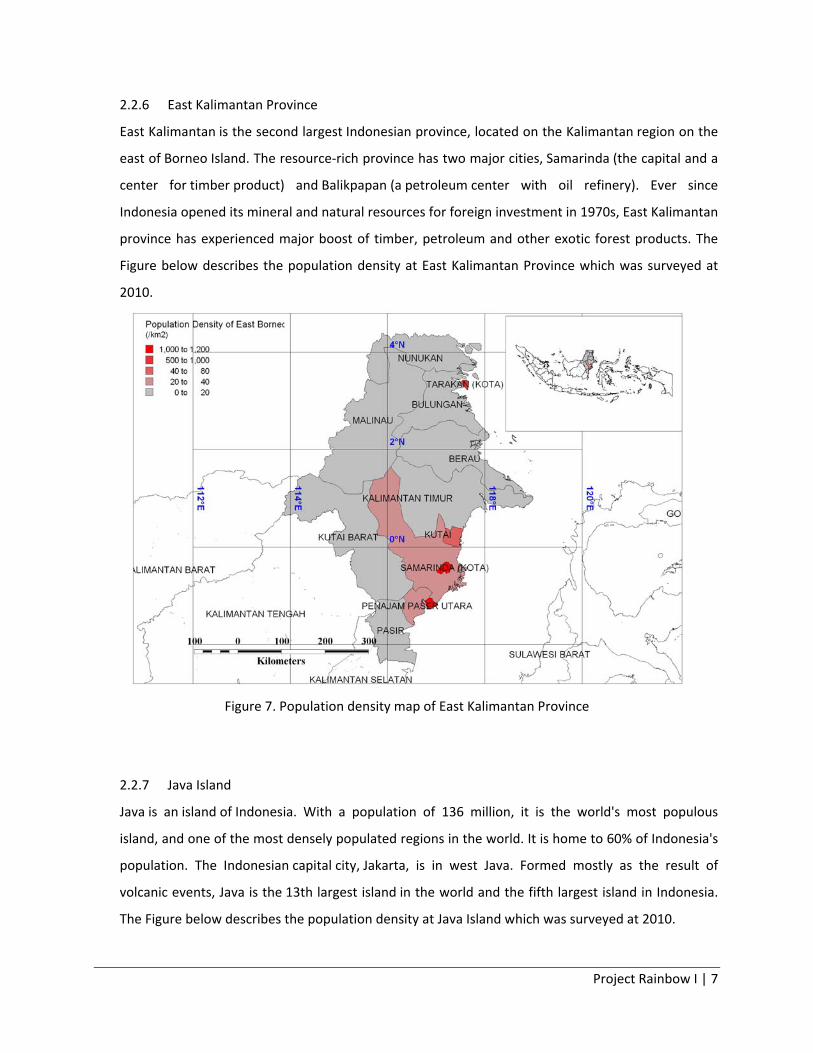
2.2.6 East Kalimantan Province
East Kalimantan is the second largest Indonesian province, located on the Kalimantan region on the
east of Borneo Island. The resource‐rich province has two major cities, Samarinda (the capital and a
center for timber product) and Balikpapan (a petroleum center with oil refinery). Ever since
Indonesia opened its mineral and natural resources for foreign investment in 1970s, East Kalimantan
province has experienced major boost of timber, petroleum and other exotic forest products. The
Figure below describes the population density at East Kalimantan Province which was surveyed at
2010.
Figure 7. Population density map of East Kalimantan Province
2.2.7 Java Island
Java is an island of Indonesia. With a population of 136 million, it is the world's most populous
island, and one of the most densely populated regions in the world. It is home to 60% of Indonesia's
population. The Indonesian capital city, Jakarta, is in west Java. Formed mostly as the result of
volcanic events, Java is the 13th largest island in the world and the fifth largest island in Indonesia.
The Figure below describes the population density at Java Island which was surveyed at 2010.

Project Rainbow I | 8
Figure 8. Population density map of Java Island
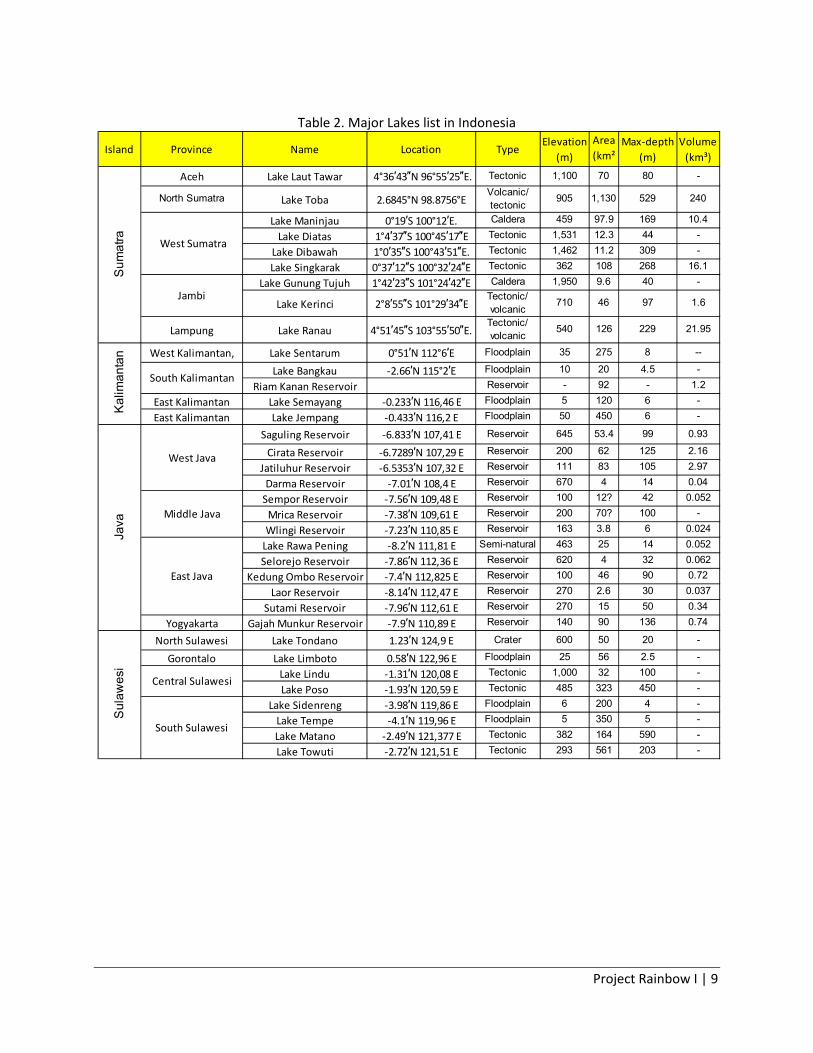
2.3 Lakes and Rivers in Indonesia
Indonesia has 521 natural lakes and over 100 reservoirs, covering approximately 21,000 km². The total
volume of water held is approximately 500 km³. The largest lake, by both area and volume, is Lake
Toba in Sumatra. It holds 240 km³ of freshwater, and is largest lake body in Southeast Asia.
Indonesia has 3 of the 20 deepest lakes in the world ‐ Lake Matano in Sulawesi (590 m), Lake
Toba in Sumatra (529 m) and Lake Poso in Sulawesi (450 m). The only lake in Indonesia having a
cryptodepression (the bottom of the lake is below sea level) is Lake Matano.
Project Rainbow I | 9
Table 2. Major Lakes list in Indonesia
Island Province Name Location TypeElevation
(m)
Area (km²
Max‐depth (m)
Volume (km³)
Aceh Lake Laut Tawar 4°36′43″N 96°55′25″E. Tectonic 1,100 70 80 -
North Sumatra Lake Toba 2.6845°N 98.8756°EVolcanic/ tectonic
905 1,130 529 240
Lake Maninjau 0°19′S 100°12′E. Caldera 459 97.9 169 10.4
Lake Diatas 1°4′37″S 100°45′17″E Tectonic 1,531 12.3 44 -
Lake Dibawah 1°0′35″S 100°43′51″E. Tectonic 1,462 11.2 309 -
Lake Singkarak 0°37′12″S 100°32′24″E Tectonic 362 108 268 16.1
Lake Gunung Tujuh 1°42′23″S 101°24′42″E Caldera 1,950 9.6 40 -
Lake Kerinci 2°8′55″S 101°29′34″ETectonic/ volcanic
710 46 97 1.6
Lampung Lake Ranau 4°51′45″S 103°55′50″E.Tectonic/ volcanic
540 126 229 21.95
West Kalimantan, Lake Sentarum 0°51′N 112°6′E Floodplain 35 275 8 --
Lake Bangkau ‐2.66′N 115°2′E Floodplain 10 20 4.5 -
Riam Kanan Reservoir Reservoir - 92 - 1.2
East Kalimantan Lake Semayang ‐0.233′N 116,46 E Floodplain 5 120 6 -
East Kalimantan Lake Jempang ‐0.433′N 116,2 E Floodplain 50 450 6 -
Saguling Reservoir ‐6.833′N 107,41 E Reservoir 645 53.4 99 0.93
Cirata Reservoir ‐6.7289′N 107,29 E Reservoir 200 62 125 2.16
Jatiluhur Reservoir ‐6.5353′N 107,32 E Reservoir 111 83 105 2.97
Darma Reservoir ‐7.01′N 108,4 E Reservoir 670 4 14 0.04
Sempor Reservoir ‐7.56′N 109,48 E Reservoir 100 12? 42 0.052
Mrica Reservoir ‐7.38′N 109,61 E Reservoir 200 70? 100 -
Wlingi Reservoir ‐7.23′N 110,85 E Reservoir 163 3.8 6 0.024
Lake Rawa Pening ‐8.2′N 111,81 E Semi-natural 463 25 14 0.052
Selorejo Reservoir ‐7.86′N 112,36 E Reservoir 620 4 32 0.062
Kedung Ombo Reservoir ‐7.4′N 112,825 E Reservoir 100 46 90 0.72
Laor Reservoir ‐8.14′N 112,47 E Reservoir 270 2.6 30 0.037
Sutami Reservoir ‐7.96′N 112,61 E Reservoir 270 15 50 0.34
Yogyakarta Gajah Munkur Reservoir ‐7.9′N 110,89 E Reservoir 140 90 136 0.74
North Sulawesi Lake Tondano 1.23′N 124,9 E Crater 600 50 20 -
Gorontalo Lake Limboto 0.58′N 122,96 E Floodplain 25 56 2.5 -
Lake Lindu ‐1.31′N 120,08 E Tectonic 1,000 32 100 -
Lake Poso ‐1.93′N 120,59 E Tectonic 485 323 450 -
Lake Sidenreng ‐3.98′N 119,86 E Floodplain 6 200 4 -
Lake Tempe ‐4.1′N 119,96 E Floodplain 5 350 5 -
Lake Matano ‐2.49′N 121,377 E Tectonic 382 164 590 -
Lake Towuti ‐2.72′N 121,51 E Tectonic 293 561 203 -
South Sulawesi
Central Sulawesi
Sum
atra
Kal
iman
tan
Java
Sul
awes
i
West Sumatra
Jambi
South Kalimantan
West Java
East Java
Middle Java

Project Rainbow I | 10
Table 3. Major Rivers list in Indonesia
There are 3 major rivers (Mahakam, Musi and Citarum river) and 13 major lakes which are
illustrated in this map.
Figure 9. Major Lakes and Rivers map of Indonesia
Island Name length (km)
Kalimantan Kapuas 1143Barito 890Mahakam 980
Java, North Coast Ciliwung 119 Citarum 225
Solo 600Brantas 320
Java, South Coast Opak 65New Guinea, North Coast Mamberamo 670
Sulawesi Sadang 182Lasolo 80Bongka 126
Poso 96Sumatera, North Coast Aceh 125
Bahorok 140Rokan 100
Siak 155Kampar 450Indragiri 250Batang Hari 3322
Musi 750

Project Rainbow I | 11
3. Earthquake Catalogs
3.1 Historical Earthquakes
Indonesia's location on the edges of the Pacific, Eurasian, and Australian tectonic plates makes it the
site of numerous volcanoes and frequent earthquakes. Indonesia has at least 150 active volcanoes,
including Krakatau and Tambora, both famous for their devastating eruptions in the 19th century.
The eruption of the Toba super volcano, approximately 70,000 years ago, was one of the largest
eruptions ever, and a global catastrophe. Recent disasters due to seismic activity include the 2004
tsunami that killed an estimated 167,736 in northern Sumatera and the Yogyakarta earthquake in
2006. However, volcanic ash is a major contributor to the high agricultural fertility that has
historically sustained the high population densities of Java and Bali.
Table 4. Major Earthquake list in Indonesia
Date Location Magnitude Fatalities Epicenter Depth (km) Tsunami
1797 02 10 Sumatra 8.4 >300 1.0°S 99.0°E unknown yes 1833 11 25 Sumatra 8.8‐9.2 'numerous' 2.5°S 100.5°E unknown yes 1861 02 16 Sumatra 8.5 ' thousand' 1.0°N 97.5°E unknown yes 1917 01 20 Bali 1,500 1938 02 01 Banda Sea 8.5 5.25°S 130.5°E 25 yes 1976 06 25 Papua 7.1 5,000 1984 11 17 Northern Sumatra 7.2 0.20°N 98.03°E 33 no 1992 12 12 Flores Region 7.8 2,500 1994 06 03 Off the Southern Coast of
Eastern Java 7.8 200+ 10.477°S 112.835°E 18 yes
1996 02 17 Biak 8.1 108 0.891°S 136.952°E 33 yes 2000 06 04 Southern Sumatra 7.9 103 2002 10 10 Western New Guinea 7.6 8 2002 11 02 Northern Sumatra 7.4 3 2003 05 26 Halmahera 7 1 2004 01 28 Seram 6.7 2004 02 05 Western New Guinea 7 37 2004 02 07 Western New Guinea 7.3 2004 07 25 Southern Sumatra 7.3 2004 11 11 Kepulauan Alor 7.5 34 2004 11 26 Papua 7.1 32 2004 12 26 Sumatra‐Andaman Islands 9.3 283,106 3.316°N 95.854°E 30 yes 2005 01 01 Off the West Coast of Northern
Sumatra 6.7
2005 02 19 Sulawesi 6.5 2005 02 26 Simeulue 6.8 2005 03 02 Banda Sea 7.1 2005 03 28 Northern Sumatra 8.6 1,313 2°04′35″N97°00′58″
E 30 yes
2005 04 10 Kepulauan Mentawai Region 6.7 2005 05 14 Nias Region 6.7 2005 05 19 Nias Region 6.9 2005 07 05 Nias Region 6.7

Project Rainbow I | 12
2005 11 19 Simeulue 6.5 2006 01 27 Banda Sea 7.6 5.473°S 128.131°E unknown no 2006 03 14 Seram 6.7 4 2006 05 16 Nias Region 6.8 2006 05 26 Java 6.3 5,780 7.962°S 110.458°E 10 no 2006 07 17 Java 7.7 730 9.295°S 107.347°E 48.6 yes 2006 07 23 Sulawesi 6.1 0.415°S 123.177°E 86.2 2006 12 18 North Sumatra 5.8 7 2007 01 21 Molucca Sea 7.5 4 2007 03 06 Sumatra 6.4, 6.3 68 ‐0.58°N 101.34°E unknown no 2007 08 09 Java 7.5[2] 282 no 2007 09 12 Sumatra 8.5, 7.9,
7.1 23 4.517°S 101.382°E 30 yes
2008 02 20 Simeulue 7.4 3 2008 02 25 Kepulauan Mentawai Region 7.0, 6.4,
6.6
2008 11 16 Sulawesi 7.5, 5.6 4 21 no 2009 01 04 West Papua 7.6 4 0.510°S 132.783°E 17 no 2009 02 12 Talaud Islands 7.2 3.902°N 126.400°E 20 no 2009 08 16 Siberut, Mentawai Islands 6.7 1.397°S 99.473°E 44.8 no 2009 09 02 Java 7 15 7.778°S 107.328°E 49 yes 2009 09 30 Sumatra 7.6 1,117 0.725°S 99.856°E 87 no 2010 04 06 Sumatra 7.8 2.36°N 97.132°E 31 no 2010 05 19 Sumatra 7.2 Unreported 3.775°N 96.055°E 45 no 2010 10 25 Sumatra 7.7 435 3.464°S 100.084°E 20.6 yes
Based on the table above and earthquake catalog from IRIS website which is free downloadable,
these data are plotted into the map below which are using significant earthquake events during
1964‐2011.
Figure 10. Earthquake History map of Indonesia (1964‐2011)
Project Rainbow I | 13
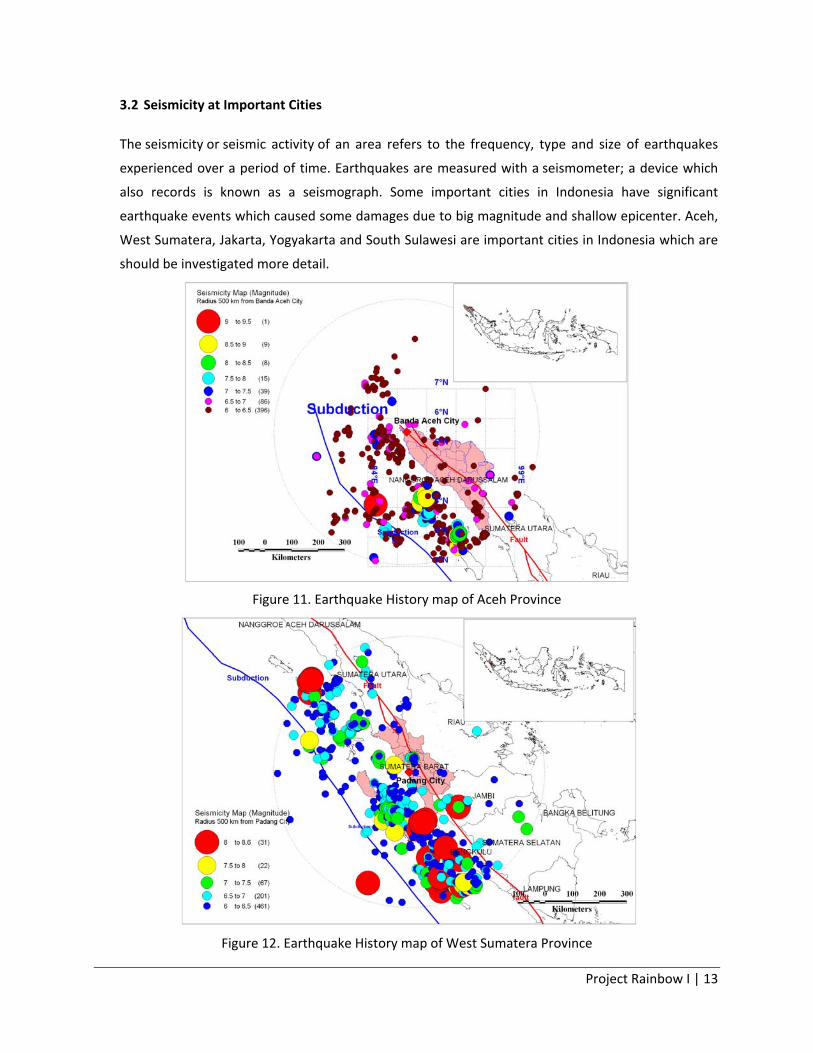
3.2 Seismicity at Important Cities
The seismicity or seismic activity of an area refers to the frequency, type and size of earthquakes
experienced over a period of time. Earthquakes are measured with a seismometer; a device which
also records is known as a seismograph. Some important cities in Indonesia have significant
earthquake events which caused some damages due to big magnitude and shallow epicenter. Aceh,
West Sumatera, Jakarta, Yogyakarta and South Sulawesi are important cities in Indonesia which are
should be investigated more detail.
Figure 11. Earthquake History map of Aceh Province
Figure 12. Earthquake History map of West Sumatera Province

Project Rainbow I | 14
Figure 13. Earthquake History map of Jakarta Province
Figure 14. Earthquake History map of Yogyakarta Province
Project Rainbow I | 15
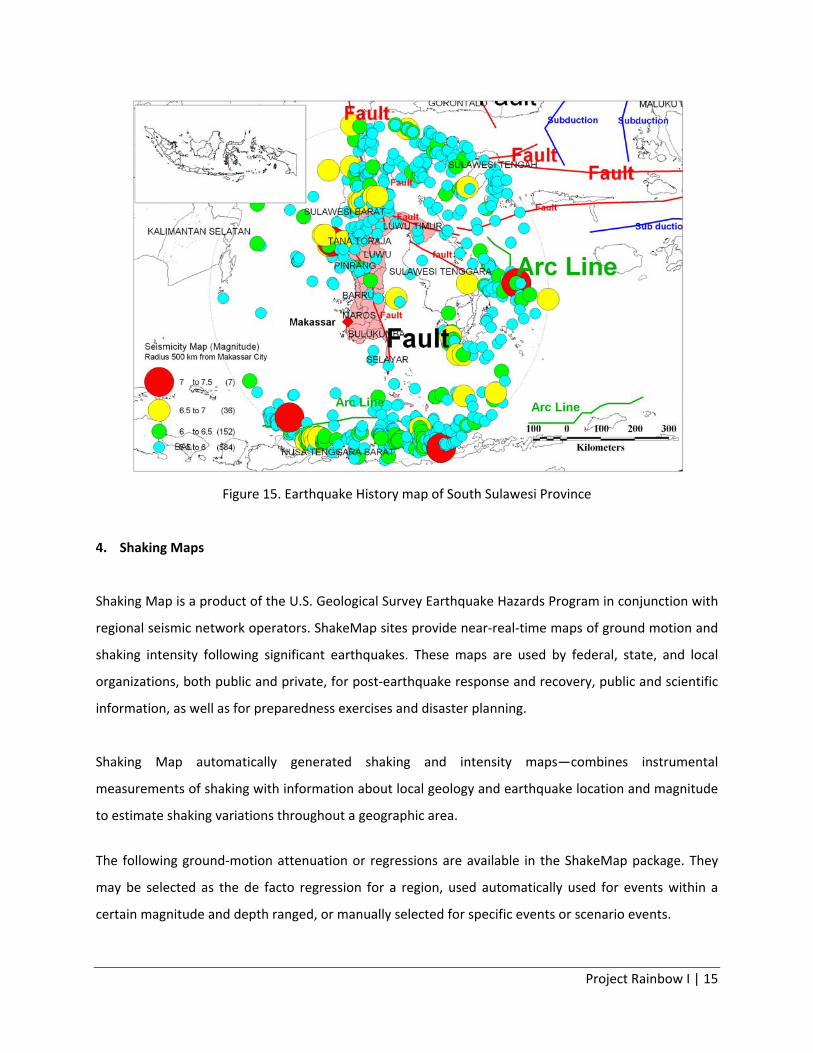
Figure 15. Earthquake History map of South Sulawesi Province
4. Shaking Maps
Shaking Map is a product of the U.S. Geological Survey Earthquake Hazards Program in conjunction with
regional seismic network operators. ShakeMap sites provide near‐real‐time maps of ground motion and
shaking intensity following significant earthquakes. These maps are used by federal, state, and local
organizations, both public and private, for post‐earthquake response and recovery, public and scientific
information, as well as for preparedness exercises and disaster planning.
Shaking Map automatically generated shaking and intensity maps—combines instrumental
measurements of shaking with information about local geology and earthquake location and magnitude
to estimate shaking variations throughout a geographic area.
The following ground‐motion attenuation or regressions are available in the ShakeMap package. They
may be selected as the de facto regression for a region, used automatically used for events within a
certain magnitude and depth ranged, or manually selected for specific events or scenario events.

Project Rainbow I | 16
Boore and others (1997), PGV modified by Newmark & Hall (1982)
So. California, default regression
Boatwright and others (2003) No. California, default regression Atkinson and Boore (2002) Scenarios only (Cascadia region) Somerville (1997) Scenarios only (directivity effects) Youngs and others (1997) Washington and Alaska (depth at least
41 km) ShakeMap Small Regression All regions (M<5.3)
Since 6 years ago, there are a lot of huge magnitudes of earthquake which occurred in Indonesia. For
instance, on 24 December 2004 earthquake, which was called Boxing Day, 30 September 2009 and 27
May 2006. The maps below describe shaking map for each huge earthquake event.
Figure 16. Shaking map on 26 December 2004
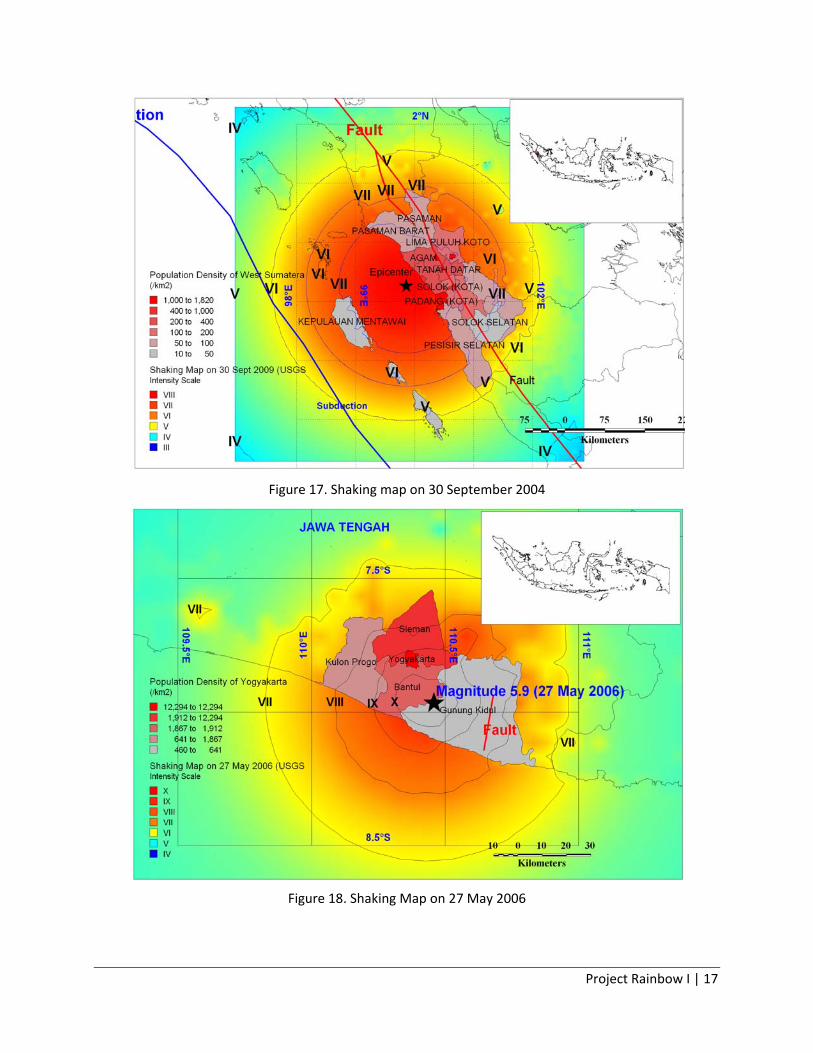
Project Rainbow I | 17
Figure 17. Shaking map on 30 September 2004
Figure 18. Shaking Map on 27 May 2006
Project Rainbow I | 18
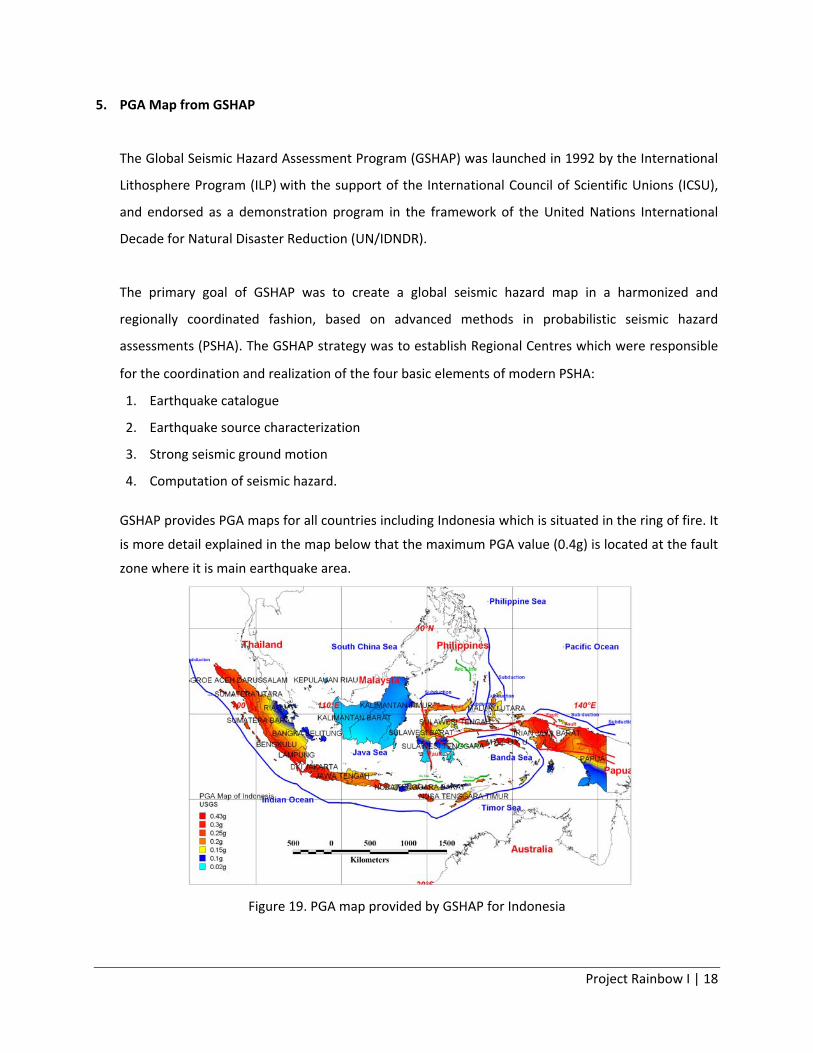
5. PGA Map from GSHAP
The Global Seismic Hazard Assessment Program (GSHAP) was launched in 1992 by the International
Lithosphere Program (ILP) with the support of the International Council of Scientific Unions (ICSU),
and endorsed as a demonstration program in the framework of the United Nations International
Decade for Natural Disaster Reduction (UN/IDNDR).
The primary goal of GSHAP was to create a global seismic hazard map in a harmonized and
regionally coordinated fashion, based on advanced methods in probabilistic seismic hazard
assessments (PSHA). The GSHAP strategy was to establish Regional Centres which were responsible
for the coordination and realization of the four basic elements of modern PSHA:
1. Earthquake catalogue
2. Earthquake source characterization
3. Strong seismic ground motion
4. Computation of seismic hazard.
GSHAP provides PGA maps for all countries including Indonesia which is situated in the ring of fire. It
is more detail explained in the map below that the maximum PGA value (0.4g) is located at the fault
zone where it is main earthquake area.
Figure 19. PGA map provided by GSHAP for Indonesia

Project Rainbow I | 19
The PGA map above should be comparable to the National Map of Indonesia which was generated
10 years ago. Some important cities have different specific PGA maps which are used to investigate
the seismic microzonation problem.
Figure 20. PGA map provided by GSHAP for West Sumatera Province
Figure 21. PGA map provided by GSHAP for Yogyakarta Province
Project Rainbow I | 20
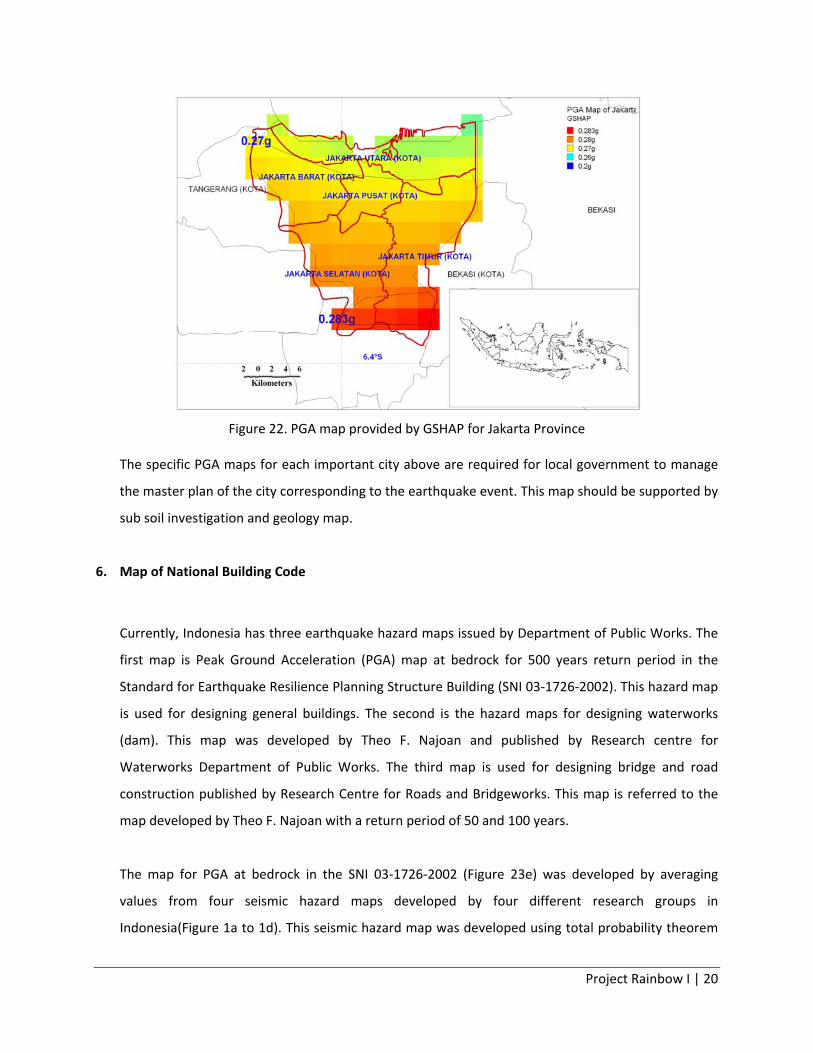
Figure 22. PGA map provided by GSHAP for Jakarta Province
The specific PGA maps for each important city above are required for local government to manage
the master plan of the city corresponding to the earthquake event. This map should be supported by
sub soil investigation and geology map.
6. Map of National Building Code
Currently, Indonesia has three earthquake hazard maps issued by Department of Public Works. The
first map is Peak Ground Acceleration (PGA) map at bedrock for 500 years return period in the
Standard for Earthquake Resilience Planning Structure Building (SNI 03‐1726‐2002). This hazard map
is used for designing general buildings. The second is the hazard maps for designing waterworks
(dam). This map was developed by Theo F. Najoan and published by Research centre for
Waterworks Department of Public Works. The third map is used for designing bridge and road
construction published by Research Centre for Roads and Bridgeworks. This map is referred to the
map developed by Theo F. Najoan with a return period of 50 and 100 years.
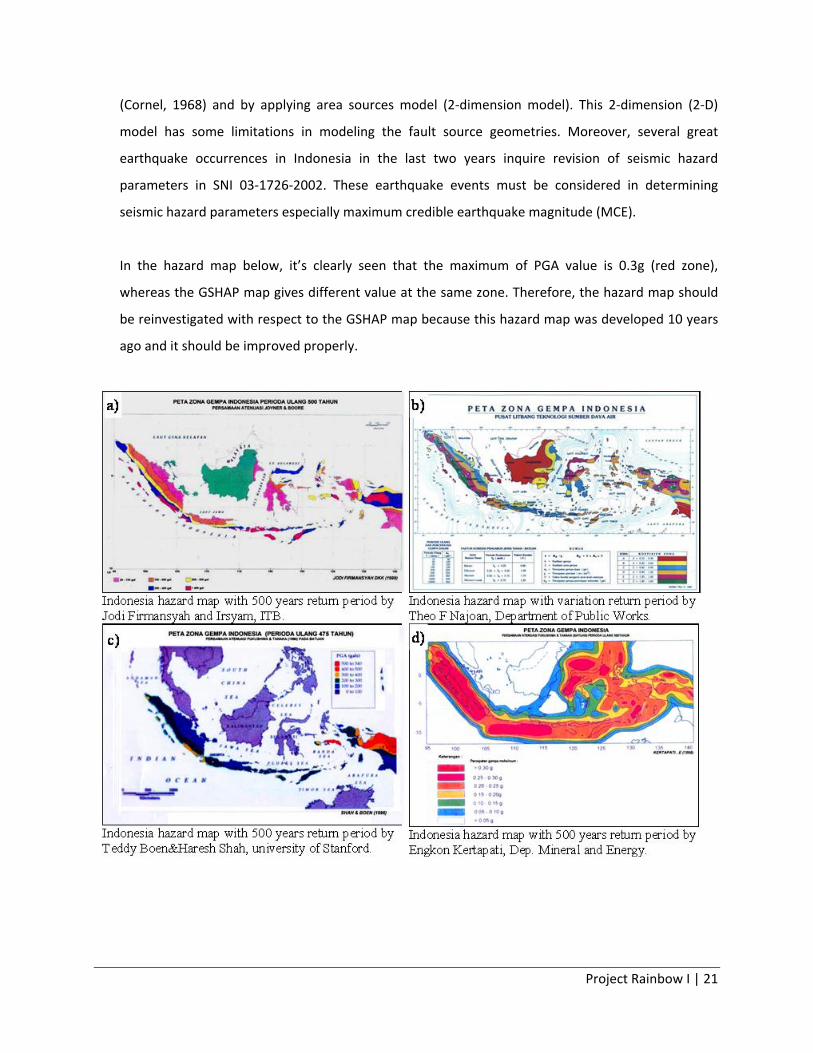
The map for PGA at bedrock in the SNI 03‐1726‐2002 (Figure 23e) was developed by averaging
values from four seismic hazard maps developed by four different research groups in
Indonesia(Figure 1a to 1d). This seismic hazard map was developed using total probability theorem
Project Rainbow I | 21
(Cornel, 1968) and by applying area sources model (2‐dimension model). This 2‐dimension (2‐D)
model has some limitations in modeling the fault source geometries. Moreover, several great
earthquake occurrences in Indonesia in the last two years inquire revision of seismic hazard
parameters in SNI 03‐1726‐2002. These earthquake events must be considered in determining
seismic hazard parameters especially maximum credible earthquake magnitude (MCE).
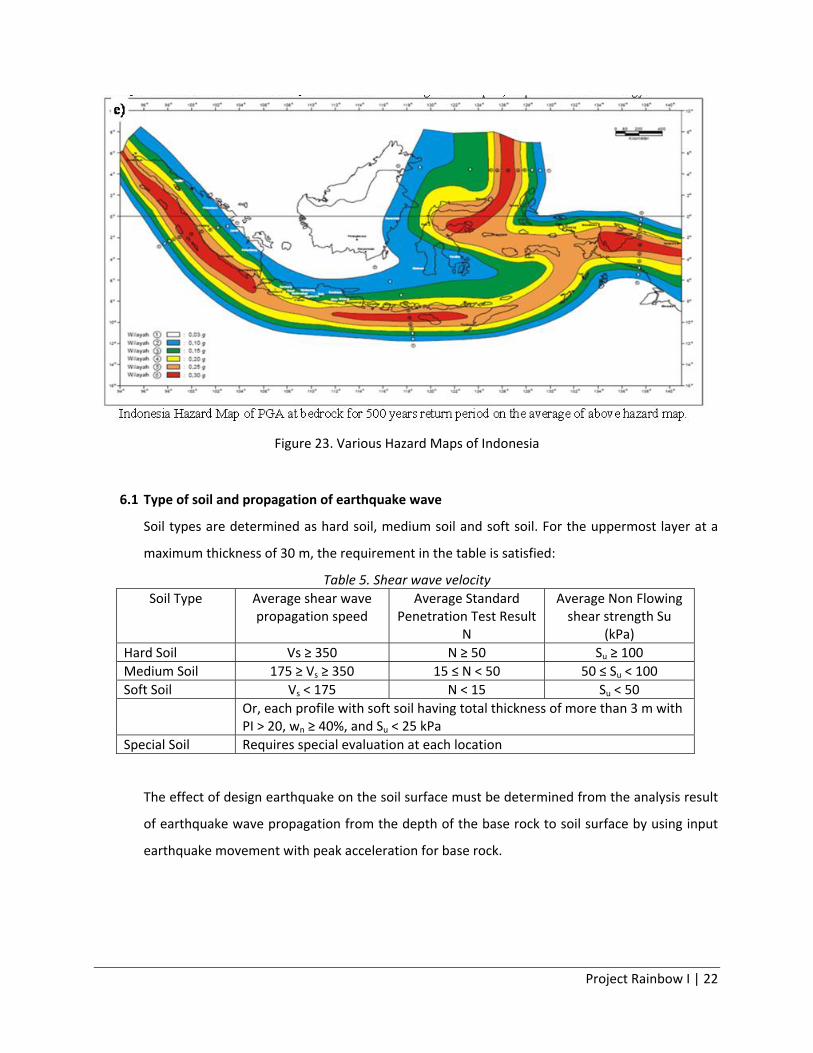
In the hazard map below, it’s clearly seen that the maximum of PGA value is 0.3g (red zone),
whereas the GSHAP map gives different value at the same zone. Therefore, the hazard map should
be reinvestigated with respect to the GSHAP map because this hazard map was developed 10 years
ago and it should be improved properly.
Project Rainbow I | 22
Figure 23. Various Hazard Maps of Indonesia
6.1 Type of soil and propagation of earthquake wave
Soil types are determined as hard soil, medium soil and soft soil. For the uppermost layer at a
maximum thickness of 30 m, the requirement in the table is satisfied:
Table 5. Shear wave velocity Soil Type Average shear wave
propagation speed Average Standard
Penetration Test Result N
Average Non Flowing shear strength Su
(kPa) Hard Soil Vs ≥ 350 N ≥ 50 Su ≥ 100 Medium Soil 175 ≥ Vs ≥ 350 15 ≤ N < 50 50 ≤ Su < 100 Soft Soil Vs < 175 N < 15 Su < 50 Or, each profile with soft soil having total thickness of more than 3 m with
PI > 20, wn ≥ 40%, and Su < 25 kPa Special Soil Requires special evaluation at each location
The effect of design earthquake on the soil surface must be determined from the analysis result
of earthquake wave propagation from the depth of the base rock to soil surface by using input
earthquake movement with peak acceleration for base rock.
Project Rainbow I | 23
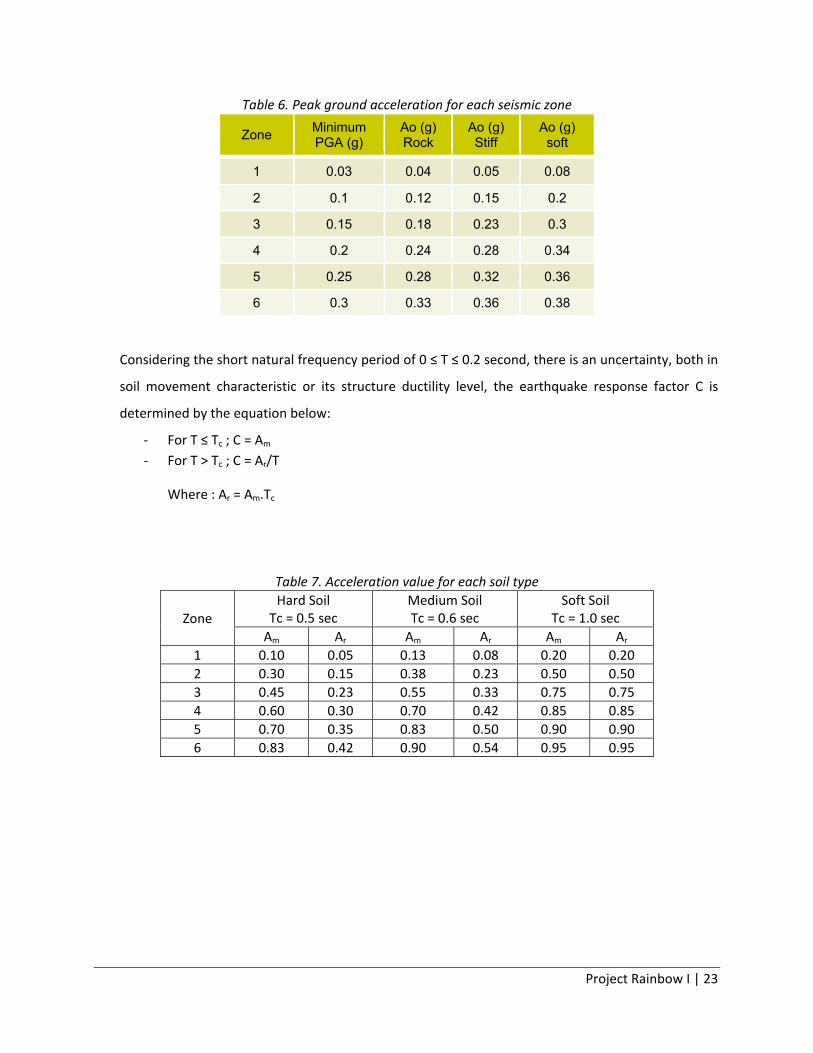
Table 6. Peak ground acceleration for each seismic zone
Zone Minimum PGA (g)
Ao (g) Rock
Ao (g) Stiff
Ao (g) soft
1 0.03 0.04 0.05 0.08
2 0.1 0.12 0.15 0.2
3 0.15 0.18 0.23 0.3
4 0.2 0.24 0.28 0.34
5 0.25 0.28 0.32 0.36
6 0.3 0.33 0.36 0.38
Considering the short natural frequency period of 0 ≤ T ≤ 0.2 second, there is an uncertainty, both in
soil movement characteristic or its structure ductility level, the earthquake response factor C is
determined by the equation below:
‐ For T ≤ Tc ; C = Am ‐ For T > Tc ; C = Ar/T
Where : Ar = Am.Tc
Table 7. Acceleration value for each soil type
Zone Hard Soil
Tc = 0.5 sec Medium Soil Tc = 0.6 sec
Soft Soil Tc = 1.0 sec
Am Ar Am Ar Am Ar 1 0.10 0.05 0.13 0.08 0.20 0.20 2 0.30 0.15 0.38 0.23 0.50 0.50 3 0.45 0.23 0.55 0.33 0.75 0.75 4 0.60 0.30 0.70 0.42 0.85 0.85 5 0.70 0.35 0.83 0.50 0.90 0.90 6 0.83 0.42 0.90 0.54 0.95 0.95

Project Rainbow I | 24
Figure 24. Response Spectra Graph for each zone
7. Geological and Topographic Maps
7.1 Geological Maps
The stratigraphy of the western part of Indonesia is relatively young, ranging in age from Paleogene
to Quaternary. Eastern Indonesia has older stratigraphy compared to the western part. The
stratigraphy ranges from Triassic to Tertiary. Devonian limestones were found in Telen River, East
Kalimantan, as fragments within Paleogene clastic sediments. Ichthyosaur fossils were found in the
mud volcanoes in Kai Island, indicated Mesozoic deposition in the subsurface.

Project Rainbow I | 25
The tectonics of Indonesia is very complex, as it is a meeting point of several tectonic plates.
Indonesia is located between two continental plates: the Eurasian Plate (Sunda Shelf) and Australian
Plate (Sahul Shelf); and between two oceanic plates: the Indian Plate and Pacific Plate. The Indian
oceanic plate subducts beneath the Eurasian continental plate formed the volcanic arc in western
Indonesia. This chain of active volcanoes formed Sumatra, Java, Bali and Nusa Tenggara islands. The
Pacific and Australian plate movements controlled the tectonic of eastern portion of Indonesia.
Figure 25. Geology Map of Indonesia
The geology maps for important cities are necessary to investigate the soil liquefaction potential
which is indicated by Quaternary soil as the youngest soil type.
The color code for geology map was developed by Geologic Time Scale 2008 where it is the
document that every geoscience professional requires and also a useful teaching tool in high
schools and universities. This 3rd edition of the Geologic Time Scale 2008 was published for the
33rd IGC held in Oslo (August 2008). It was significantly updated and enhanced as regards the
2nd edition (32 IGC, Florence 2004). Two tables of color codes (CMYK and RGB standards) are

Project Rainbow I | 26
included in the back for each chronostratigraphic unit, according to the specifications of the
CGMW.
Figure 26. Color Code for Geology Map
Figure 27. Geology Map of West Sumatera Province
Project Rainbow I | 27
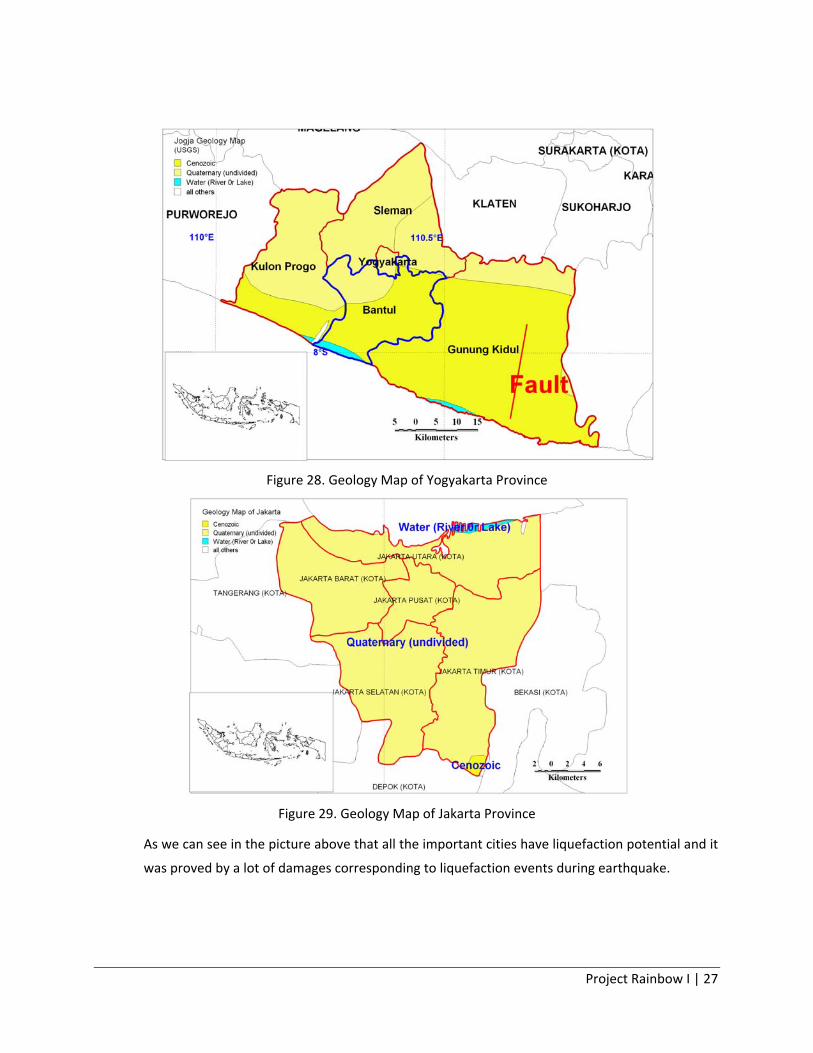
Figure 28. Geology Map of Yogyakarta Province
Figure 29. Geology Map of Jakarta Province
As we can see in the picture above that all the important cities have liquefaction potential and it
was proved by a lot of damages corresponding to liquefaction events during earthquake.

Project Rainbow I | 28
7.2 Topographical Maps
The geography of Indonesia is dominated by volcanoes that are formed due to subduction
zones between the Eurasian plate and the Indo‐Australian plate. Some of the volcanoes are notable
for their eruptions, for instance, Krakatau for its global effects in 1883, Lake Toba for
its supervolcanic eruption estimated to have occurred 74,000 Before Present which was responsible
for six years of volcanic winter and Mount Tambora for the most violent eruption in recorded history
in 1815.
Volcanoes in Indonesia are a part of the Pacific Ring of Fire. The 150 entries are grouped into six
geographical regions, four of which belong to the volcanoes of the Sunda Arc trench system. The
remaining two groups are volcanoes of Halmahera, including its surrounding volcanic islands, and
volcanoes of Sulawesi and the Sangihe Islands. The latter group is in one volcanic arc together with
the Philippine volcanoes. Puncak Jaya is a mountain in the western central highlands of Papua
province, Indonesia. At 4,884 metres (16,024 ft) above sea level, Puncak Jaya is the highest
mountain in Indonesia, the highest on the island of New Guinea.
Figure 30. Volcanoes Map of Indonesia

Project Rainbow I | 29
The most active volcanoes are Kelut and Merapi on Java Island which have been responsible for
thousands of deaths in the region.
Figure 31. Volcanoes Map for Java Island
Mount Merapi is an active stratovolcano located on the border between Central Java and
Yogyakarta, Indonesia. It is the most active volcano in Indonesia and has erupted regularly since
1548. It is located approximately 28 kilometres north of Yogyakarta city, and thousands of people
live on the flanks of the volcano, with villages as high as 1,700 metres (5,600 ft) above sea level.
Figure 32. Merapi Volcanoes Map

Project Rainbow I | 30
Below is a list of selected major eruptions of volcanoes in Indonesia, sorted chronologically by the
starting date of the eruption.
Table 8. Active Volcanoes List in Indonesia
Eruption date Volcano Cessation date VEI Tsunami Fatality Coordinate
3‐Nov‐10 Merapi 8‐Nov‐10 4 no 138 7.542°S 110.442°E
10‐Feb‐90 Kelud Mar‐90 4 no 35 7.93°S 112.308°E
18‐Jul‐83 Colo Dec‐83 4 no 0 0.17°S 121.608°E
5‐Apr‐82 Galunggung 8‐Jan‐83 4 no 68 7.25°S 108.058°E
6‐Oct‐72 Merapi Mar‐85 2 no 29 7.542°S 110.442°E
26‐Apr‐66 Kelud 27‐Apr‐66 4 no 212 7.93°S 112.308°E
17‐Mar‐63 Agung 27‐Jan‐64 5 no 1,148 8.342°S 115.508°E
31‐Aug‐51 Kelud 31‐Aug‐51 4 no 7 7.93°S 112.308°E
25‐Nov‐30 Merapi Sep‐31 3 no 1,369 7.542°S 110.442°E
19‐May‐19 Kelud 20‐May‐19 4 no 5,110 7.93°S 112.308°E
7 Jun 1892 Awu 12 Jun 1892 3 yes 1,532 3.67°N 125.50°E
26 Aug 1883 Krakatoa Feb 1884 6 15–42 m 36,600 6.102°S 105.423°E
15 Apr 1872 Merapi 21 Apr 1872 4 no 200 7.542°S 110.442°E
2 Mar 1856 Awu 17 Mar 1856 3 yes 2,806 3.67°N 125.50°E
8 Oct 1822 Galunggung Dec 1822 5 no 4,011 7.25°S 108.058°E
10 Apr 1815 Tambora 15 Jul 1815 7 1–2 m > 71,000 8.25°S 118.00°E
6 Aug 1812 Awu 8 Aug 1812 4 no 963 3.67°N 125.50°E
12 Aug 1772 Papandayan 12 Aug 1772 3 no 2,957 7.32°S 107.73°E
4 Aug 1672 Merapi unknown 3 no 3,000 7.542°S 110.442°E
1586 Kelud unknown 5 no 10,000 7.93°S 112.308°E
≈ 74,000 BP Toba unknown 8 likely ‐ 2.58°N 98.83°E
8. Shearwave Velocity Maps
Vs30 measurements (the average shear‐velocity down to 30 m) are correlated against topographic slope
to develop two sets of coefficients for deriving Vs30: one for active tectonic regions that possess dynamic
topographic relief, and one for stable continental regions where changes in topography are more
subdued. These coefficients have been applied to continental U.S. by Wald and Allen, and in other
regions around the world by Allen and Wald (USGS Open File Report, 2007, in review). They also
compared topographic slope‐based Vs30 maps to existing site condition maps based on geology and
observed Vs30 measurements, where they were available, and found favorable results. These Vs
30 maps

Project Rainbow I | 31
will enable us to better quantify possible ground‐shaking and rapidly deliver these predictions to
emergency managers and responders.
Figure 33. V30 Map of Indonesia
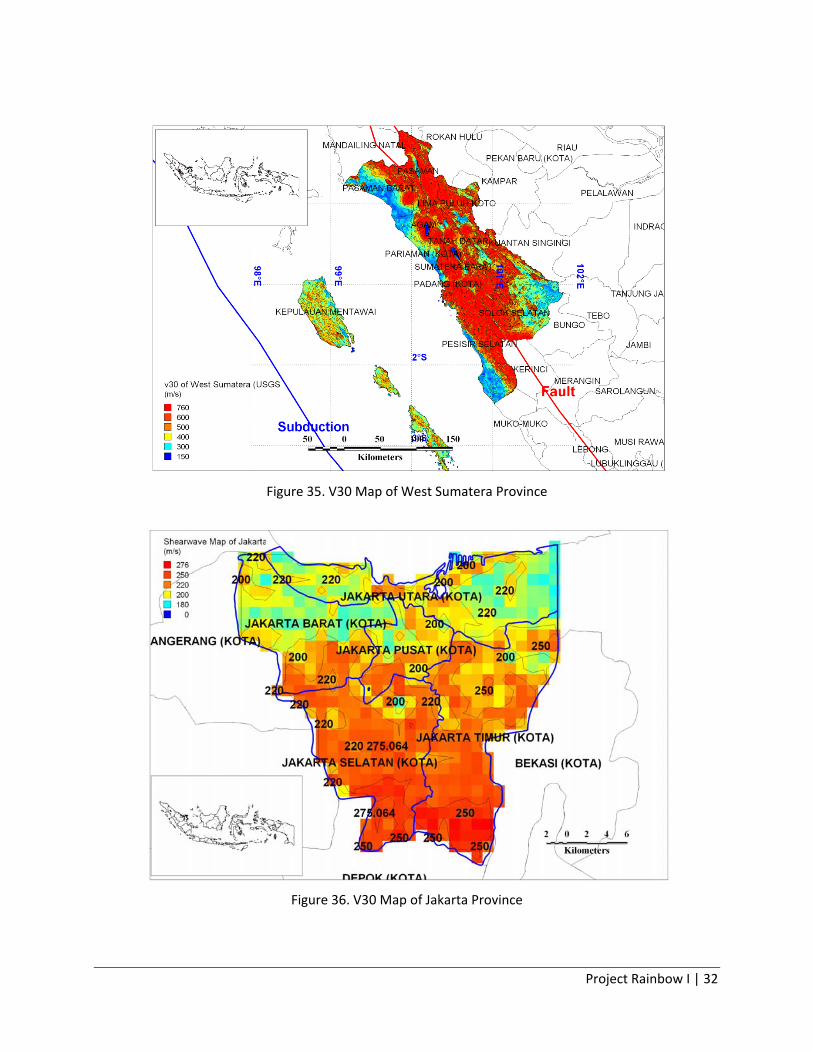
Every important city has different shearwave velocity since it depends on the topography, sub
soil condition and geology. It is required to create seismic microzonation map in order to
manage the city with respect to the earthquakes in the future.
Figure 34. V30 Map of Yogyakarta Province
Project Rainbow I | 32
Figure 35. V30 Map of West Sumatera Province
Figure 36. V30 Map of Jakarta Province

Project Rainbow I | 33
9. Building Stock
9.1 Typical Building Types
Indonesia has a lot of building types which are still exist in every location even it is allocated in
the critical earthquake zone. These building types are associated in some categories, which are:
1) Masonry
a. Adobes
b. Temples
c. Unreinforced with RC Floors
d. Reinforced or Confined
2) Reinforced Concrete
a. Frame with Moderate Level of Earthquake Resistant Design
b. Walls with Moderate Level of Earthquake Resistant Design
3) Steel
a. Steel Structures
b. LGS structures
4) Wood
a. Timber Structures
b. Bamboo Structures
9.2 Macroseismic Intensity Scale
The building types above are comparable with macroseismic intensity scale which is generated
by EMS (European Macroseismic Scale)’98 and the world housing encyclopedia from EERI
(Earthquake Engineering Research Institute). This is a table for vulnerability class from EMS:
Project Rainbow I | 34
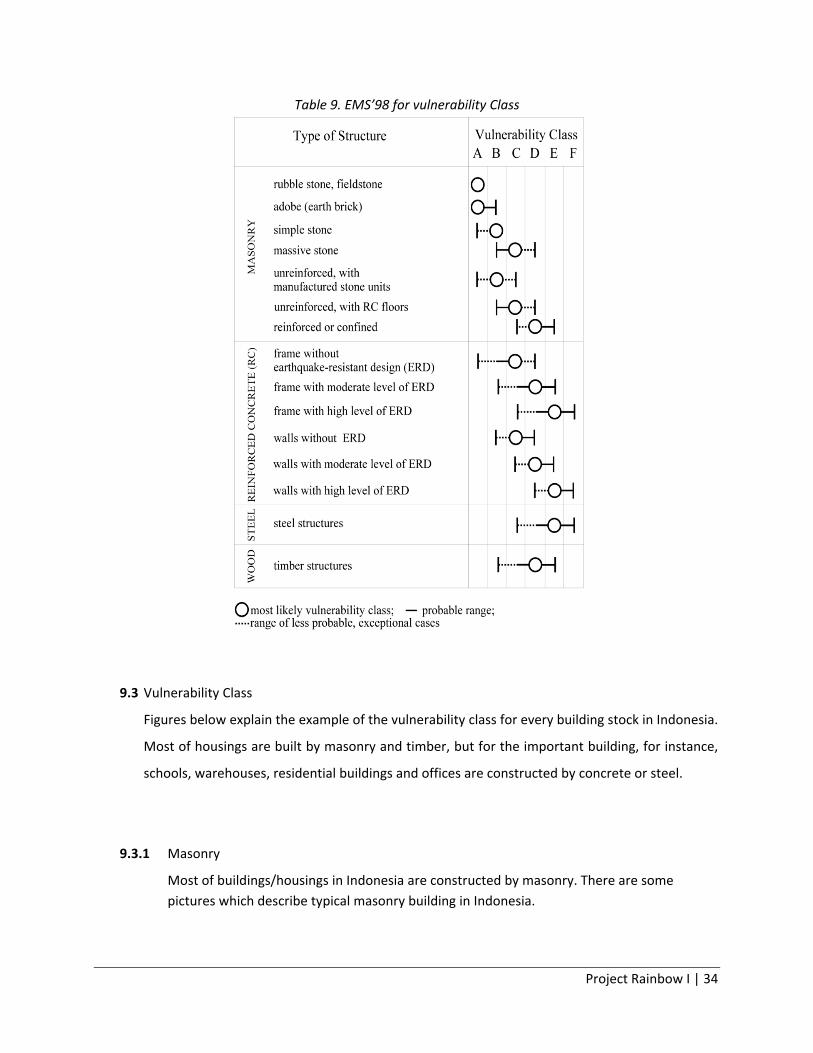
Table 9. EMS’98 for vulnerability Class
9.3 Vulnerability Class
Figures below explain the example of the vulnerability class for every building stock in Indonesia.
Most of housings are built by masonry and timber, but for the important building, for instance,
schools, warehouses, residential buildings and offices are constructed by concrete or steel.
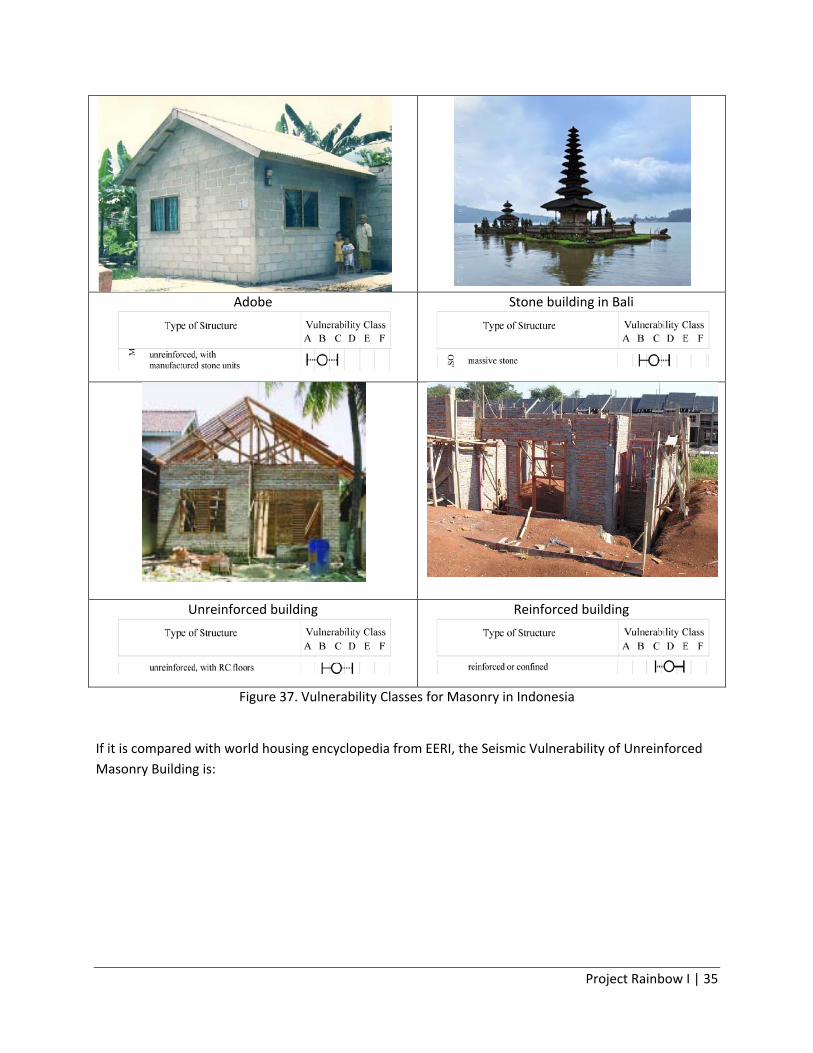
9.3.1 Masonry
Most of buildings/housings in Indonesia are constructed by masonry. There are some pictures which describe typical masonry building in Indonesia.
Project Rainbow I | 35
Adobe
Stone building in Bali
Unreinforced building
Reinforced building
Figure 37. Vulnerability Classes for Masonry in Indonesia
If it is compared with world housing encyclopedia from EERI, the Seismic Vulnerability of Unreinforced Masonry Building is:

Project Rainbow I | 36
Table 10. Structural and Architectural FeaturesStructural/ Architectural
Feature Statement
Most appropriate type
TRUE FALSE N/A
Lateral load path The structure contains a complete load path for seismic force effects from any horizontal direction that serves to transfer inertial forces from the building to the foundation.
☐ ☑ ☐
Building Configuration
The building is regular with regards to both the plan and the elevation.
☑ ☐ ☐
Roof construction
The roof diaphragm is considered to be rigid and it is expected that the roof structure will maintain its integrity, i.e. shape and form, during an earthquake of intensity expected in this area.
☐ ☑ ☐
Floor construction
The floor diaphragm(s) are considered to be rigid and it is expected that the floor structure(s) will maintain its integrity during an earthquake of intensity expected in this area.
☐ ☐ ☑
Foundation performance
There is no evidence of excessive foundation movement (e.g. settlement) that would affect the integrity or performance of the structure in an earthquake.
☐ ☑ ☐
Wall and frame structures‐redundancy
The number of lines of walls or frames in each principal direction is greater than or equal to 2.
☑ ☐ ☐
Wall proportions
Height‐to‐thickness ratio of the shear walls at each floor level is:
☐ ☑ ☐ Less than 25 (concrete walls);Less than 30 (reinforced masonry walls);Less than 13 (unreinforced masonry walls);
Foundation‐wall connection
Vertical load‐bearing elements (columns, walls) are attached to the foundations; concrete columns and walls are doweled into the foundation.
☐ ☐ ☑
Wall‐roof connections
Exterior walls are anchored for out‐of‐plane seismic effects at each diaphragm level with metal anchors or straps
☐ ☐ ☑
Wall openings
The total width of door and window openings in a wall is:
☐ ☑ ☐
For brick masonry construction in cement mortar : less than ½ of the distance between the adjacent cross walls; For adobe masonry, stone masonry and brick masonry in mud mortar: less than 1/3 of the distance between the adjacent cross walls; For precast concrete wall structures: less than 3/4 of the length of a perimeter wall.
Quality of building materials
Quality of building materials is considered to be adequate per the requirements of national codes and standards (an estimate).
☐ ☑ ☐
Quality of workmanship
Quality of workmanship (based on visual inspection of few typical buildings) is considered to be good (per local construction standards).
☐ ☑ ☐
Maintenance Buildings of this type are generally well maintained and there are no visible signs of deterioration of building elements (concrete, steel, timber)
☐ ☑ ☐
Other ☐ ☑ ☐

Project Rainbow I | 37
Table 11. Seismic Features
Structural Element
Seismic Deficiency Earthquake Resilient Features
Earthquake Damage Patterns
Wall 1. Clay‐brick with very low compressive strength 2. The quality of clay‐brick varies depends on the local clay‐soil material 3. The clay‐brick material is very brittle and doesn't have any ductility.
Shear crack, flexure crack or combination of both in clay brick walls.
Frame (columns, beams)
Roof and floors Timber truss system for roofing without any special connection with the clay brick walls.
The roof sliding off from the clay brick walls.
Table 12. Overall Seismic Vulnerability Rating Vulnerability high medium‐high medium medium‐low low very low
very poor poor moderate good very good excellent
Vulnerability Class
A B C D E F
☑ ☐ ☑ ☐ ☐ ☐
9.3.2 Reinforced Concrete
Frame with Moderate Level of Earthquake Resistant Design
Wall with Moderate Level of Earthquake Resistant Design
Figure 38. Vulnerability Classes for Reinforced Concrete in Indonesia

Project Rainbow I | 38
9.3.3 Steel
Steel Structure
LGS (Light Gauge Steel) structure
Figure 39. Vulnerability Classes for Steel in Indonesia
9.3.4 Timber
Timber structure
Bamboo Structure
Figure 40. Vulnerability Classes for Timber in Indonesia

Project Rainbow I | 39
9.4 Building Stock in Center of Jakarta
Jakarta is primarily a city of government and business. It is seldom viewed as a centre for tourism
other than the old part of the city which is a popular tourist destination. However the Jakarta
authority saw the opportunity to develop the city's reputation as a service and tourism city. There
are many new tourism infrastructures, entertainment centers, and international‐class hotels and
restaurants being built in Jakarta. Jakarta also possesses many historical places and cultural heritage.
Bundaran HI, Standing at one of Jakarta's busiest roundabouts near the Grand Hyatt, these two
waving sculptures have been welcoming visitors since 1962. President Sukarno commissioned its
erection initially to greet sportsmen and visitors traveling to Jakarta for the 1962 Asian Games. The
monument and the fountain surrounding it appear particularly impressive in the evenings. Like the
many other statues gracing the city's bustling intersections, it also symbolizes Sukarno's inspiration
to develop Jakarta into a modern metropolis back when he was in power.
Figure 41. Famous Bundaran HI Monument in Center of Jakarta Province

Project Rainbow I | 40
9.4.1 Google Earth
Google Earth is a virtual globe, map and geographical information program that was originally called
EarthViewer 3D, and was created by Keyhole, Inc, a company acquired by Google in 2004. It maps
the Earth by the superimposition of images obtained from satellite imagery, aerial
photography and GIS 3D globe.
The picture below is a actual situation from Bundaran HI Jakarta which was taken by Google Earth. It
can be clearly seen that there are many buildings around this monument which consist of High Risk
Buildings (concrete and steel construction) and housings (masonry and confined concrete).
Figure 42. 2D view of Bundaran HI Captured from Google earth
Based on the picture above and vulnerability class by EMS’98, there are some building types which
are classified into some categories, which is:
a. Confined masonry
b. Reinforced Concrete (Frame with moderate Level of Earthquake Resistant Design)
c. Steel Structure
Project Rainbow I | 41
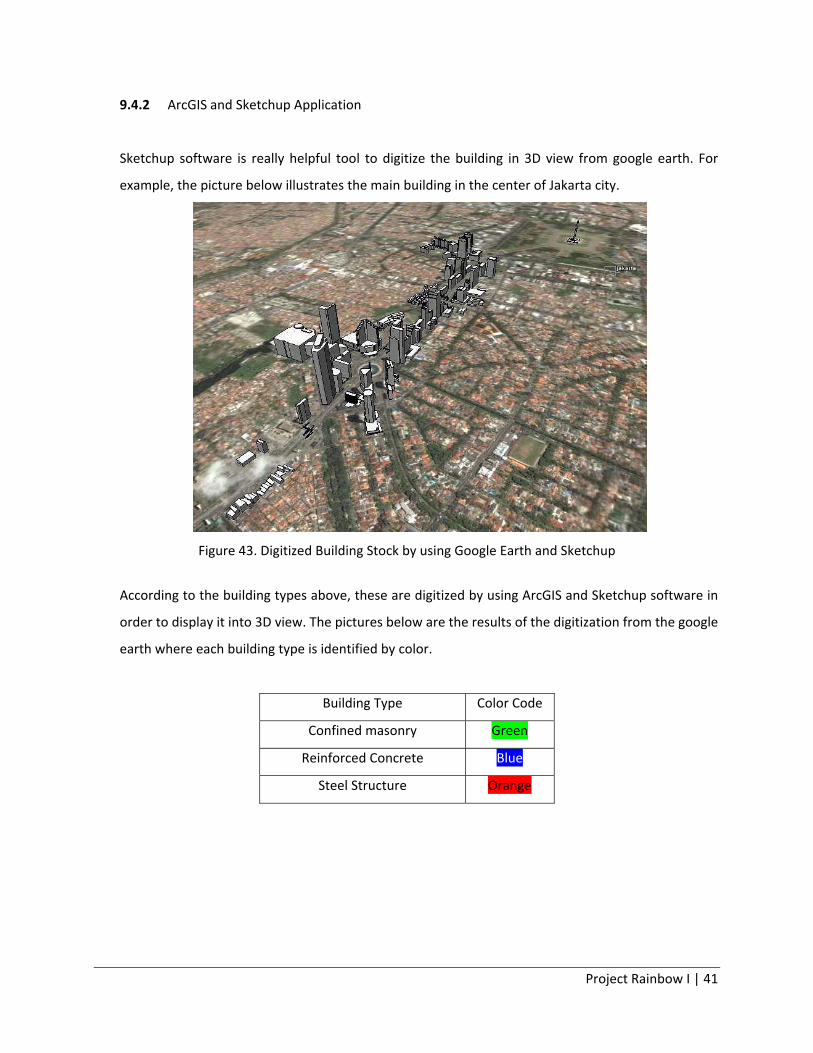
9.4.2 ArcGIS and Sketchup Application
Sketchup software is really helpful tool to digitize the building in 3D view from google earth. For
example, the picture below illustrates the main building in the center of Jakarta city.
Figure 43. Digitized Building Stock by using Google Earth and Sketchup
According to the building types above, these are digitized by using ArcGIS and Sketchup software in
order to display it into 3D view. The pictures below are the results of the digitization from the google
earth where each building type is identified by color.
Building Type Color Code
Confined masonry Green
Reinforced Concrete Blue
Steel Structure Orange
Project Rainbow I | 42
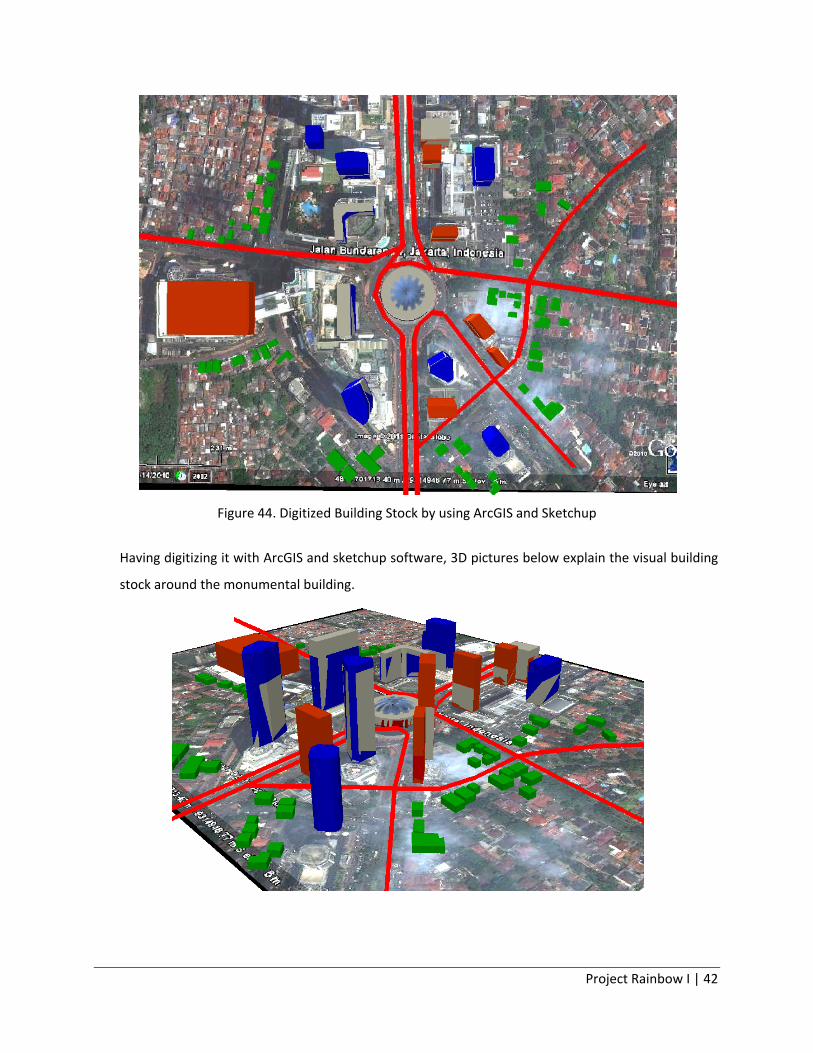
Figure 44. Digitized Building Stock by using ArcGIS and Sketchup
Having digitizing it with ArcGIS and sketchup software, 3D pictures below explain the visual building
stock around the monumental building.

Project Rainbow I | 43
Figure 44. 3D view of digitized building stock
Notation Building Name Building Type Established
A Monumental Building Reinforced Concrete 1962
B Deutsche Bank Branch in Indonesia Steel Structure 1969
C Hotel of Indonesia Reinforced Concrete 1962
D BCA Bank Reinforced Concrete 1970
E Houses Confined Masonry > 1980
F Theater Steel Structure 1960
C B A D E F
Project Rainbow I | 44
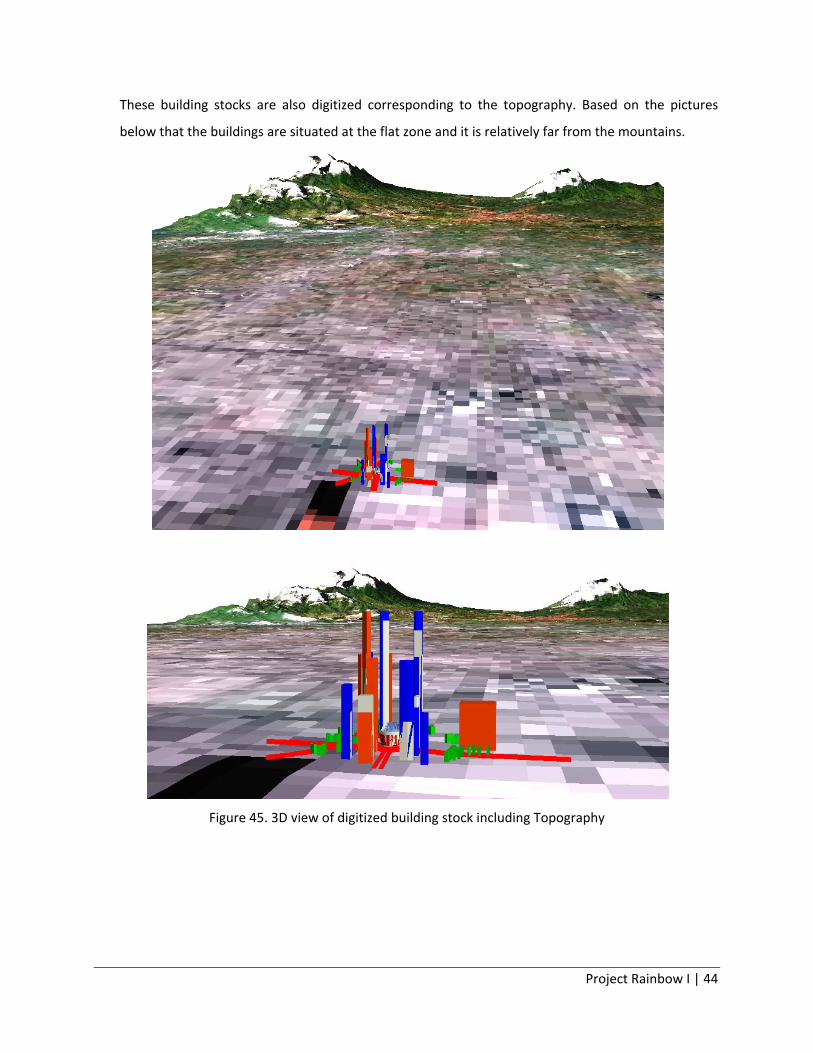
These building stocks are also digitized corresponding to the topography. Based on the pictures
below that the buildings are situated at the flat zone and it is relatively far from the mountains.
Figure 45. 3D view of digitized building stock including Topography

Project Rainbow I | 45
10. Conclusions and Recommendations
1. Geographical Information System (GIS) is really helpful for engineers and scientists to
determine the specific natural resources or infrastructures which are important for country
or inhabitants.
2. The precision of administrative maps is absolutely necessary to be provided by government
in order to make sure the boundary line between 2 countries or more. If this boundary has
large error margin, dispute between 2 countries will occur and sometimes the war would be
happen.
3. Seismic microzonation is necessary to be provided by local government to make sure that
the buildings are at the safe zone.
4. Seismicity map at important cities is required to investigate the critical area due to
earthquake events.
5. Shaking map is one of preliminary parameters to determine damage cases.
6. PGA map provided by Government should be revised by comparing the PGA map from
GSHAP.
7. Geology and topography maps are important to support seismic microzonation which needs
the preliminary assessment corresponding to liquefaction potential and land slide damages.
8. Shearwave velocity map is important as preliminary data before doing geotechnical
assessment to find liquefaction index.
9. Building stocks at major cities in one country should be investigated and digitized in order to
manage and display it more detail and accurate with respect to the topography and
vulnerability class from EMS’98.

Project Rainbow I | 46
References
1. Department of Economic and Social Affairs Population Division (2009) (PDF). World Population Prospects, Table A.1. 2008 revision. United Nations. Retrieved 12 March 2009.
2. Central Bureau of Statistics: Census 2010, retrieved 17 January 2011(Indonesian) 3. Kuoni ‐ Far East, A world of difference. Page 88. Published 1999 by Kuoni Travel & JPM
Publications 4. Terrestrial Ecoregions ‐ Banda Sea Islands moist deciduous forests (AA0102). Worldwildlife.org.
Retrieved on 2010‐09‐29. 5. M. Neumann van Padang (1951). "Indonesia". Catalog of Active Volcanoes of the World and
Solfatara Fields (1 ed.). Rome: IAVCEI. pp. 1–271. 6. Tom Simkin and Lee Siebert (1994). Volcanoes of the World: A Regional Directory, Gazetteer,
and Chronology of Volcanism During the Last 10,000 Years (2nd ed.). Geoscience Press. ISBN 0945005121.
7. "Tsunamis and Earthquakes: Tsunami Generation from the 2004 Sumatra Earthquake — USGS Western Coastal and Marine Geology". Walrus.wr.usgs.gov. Retrieved 2010‐08‐12.
8. Sibuet, J‐C., Rangin, C., Le Pichon, X., Singh, S., Cattaneo, A., Graindorge, D., Klingelhoefer, F., Lin, J‐Y., Malod, J., Maury, T., Schneider, J‐L., Sultan, N., Umber, M., Yamaguchi, H., and the “Sumatra aftershocks” team, "December 26, 2004 great Sumatra–Andaman earthquake: Co‐seismic and post‐seismic motions in northern Sumatra." Earth and Planetary Science Letters. Vol. 263, Issues. 1–2, 88–103.
9. "Magnitude 7.6 ‐ SOUTHERN SUMATRA, INDONESIA". United States Geological Survey. 2009‐09‐30. Retrieved 2009‐09‐30.
10. Abrahamson, N.A. (2000). Effects of rupture directivity on probabilistic seismic hazard analysis, Proc. of 6th Int. Conf. on Seismic Zonation, Palm Springs, Earthquake Engineering Research Institute.
11. Grünthal, G., Bosse, C., Mayer‐Rosa, D., Rüttener, E., Lenhardt, W. and Melichar, P.: Across‐boundaries seismic hazard maps in the GSHAP‐Region 3 ‐ case study for Austria, Germany, and Switzerland. 24th General Assembly, European Seismological Commission (Athens/Greece 1994). Proceedings, Vol. II, 1542‐1548, 1995.
12. Grünthal, G.: The GSHAP‐Regional Centre in Potsdam: progress report. 24th General Assembly, European Seismological Commission (Athens/Greece 1994). Proceedings and Activity Report 1992‐1994, Vol. III, 1535‐1541, 1994.
13. Giardini, D., Grünthal, G., Shedlock, K. M. and Zhang, P.: The GSHAP Global Seismic Hazard Map. In: Lee, W., Kanamori, H., Jennings, P. and Kisslinger, C. (eds.): International Handbook of Earthquake & Engineering Seismology, International Geophysics Series 81 B, Academic Press, Amsterdam, 1233‐1239, 2003.

Project Rainbow I | 47
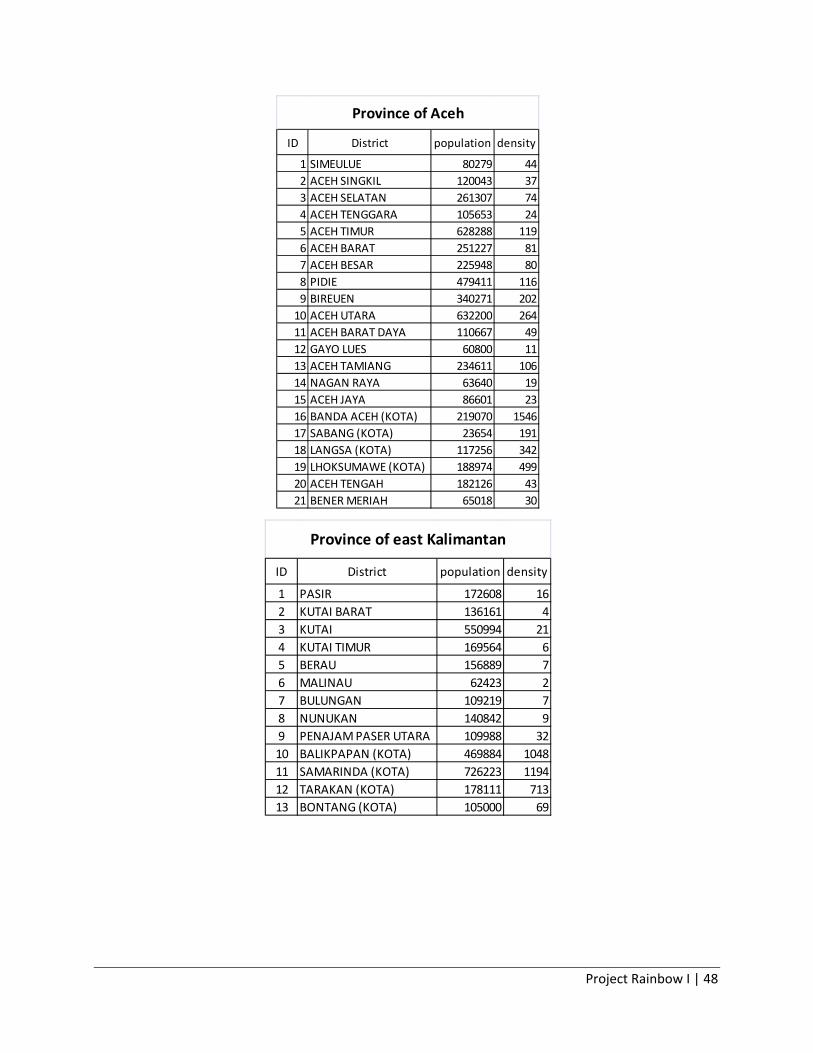
ANNEX 1. Population Distribution
Project Rainbow I | 48
ID District population density
1 SIMEULUE 80279 442 ACEH SINGKIL 120043 373 ACEH SELATAN 261307 744 ACEH TENGGARA 105653 245 ACEH TIMUR 628288 1196 ACEH BARAT 251227 817 ACEH BESAR 225948 808 PIDIE 479411 1169 BIREUEN 340271 20210 ACEH UTARA 632200 26411 ACEH BARAT DAYA 110667 4912 GAYO LUES 60800 1113 ACEH TAMIANG 234611 10614 NAGAN RAYA 63640 1915 ACEH JAYA 86601 2316 BANDA ACEH (KOTA) 219070 154617 SABANG (KOTA) 23654 19118 LANGSA (KOTA) 117256 34219 LHOKSUMAWE (KOTA) 188974 49920 ACEH TENGAH 182126 4321 BENER MERIAH 65018 30
Province of Aceh
ID District population density
1 PASIR 172608 162 KUTAI BARAT 136161 43 KUTAI 550994 214 KUTAI TIMUR 169564 65 BERAU 156889 76 MALINAU 62423 27 BULUNGAN 109219 78 NUNUKAN 140842 99 PENAJAM PASER UTARA 109988 3210 BALIKPAPAN (KOTA) 469884 104811 SAMARINDA (KOTA) 726223 119412 TARAKAN (KOTA) 178111 71313 BONTANG (KOTA) 105000 69
Province of east Kalimantan

Project Rainbow I | 49
ID District population density
1 KEPULAUAN SERIBU 18664 481.0652 JAKARTA SELATAN (KOTA) 2001353 13039.93 JAKARTA PUSAT (KOTA) 889448 16950.554 JAKARTA TIMUR (KOTA) 2391166 12651.935 JAKARTA BARAT (KOTA) 2093013 16867.886 JAKARTA UTARA (KOTA) 1445623 10513.86
Province of Jakarta
id district population density
1 Kulon Progo 388755 6412 Gunung Kidul 674408 4603 Bantul 910572 18674 Yogyakarta 388088 122945 Sleman 1090567 1912
Province of Yogyakarta
id District population density
1 KEPULAUAN MENTAWAI 76421 132 PESISIR SELATAN 406666 683 TANAH DATAR 338584 2474 PADANG PARIAMAN 390204 2455 AGAM 455495 2016 LIMA PULUH KOTO 348249 1217 PADANG (KOTA) 819740 14788 SOLOK (KOTA) 59317 4969 SAWAH LUNTO (KOTA) 56812 15110 PADANG PANJANG (KOTA) 47008 98511 BUKITTINGGI (KOTA) 110954 181412 PAYAKUMBUH (KOTA) 116910 130313 PARIAMAN (KOTA) 79449 97614 SOLOK SELATAN 144236 4015 SOLOK 348991 10716 DHARMAS RAYA 191277 6417 SAWAHLUNTO/SIJUNJUNG 201627 7018 PASAMAN BARAT 364587 9319 PASAMAN 252981 65
Province of West Sumatera

Project Rainbow I | 50
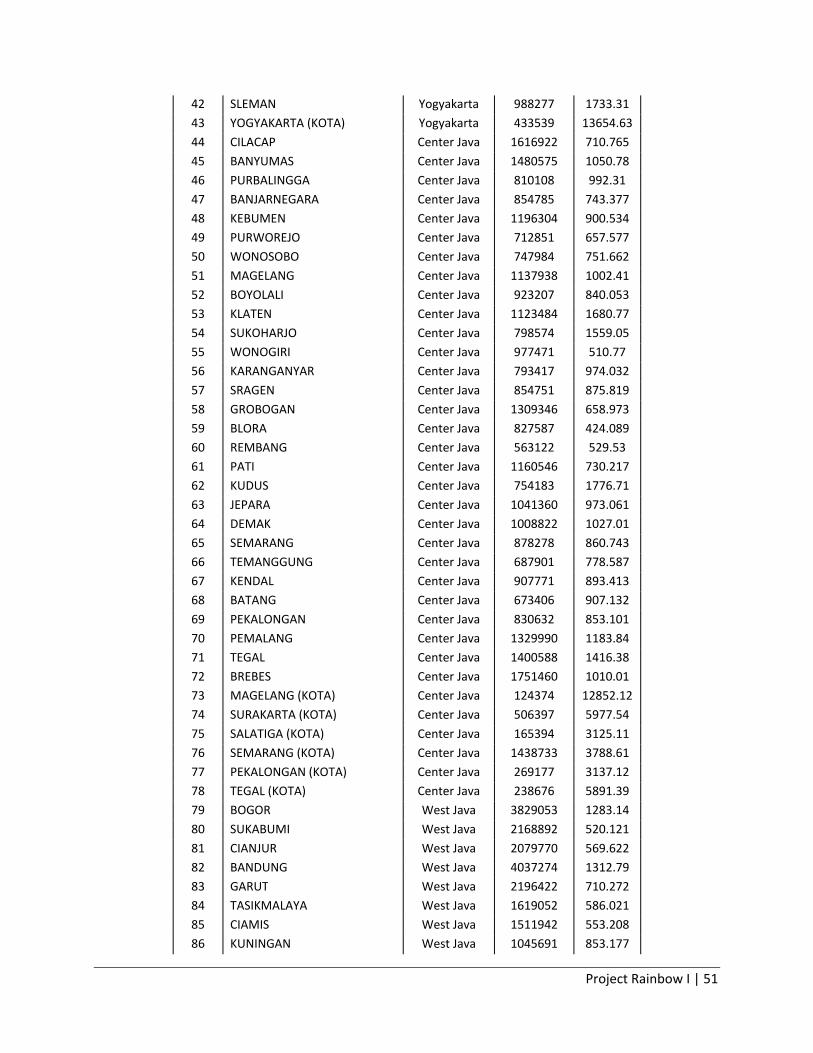
Population Density at Java Island
Id District Province Population Density
1 PACITAN East Java 545670 384.502 2 PONOROGO East Java 869642 602.043 3 TRENGGALEK East Java 665070 530.9
4 TULUNGAGUNG East Java 969461 835.371 5 LUMAJANG East Java 999525 552.009 6 BONDOWOSO East Java 698504 448.158 7 PASURUAN East Java 1398122 936.032 8 JOMBANG East Java 1222499 1116.39 9 NGANJUK East Java 989693 769.757
10 MADIUN East Java 171390 154.181 11 MAGETAN East Java 617492 855.629 12 NGAWI East Java 827728 589.977 13 BOJONEGORO East Java 1228939 521.936 14 TUBAN East Java 1063375 535.761 15 LAMONGAN East Java 1187065 669.271
16 BANGKALAN East Java 889590 678.313 17 PAMEKASAN East Java 762876 946.037 18 KEDIRI (KOTA) East Java 248640 3610.14 19 BLITAR (KOTA) East Java 126776 3430.72 20 MALANG (KOTA) East Java 790356 10670.14 21 PROBOLINGGO (KOTA) East Java 211142 4162.02
22 PASURUAN (KOTA) East Java 171136 4301.52 23 MOJOKERTO (KOTA) East Java 111860 6330.09 24 MADIUN (KOTA) East Java 171390 5603.2 25 SURABAYA (KOTA) East Java 2611506 8176.67 26 BATU (KOTA) East Java 179092 934.519 27 BLITAR East Java 1065838 611.183
28 KEDIRI East Java 1429137 922.191 29 MOJOKERTO East Java 969299 969.214 30 BANYUWANGI East Java 1514605 426.187 31 GRESIK East Java 1118841 912.801 32 JEMBER East Java 2261477 672.055 33 MALANG East Java 2336363 662.455
34 PROBOLINGGO East Java 1021279 590.462 35 SAMPANG East Java 835122 674.339 36 SIDOARJO East Java 1697435 2473.84 37 SITUBONDO East Java 605208 371.973 38 SUMENEP East Java 1004758 463.905 39 KULON PROGO Yogyakarta 373757 617.466
40 BANTUL Yogyakarta 859968 1761.88 41 GUNUNG KIDUL Yogyakarta 681554 464.845
Project Rainbow I | 51
42 SLEMAN Yogyakarta 988277 1733.31 43 YOGYAKARTA (KOTA) Yogyakarta 433539 13654.63 44 CILACAP Center Java 1616922 710.765
45 BANYUMAS Center Java 1480575 1050.78 46 PURBALINGGA Center Java 810108 992.31 47 BANJARNEGARA Center Java 854785 743.377 48 KEBUMEN Center Java 1196304 900.534 49 PURWOREJO Center Java 712851 657.577 50 WONOSOBO Center Java 747984 751.662
51 MAGELANG Center Java 1137938 1002.41 52 BOYOLALI Center Java 923207 840.053 53 KLATEN Center Java 1123484 1680.77 54 SUKOHARJO Center Java 798574 1559.05 55 WONOGIRI Center Java 977471 510.77 56 KARANGANYAR Center Java 793417 974.032
57 SRAGEN Center Java 854751 875.819 58 GROBOGAN Center Java 1309346 658.973 59 BLORA Center Java 827587 424.089 60 REMBANG Center Java 563122 529.53 61 PATI Center Java 1160546 730.217 62 KUDUS Center Java 754183 1776.71
63 JEPARA Center Java 1041360 973.061 64 DEMAK Center Java 1008822 1027.01 65 SEMARANG Center Java 878278 860.743 66 TEMANGGUNG Center Java 687901 778.587 67 KENDAL Center Java 907771 893.413 68 BATANG Center Java 673406 907.132
69 PEKALONGAN Center Java 830632 853.101 70 PEMALANG Center Java 1329990 1183.84 71 TEGAL Center Java 1400588 1416.38 72 BREBES Center Java 1751460 1010.01 73 MAGELANG (KOTA) Center Java 124374 12852.12 74 SURAKARTA (KOTA) Center Java 506397 5977.54
75 SALATIGA (KOTA) Center Java 165394 3125.11 76 SEMARANG (KOTA) Center Java 1438733 3788.61 77 PEKALONGAN (KOTA) Center Java 269177 3137.12 78 TEGAL (KOTA) Center Java 238676 5891.39 79 BOGOR West Java 3829053 1283.14 80 SUKABUMI West Java 2168892 520.121
81 CIANJUR West Java 2079770 569.622 82 BANDUNG West Java 4037274 1312.79 83 GARUT West Java 2196422 710.272 84 TASIKMALAYA West Java 1619052 586.021 85 CIAMIS West Java 1511942 553.208 86 KUNINGAN West Java 1045691 853.177
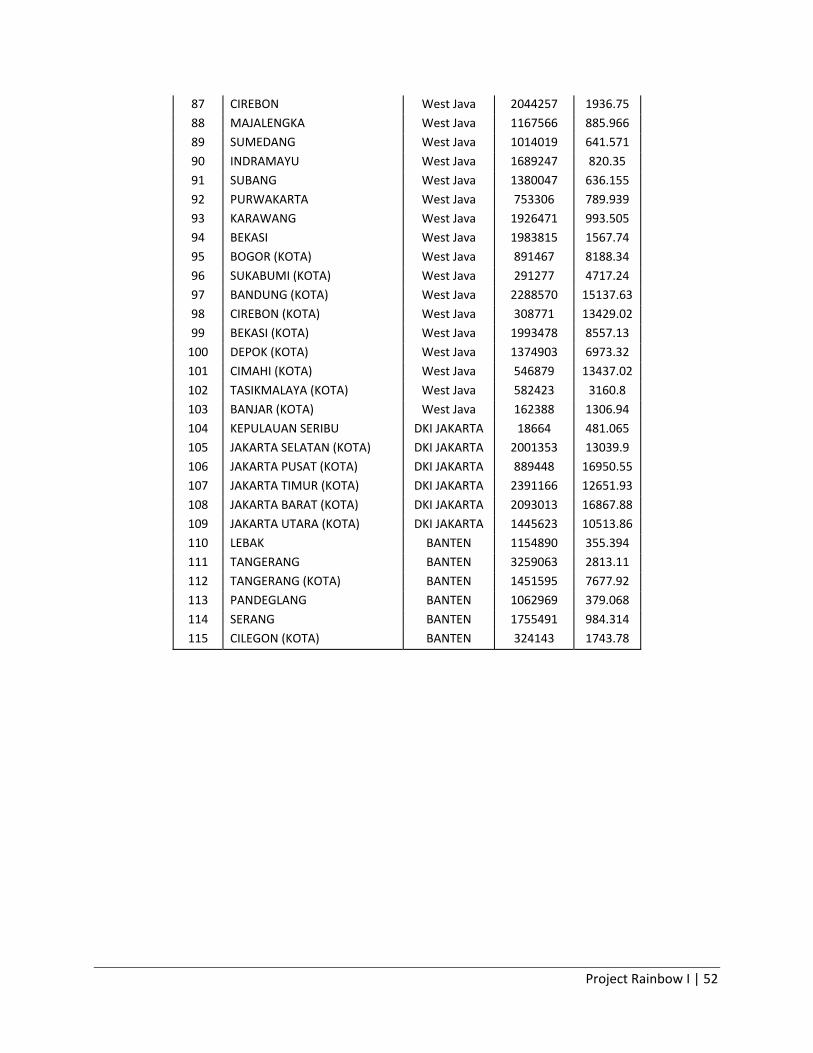
Project Rainbow I | 52
87 CIREBON West Java 2044257 1936.75 88 MAJALENGKA West Java 1167566 885.966 89 SUMEDANG West Java 1014019 641.571
90 INDRAMAYU West Java 1689247 820.35 91 SUBANG West Java 1380047 636.155 92 PURWAKARTA West Java 753306 789.939 93 KARAWANG West Java 1926471 993.505 94 BEKASI West Java 1983815 1567.74 95 BOGOR (KOTA) West Java 891467 8188.34
96 SUKABUMI (KOTA) West Java 291277 4717.24 97 BANDUNG (KOTA) West Java 2288570 15137.63 98 CIREBON (KOTA) West Java 308771 13429.02 99 BEKASI (KOTA) West Java 1993478 8557.13 100 DEPOK (KOTA) West Java 1374903 6973.32 101 CIMAHI (KOTA) West Java 546879 13437.02
102 TASIKMALAYA (KOTA) West Java 582423 3160.8 103 BANJAR (KOTA) West Java 162388 1306.94 104 KEPULAUAN SERIBU DKI JAKARTA 18664 481.065 105 JAKARTA SELATAN (KOTA) DKI JAKARTA 2001353 13039.9 106 JAKARTA PUSAT (KOTA) DKI JAKARTA 889448 16950.55 107 JAKARTA TIMUR (KOTA) DKI JAKARTA 2391166 12651.93
108 JAKARTA BARAT (KOTA) DKI JAKARTA 2093013 16867.88 109 JAKARTA UTARA (KOTA) DKI JAKARTA 1445623 10513.86 110 LEBAK BANTEN 1154890 355.394 111 TANGERANG BANTEN 3259063 2813.11 112 TANGERANG (KOTA) BANTEN 1451595 7677.92 113 PANDEGLANG BANTEN 1062969 379.068
114 SERANG BANTEN 1755491 984.314 115 CILEGON (KOTA) BANTEN 324143 1743.78