OMV Exploration & Production OMV AUT E&P GmbH “Durch ... · OMV Exploration & Production Move &...
25
OMV Exploration & Production Move & More. OMV AUT E&P GmbH “Durch Performance- Management zum österreichischen Musterunternehmen” Dir. DI C. Veit ÖGEW Herbsttagung 2010, Wien
Transcript of OMV Exploration & Production OMV AUT E&P GmbH “Durch ... · OMV Exploration & Production Move &...
OMV Exploration & Production
Move & More.
OMV AUT E&P GmbH“Durch Performance-Management zum österreichischen Musterunternehmen”
Dir. DI C. VeitÖGEW Herbsttagung 2010, Wien
2 | ÖGEW Herbsttagung, Wien, OMV AUT Exploration & Production
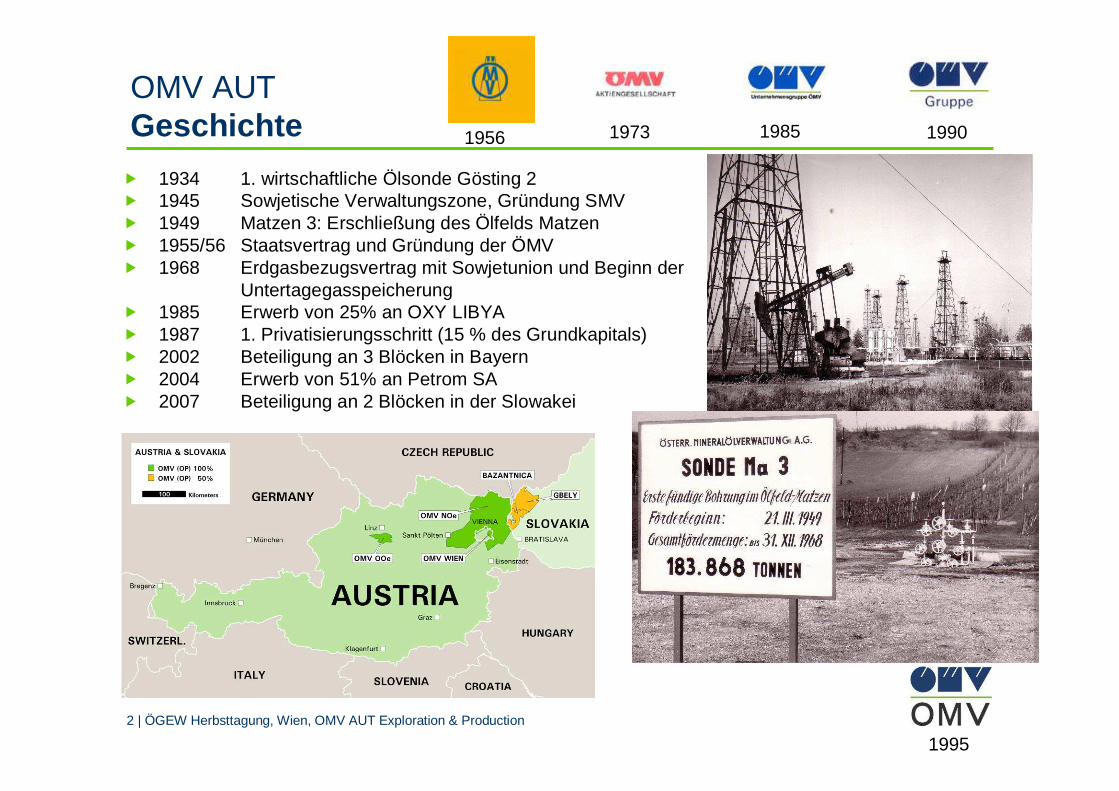
OMV AUTGeschichte
1. wirtschaftliche Ölsonde Gösting 2Sowjetische Verwaltungszone, Gründung SMVMatzen 3: Erschließung des Ölfelds MatzenStaatsvertrag und Gründung der ÖMVErdgasbezugsvertrag mit Sowjetunion und Beginn der UntertagegasspeicherungErwerb von 25% an OXY LIBYA1. Privatisierungsschritt (15 % des Grundkapitals)Beteiligung an 3 Blöcken in Bayern Erwerb von 51% an Petrom SABeteiligung an 2 Blöcken in der Slowakei
� 1934� 1945� 1949� 1955/56� 1968
� 1985� 1987� 2002� 2004� 2007
1973 1985 19901956
1995
3 | ÖGEW Herbsttagung, Wien, OMV AUT Exploration & Production
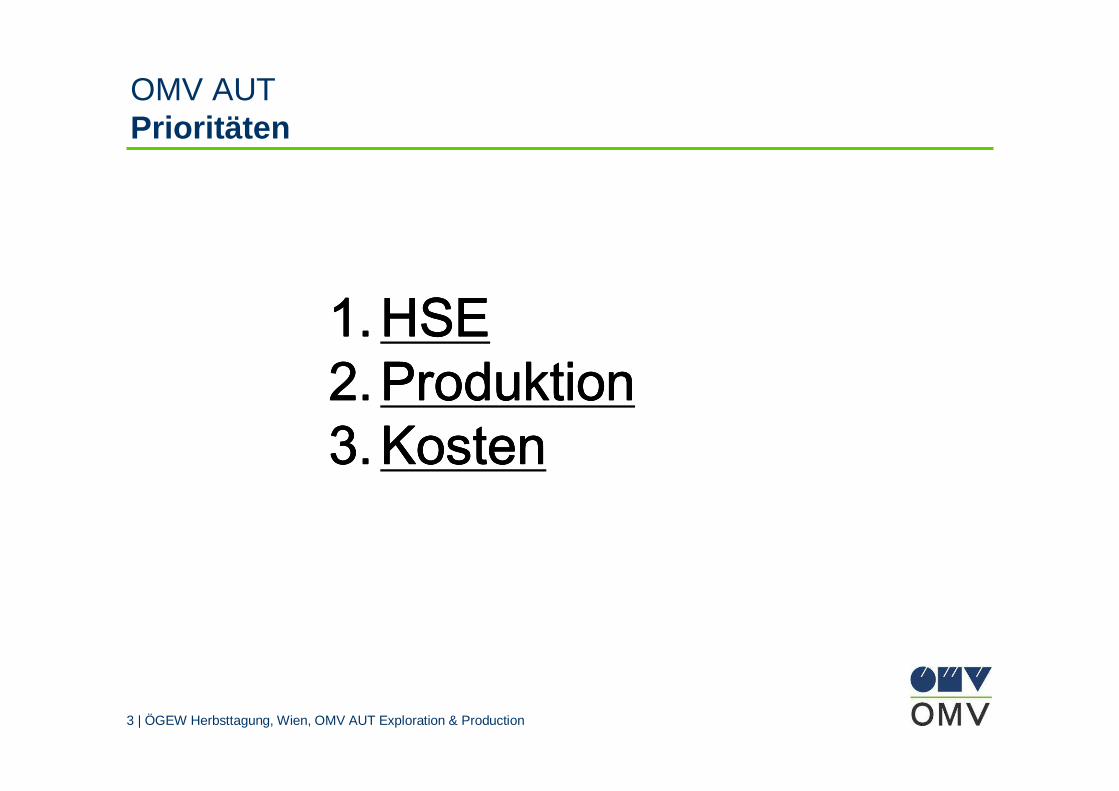
OMV AUTPrioritäten
1.1.1.1. HSEHSEHSEHSE2.2.2.2. ProduktionProduktionProduktionProduktion3.3.3.3. KostenKostenKostenKosten
4 | ÖGEW Herbsttagung, Wien, OMV AUT Exploration & Production
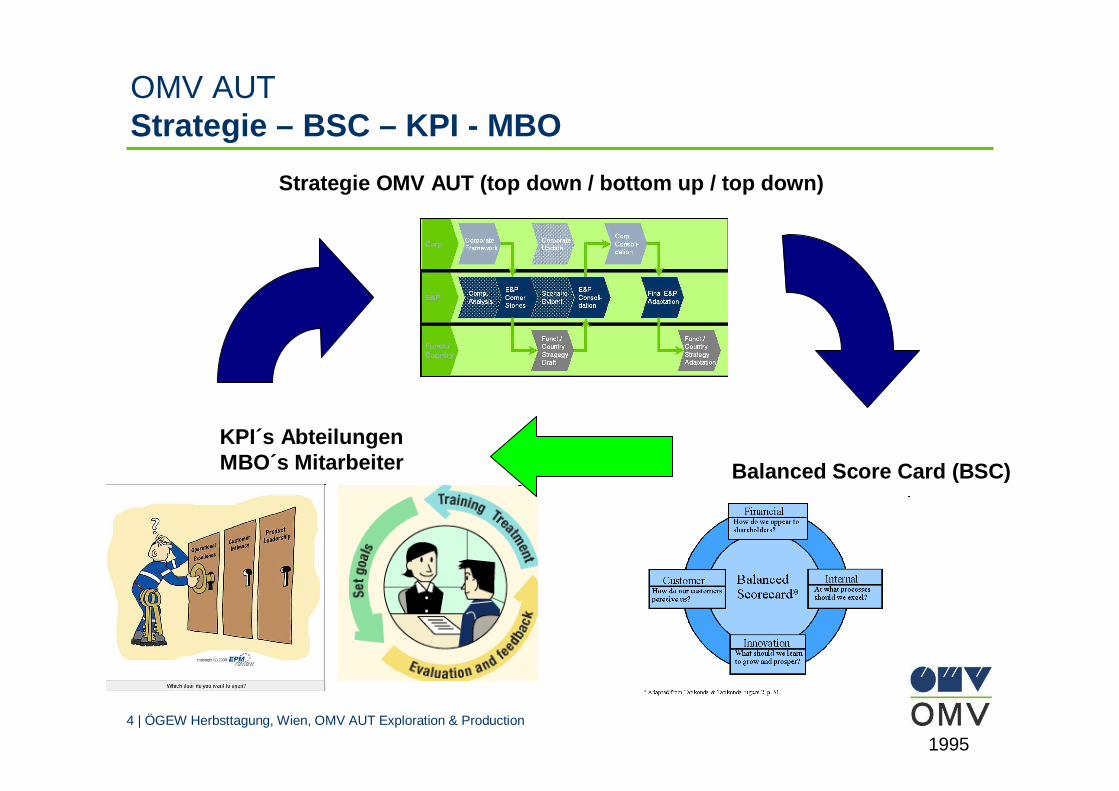
OMV AUTStrategie – BSC – KPI - MBO
1995
Strategie OMV AUT (top down / bottom up / top down)
Balanced Score Card (BSC)
KPI´s AbteilungenMBO´s Mitarbeiter
5 | ÖGEW Herbsttagung, Wien, OMV AUT Exploration & Production
OMV AUT
Performance VerlaufPerformance VerlaufPerformance VerlaufPerformance Verlauf
6 | ÖGEW Herbsttagung, Wien, OMV AUT Exploration & Production
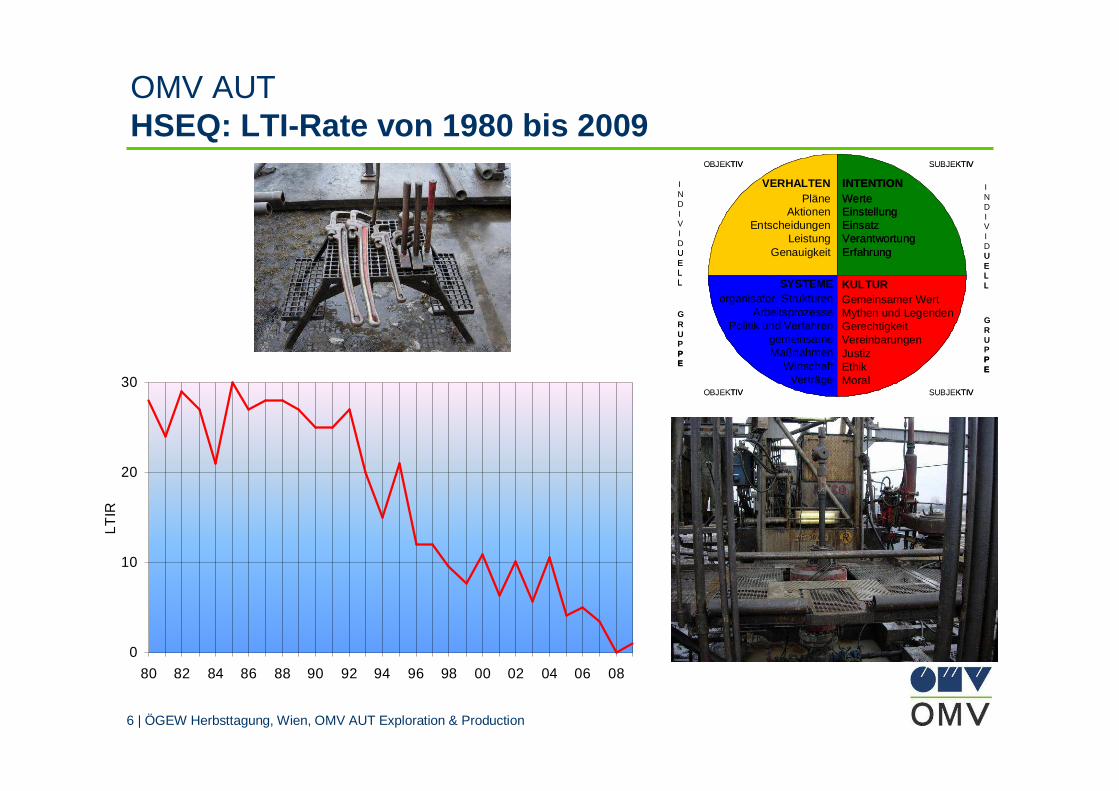
OMV AUTHSEQ: LTI-Rate von 1980 bis 2009
0
10
20
30
80 82 84 86 88 90 92 94 96 98 00 02 04 06 08
LTIR
OBJEKTIV
SUBJEKTIV
SUBJEKTIV
INDIVIDUELL
GRUPPE
INDIVIDUELL
GRUPPE
OBJEKTIV
INTENTIONWerteEinstellungEinsatzVerantwortungErfahrung
VERHALTENPläne
AktionenEntscheidungen
LeistungGenauigkeit
SYSTEMEorganisator. Strukturen
ArbeitsprozessePolitik und Verfahren
gemeinsame Maßnahmen
Wirtschaft Verträge
KULTURGemeinsamer WertMythen und LegendenGerechtigkeitVereinbarungenJustizEthikMoral
OBJEKTIV
SUBJEKTIV
SUBJEKTIV
INDIVIDUELL
GRUPPE
INDIVIDUELL
GRUPPE
OBJEKTIV
INTENTIONWerteEinstellungEinsatzVerantwortungErfahrung
VERHALTENPläne
AktionenEntscheidungen
LeistungGenauigkeit
SYSTEMEorganisator. Strukturen
ArbeitsprozessePolitik und Verfahren
gemeinsame Maßnahmen
Wirtschaft Verträge
KULTURGemeinsamer WertMythen und LegendenGerechtigkeitVereinbarungenJustizEthikMoral
7 | ÖGEW Herbsttagung, Wien, OMV AUT Exploration & Production
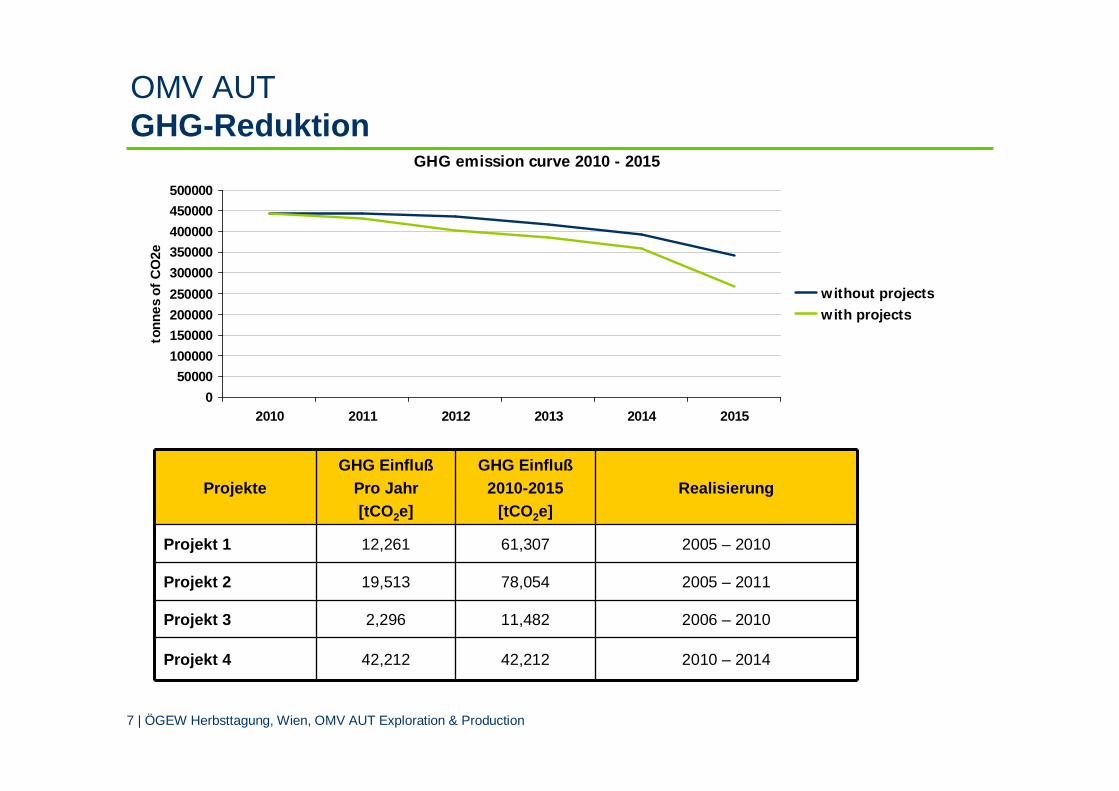
OMV AUTGHG-Reduktion
ProjekteGHG Einfluß
Pro Jahr[tCO 2e]
GHG Einfluß2010-2015
[tCO 2e]Realisierung
Projekt 1 12,261 61,307 2005 – 2010
Projekt 2 19,513 78,054 2005 – 2011
Projekt 3 2,296 11,482 2006 – 2010
Projekt 4 42,212 42,212 2010 – 2014
GHG emission curve 2010 - 2015
0
50000
100000
150000
200000
250000
300000
350000
400000
450000
500000
2010 2011 2012 2013 2014 2015
tonn
es o
f CO
2e
without projects
with projects
8 | ÖGEW Herbsttagung, Wien, OMV AUT Exploration & Production
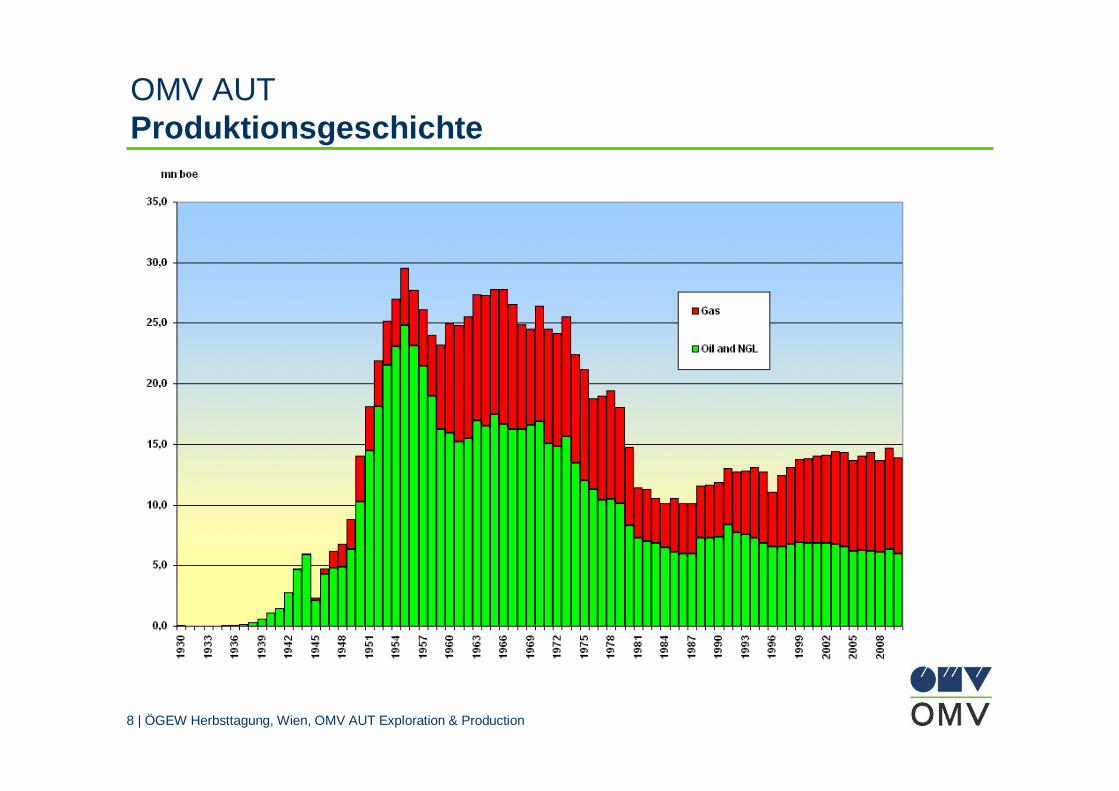
OMV AUTProduktionsgeschichte
9 | ÖGEW Herbsttagung, Wien, OMV AUT Exploration & Production
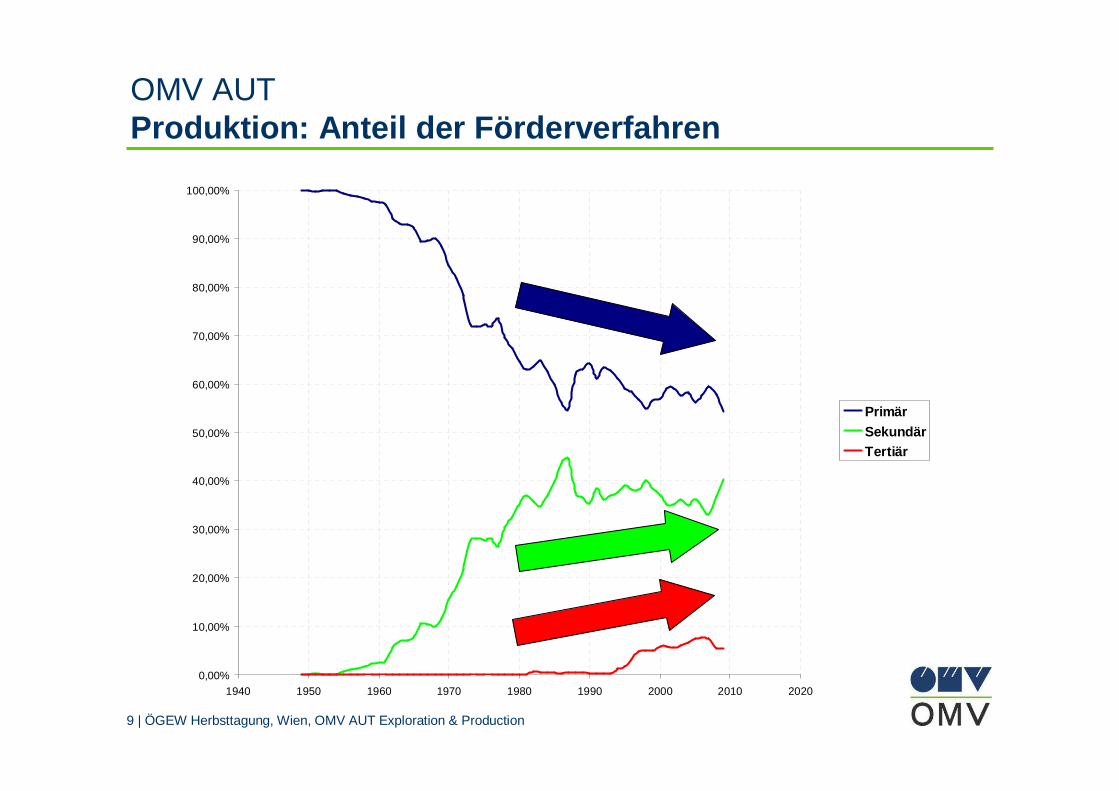
OMV AUTProduktion: Anteil der Förderverfahren
0,00%
10,00%
20,00%
30,00%
40,00%
50,00%
60,00%
70,00%
80,00%
90,00%
100,00%
1940 1950 1960 1970 1980 1990 2000 2010 2020
PrimärSekundärTertiär
10 | ÖGEW Herbsttagung, Wien, OMV AUT Exploration & Production
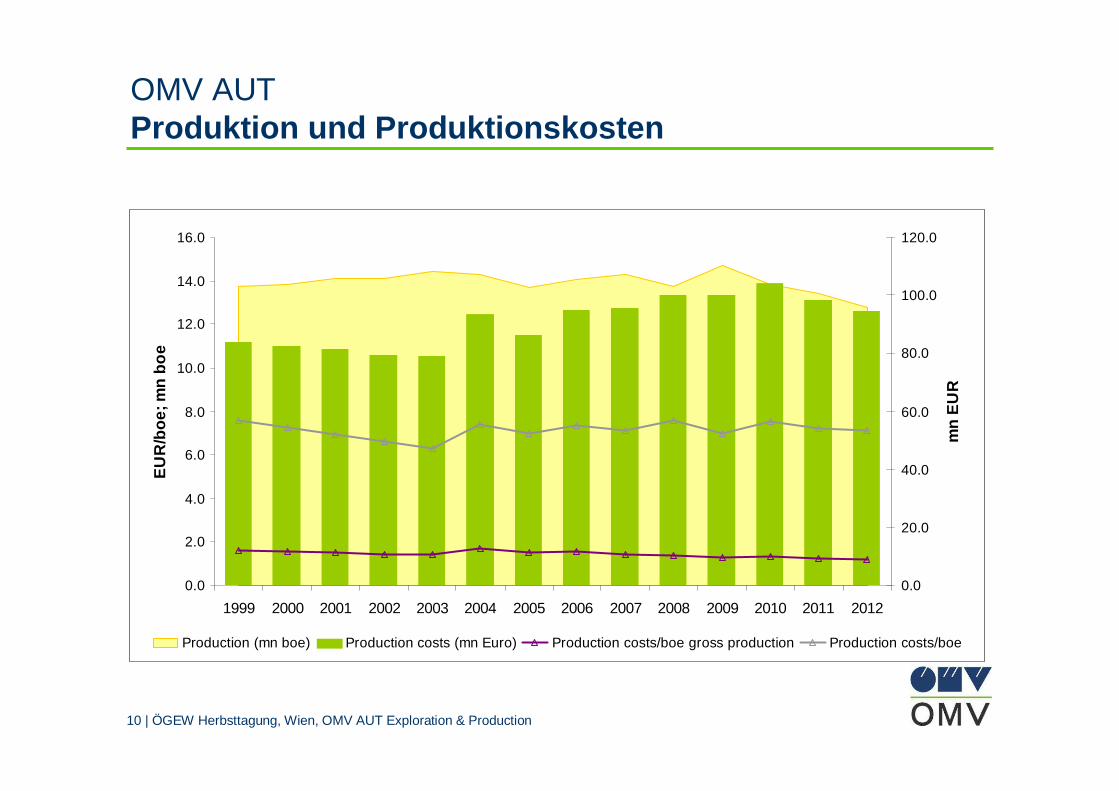
OMV AUTProduktion und Produktionskosten
0.0
2.0
4.0
6.0
8.0
10.0
12.0
14.0
16.0
1999 2000 2001 2002 2003 2004 2005 2006 2007 2008 2009 2010 2011 2012
EU
R/b
oe; m
n bo
e
0.0
20.0
40.0
60.0
80.0
100.0
120.0
mn
EU
R
Production (mn boe) Production costs (mn Euro) Production costs/boe gross production Production costs/boe
11 | ÖGEW Herbsttagung, Wien, OMV AUT Exploration & Production
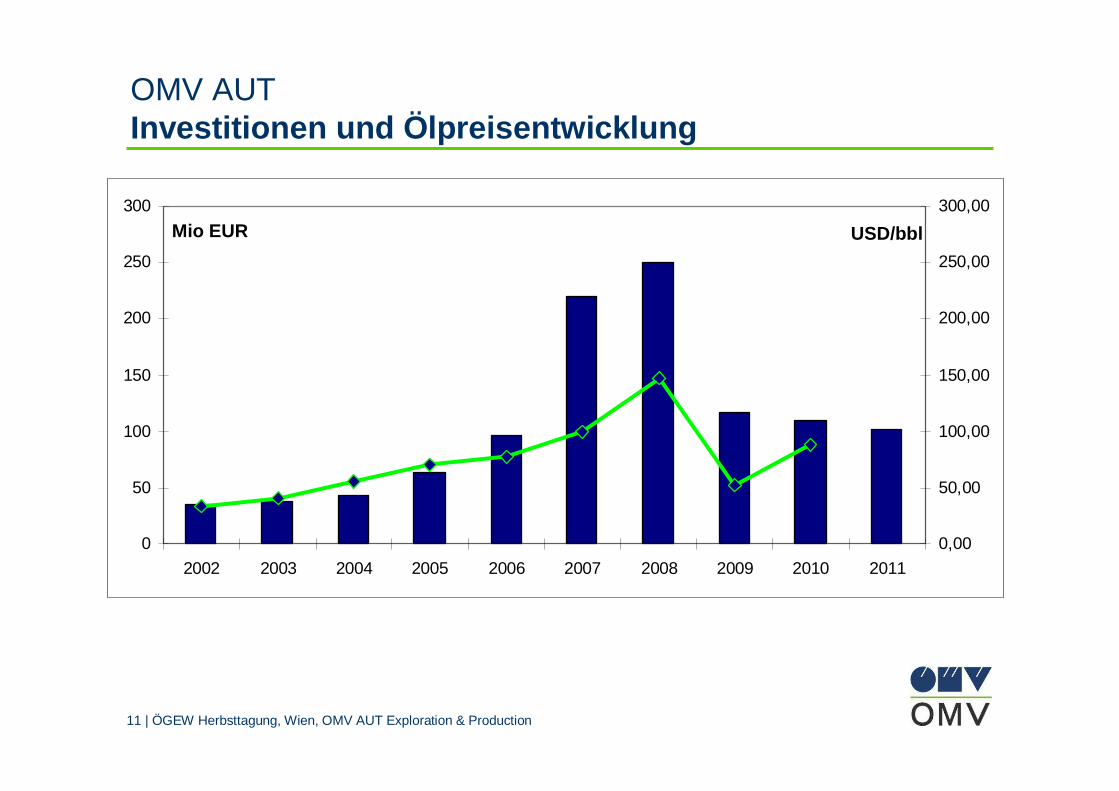
OMV AUTInvestitionen und Ölpreisentwicklung
0
50
100
150
200
250
300
2002 2003 2004 2005 2006 2007 2008 2009 2010 2011
0,00
50,00
100,00
150,00
200,00
250,00
300,00
USD/bblMio EUR
12 | ÖGEW Herbsttagung, Wien, OMV AUT Exploration & Production
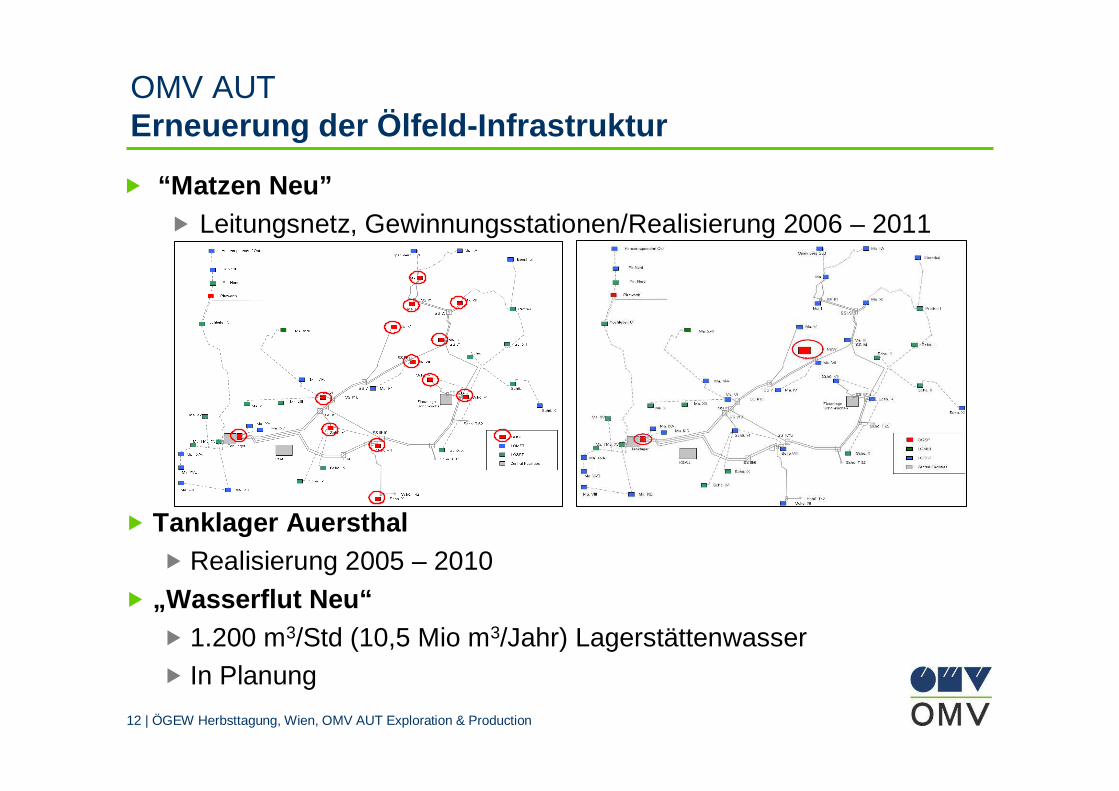
� “Matzen Neu”� Leitungsnetz, Gewinnungsstationen/Realisierung 2006 – 2011
OMV AUTErneuerung der Ölfeld-Infrastruktur
� Tanklager Auersthal� Realisierung 2005 – 2010
� „Wasserflut Neu“� 1.200 m3/Std (10,5 Mio m3/Jahr) Lagerstättenwasser� In Planung
13 | ÖGEW Herbsttagung, Wien, OMV AUT Exploration & Production
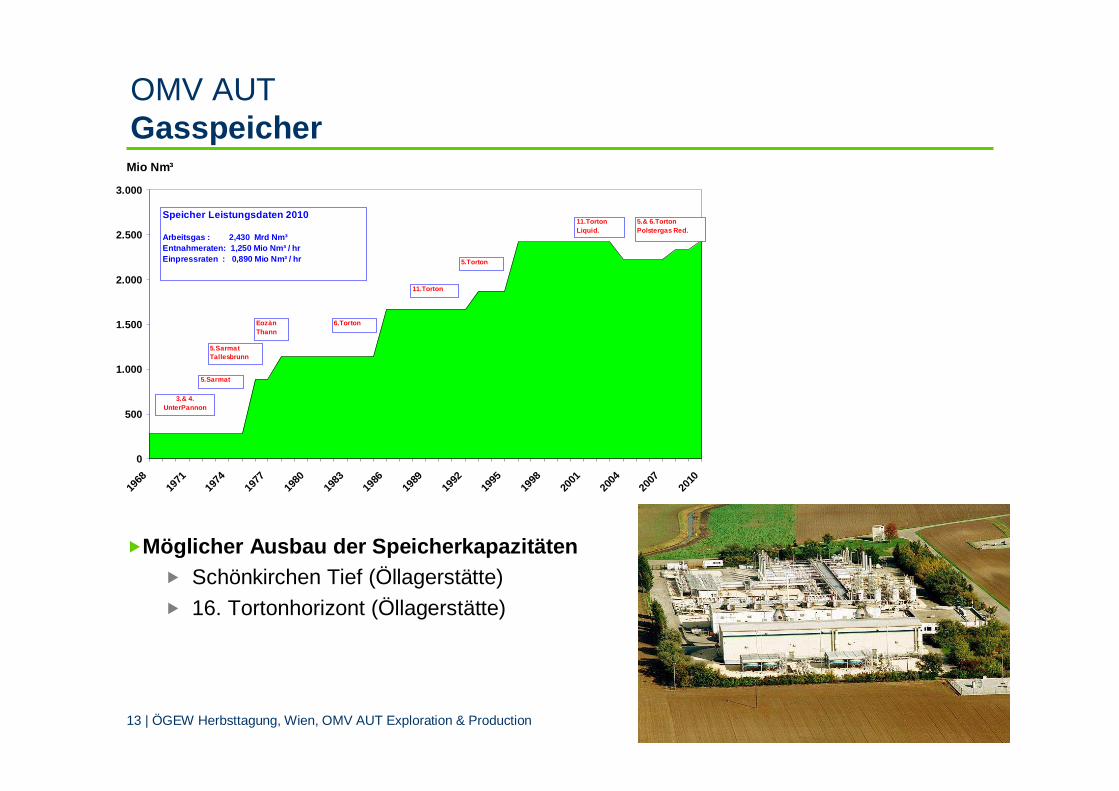
�Möglicher Ausbau der Speicherkapazitäten� Schönkirchen Tief (Öllagerstätte)
� 16. Tortonhorizont (Öllagerstätte)
OMV AUTGasspeicher
0
500
1.000
1.500
2.000
2.500
3.000
1968
1971
1974
1977
1980
1983
1986
1989
1992
1995
1998
2001
2004
2007
2010
Mio Nm³
EozänThann
3.& 4. UnterPannon
6.Torton
5.SarmatTallesbrunn
5.Sarmat
11.Torton
5.& 6.TortonPolstergas Red.
5.Torton
11.TortonLiquid.
Speicher Leistungsdaten 2010
Arbeitsgas : 2,430 Mrd Nm³Entnahmeraten: 1,250 Mio Nm³ / hrEinpressraten : 0,890 Mio Nm³ / hr
14 | ÖGEW Herbsttagung, Wien, OMV AUT Exploration & Production
OMV AUT
BenchmarksBenchmarksBenchmarksBenchmarks
15 | ÖGEW Herbsttagung, Wien, OMV AUT Exploration & Production
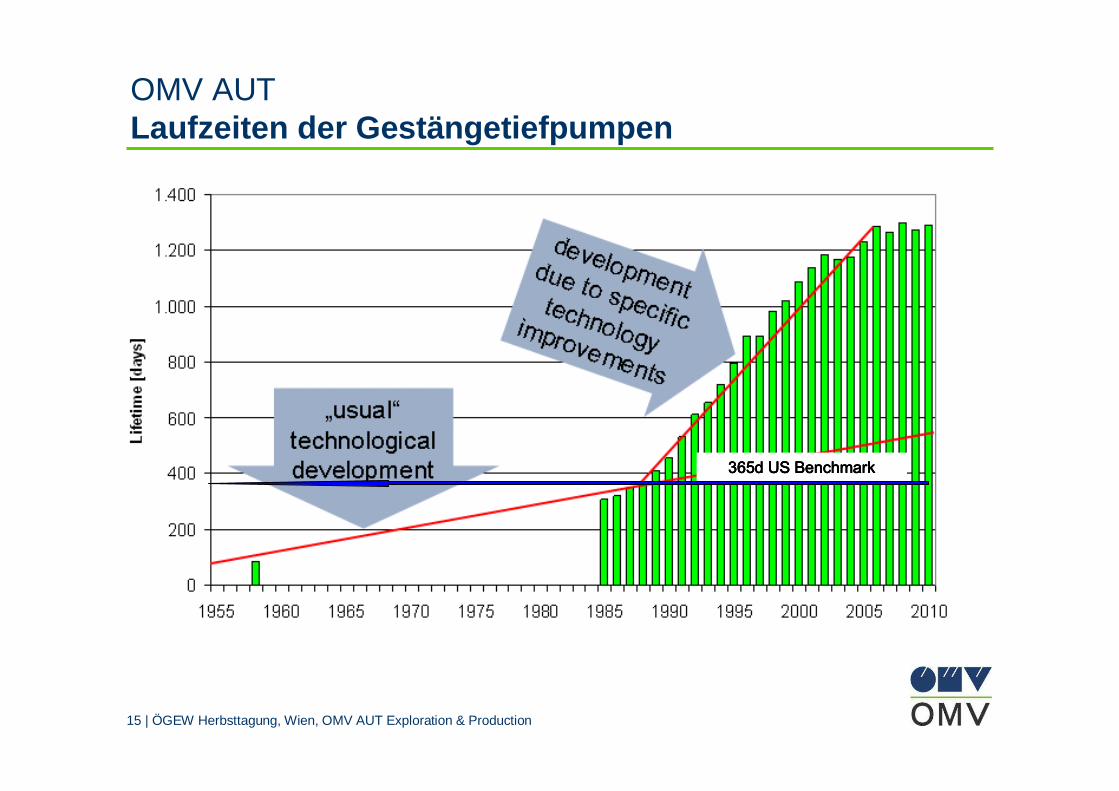
OMV AUTLaufzeiten der Gestängetiefpumpen
365d US Benchmark365d US Benchmark365d US Benchmark365d US Benchmark
16 | ÖGEW Herbsttagung, Wien, OMV AUT Exploration & Production
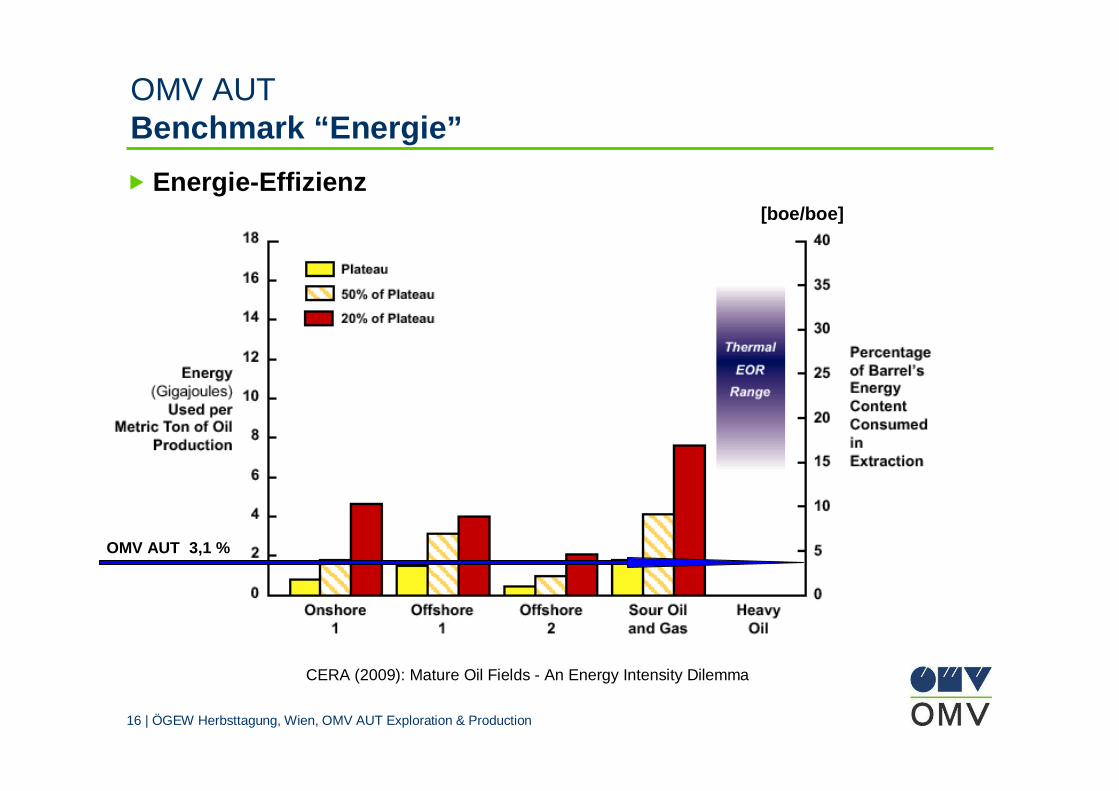
� Energie-Effizienz
CERA (2009): Mature Oil Fields - An Energy Intensity Dilemma
OMV AUT 3,1 %
OMV AUTBenchmark “Energie”
[boe/boe]
17 | ÖGEW Herbsttagung, Wien, OMV AUT Exploration & Production
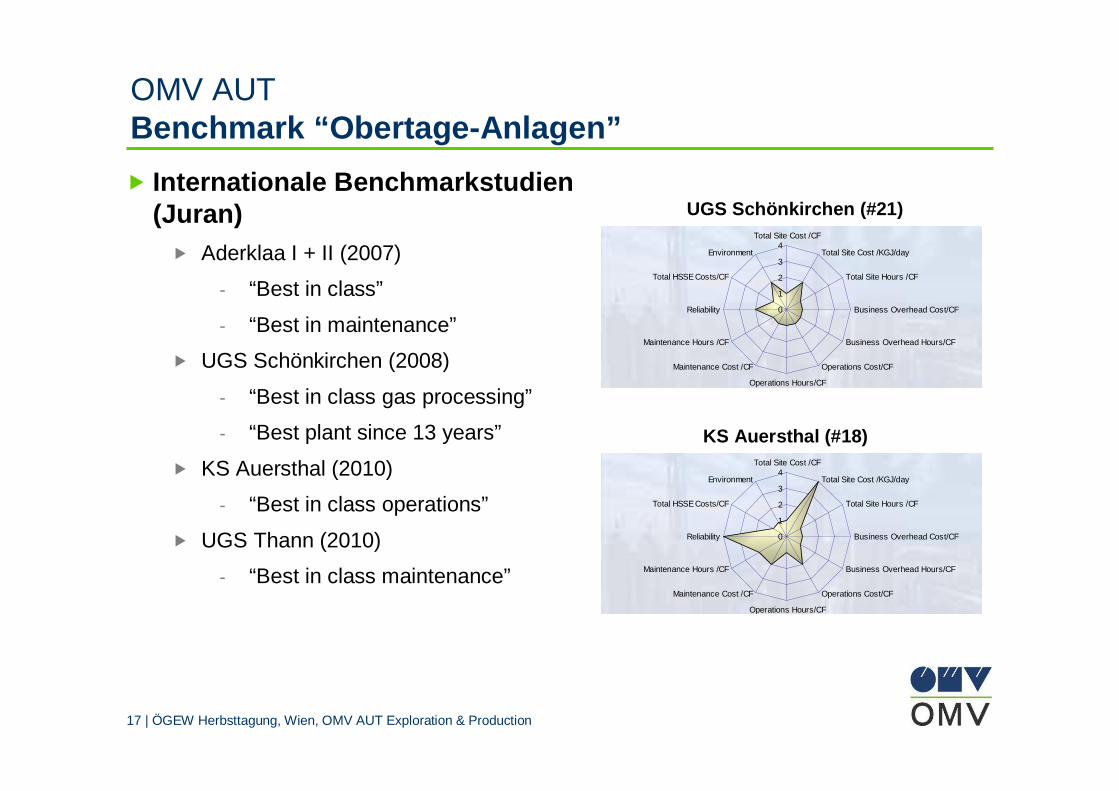
� Internationale Benchmarkstudien (Juran)
� Aderklaa I + II (2007)
- “Best in class”
- “Best in maintenance”
� UGS Schönkirchen (2008)
- “Best in class gas processing”
- “Best plant since 13 years”
� KS Auersthal (2010)
- “Best in class operations”
� UGS Thann (2010)
- “Best in class maintenance”
OMV AUTBenchmark “Obertage-Anlagen”
0
1
2
3
4Total Site Cost /CF
Total Site Cost /KGJ/day
Total Site Hours /CF
Business Overhead Cost/CF
Business Overhead Hours/CF
Operations Cost/CF
Operations Hours/CF
Maintenance Cost /CF
Maintenance Hours /CF
Reliability
Total HSSE Costs/CF
Environment
0
1
2
3
4Total Site Cost /CF
Total Site Cost /KGJ/day
Total Site Hours /CF
Business Overhead Cost/CF
Business Overhead Hours/CF
Operations Cost/CF
Operations Hours/CF
Maintenance Cost /CF
Maintenance Hours /CF
Reliability
Total HSSE Costs/CF
Environment
UGS Schönkirchen (#21)
KS Auersthal (#18)
18 | ÖGEW Herbsttagung, Wien, OMV AUT Exploration & Production
OMV AUT
Key Performance IndikatorenKey Performance IndikatorenKey Performance IndikatorenKey Performance Indikatoren
19 | ÖGEW Herbsttagung, Wien, OMV AUT Exploration & Production
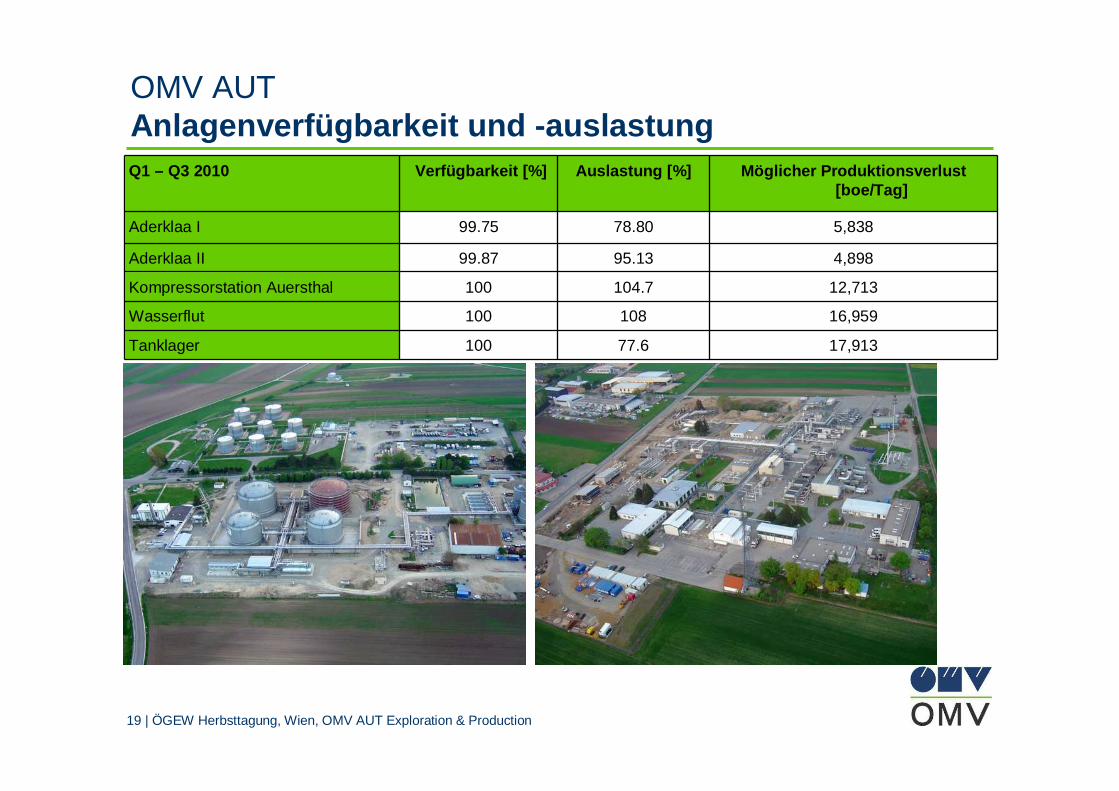
OMV AUTAnlagenverfügbarkeit und -auslastungQ1 – Q3 2010 Verfügbarkeit [%] Auslastung [%] Möglicher Produktionsverlust
[boe/Tag]
Aderklaa I 99.75 78.80 5,838
Aderklaa II 99.87 95.13 4,898
Kompressorstation Auersthal 100 104.7 12,713
Wasserflut 100 108 16,959
Tanklager 100 77.6 17,913
20 | ÖGEW Herbsttagung, Wien, OMV AUT Exploration & Production
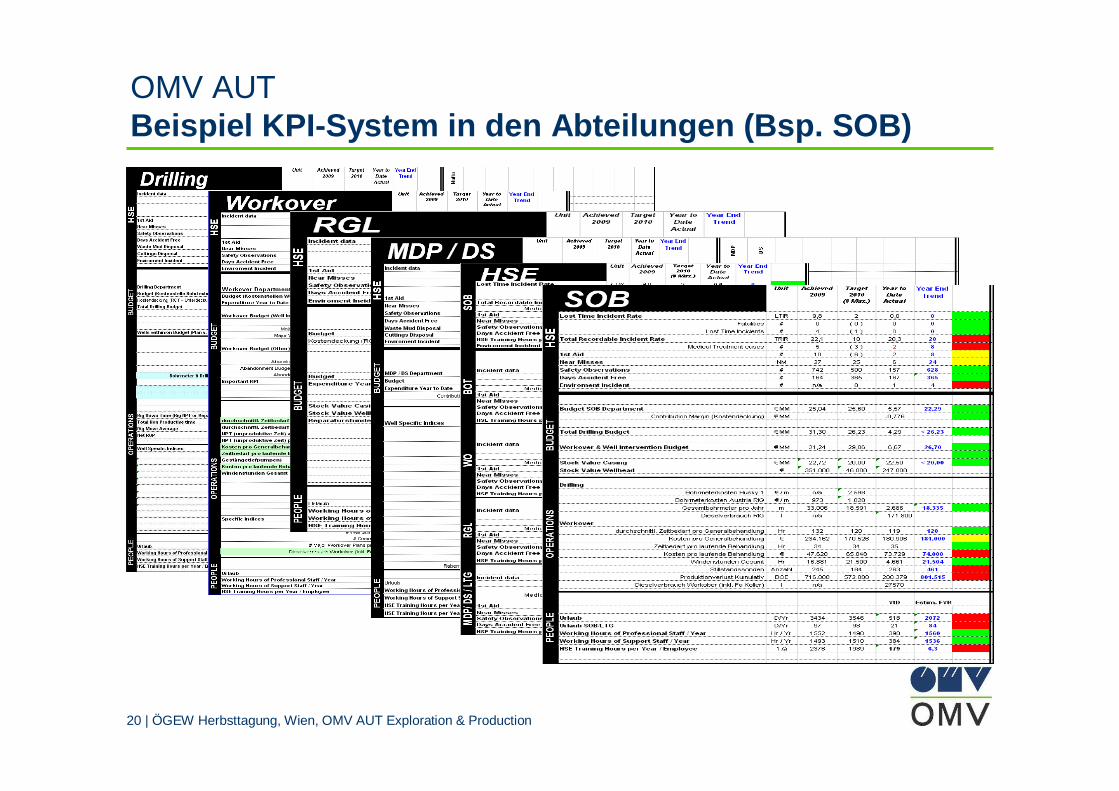
OMV AUTBeispiel KPI-System in den Abteilungen (Bsp. SOB)
21 | ÖGEW Herbsttagung, Wien, OMV AUT Exploration & Production
Unit plan 2010 plan today
actual % to plan
% 100 100 100 0% 99,0 99,0 107,4 8
€/m³ 0,9102 0,9102 0,472 -48
% 100 100 100 0% 73,6 73,6 77,7 6
€/bbl 0,5317 0,5317 0,368 -31
Mio. € 21,37 5,34 4,36 -18
t/year 20000 4877 3536 -27Mio. € 7,16 1,79 1,05 -41
days 1320 1268 1278 1Nm3/m3 45,5 46,63 43,76 -6
number 47 12 7 -40number 150 38 42 12Mio. € 1,54 0,39 0,35 -93. Opex budget
2. Specific liftgas consumption
Pipeline operations1. Number of pipeline failures2. Number of pipeline pressure tests
1. Mud treatment throughput3. Opex budget
Production engineering1. Average pump uptime
3. Specific unit costs (opex)Compr.stat.AU, Water treatment plant, Tank farm AU
1. Opex budget
Environment / Waste disposal
3. Specific unit costs (opex)Tank farm Auersthal
1. Availability2. Plant utilization (130 m³/h =100%)
Water treatment plant1. Availability2. Plant utilization (1208 m³/h = 100%)
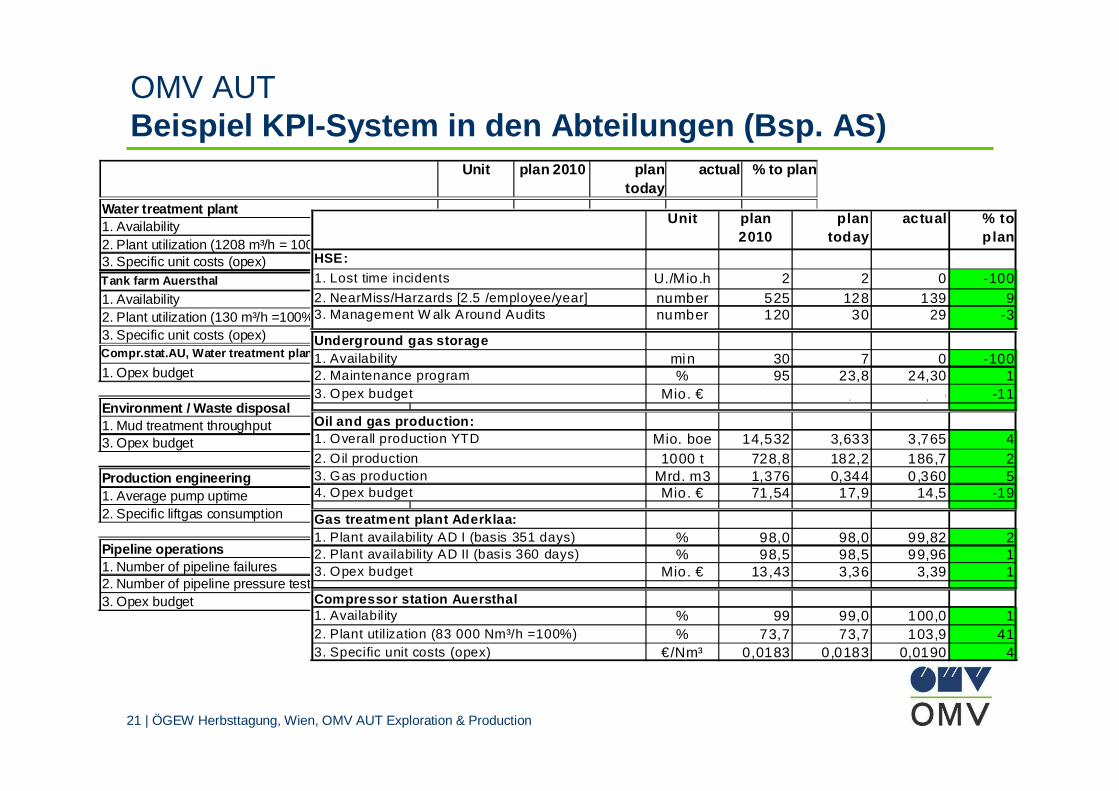
OMV AUTBeispiel KPI-System in den Abteilungen (Bsp. AS)
Unit plan 2010
plan today
actual % to p lan
HSE:
U./Mio.h 2 2 0 -100number 525 128 139 9number 120 30 29 -3
min 30 7 0 -100% 95 23,8 24,30 1
Mio. € 20,49 5,14 4,56 -11
Mio. boe 14,532 3,633 3,765 41000 t 728,8 182,2 186,7 2
Mrd. m3 1,376 0,344 0,360 5Mio. € 71,54 17,9 14,5 -19
% 98,0 98,0 99,82 2% 98,5 98,5 99,96 1
Mio. € 13,43 3,36 3,39 1
% 99 99,0 100,0 1% 73,7 73,7 103,9 41
€/Nm³ 0,0183 0,0183 0,0190 4
1. Lost time incidents
2. NearMiss/Harzards [2.5 /employee/year]3. Management W alk Around Audits
Underground gas storage1. Availability2. Maintenance program
Oil and gas production:
3. Opex budget
1. Overall production YTD
2. Oil production3. Gas production4. Opex budget
Gas treatment plant Aderklaa:1. Plant availability AD I (basis 351 days)2. Plant availability AD II (basis 360 days)3. Opex budget
Compressor station Auersthal1. Availability2. Plant utilization (83 000 Nm³/h =100%)3. Specific unit costs (opex)
22 | ÖGEW Herbsttagung, Wien, OMV AUT Exploration & Production
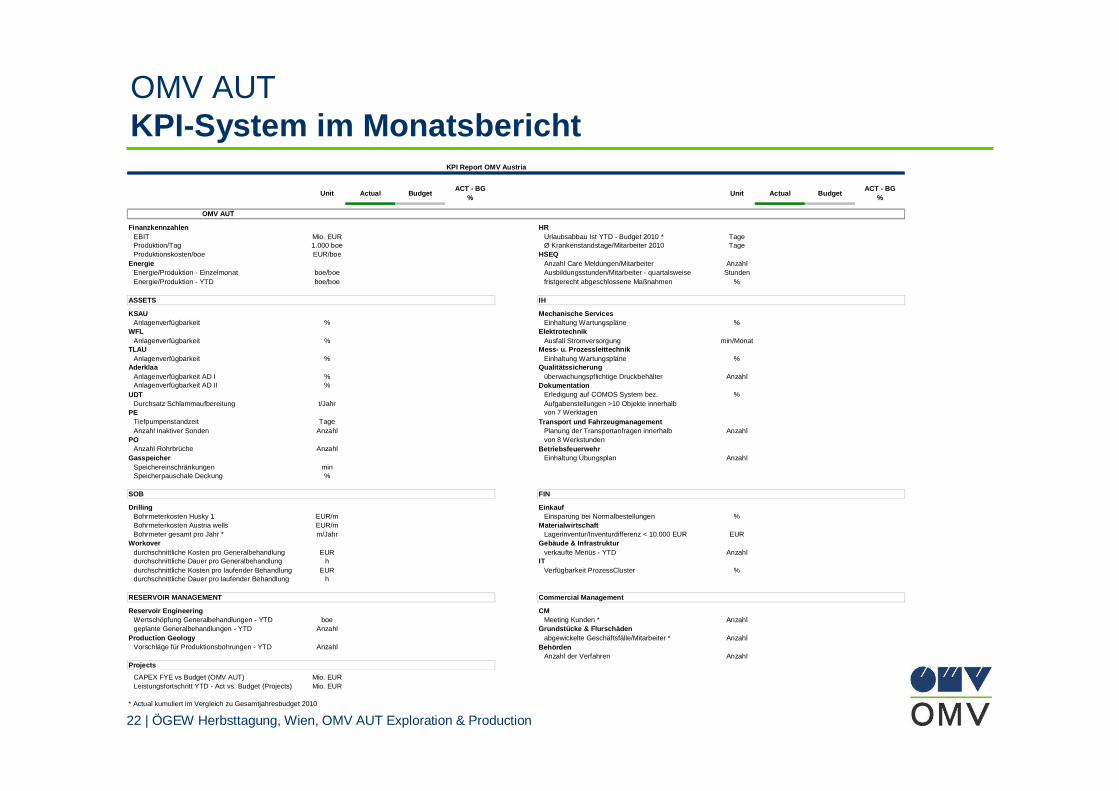
OMV AUTKPI-System im Monatsbericht
KPI Report OMV Austria
ACT - BG ACT - BG% %
OMV AUT
Finanzkennzahlen HREBIT Mio. EUR Urlaubsabbau Ist YTD - Budget 2010 * TageProduktion/Tag 1.000 boe Ø Krankenstandstage/Mitarbeiter 2010 TageProduktionskosten/boe EUR/boe HSEQ
Energie Anzahl Care Meldungen/Mitarbeiter AnzahlEnergie/Produktion - Einzelmonat boe/boe Ausbildungsstunden/Mitarbeiter - quartalsweise StundenEnergie/Produktion - YTD boe/boe fristgerecht abgeschlossene Maßnahmen %
ASSETS IH
KSAU Mechanische ServicesAnlagenverfügbarkeit % Einhaltung Wartungspläne %
WFL ElektrotechnikAnlagenverfügbarkeit % Ausfall Stromversorgung min/Monat
TLAU Mess- u. ProzessleittechnikAnlagenverfügbarkeit % Einhaltung Wartungspläne %
Aderklaa QualitätssicherungAnlagenverfügbarkeit AD I % überwachungspflichtige Druckbehälter AnzahlAnlagenverfügbarkeit AD II % Dokumentation
UDT Erledigung auf COMOS System bez. %Durchsatz Schlammaufbereitung t/Jahr Aufgabenstellungen >10 Objekte innerhalb
PE von 7 WerktagenTiefpumpenstandzeit Tage Transport und FahrzeugmanagementAnzahl inaktiver Sonden Anzahl Planung der Transportanfragen innerhalb Anzahl
PO von 8 WerkstundenAnzahl Rohrbrüche Anzahl Betriebsfeuerwehr
Gasspeicher Einhaltung Übungsplan AnzahlSpeichereinschränkungen minSpeicherpauschale Deckung %
SOB FIN
Drilling EinkaufBohrmeterkosten Husky 1 EUR/m Einsparung bei Normalbestellungen %Bohrmeterkosten Austria wells EUR/m MaterialwirtschaftBohrmeter gesamt pro Jahr * m/Jahr Lagerinventur/Inventurdifferenz < 10.000 EUR EUR
Workover Gebäude & Infrastrukturdurchschnittliche Kosten pro Generalbehandlung EUR verkaufte Menüs - YTD Anzahldurchschnittliche Dauer pro Generalbehandlung h ITdurchschnittliche Kosten pro laufender Behandlung EUR Verfügbarkeit ProzessCluster %durchschnittliche Dauer pro laufender Behandlung h
RESERVOIR MANAGEMENT Commercial Management
Reservoir Engineering CMWertschöpfung Generalbehandlungen - YTD boe Meeting Kunden * Anzahlgeplante Generalbehandlungen - YTD Anzahl Grundstücke & Flurschäden
Production Geology abgewickelte Geschäftsfälle/Mitarbeiter * AnzahlVorschläge für Produktionsbohrungen - YTD Anzahl Behörden
Anzahl der Verfahren AnzahlProjects
CAPEX FYE vs Budget (OMV AUT) Mio. EURLeistungsfortschritt YTD - Act vs. Budget (Projects) Mio. EUR
* Actual kumuliert im Vergleich zu Gesamtjahresbudget 2010
BudgetActualUnit Budget Unit Actual
23 | ÖGEW Herbsttagung, Wien, OMV AUT Exploration & Production
OMV AUT
AusblickAusblickAusblickAusblick
24 | ÖGEW Herbsttagung, Wien, OMV AUT Exploration & Production
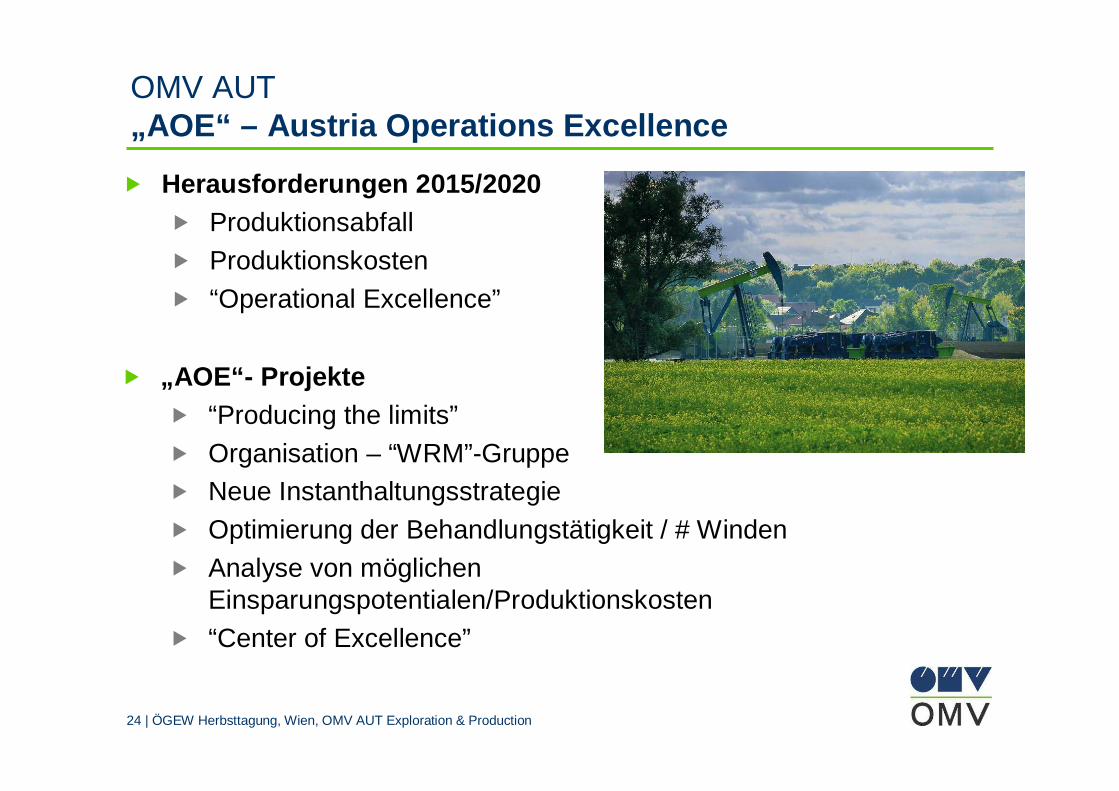
OMV AUT„AOE“ – Austria Operations Excellence
� Herausforderungen 2015/2020� Produktionsabfall
� Produktionskosten
� “Operational Excellence”
� „AOE“- Projekte� “Producing the limits”
� Organisation – “WRM”-Gruppe� Neue Instanthaltungsstrategie
� Optimierung der Behandlungstätigkeit / # Winden
� Analyse von möglichen Einsparungspotentialen/Produktionskosten
� “Center of Excellence”
25 | ÖGEW Herbsttagung, Wien, OMV AUT Exploration & Production
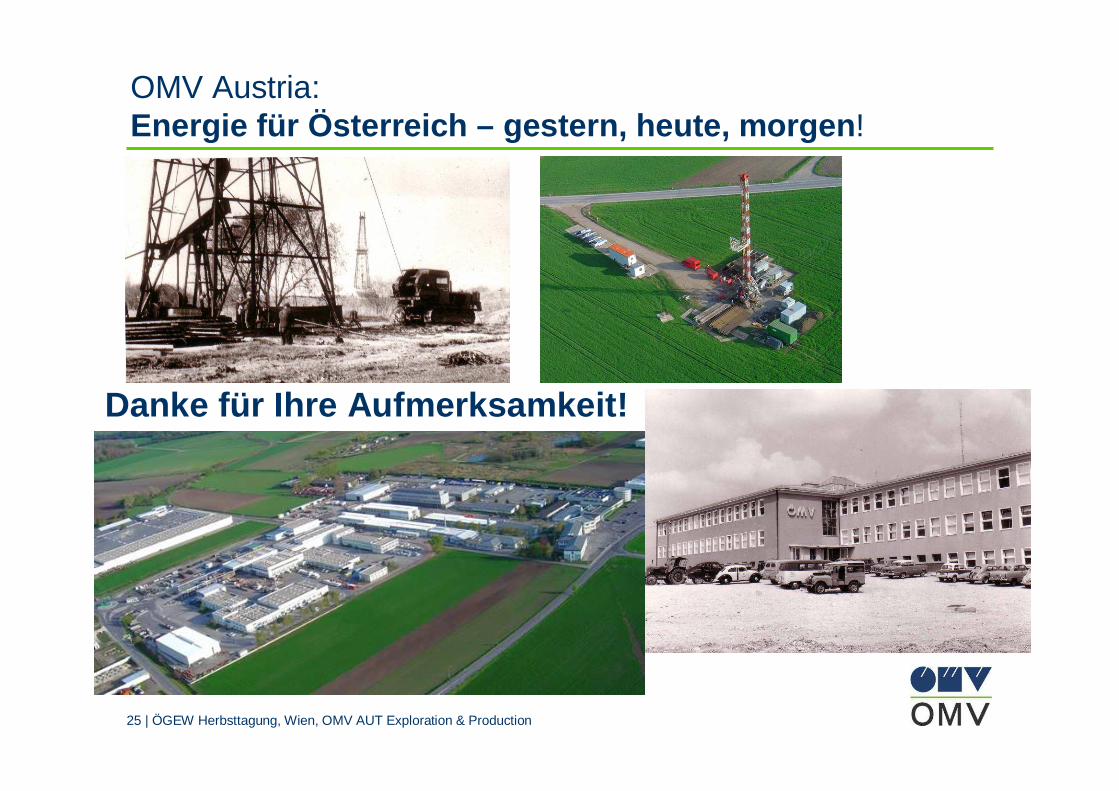
OMV Austria: Energie für Österreich – gestern, heute, morgen !
Danke für Ihre Aufmerksamkeit!