OMSAP Public Meeting September 1999 Water Quality Monitoring Program and Baseline Results OMSAP...
80
OMSAP Public Meeting September 1999 Water Quality Monitoring Program and Baseline Results OMSAP Technical Meeting September 22, 1999 Carlton D. Hunt & P. Scott Libby Battelle Duxbury Operations Duxbury, MA 02332
-
Upload
phyllis-berry -
Category
Documents
-
view
222 -
download
0
Transcript of OMSAP Public Meeting September 1999 Water Quality Monitoring Program and Baseline Results OMSAP...

OMSAP Public MeetingSeptember 1999
Water Quality Monitoring Program and Baseline Results
OMSAP Technical MeetingSeptember 22, 1999
Carlton D. Hunt & P. Scott LibbyBattelleDuxbury OperationsDuxbury, MA 02332
OMSAP Public MeetingSeptember 1999
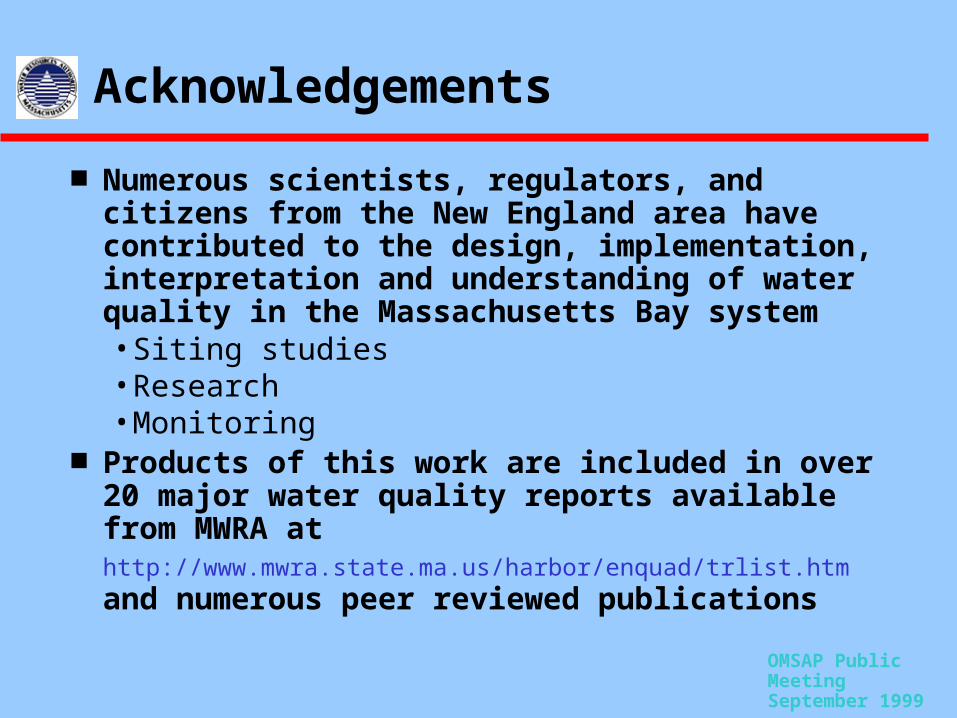
Acknowledgements
Numerous scientists, regulators, and citizens from the New England area have contributed to the design, implementation, interpretation and understanding of water quality in the Massachusetts Bay system• Siting studies• Research• Monitoring
Products of this work are included in over 20 major water quality reports available from MWRA at http://www.mwra.state.ma.us/harbor/enquad/trlist.htm and numerous peer reviewed publications

InflowOutflow
Light
ConcernsEcologicalEcological NutrientsNutrients Contaminants Organic MaterialOrganic Material Food ChainFood Chain Community StructureCommunity Structure Living ResourcesLiving Resources
Human Health Contaminants Bacteria Viruses Bioaccumulation
SEDIMENT
Mammals
Infauna
Piscivorous Fish
ZooplanktonZooplankton
PhytoplanktonPhytoplankton
Planktivorous Fish
Epibenthos
Demersal Fish
Regeneration
DetritusParticulateParticulate
MicrobesMicrobes
DissolvedDissolved
WATER COLUMN
Sources Rivers BoundaryBoundary Nonpoint EffluentsEffluents
Gas ExchangeExchangeN2, | O2, CO2
ATMOSPHERE
N, P, Si, ON, P, Si, O22, CO, CO22 Microbes

OMSAP Public MeetingSeptember 1999
Presentation Summary
Overview Water Quality Monitoring Program Major Baseline Characteristics Spatial and Temporal Responses
• Nutrients• Chlorophyll• Dissolved Oxygen• Plankton
Thresholds Future expectations

OMSAP Public MeetingSeptember 1999
Nutrients, dissolved oxygen, or phytoplankton biomass
Phytoplankton and zooplankton community composition in the nearfield and farfield occur
Phytoplankton production rates in the water column near the outfall and outer Boston Harbor
Water Quality Monitoring Introduction
WQ monitoring program objectives are to determine if changes occur in the nearfield (local) or farfield (regional) to

OMSAP Public MeetingSeptember 1999
Water Quality Monitoring Overview
Nutrients, chlorophyll, and dissolved oxygen Harbor signatures and gradients in Mass Bay Plankton communities Thresholds and detection of change Expectations of conditions after the outfall begins
discharging at the Massachusetts Bay location
This presentation focuses on spatial and temporal responses in the following areas

OMSAP Public MeetingSeptember 1999
MWRA Monitors 21 Nearfield and 28 Farfield Water Quality Stations in Massachusetts Bay
Water Quality Measurement Program

OMSAP Public MeetingSeptember 1999
Water Quality Monitoring Vertical profiles
Continuous vertical hydrographic profiles to within 5 m of the bottom• Temperature• Salinity• Dissolved oxygen• Chlorophyll fluorescence• Beam attenuation (particles)• Irradiance (light)
Discrete samples from 3 or 5 depths (depending on water depth)
OMSAP Public MeetingSeptember 1999
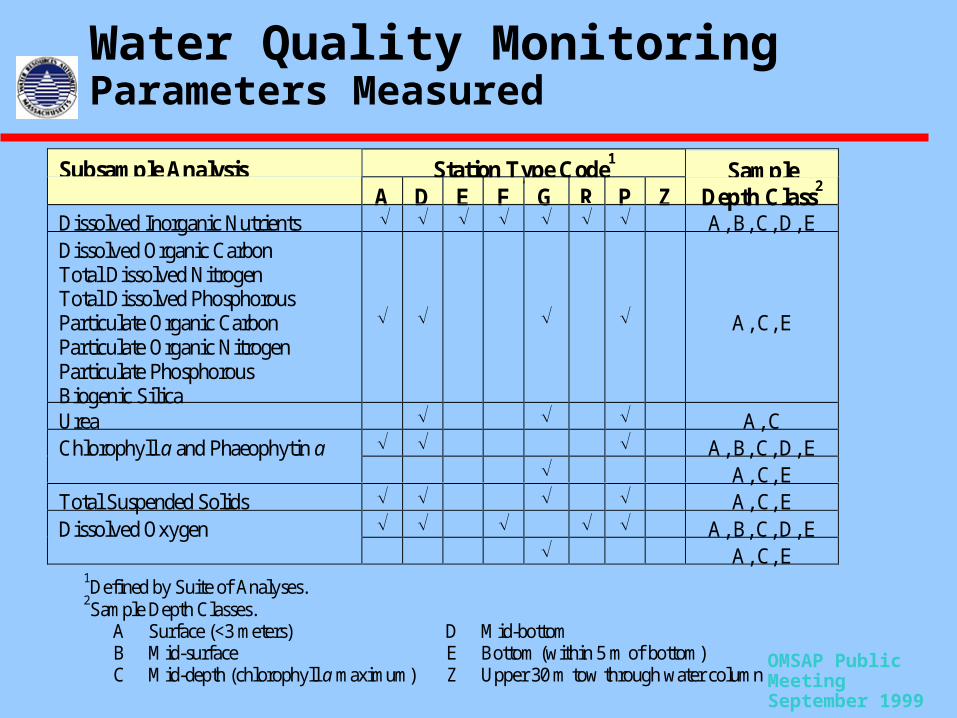
Water Quality Monitoring Parameters Measured
Station Type Code1Subsample AnalysisA D E F G R P Z
SampleDepth Class2
Dissolved Inorganic Nutrients A, B, C, D, EDissolved Organic CarbonTotal Dissolved NitrogenTotal Dissolved PhosphorousParticulate Organic CarbonParticulate Organic NitrogenParticulate PhosphorousBiogenic Silica
A, C, E
Urea A, C A, B, C, D, EChlorophyll a and Phaeophytin a
A, C, ETotal Suspended Solids A, C, E
A, B, C, D, EDissolved Oxygen A, C, E
1Defined by Suite of Analyses.2Sample Depth Classes.
A Surface (<3 meters) D Mid-bottomB Mid-surface E Bottom (within 5 m of bottom)C Mid-depth (chlorophyll a maximum) Z Upper 30 m tow through water column

OMSAP Public MeetingSeptember 1999
Water Quality Monitoring Parameters Measured
Biological Parameters Sampled by Station Type and Sample Depth
Station TypeCode1
Subsample Analysis
D G R P ZSample
Depth Class2
Zooplankton ZPhytoplankton (whole water) A, CPhytoplankton (screened water) A, CRespiration A, C, EPrimary Productivity A, B, C, D, E
1Defined by Suite of Analyses.2Sample Depth Classes.
A Surface (<3 meters) D Mid-bottomB Mid-surface E Bottom (within 5 m of bottom)C Mid-depth (chlorophyll a maximum) Z Upper 30 m tow through water column
OMSAP Public MeetingSeptember 1999
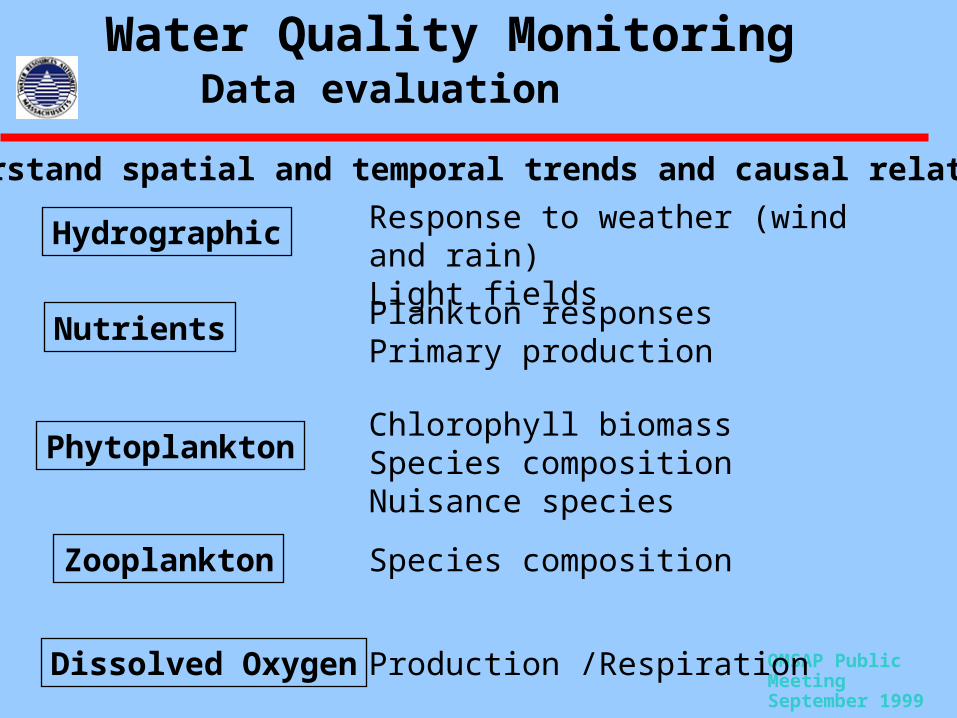
Water Quality Monitoring Data evaluation
To understand spatial and temporal trends and causal relationships
Hydrographic Response to weather (wind and rain) Light fields
PhytoplanktonChlorophyll biomass Species composition Nuisance species
Nutrients Plankton responsesPrimary production
Zooplankton Species composition
Dissolved Oxygen Production /Respiration

OMSAP Public MeetingSeptember 1999
Water Quality Baseline Characteristics
Gradients (nutrients, biomass, and dissolved oxygen)• Temporal • Offshore • Vertical
Tidal exchange and export from Boston Harbor
Plankton Communities• Phytoplankton• Zooplankton

OMSAP Public MeetingSeptember 1999
Water Quality Gradients
Gradients in the system are examined using• horizontal contours • vertical sections • temporal plots
– individual stations – regions in the Bay
F01
F02
F03
F05
F06
F07
F10
F12
F13
F14 F15
F16F17
F18
F19
F22
F23
F24
F25
F26
F27
F28
F29
F30
F31
F32
F33
N01 N02 N03 N04
N05
N06
N07N08N09N10
N11
N12N13N14N15
N16
N17N18N19
N20N21
BO
UN
DA
RY
MA
RSH
FIE
LD
COHASSET
BOSTON
- NEARFIE
LD
MA
RSH
FIELD
NEA
RFIELD -
NEA
RFI
ELD
42°0
0'
42°00'
42°1
5'
42°15'
42°3
0'
42°30'
71°00'
71°00'
70°45'
70°45'
70°30'
70°30'
70°15'
70°15'
0 5 10 15 Kilometers
F01 Sampling Location Name
Outfall Diffuser
Stellwagen Bank National Marine Sanctuary
LEGEND
N

OMSAP Public MeetingSeptember 1999
Water Quality Horizontal Gradients
The gradient offshore of Boston Harbor and along the shore from the Harbor to Plymouth is a persistent feature in the surface waters under the present discharge regime.
0.75
3.68
4.46
4.665.35
5.405.53
5.87
6.056.24
6.27
6.27
6.34
6.41
6.62
6.79
6.856.88
6.88
7.13
7.36
7.49
7.66
7.68
7.82
8.05
8.22
8.31
8.62
8.87
9.06
9.64
9.80
11.29
11.94
14.01
14.85
15.3216.17
21.38
23.45
28.37
1 3 5 7 9 11 13 15 30
71° 00' W 70° 50' W 70° 40' W 70° 30' W 70° 20' W 70° 10' W
41° 50' N
42° 00' N
42° 10' N
42° 20' N
42° 30' N
42° 40' N
0 5 10 15 20
kilom eters
Param eter: N o3+no2+nh4Sam pling D epth: SurfaceLast Survey D ay: 2 /2 /99Sam pling Event: W F991M in im um Value 0.75 µM at F02M axim um Value 28.37 µM at F23C ontour In terval =2 µM
OMSAP Public MeetingSeptember 1999
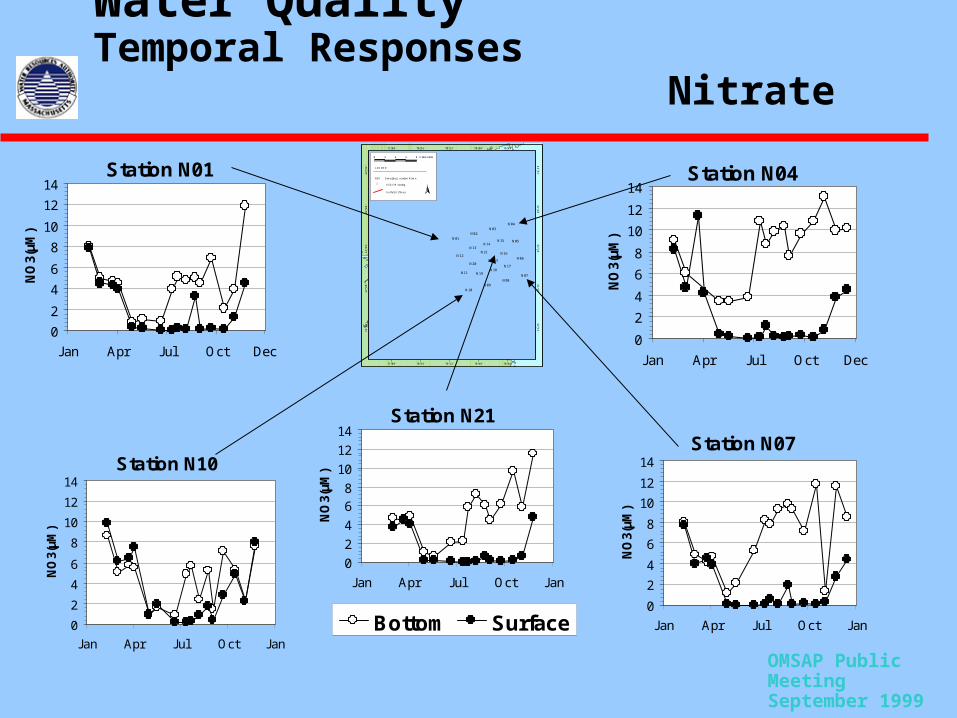
Water Quality Temporal ResponsesNitrate
Station N01
0
2
4
6
8
10
12
14
Jan Apr Jul Oct Dec
NO
3(µM
)
Station N04
0
2
4
6
8
10
12
14
Jan Apr Jul Oct Dec
NO
3(µM
)
Station N21
0
2
4
68
10
12
14
Jan Apr Jul Oct Jan
NO
3(µM
)
Bottom Surface
Station N10
0
2
4
6
8
10
12
14
Jan Apr Jul Oct Jan
NO
3(µM
)
N01N02
N03N04
N05
N06
N07N08
N09N10
N11
N12
N13N14
N15
N16
N17N18
N19
N20
N21
USGS
42°1
6'
42°16'
42°2
0'
42°20'
42°2
4'
42°24'
42°2
8'
42°28'
42°3
2'
42°32'
71°00'
71°00'
70°56'
70°56'
70°52'
70°52'
70°48'
70°48'
70°44'
70°44'
USGS Mooring
0 2 4 6 8 Kilometers
LEGEND
N01 Sampling Location Name
Outfall Diffuser
N
Station N07
0
2
4
6
8
10
12
14
Jan Apr Jul Oct JanN
O3(
µM)

OMSAP Public MeetingSeptember 1999
N01N02
N03N04
N05
N06
N07N08
N09N10
N11
N12
N13N14
N15
N16
N17N18
N19
N20
N21
USGS
42°1
6'
42°16'
42°2
0'
42°20'
42°2
4'
42°24'
42°2
8'
42°28'
42°3
2'
42°32'
71°00'
71°00'
70°56'
70°56'
70°52'
70°52'
70°48'
70°48'
70°44'
70°44'
USGS Mooring
0 2 4 6 8 Kilometers
LEGEND
N01 Sampling Location Name
Outfall Diffuser
N
Water Quality Temporal ResponsesSilicate
Station N01
0
5
10
15
Jan Apr Jul Oct Dec
SiO
4(µM
)
Station N21
0
5
10
15
Jan Apr Jul Oct Jan
SiO
4(µM
)
Bottom Surface
Station N10
0
5
10
15
Jan Apr Jul Oct Jan
SiO
4(µM
)
Station N07
0
5
10
15
Jan Apr Jul Oct Jan
SiO
4(µM
)
Station N04
0
5
10
15
Jan Apr Jul Oct Dec
SiO
4(µM
)

OMSAP Public MeetingSeptember 1999
Water Quality Horizontal GradientsSurface Salinity
30.76
30.4530.7630.78
30.7230.64
30.77
30.8130.76
30.57
30.5630.65
30.58
30.7930.63
30.58
30.76
30.78
30.76
30.71
30.9930.77
30.78
30.75
30.66
30.68
30.55
30.4830.48
30.49
30.77
30.7430.74
29.14
30.53
30.70
30.8530.85
31.86
30.7030.68
30.67
30.55
30.72
30.68
30.56
30.96
30.73
30.42
31.10
2 3 2 4 2 5 2 6 2 7 2 8 2 9 3 0 3 3
71° 00' W 70° 50' W 70° 40' W 70° 30' W 70° 20' W 70° 10' W
41° 50' N
42° 00' N
42° 10' N
42° 20' N
42° 30' N
42° 40' N
0 5 10 15 20
kilom eters
Param eter: Salin itySam pling D epth: SurfaceLast Survey D ay: 8 /25/98Sam pling Event: W F98BM in im um Value 29.14 PSU at F23M axim um Value 31.86 PSU at F19C ontour In terval =1 PSU
30.7630.68
31.46 31.82
31.61
31.38
32.27
31.58
31.85
31.85
31.41
31.04
31.65
31.74
30.42
31.82
31.86
32.01
31.70
31.67
32.08
30.35
31.67
30.82
29.38
31.32
31.63 31.98
31.85
30.25
32.08
31.69
31.08
32.02
31.80
31.4831.63
32.09
31.58
31.7231.82
2 3 2 4 2 5 2 6 2 7 2 8 2 9 3 0 3 3
71° 00' W 70° 50' W 70° 40' W 70° 30' W 70° 20' W 70° 10' W
41° 50' N
42° 00' N
42° 10' N
42° 20' N
42° 30' N
42° 40' N
0 5 10 15 20
kilom eters
Param eter: Salin itySam pling D epth: SurfaceLast Survey D ay: 2 /2 /99Sam pling Event: W F991M in im um Value 29.38 PSU at F30M axim um Value 32.27 PSU at F27C ontour In terval =1 PSU

OMSAP Public MeetingSeptember 1999
Water Quality Horizontal GradientsJune 1998 Storm Response Surface Salinity
30.34
30.21
27.28
30.03
30.44
29.7729.52
29.93
30.56
29.09
28.96
30.11
27.00
30.01
27.80
25.5127.96
25.48
25.4225.1425.66
28.9925.27
29.70
29.00
30.1830.37
30.36
26.19
30.21
22.73
28.2026.93
27.03
26.31
27.60
24.9124.99
27.3324.97
30.36
29.80
2 3 2 4 2 5 2 6 2 7 2 8 2 9 3 0 3 3
71° 00' W 70° 50' W 70° 40' W 70° 30' W 70° 20' W 70° 10' W
41° 50' N
42° 00' N
42° 10' N
42° 20' N
42° 30' N
42° 40' N
0 5 10 15 20
kilom eters
Param eter: Salin itySam pling D epth: SurfaceLast Survey D ay: 6 /22/98Sam pling Event: W F987M in im um Value 22.73 PSU at F30M axim um Value 30.56 PSU at F05C ontour In terval =1 PSU

OMSAP Public MeetingSeptember 1999
Water Quality Horizontal GradientsSurface Temperature
14.07
14.1416.5017.59
15.9215.23
16.89
15.0917.43
14.41
14.3016.04
16.43
17.5214.79
14.46
16.70
17.40
17.83
17.31
13.6115.88
16.78
16.20
17.78
15.63
13.72
13.5313.53
14.95
15.94
15.5415.54
15.39
11.79
15.62
15.0315.03
15.65
14.7915.78
16.07
16.31
16.20
16.71
15.69
11.16
14.25
15.21
18.30
3 5 7 9 11 13 15 17 21
71° 00' W 70° 50' W 70° 40' W 70° 30' W 70° 20' W 70° 10' W
41° 50' N
42° 00' N
42° 10' N
42° 20' N
42° 30' N
42° 40' N
0 5 10 15 20
kilom eters
Param eter: Tem peratureSam pling D epth: SurfaceLast Survey D ay: 8 /25/98Sam pling Event: W F98BM in im um Value 11.16 C at F05M axim um Value 18.30 C at F02C ontour In terval =2 C
2.64
2.74
2.91
2.91
2.94
3.03
3.05
3.05
3.08
3.11
3.13
3.183.193.21
3.24
3.24
3.26
3.31
3.323.37
3.39
3.43
3.473.52
3.55
3.60
3.60
3.60
3.61
3.623.63
3.65
3.66
3.74
3.86
3.87
3.88
3.99
4.14
4.20
4.23
4.23
3 5 7 9 11 13 15 17 21
71° 00' W 70° 50' W 70° 40' W 70° 30' W 70° 20' W 70° 10' W
41° 50' N
42° 00' N
42° 10' N
42° 20' N
42° 30' N
42° 40' N
0 5 10 15 20
kilom eters
Param eter: Tem peratureSam pling D epth: SurfaceLast Survey D ay: 2 /2 /99Sam pling Event: W F991M in im um Value 2.64 C at F23M axim um Value 4.23 C at F12C ontour In terval =2 C

OMSAP Public MeetingSeptember 1999
Water Quality Horizontal GradientsSurface DIN
11.93 9.63
5.16
6.82
1.76
9.54
4.66
7.80
3.45
2.64
1.16
0.50
6.38
0.40
0.25
2.13
0.43
2.04
1.40
2.06
0.29
0.710.99
1.44
1.64
1.14
1.57
2.05
2.25
0.63
3.07
0.99
0.62
0.36
0.62
1.00
0.90
0.39
0.64
0.31
1.45
1.60
0.69
0.58
0.44
1.67
2.56
1 3 5 7 9 11 13 15 19
71° 00' W 70° 50' W 70° 40' W 70° 30' W 70° 20' W 70° 10' W
41° 50' N
42° 00' N
42° 10' N
42° 20' N
42° 30' N
42° 40' N
0 5 10 15 20
kilom eters
Param eter: N o3+no2+nh4Sam pling D epth: SurfaceLast Survey D ay: 8 /18/98Sam pling Event: W F98BM in im um Value 0.26 µM at F14M axim um Value 11.93 µM at F30C ontour In terval =2 µM
0.75
3.68
4.46
4.665.35
5.405.53
5.87
6.056.24
6.27
6.27
6.34
6.41
6.62
6.79
6.856.88
6.88
7.13
7.36
7.49
7.66
7.68
7.82
8.05
8.22
8.31
8.62
8.87
9.06
9.64
9.80
11.29
11.94
14.01
14.85
15.3216.17
21.38
23.45
28.37
1 3 5 7 9 11 13 15 30
71° 00' W 70° 50' W 70° 40' W 70° 30' W 70° 20' W 70° 10' W
41° 50' N
42° 00' N
42° 10' N
42° 20' N
42° 30' N
42° 40' N
0 5 10 15 20
kilom eters
Param eter: N o3+no2+nh4Sam pling D epth: SurfaceLast Survey D ay: 2 /2 /99Sam pling Event: W F991M in im um Value 0.75 µM at F02M axim um Value 28.37 µM at F23C ontour In terval =2 µM

OMSAP Public MeetingSeptember 1999
Water Quality Horizontal GradientsSurface Silicate
1.15
2.08
2.24
2.372.42
2.93
3.26
3.27
3.33
3.36
3.40
3.49
3.673.73
3.76
3.97
4.00
4.04
4.09 4.134.45
4.76
5.16
5.335.36
5.50
5.85
5.97
6.28
6.31
6.62
6.85
6.89
7.24
8.09
8.29
8.64 8.71
8.81
10.68
13.86 15.81
1 3 5 7 9 11 13 18
71° 00' W 70° 50' W 70° 40' W 70° 30' W 70° 20' W 70° 10' W
41° 50' N
42° 00' N
42° 10' N
42° 20' N
42° 30' N
42° 40' N
0 5 10 15 20
kilom eters
Param eter: S ilicateSam pling D epth: SurfaceLast Survey D ay: 2 /2 /99Sam pling Event: W F991M in im um Value 1.15 µM at F02M axim um Value 15.81 µM at F23C ontour In terval =2 µM
0.54
0.571.27
0.01
5.980.43
1.35
0.89
2.85
1.29
2.57
5.41
3.211.15
2.51
1.80
0.26
0.85
3.00
4.85
0.32
1.21
0.200.480.48
1.29
0.25
3.250.15
0.40
0.24
0.90
9.03
0.300.30
0.44
0.80
2.76
1.541.40
4.883.773.77
5.10
1.12
3.57
0.14
0.80
0.72
0.16
1 3 5 7 9 11 13 17
71° 00' W 70° 50' W 70° 40' W 70° 30' W 70° 20' W 70° 10' W
41° 50' N
42° 00' N
42° 10' N
42° 20' N
42° 30' N
42° 40' N
0 5 10 15 20
kilom eters
Param eter: S ilicateSam pling D epth: SurfaceLast Survey D ay: 8 /18/98Sam pling Event: W F98BM in im um Value 0.01 µM at N 03M axim um Value 9.03 µM at F30C ontour In terval =2 µM

OMSAP Public MeetingSeptember 1999
Water Quality Horizontal GradientsSurface Chlorophyll
0.55
7.50 0.59
1.7711.79
1.000.09
13.03
6.404.24
1.27
1.0810.56
11.99
0.03
0.25
0.41
3.781.04
0.20
0.09
2.60
7.54
3.81
5.955.95
0.54
0.670.67
5.10
9.00
0.19
2.232.23
0.34
4.660.05
0.14
1.86
2.27
0.46
0.83
5.63
3.15
1.58
0.66
1 3 5 7 9 11 15
71° 00' W 70° 50' W 70° 40' W 70° 30' W 70° 20' W 70° 10' W
41° 50' N
42° 00' N
42° 10' N
42° 20' N
42° 30' N
42° 40' N
0 5 10 15 20
kilom eters
Param eter: F luorescenceSam pling D epth: SurfaceLast Survey D ay: 8 /25/98Sam pling Event: W F98BM in im um Value 0.03 µg/L at N 04M axim um Value 13.03 µg/L at N 11C ontour In terval =2 µg/L
0.02
0.11
0.25
0.88
0.91
1.051.10
1.66
1.88
2.79
2.94 3.11
3.20
3.293.64
4.054.27
4.39
4.55
4.61
4.62
4.76
4.79
5.24
5.245.26
5.81
6.48
7.06
8.35
13.46
1 3 5 7 9 11 15
71° 00' W 70° 50' W 70° 40' W 70° 30' W 70° 20' W 70° 10' W
41° 50' N
42° 00' N
42° 10' N
42° 20' N
42° 30' N
42° 40' N
0 5 10 15 20
kilom eters
Param eter: F luorescenceSam pling D epth: SurfaceLast Survey D ay: 2 /2 /99Sam pling Event: W F991M in im um Value 0.02 µg/L at F13M axim um Value 13.46 µg/L at F27C ontour In terval =2 µg/L

OMSAP Public MeetingSeptember 1999
Water Quality Horizontal GradientsBottom Dissolved Oxygen
9.56
10.199.51
9.59
8.2110.22
9.31
8.48
8.999.29
9.19
8.43
9.449.44
9.30
10.06
8.55
10.83
9.19
9.34
7.95
9.76
8.61
9.04
8.15
9.43
8.90
8.35
8.57
9.47
8.41
8.01
8.279.27
9.93
10.1710.17
9.31
7.29
9.309.519.51
8.228.81
9.77
8.31
8.44
8.45
10.378.81
5 6 7 8 9 10 11 12 13
71° 00' W 70° 50' W 70° 40' W 70° 30' W 70° 20' W 70° 10' W
41° 50' N
42° 00' N
42° 10' N
42° 20' N
42° 30' N
42° 40' N
0 5 10 15 20
kilom eters
Param eter: In S itu D issolved O xygenSam pling D epth: BottomLast Survey D ay: 8 /18/98Sam pling Event: W F98BM in im um Value 7.29 m g/L at F02M axim um Value 10.83 m g/L at F03C ontour In terval =1 m g/L
9.32
9.329.37
9.479.49
9.57
9.77
9.78
9.81
9.839.95
9.9510.07 10.09
10.18
10.30
10.41
10.4510.60
10.80
10.81
10.81
10.82
10.86
10.91
10.95
10.95
10.96
11.02
11.03
11.05
11.06
11.13
11.14
11.1511.15
11.20
11.23
11.3011.31
12.05
5 6 7 8 9 10 11 12 13
71° 00' W 70° 50' W 70° 40' W 70° 30' W 70° 20' W 70° 10' W
41° 50' N
42° 00' N
42° 10' N
42° 20' N
42° 30' N
42° 40' N
0 5 10 15 20
kilom eters
Param eter: In S itu D issolved O xygenSam pling D epth: BottomLast Survey D ay: 2 /2 /99Sam pling Event: W F991M in im um Value 9.32 m g/L at N 07M axim um Value 12.05 m g/L at N 10C ontour In terval =1 m g/L
OMSAP Public MeetingSeptember 1999
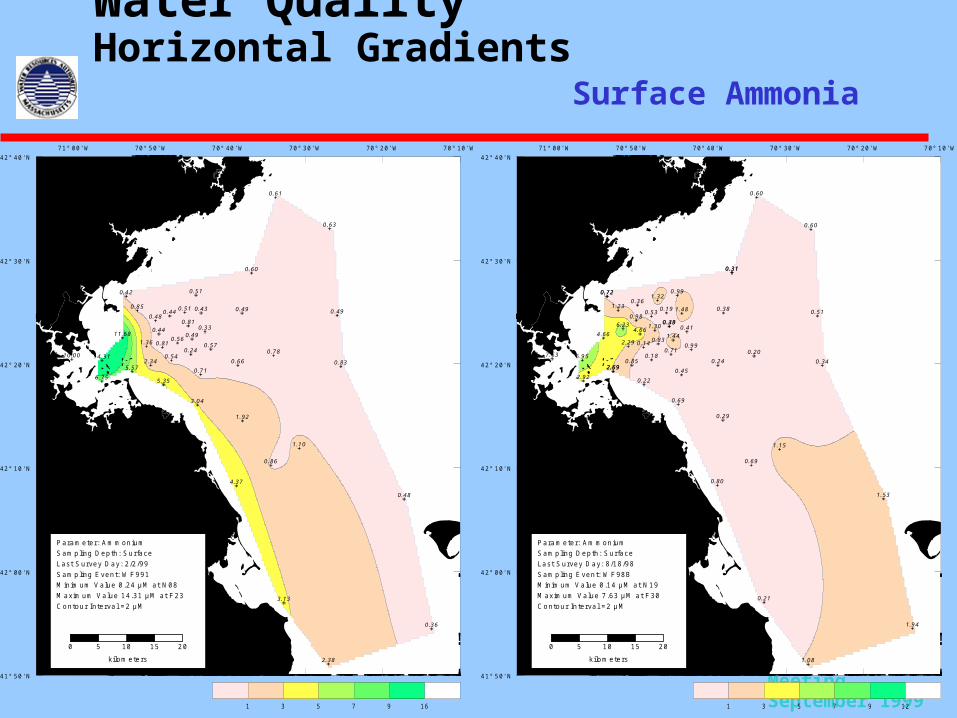
Water Quality Horizontal GradientsSurface Ammonia
0.24
0.33
0.36
0.42
0.430.44
0.44
0.48
0.48
0.49
0.49 0.490.51
0.51
0.54
0.560.57
0.60
0.61
0.63
0.660.71
0.780.81
0.81
0.83
0.85
0.86
1.10
1.36
1.92
2.34
2.38
3.04
3.13
4.37
5.35
5.576.75
10.00
11.68
14.31
1 3 5 7 9 16
71° 00' W 70° 50' W 70° 40' W 70° 30' W 70° 20' W 70° 10' W
41° 50' N
42° 00' N
42° 10' N
42° 20' N
42° 30' N
42° 40' N
0 5 10 15 20
kilom eters
Param eter: Am m oniumSam pling D epth: SurfaceLast Survey D ay: 2 /2 /99Sam pling Event: W F991M in im um Value 0.24 µM at N 08M axim um Value 14.31 µM at F23C ontour In terval =2 µM
0.21
1.440.41
1.32
6.950.20
0.80
0.38
0.85
1.48
0.99
1.23
0.450.24
0.69
0.83
0.19
0.49
0.53
4.66
0.29
1.30
0.990.720.72
0.22
0.34
6.230.98
0.18
0.51
1.53
7.63
0.310.31
0.38
0.69
4.66
2.290.71
2.922.692.69
0.60
1.08
1.94
0.36
1.15
0.14
0.60
1 3 5 7 9 12
71° 00' W 70° 50' W 70° 40' W 70° 30' W 70° 20' W 70° 10' W
41° 50' N
42° 00' N
42° 10' N
42° 20' N
42° 30' N
42° 40' N
0 5 10 15 20
kilom eters
Param eter: Am m oniumSam pling D epth: SurfaceLast Survey D ay: 8 /18/98Sam pling Event: W F98BM in im um Value 0.14 µM at N 19M axim um Value 7.63 µM at F30C ontour In terval =2 µM

OMSAP Public MeetingSeptember 1999
Water Quality Harbor Gradient after Secondary Treatment - NH4
(a) Ammonium North Harbor
0
5
10
15
20
25
30
Jan-95 Jul-95 Jan-96 Jul-96 Jan-97 Jul-97 Jan-98 Jul-98 Jan-99
NH
4 (
M)
Station 142
Station F23

OMSAP Public MeetingSeptember 1999
Water Quality Harbor Gradient after secondary treatment - NH4
(b) Ammonium South Harbor
0
5
10
15
20
25
30
Jan-95 Jul-95 Jan-96 Jul-96 Jan-97 Jul-97 Jan-98 Jul-98 Jan-99
NH
4 (
M)
Station 141
Station F31
OMSAP Public MeetingSeptember 1999
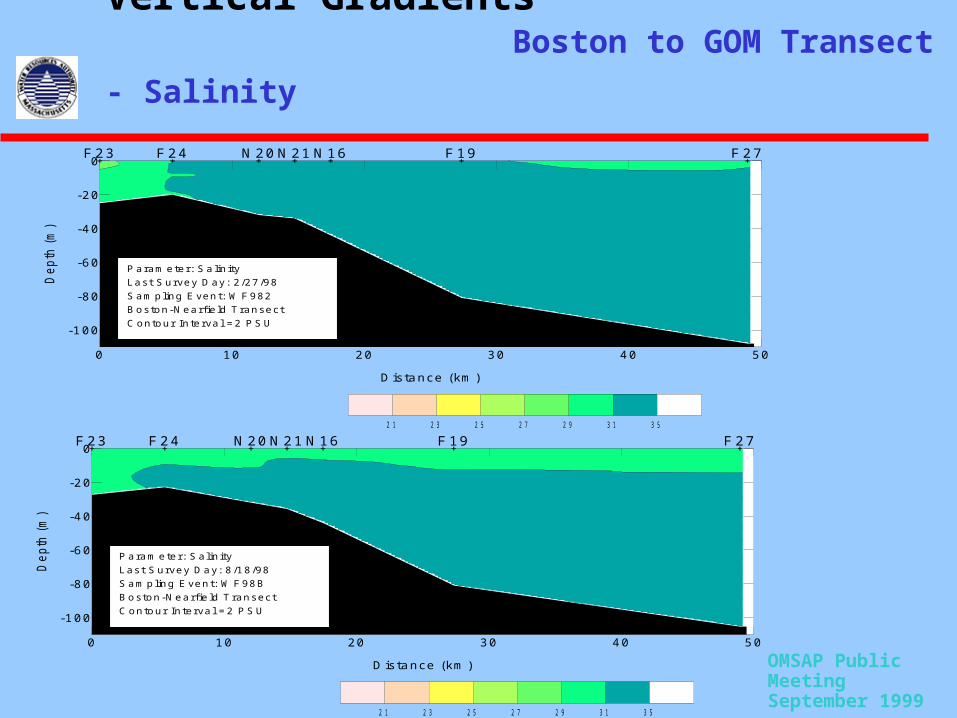
Water Quality Vertical Gradients Boston to GOM Transect - Salinity
0 10 20 30 40 50
D istance (km )
-100
-80
-60
-40
-20
0
Dep
th (
m)
F23 F24 N 20 N 21 N 16 F19 F27
2 1 2 3 2 5 2 7 2 9 3 1 3 5
Param eter: Salin ityLast Survey D ay: 8 /18/98Sam pling Event: W F98BBoston-N earfie ld T ransectC ontour In terva l =2 PSU
0 10 20 30 40 50
D istance (km )
-100
-80
-60
-40
-20
0
Dep
th (
m)
F23 F24 N 20 N 21 N 16 F19 F27
2 1 2 3 2 5 2 7 2 9 3 1 3 5
Param eter: Salin ityLast Survey D ay: 2 /27/98Sam pling Event: W F982Boston-N earfie ld T ransectC ontour In terva l =2 PSU

OMSAP Public MeetingSeptember 1999
Water Quality Vertical Gradients Boston to GOM Transect - Temperature
0 10 20 30 40 50
D istance (km )
-100
-80
-60
-40
-20
0
Dep
th (
m)
F23 F24 N 20 N 21 N 16 F19 F27
3 5 7 9 11 13 15 21
Param eter: Tem peratureLast Survey D ay: 8 /25/98Sam pling Event: W F98BBoston-N earfie ld T ransectC ontour In terva l =2 C
0 10 20 30 40 50
D istance (km )
-100
-80
-60
-40
-20
0
Dep
th (
m)
F23 F24 N 20 N 21 N 16 F19 F27
3 5 7 9 11 13 15 19
Param eter: Tem peratureLast Survey D ay: 2 /27/98Sam pling Event: W F982Boston-N earfie ld T ransectC ontour In terva l =2 C

OMSAP Public MeetingSeptember 1999
Water Quality Vertical Gradients Boston to GOM Transect - DIN
0 10 20 30 40 50
D istance (km )
-100
-80
-60
-40
-20
0
Dep
th (
m)
F23 F24 N 20 N 21 N 16 F19 F27
1 3 5 7 9 11 13 19
Param eter: N o3+no2+nh4Last Survey D ay: 2/27/98Sam pling Event: W F982Boston-N earfie ld T ransectC ontour In terval =2 µM
0 10 20 30 40 50
D istance (km )
-100
-80
-60
-40
-20
0
Dep
th (
m)
F23 F24 N 20 N 21 N 16 F19 F27
1 3 5 7 9 11 13 26
Param eter: N o3+no2+nh4Last Survey D ay: 8 /18/98Sam pling Event: W F98BBoston-N earfie ld T ransectC ontour In terva l =2 µM

OMSAP Public MeetingSeptember 1999
Water Quality Vertical Gradients Boston to GOM Transect - Silicate
0 10 20 30 40 50
D istance (km )
-100
-80
-60
-40
-20
0
Dep
th (
m)
F23 F24 N 20 N 21 N 16 F19 F27
1 3 5 7 9 11 13 25
Param eter: S ilicateLast Survey D ay: 2 /27/98Sam pling Event: W F982Boston-N earfie ld T ransectC ontour In terva l =2 µM
0 10 20 30 40 50
D istance (km )
-100
-80
-60
-40
-20
0
Dep
th (
m)
F23 F24 N 20 N 21 N 16 F19 F27
1 3 5 7 9 11 13 19
Param eter: S ilicateLast Survey D ay: 8 /18/98Sam pling Event: W F98BBoston-N earfie ld T ransectC ontour In terva l =2 µM
OMSAP Public MeetingSeptember 1999
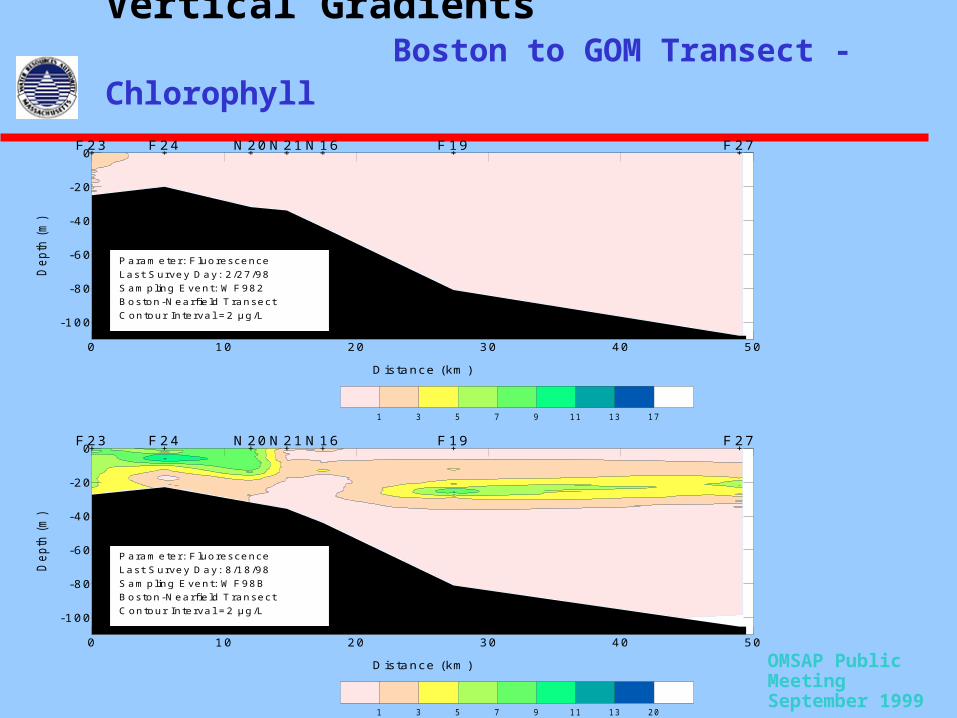
Water Quality Vertical GradientsBoston to GOM Transect - Chlorophyll
0 10 20 30 40 50
D istance (km )
-100
-80
-60
-40
-20
0
Dep
th (
m)
F23 F24 N 20 N 21 N 16 F19 F27
1 3 5 7 9 11 13 17
Param eter: F luorescenceLast Survey D ay: 2 /27/98Sam pling Event: W F982Boston-N earfie ld T ransectC ontour In terva l =2 µg/L
0 10 20 30 40 50
D istance (km )
-100
-80
-60
-40
-20
0
Dep
th (
m)
F23 F24 N 20 N 21 N 16 F19 F27
1 3 5 7 9 11 13 20
Param eter: F luorescenceLast Survey D ay: 8 /18/98Sam pling Event: W F98BBoston-N earfie ld T ransectC ontour In terva l =2 µg/L

OMSAP Public MeetingSeptember 1999
Water Quality Vertical Gradients Boston to GOM Transect - Dissolved Oxygen
0 10 20 30 40 50
D istance (km )
-100
-80
-60
-40
-20
0
Dep
th (
m)
F23 F24 N 20 N 21 N 16 F19 F27
5 6 7 8 9 10 11 12 14
Param eter: In S itu D issolved O xygenLast Survey D ay: 2 /27/98Sam pling Event: W F982Boston-N earfie ld T ransectC ontour In terva l =1 m g/L
0 10 20 30 40 50
D istance (km )
-100
-80
-60
-40
-20
0
Dep
th (
m)
F23 F24 N 20 N 21 N 16 F19 F27
5 6 7 8 9 10 11 12 14
Param eter: In S itu D issolved O xygenLast Survey D ay: 8 /18/98Sam pling Event: W F98BBoston-N earfie ld T ransectC ontour In terva l =1 m g/L

OMSAP Public MeetingSeptember 1999
Water Quality Summary Vertical & Horizontal Gradients
Water column is well mixed over the winter Increasing temperature and runoff in early
spring initiates stratification Spring/summer temperature differences
intensify stratification Stratification remains until fall overturn (due to
lower vertical temp gradient and increased storm activity)
Return to winter conditions in early winter
OMSAP Public MeetingSeptember 1999
Water Quality Summary Vertical &Horizontal Gradients
Boston Harbor is localized source of nutrients• Sewage effluent comprises 90% of the land source
nutrients added to Boston Harbor (Kelly 1997) Strong inshore/offshore nutrient gradient away
from Harbor in surface waters Gradients are less distinct in the bottom waters Seasonal nutrients cycle (stratification) Upwelling and winds may be a factor in bringing
nutrients to surface waters in the summer

OMSAP Public MeetingSeptember 1999
Water Quality Harbor/Nearfield Exchange
A strong physical front is evident off the mouth of Boston Harbor
Front analysis

OMSAP Public MeetingSeptember 1999
Water Quality Harbor/Nearfield Exchange
outfall
outfall

OMSAP Public MeetingSeptember 1999
Water Quality Harbor/Nearfield Exchange

OMSAP Public MeetingSeptember 1999
Water Quality Harbor/Nearfield Exchange From Kelly 1997
0.6 - 0.8 N2
6.6 TN(4.5 DIN)
0.2 TN 1.7 DIN
23-25 TN(11-12 DIN)
~15 TN(5.2-6.6 DIN)
<0.6 - 0.8 N2
0.8 TN
<0.2 TN <1.7 DIN
12-16 TN(2.5-3.9 DIN)
Baseline Period Post-Discharge Period
85% of the nutrients from the Deer Island outfall are currently exported into Massachusetts Bay
100% of the nutrients from the Deer Island outfall will be exported into Massachusetts Bay in the future
Units are in 105 kmols/yr
Freshwater
Ocean exchange
Ocean exchange dominates the nutrients mass balance in Boston Harbor

OMSAP Public MeetingSeptember 1999
Water Quality Summary Harbor Exchange
Effluent from Deer Island outfall presently enters Massachusetts Bay
Exchange of Boston Harbor waters with nearfield and coastal waters results in a plume of Harbor water extending southward along the coast in western Massachusetts Bay
Harbor plume is primarily in the western nearfield surface waters and coastal waters to the south
OMSAP Public MeetingSeptember 1999
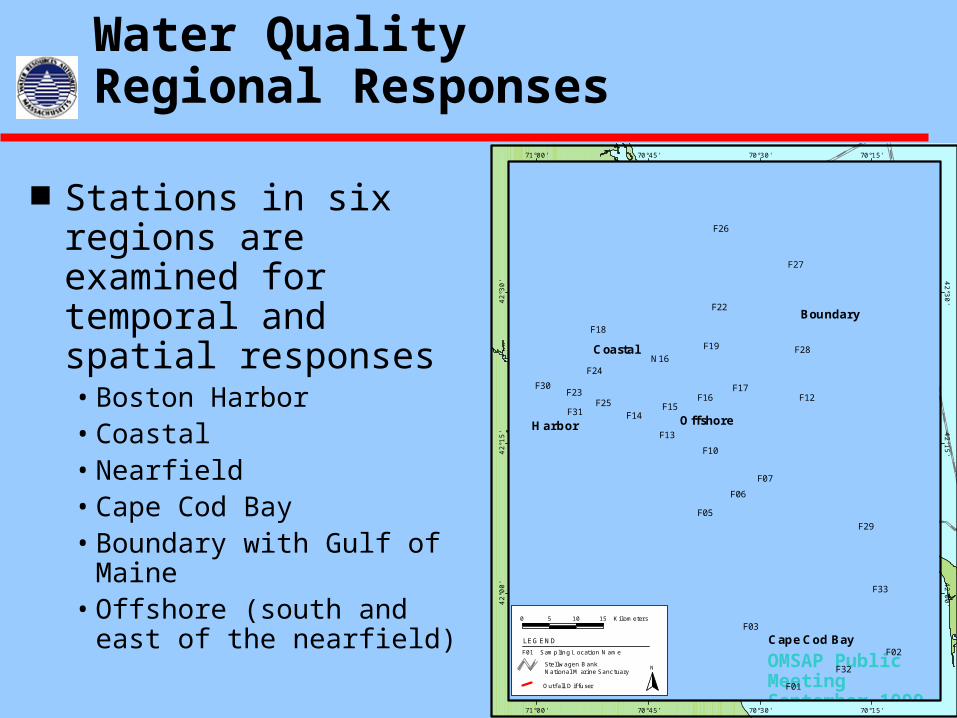
Water Quality Regional Responses
Stations in six regions are examined for temporal and spatial responses• Boston Harbor • Coastal • Nearfield • Cape Cod Bay• Boundary with Gulf of Maine• Offshore (south and east of the
nearfield)
F01
F02
F03
F05
F06
F07
F10
F12
F13
F14F15
F16F17
F18
F19
F22
F23
F24
F25
F26
F27
F28
F29
F30
F31
F32
F33
N16
Harbor
Cape Cod Bay
Offshore
Boundary
Coastal
42°0
0'
42°00'
42°1
5'
42°15'
42°3
0'
42°30'
71°00'
71°00'
70°45'
70°45'
70°30'
70°30'
70°15'
70°15'
0 5 10 15 Kilometers
F01 Sampling Location Name
Outfall Diffuser
Stellwagen Bank National Marine Sanctuary
LEGEND
N

OMSAP Public MeetingSeptember 1999
Water Quality Chlorophyll
An indicator of phytoplankton biomass Key measurement and indicator in the water quality program
Temporal and regional distribution are variable Responds to light and nutrient fields (see Keller et al. Poster)
• Summer surface water nutrient limitation• Winter light limitation • Influenced by weather and storm events
Results in a generally consistent seasonal progression
Maximum values are in the pycnocline during stratification and in the waters of the western nearfield and outer Boston Harbor

OMSAP Public MeetingSeptember 1999
Water Quality Chlorophyll Distribution
Seasonal peaks are observed in the spring, summer, and fall Classic winter/spring bloom does not always occur Frequently observe a major fall boom Large sustained bloom occurred in the winter/spring of 1999 following a
late winter bloom in December 1998
0.0
1.0
2.0
3.0
4.0
5.0
6.0
7.0
8.0
9.0
10.0
1992 1993 1994 1995 1996 1997 1998 1999 2000
Ch
loro
ph
yll
(g
/L)
Asterionellopsis glacialis
Phaeocystis pouchetii
Phaeocystis pouchetii

OMSAP Public MeetingSeptember 1999
Water Quality Nearfield Chlorophyll - Fall Blooms
1995
0
2
4
6
8
10
Jan Feb Mar Apr May Jun Jul Aug Sep Oct Nov DecCh
loro
ph
yll
(g
/L)
1998
0
2
4
6
8
10
Jan Feb Mar Apr May Jun Jul Aug Sep Oct Nov DecCh
loro
ph
yll
(g
/L)
1993
0
2
4
6
8
10
Jan Feb Mar Apr May Jun Jul Aug Sep Oct Nov DecCh
loro
ph
yll
(g
/L)

OMSAP Public MeetingSeptember 1999
Water Quality Nearfield Chlorophyll - Spring Blooms
0
2
4
6
8
10
Jan Feb Mar Apr May Jun Jul Aug Sep Oct Nov DecCh
loro
ph
yll
(g
/L)
1992
0
2
4
6
8
10
Jan Feb Mar Apr May Jun Jul Aug Sep Oct Nov DecCh
loro
ph
yll
(g
/L)
1994
0
2
4
6
8
10
Jan Feb Mar Apr May Jun Jul Aug Sep Oct Nov DecCh
loro
ph
yll
(g
/L)
1996

OMSAP Public MeetingSeptember 1999
Water Quality Nearfield Chlorophyll Winter Bloom 1998-1999
Nearfield Chlorophyll 1998 - 1999
0
2
4
6
8
10
May Jun Jul Aug Sep Oct Nov Dec Jan Feb Mar Apr MayCh
loro
ph
yll
(g
/L)
Satellite imagery suggests chlorophyll levels in the surface waters of Massachusetts
Bay remained elevated between mid-Dec 1998 and early February 1999

OMSAP Public MeetingSeptember 1999
Water Quality Annual Chlorophyll Data
COMPARISON OF ANNUAL MEAN CHLORPHYLL DATAYear Mean
mg/LSTDmg/L
n Detectablechange mg/L
1992 2.02 1.65 1,203 0.271993 2.28 2.91 1,669 0.731994 1.94 1.49 1,658 0.191995 1.43 2.34 1,358 0.521996 1.54 1.90 1,247 0.361997 1.06 1.64 1.262 0.271998 1.81 2.69 1,396 0.681999 In progress
Baseline mean1992-1998
1.73 0.41 7 0.23
Thresholds1992-1998
Caution (1.5 times baseline mean) = 2.60 mg/LWarning (2.0 times baseline mean) = 3.45 mg/L
OMSAP Public MeetingSeptember 1999
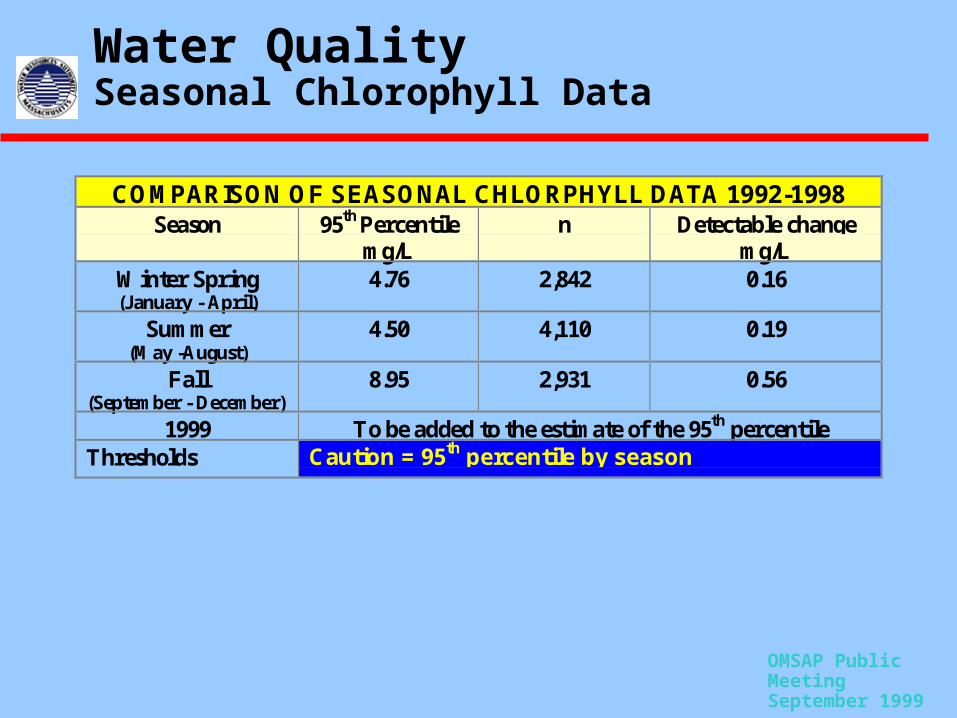
Water Quality Seasonal Chlorophyll Data
COMPARISON OF SEASONAL CHLORPHYLL DATA 1992-1998Season 95th Percentile
mg/Ln Detectable change
mg/LWinter Spring(January - April)
4.76 2,842 0.16
Summer(May -August)
4.50 4,110 0.19
Fall(September - December)
8.95 2,931 0.56
1999 To be added to the estimate of the 95th percentileThresholds Caution = 95th percentile by season

OMSAP Public MeetingSeptember 1999
Water Quality Chlorophyll Summary
Spring bloom not as consistent as conventional wisdom would suggest
Fall bloom appears to be a consistent event having occurred in 5 of 7 years Elevated summer concentrations observed
in Nearfield (98 & 99)

OMSAP Public MeetingSeptember 1999
Water Quality Dissolved Oxygen
Degradation of particulate organic matter (POM)• water column• deposited POM in sediments
Other factors• duration and strength of stratification• bottom water temperature• initial DO concentration at onset stratification• downwelling/intrusion events
Many factors affect dissolved oxygen levels in the water
OMSAP Public MeetingSeptember 1999
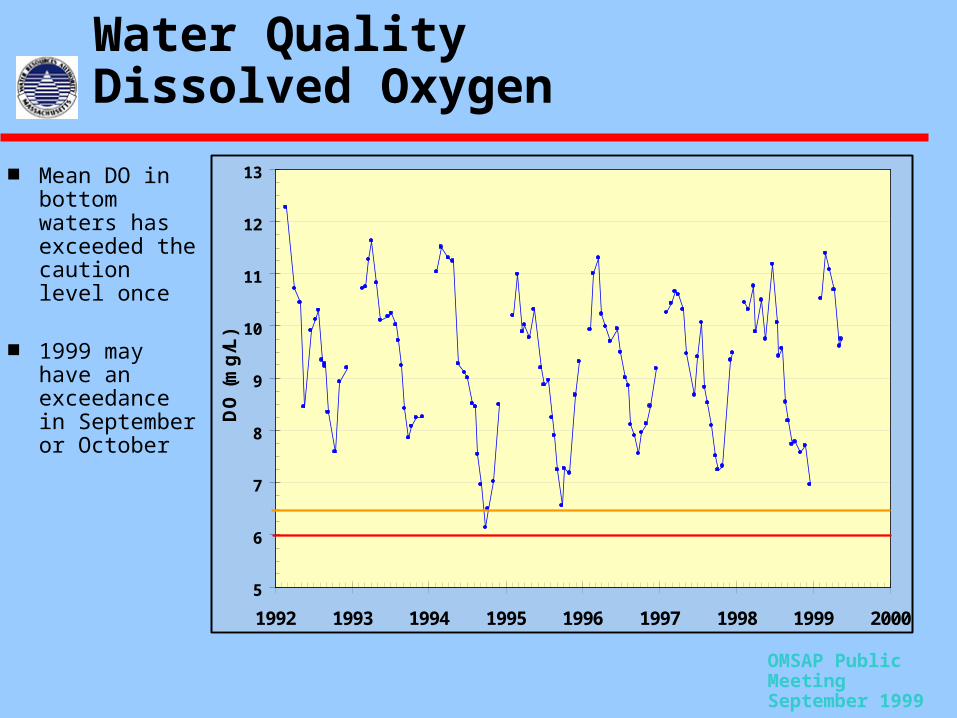
Water Quality Dissolved Oxygen
Mean DO in bottom waters has exceeded the caution level once
1999 may have an exceedance in September or October
5
6
7
8
9
10
11
12
13
1992 1993 1994 1995 1996 1997 1998 1999 2000
DO
(m
g/L
)

OMSAP Public MeetingSeptember 1999
Water Quality Nearfield Bottom Water DO Distribution September 8,1999
Nearfield DO Thresholds (as a survey mean)• Caution = 6.5 mg/L• Warning = 6.0 mg/L
Survey Mean• 6.66 mg/L
Western Nearfield DO <6.0 mg/L
Eastern Nearfield DO >7.0 mg/L
6.81
7 .11
6.46
6.13
7.48
5.97
7.15
6.83
7.22
5 .94
6 .02
6.24
7 .58
6 .52
5.59
6 .43
7.53
5.99
7.45
6.83
5.7 6.0 6.3 6.6 6.9 7.2 7.5 7.8 7.9
70° 52' W 70° 50' W 70° 48' W 70° 46' W 70° 44' W 70° 42' W
42° 20' N
42° 22' N
42° 24' N
42° 26' N
0 1 2 3 4
kilom eters
Param eter: In S itu D isso lved O xygenSam pling D epth: BottomLast Survey D ay: 9 /8 /99Sam pling Event: W N 99CM inim um Value 5.59 m g/L at N 11M axim um Value 7.58 m g/L at N 06C ontour In terva l =0.3 m g/L

OMSAP Public MeetingSeptember 1999
Water Quality Nearfield Surface and Bottom Water DO Distribution September 8,1999
Surface DO shows a maximum in the western nearfield Note contour interval change from the bottom DO image in the
pervious slide to place both images on the same color scale
9.14
11.22
9 .27
9.11
10.88
9.63
9 .718.91
12.17
9 .95
9 .33
8.93
8.94
9.53
10.11
10.55
9.13
10.83
7.76
12.3312.32
5 6 7 8 9 10 11 12 13
70° 52' W 70° 50' W 70° 48' W 70° 46' W 70° 44' W 70° 42' W
42° 20' N
42° 22' N
42° 24' N
42° 26' N
0 1 2 3 4
kilom eters
Param eter: In S itu D issolved O xygenSam pling D epth: SurfaceLast Survey D ay: 9 /8/99Sam pling Event: W N 99CM inim um Value 7.76 m g/L at N 10M axim um Value 12.33 m g/L at N 19C ontour In terva l =1 m g/L
Surface
6.81
7 .11
6.46
6.13
7.48
5.97
7.15
6.83
7.22
5 .94
6 .02
6.24
7 .58
6 .52
5.59
6 .43
7.53
5.99
7.45
6.83
5 6 7 8 9 10 11 12 13
70° 52' W 70° 50' W 70° 48' W 70° 46' W 70° 44' W 70° 42' W
42° 20' N
42° 22' N
42° 24' N
42° 26' N
0 1 2 3 4
kilom eters
Param eter: In S itu D issolved O xygenSam pling D epth: BottomLast Survey D ay: 9 /8/99Sam pling Event: W N 99CM inim um Value 5.59 m g/L at N 11M axim um Value 7.58 m g/L at N 06C ontour In terva l =1 m g/L
Bottom
OMSAP Public MeetingSeptember 1999
Water Quality Seasonal DO Decline Nearfield
5
6
7
8
9
10
11
12
Jun Jul Aug Sep Oct Nov
Dis
solv
ed O
xyge
n (m
g/L
)
1992
1993
1994
1995
1996
1997
1998
Linear(1998)Linear(1997)Linear(1996)Linear(1995)Linear(1994)Linear(1992)Linear(1993)
1992
1993
1995
1994
199619971998
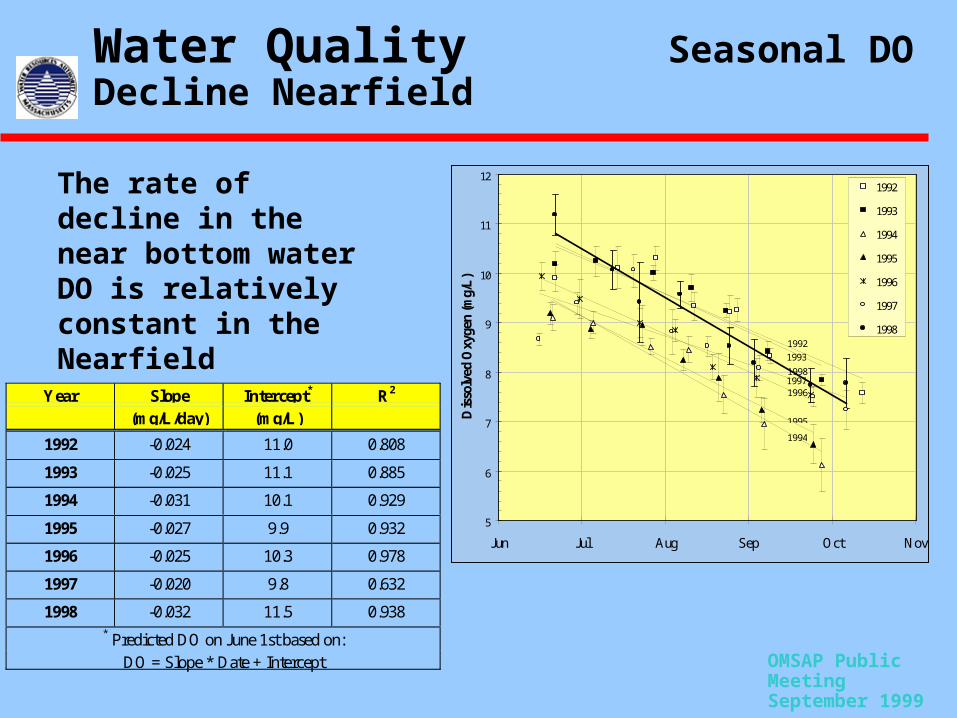
Year Slope Intercept* R2
(mg/L/day) (mg/L)
1992 -0.024 11.0 0.808
1993 -0.025 11.1 0.885
1994 -0.031 10.1 0.929
1995 -0.027 9.9 0.932
1996 -0.025 10.3 0.978
1997 -0.020 9.8 0.632
1998 -0.032 11.5 0.938* Predicted DO on June 1st based on:
DO = Slope * Date + Intercept
The rate of decline in the near bottom water DO is relatively constant in the Nearfield

OMSAP Public MeetingSeptember 1999
Water Quality Seasonal DO Decline Stellwagen Basin
6
7
8
9
10
11
12
Jun Jul Aug Sep Oct
Dis
solv
ed O
xyge
n (m
g/L
)
1992
1993
1994
1995
1996
1997
1998
Linear(1998)Linear(1996)Linear(1997)Linear(1995)
1
1
1
1
The rate of decline in the near bottom DO in Stellwagen Basin during stratification is also relatively constant
Year Slope Intercept*
(mg/L/day) (mg/L)
1992 -0.023 10.7
1993 -0.023 10.9
1994 -0.021 9.6
1995 -0.017 8.9
1996 -0.014 9.4
1997 -0.012 9.0
1998 -0.028 11.6* Predicted DO on June 1st based on:
DO = Slope * Date + Intercept

OMSAP Public MeetingSeptember 1999
Water Quality Seasonal DO Decline Nearfield
Annual Oxygen Minimum: Nearfield & Stellwagen, 1992-98
6
6.5
7
7.5
8
6 6.5 7 7.5 8
Nearfield Annual Minimum DO (mg/L)
Ste
llwa
ge
n B
as
in M
inim
um
DO
(m
g/L
)1994
1995
1998
1997
1992
1996
1993
SB = (0.777*NF) + 1.745 R2 = 0.96
The correspondence between the minimum DO in the Nearfield and in Stellwagen Basin provides a reasonable predictor of the DO in Stellwagen Basin bottom waters
OMSAP Public MeetingSeptember 1999
Water Quality Baseline Characteristics
Gradients (Nutrients, biomass, and dissolved oxygen)• Temporal • Offshore • Vertical
Tidal exchange and export from Boston Harbor Plankton Communities
• Phytoplankton• Zooplankton

OMSAP Public MeetingSeptember 1999
Water Quality Plankton Species
Phytoplankton• Abundance by species or group• Key taxa
– Diatomsa– Microflagelates– Dinoflagelates– Cryptomonad– Nuisance species
- Alexandrium tamerenses - Phaeocystis pouchetii - Pseudo-nitzschia multiseries
Zooplankton/Meroplankton• Abundance by species, group
or stage (adult, copepodite, nauplii)
• Key taxa – Acartia spp.– Oithona spp.– Calanus spp.– Pseudocalanus spp. – Centropages spp.– Polychaete spp. – Mollusca Gastropoda; Bivalvia – Pteropoda spp. – Opisthobranchia spp. – Cirripedia spp

OMSAP Public MeetingSeptember 1999
Water Quality Phytoplankton Variability
Phytoplankton abundance in the nearfield generally ranges between a few thousand to 2 million cells/ L
Abundance can range to over 12 million cells/L
Range for individual samples can be large for any given survey
Reflects variability between surface and pycnocline samples
Total Phytoplankton Abundance - Nearfield
0
2
4
6
8
10
12
14
J M S J M S J M S J M S J M S J M S J M S J M S J
10
6 Ce
lls/L
1992 1993 1994 1995 1996 1997 1998 1999

OMSAP Public MeetingSeptember 1999
Water Quality Total Phytoplankton Inter-annual and Regional Comparison
Phytoplankton abundance in the farfield areas is generally similar to the nearfield
Occasionally abundance in CCB and the Harbor are larger on average than in the nearfield
Abundance at the boundary Station F27 are lower on occasion
Seasonal patterns are variable although late summer and fall peaks are frequent
Total Phytoplankton Abundance - Area Mean
0
1
2
3
4
5
6
7
8
9
10
J M S J M S J M S J M S J M S J M S J M S J M S J
10
6 Ce
lls/L
Boundary Nearfield Harbor Cape Cod Bay Coastal
1992 1993 1994 1995 1996 1997 1998 1999

OMSAP Public MeetingSeptember 1999
Water Quality Diatoms Diatom abundance
in the nearfield generally ranges between a few thousand to 1 million cells/ L
Occasionally abundance can range to over 12 million cells/L
Range reflects within survey variability
Seasonal patterns are variable and no one year exactly replicates another
Total Diatoms Abundance - Nearfield
0.00
2.00
4.00
6.00
8.00
10.00
12.00
14.00
J M S J M S J M S J M S J M S J M S J M S J M S J
10
6 Ce
lls/L
1992 1993 1994 1995 1996 1997 1998 1999

OMSAP Public MeetingSeptember 1999
Water Quality Diatoms Diatom abundance
in the farfield areas is generally similar to the nearfield
Abundances in CCB range higher and lower than in the nearfield and the timing of blooms is often different than the nearfield
Abundance at the boundary Station F27 are lower
Coastal stations and Harbor abundance are often similar
Total Diatoms Abundance - Area Mean
0
1
2
3
4
5
6
J M S J M S J M S J M S J M S J M S J M S J M S J
106 C
ell
s/L
Boundary Nearfield Harbor Cape Cod Bay Coastal
1992 1993 1994 1995 1996 1997 1998 1999
Seasonal diatom abundance is clearly evident but varies in magnitude and timing
OMSAP Public MeetingSeptember 1999
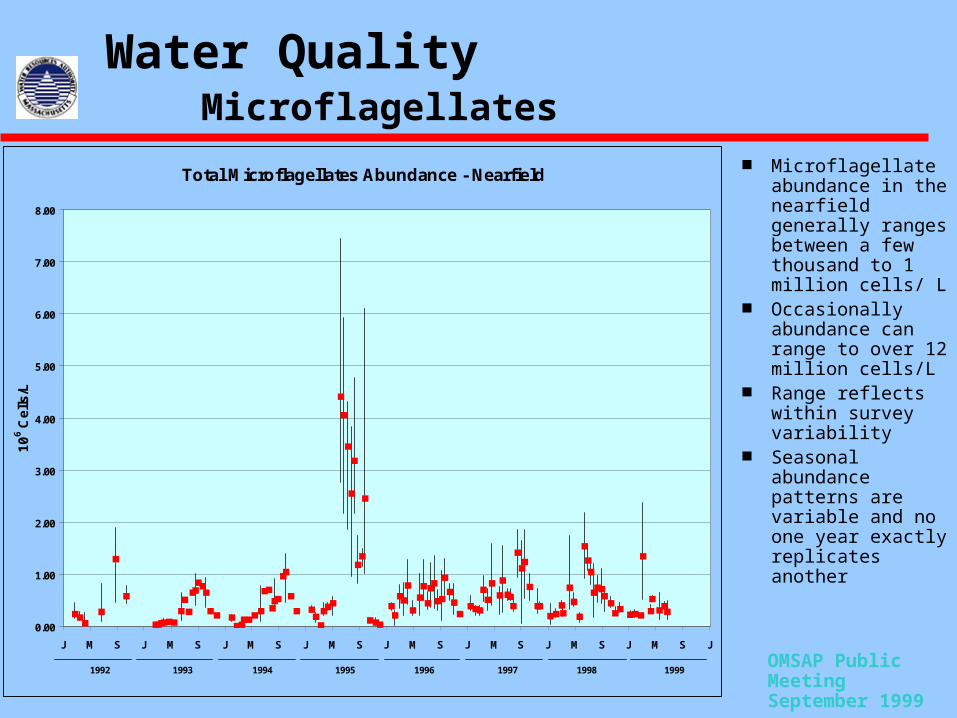
Water Quality Microflagellates Microflagellate
abundance in the nearfield generally ranges between a few thousand to 1 million cells/ L
Occasionally abundance can range to over 12 million cells/L
Range reflects within survey variability
Seasonal abundance patterns are variable and no one year exactly replicates another
Total Microflagellates Abundance - Nearfield
0.00
1.00
2.00
3.00
4.00
5.00
6.00
7.00
8.00
J M S J M S J M S J M S J M S J M S J M S J M S J
10
6 Ce
lls/L
1992 1993 1994 1995 1996 1997 1998 1999

OMSAP Public MeetingSeptember 1999
Water Quality Microflagellates
Abundance in the farfield areas is very similar to the nearfield
Abundances in CCB and Harbor are occasionally higher than in the nearfield and the timing of blooms is often different
Seasonal abundance is clearly evident and peaks in the late summer
Total Microflagellate Abundance - Area Mean
0.00
1.00
2.00
3.00
4.00
5.00
6.00
J M S J M S J M S J M S J M S J M S J M S J M S J
10
6 Ce
lls/L
Boundary Nearfield Harbor Cape Cod Bay Coastal
1992 1993 1994 1995 1996 1997 1998 1999

OMSAP Public MeetingSeptember 1999
Water Quality Phytoplankton Community Composition
% Diatoms and % Microflagellates in Total Phytoplankton Abundance
0
10
20
30
40
50
60
70
80
90
100
J M S J M S J M S J M S J M S J M S J M S J M S J
(%)
% Microflagelates % Diatoms
1992 1993 1994 1995 1996 1997 1998 1999

OMSAP Public MeetingSeptember 1999
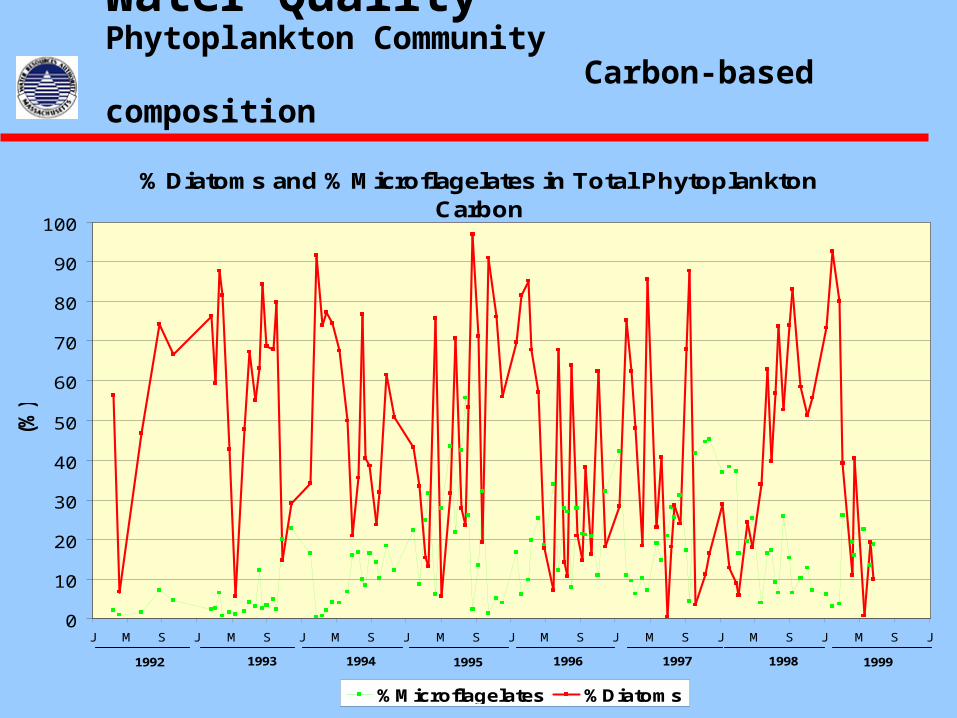
Water Quality Phytoplankton Community Carbon-based composition
Concerns over carbon cycling and outfall effects on the major taxa in the Bay have resulted in comparison of the phytoplankton community abundance on a carbon basis
Each species is assigned a carbon per cell value and the carbon-based abundance is calculated from abundance and carbon value
The total phytoplankton carbon in the sample is then calculated by summing the various species
Data presentations are developed as shown for the cell abundance data
Focus is on the relative proportions of diatiom carbon and microflagellate carbon

OMSAP Public MeetingSeptember 1999
Water Quality Phytoplankton Community Carbon-based composition
Patterns in total carbon based abundance are similar to the cell based abundance
Survey means show distinct temporal patterns
Within survey and sample variability is high .
Total Phytoplankton Carbon - Nearfield
0
500
1,000
1,500
2,000
2,500
J M S J M S J M S J M S J M S J M S J M S J M S J
106 p
g C
/L
1992 1993 1994 1995 1996 1997 1998 1999

OMSAP Public MeetingSeptember 1999
Phytoplankton Carbon - Area Mean
0
200
400
600
800
1,000
1,200
1,400
J M S J M S J M S J M S J M S J M S J M S J M S J
106p
gC
/L
Boundary Nearfield Harbor Cape Cod Bay Coastal
1992 1993 1994 1995 1996 1997 1998 1999
Water Quality Phytoplankton Community Carbon-based composition
OMSAP Public MeetingSeptember 1999
Water Quality Phytoplankton Community Carbon-based composition
% Diatoms and % Microflagelates in Total Phytoplankton Carbon
0
10
20
30
40
50
60
70
80
90
100
J M S J M S J M S J M S J M S J M S J M S J M S J
(%)
%Microflagelates %Diatoms
1992 1993 1994 1995 1996 1997 1998 1999

OMSAP Public MeetingSeptember 1999
Water Quality Phytoplankton Community Nuisance Species
COMPARISON OF SEASONAL NUISANCE SPECIES DATA1992-1998
Species 95th Percentilecells/L
n Baselinecondition
Alexandrium tamerensesWinter-Spring: 0.27Summer: 5.00Fall: 0.97
474420262
Non zero countsin 31 of 1,156samples
Phaeocystis pouchetii Winter-Spring: 0.961Summer: 0.0004Fall: 0 028
528421262
Non zero countsin 93 of 1,122samples
Pseudo-nitzschiamultiseries a
Seasonal (Winter-Spring,Summer, Fall) meanconcentration of confirmedspecies exceed 500,000 cells/L
Pseudo-nitzschiapungens Nonzero counts in438 of 1,122samples
1999 To be added to the estimate of the 95th percentilea Pseudo-nitzschia pungens counts will trigger a SEM confirmation of P. multiseries

OMSAP Public MeetingSeptember 1999
Water Quality Phytoplankton Community Summary
Species composition is generally similar among samples from within surveys and among regions
Total abundance varies among samples, survey, season, and regions Distinct temporal patterns are evident, although variability within surveys is high Diatoms and microflagellates are the numerically dominant plankton groups Carbon-based abundance is dominated by diatoms Nuisance species are present sporadically and at low levels Blooms of Phaeocystis pouchetii have occurred twice during the baseline, once
in the spring of the year and once in the fall of the year Alexandrium tamerenses blooms have not occurred since 1993 (see Keefer and
Anderson poster) although species are occasionally observed in low abundance Massachusetts Bay communities are consistent with broader-scale zooplankton
distributions in the Gulf of Maine and Buzzards Bay (see Turner poster)

OMSAP Public MeetingSeptember 1999
Water Quality Zooplankton Variability
Zooplankton abundance in the nearfield ranges between a few thousand to 100,000 individuals/ L
Occasionally abundance can range to 150K individuals/L
The range among individual samples is large for any give survey
Total abundance appears increase since 1994
Total Zooplankton Abundance - Nearfield
0
20,000
40,000
60,000
80,000
100,000
120,000
140,000
160,000
180,000
J M S J M S J M S J M S J M S J M S J M S J M S J
Ind
ivid
ua
ls/m
3
1992 1993 1994 1995 1996 1997 1998 1999

OMSAP Public MeetingSeptember 1999
Water Quality Total Zooplankton Inter-annual and Regional Comparison
Total zooplankton abundance in the farfield regions are generally similar to the nearfield
Total abundance is often lower in Boston Harbor relative to Massachusetts Bay
The general increase in nearfield total abundance since 1994 is reflected in the other offshore regions
Total Zooplankton Abundance - Area Mean
0
50,000
100,000
150,000
200,000
250,000
J M S J M S J M S J M S J M S J M S J M S J M S J
Ind
ivid
ua
ls/m
3
Boundary Nearfield Harbor Cape Cod Bay Coastal
1992 1993 1994 1995 1996 1997 1998 1999
OMSAP Public MeetingSeptember 1999
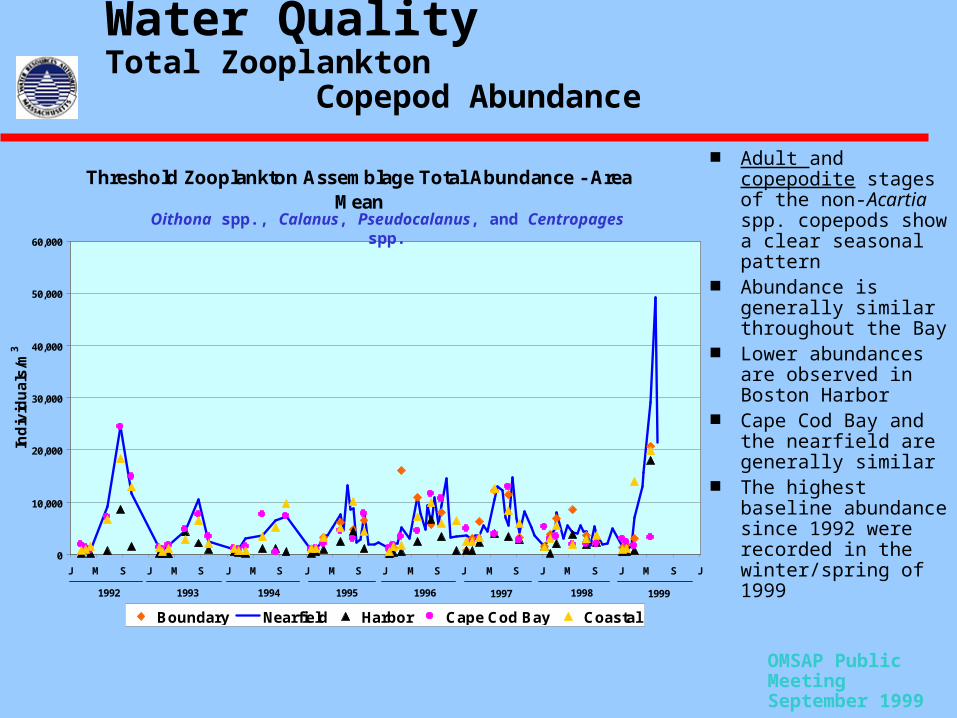
Water Quality Total Zooplankton Copepod Abundance
Adult and copepodite stages of the non-Acartia spp. copepods show a clear seasonal pattern
Abundance is generally similar throughout the Bay
Lower abundances are observed in Boston Harbor
Cape Cod Bay and the nearfield are generally similar
The highest baseline abundance since 1992 were recorded in the winter/spring of 1999
Threshold Zooplankton Assemblage Total Abundance - Area Mean
0
10,000
20,000
30,000
40,000
50,000
60,000
J M S J M S J M S J M S J M S J M S J M S J M S J
Ind
ivid
ua
ls/m
3
Boundary Nearfield Harbor Cape Cod Bay Coastal
1992 1993 1994 1995 1996 1997 1998 1999
Oithona spp., Calanus, Pseudocalanus, and Centropages spp.

OMSAP Public MeetingSeptember 1999
Water Quality Total Zooplankton Meroplankton Abundance
Meroplankton form minor component of the zooplankton community
The Harbor, CCB, and Coastal abundance in the winter spring of 1999 were the highest observed during the baseline
Meroplankton Abundance - Area Mean
0
20,000
40,000
60,000
80,000
100,000
120,000
140,000
160,000
180,000
J M S J M S J M S J M S J M S J M S J M S J M S J
Ind
ivid
ua
ls/m
3
Boundary Nearfield Harbor Cape Cod Bay Coastal
1992 1993 1994 1995 1996 1997 1998 1999
Polychaete spp.; Gastropoda; mollusca, bivalvia spp.; Cirripedia spp

OMSAP Public MeetingSeptember 1999
Water Quality Acartia spp. Abundance
Acartia spp. abundance is higher in the Harbor compared to the nearfield
Seasonal patterns (summer maximum) in the Harbor abundance are evident
Acartia Abundance
0
2,000
4,000
6,000
8,000
10,000
12,000
14,000
J M S J M S J M S J M S J M S J M S J M S J M S J
Ind
ivid
ua
ls/m
3
Nearfield Area Mean Harbor Area Mean1992 1993 1994 1995 1996 1997 1998 1999

OMSAP Public MeetingSeptember 1999
Water Quality Draft Zooplankton Threshold
WINTER-SPRING MEAN THRESHOLD ZOOPLANKTON ABUNDANCE INTHE NEARFEILD BY YEAR
Year N Mean Minimum STD Maximum
1992 18 3,888 1,270 1,892 7,6261993 18 3,543 1,280 1,971 8,0371994 18 3,802 1,391 2,252 9,9561995 10 5,553 1,503 3,623 11,7241996 11 6,754 1,088 4,674 14,8751997 12 8,718 3,434 3,376 14,4141998 11 10,917 211 6,860 20,5131999 11 24,244 17 55,381 184,913
Draft threshold based on the 5th percentile of the baseline means = 3,453 individuals/LBased on the sum of the adult and copepodite stages of two Oithona species, Calanus,Pseudocalanus, and Centropagestypicus

OMSAP Public MeetingSeptember 1999
Water Quality Zooplankton Community Summary
Community composition among samples from a survey, within seasons, or among farfield regions are generally similar
Abundance varies among samples, survey, season, and regions
Although variability within surveys is high distinct temporal patterns are evident in the data
Massachusetts Bay communities are consistent with broader scale zooplankton distributions in the Gulf of Maine and Buzzards Bay (see Turner poster)

OMSAP Public MeetingSeptember 1999
Water Quality Baseline Monitoring Summary
Baseline data indicate that water parameters are highly variable in the nearfield (esp. western nearfield)
Seasonal and inter-annual variability Inshore/offshore gradients in nutrients, chlorophyll, and DO Plankton populations are similar offshore; Harbor differences
are event relative to offshore populations and abundance Plankton respond in a relatively predictable manner in this
system Ability of the monitoring program to detect change before any
given threshold is reached is high

OMSAP Public MeetingSeptember 1999
Expectations of changes in water quality after transfer to Massachusetts Bay
Harbor Response• Nutrients field in the outer Harbor will decrease in
concentration and extent• Chlorophyll levels will decrease in the Harbor and
western nearfield • Abundance of offshore zooplankton in the outer
Harbor may increase if salinity increases• Phytoplankton species composition remain similar to
those present now
Because the new outfall relocates the current discharge to a deeper depth that is generally below the photic zone and will achieve much higher dilution than is currently achieved at the Deer Island outfall, the net ecological impact is likely to be small and limited to the nearfield.

OMSAP Public MeetingSeptember 1999
Expectations of changes in water quality after transfer to Massachusetts Bay
Massachusetts Bay Response• total nutrient fields are not expected to change appreciably in the
vicinity of the outfall, although a nutrient signal against a lower offshore background especially for NH4 may be observed
– Plume tracking and nearfield monitoring will evaluate this • Coastal plume will be less distinct and less intense• Chlorophyll levels will decrease in surface waters of the western
nearfield • Little or no change in the zooplankton community composition or
abundance • Phytoplankton species composition will see little or no change• Bottom water DO values are not expected to change substantially
relative to the current baseline history