
omparative Analysis of International Offshore Wind Energy...
156
Comparative Analysis of International Offshore Wind Energy Development REWIND OFFSHORE March 2017
Transcript of omparative Analysis of International Offshore Wind Energy...

Comparative Analysis of International Offshore Wind Energy Development
R E W I N D O F F S H O R E
March 2017

A B O U T T H E I E A R E T D T E C H N O L O G Y C O L L A B O R AT I O N
P R O G R A M M E
The IEA Renewable Energy Technology Deployment Technology Collaboration Programme (IEA RETD TCP) provides
a platform for enhancing international cooperation on policies, measures and market instruments to accelerate the
global deployment of renewable energy technologies.
IEA RETD TCP aims to empower policy makers and energy market actors to make informed decisions by: (1) providing
innovative policy options; (2) disseminating best practices related to policy measures and market instruments to
increase deployment of renewable energy, and (3) increasing awareness of the short-, medium- and long-term
impacts of renewable energy action and inaction.
For further information please visit: http://iea-retd.org or contact [email protected].
Twitter: @IEA_RETD
IEA RETD TCP is part of the IEA Energy Technology Network.
D I S C L A I M E R
The IEA RETD TCP, formally known as the Technology Collaboration Programme for Renewable Energy Technology
Deployment and formerly known as the Implementing Agreement for Renewable Energy Technology Deployment
(IEA-RETD), functions within a Framework created by the International Energy Agency (IEA). Views, findings and
publications of IEA RETD TCP do not necessarily represent the views or policies of the IEA Secretariat or of its
individual Member Countries.
C O P Y R I G H T
This publication should be cited as:
IEA RETD TCP (2017), Comparative Analysis of International Offshore Wind Energy Development (REWind Offshore),
IEA Renewable Energy Technology Deployment Technology Collaboration Programme (IEA RETD TCP), Utrecht, 2017.
Copyright © IEA RETD TCP 2017
(Stichting Foundation Renewable Energy Technology Deployment)

A U T H O R S
Lead Authors:
The Carbon Trust is an independent, expert partner that works with public and
private section organizations around the world, helping them to accelerate the
move to a sustainable, low carbon economy. We advise corporates and
governments on carbon emissions reduction, improving resource efficiency,
and technology innovation. We have world-leading experience in the
development of low carbon energy markets, including offshore wind.
The Carbon Trust has been at the forefront of the offshore wind industry
globally for the past decade, working closely with governments, developers,
suppliers, and innovators to reduce the cost of offshore wind energy through
informing policy, supporting business decision-making, and commercialising
innovative technology.
Rhodri James, Manager, The Carbon Trust
Guy Henley, Associate, The Carbon Trust
Mott MacDonald is a global engineering, management and development
consultancy focused on guiding our clients through many of the planet’s most
intricate challenges.
Our expertise by sector includes buildings, communications, defence,
education, environment, health, industry, mining, oil and gas, power, transport,
urban development, water, wastewater and more. Our skills encompass
planning, studies and design, project finance, technical advisory services,
project and programme management, management consultancy and beyond.
Stefanie Hintze, Wind Team Lead, Mott MacDonald
Andrew Conway, Senior Regulatory Consultant, Mott MacDonald
Contributing Author:
Green Giraffe is a specialist advisory boutique focused on the renewable
energy sector - and in particular offshore wind - launched in 2010 by
experienced finance specialists.
Jérôme Guillet, Managing Director, Green Giraffe

A C K N O W L E D G E M E N T S
The Authors would like to thank the IEA RETD TCP REWind Offshore Project Steering Group (PSG) members,
interview partners, and supporting colleagues.
Project Steering Group
Sarina Keller German Aerospace Centre (DLR), Germany
Ignacio Marti ORE Catapult, United Kingdom
Stephan Barth ForWind – Center for Wind Energy Research, Germany
Sakina Mouhamad Ministry of the Environment, Energy and Sea, France
Jonathan Brady Natural Resources Canada, Canada
Thorsten Falk Federal Ministry for Economic Affairs and Energy, Germany
Yasushi Ninomiya Institute of Energy Economics, Japan
David de Jager IEA-RETD TCP, Operating Agent, Ecofys
Kristian Petrick IEA-RETD TCP, Operating Agent, All Green Energies
Coraline Bucquet IEA-RETD TCP, Operating Agent, Ecofys
Interview Partners and supporting colleagues
● BSH (Bundesamt für Seeschifffahrt und
Hydrographie, Germany)
● C-Power
● Deepwater Wind
● DONG Energy
● Green Investment Bank
● Greenpower
● innogy
● Macquarie
● Netherlands Enterprise Agency (RVO.nl)
● Niras Consulting
● RenewableUK
● RUG (University of Groningen)
● Seaway Heavy Lifting
● Senvion
● Statkraft
● Stiftung Offshore
● TenneT, Germany
● TenneT, Netherlands
● The Crown Estate
● TKI Wind op Zee
● Vattenfall
● WindEurope

REWIND OFFSHORE: Comparative Analysis of International Offshore Wind Energy Development, March 2017
C O N T E N T S
Executive Summary ................................................................................................................................. i
1 Introduction .................................................................................................................................. 1
1.1 Offshore Wind: Industry Overview ........................................................................................... 1
1.2 Report Outline ........................................................................................................................... 2
1.3 Approach ................................................................................................................................... 2
2 Offshore Wind: State of the Industry ........................................................................................... 3
2.1 Why offshore wind? .................................................................................................................. 3
2.2 Deployment trends ................................................................................................................... 4
2.3 Technology trends ..................................................................................................................... 6
2.4 Cost trends ................................................................................................................................ 8
3 Policy & Regulation ....................................................................................................................... 11
3.1 Market scale and visibility ......................................................................................................... 12
3.1.1 Policy tools ......................................................................................................................... 12
3.1.2 Lessons learned ................................................................................................................. 16
3.2 Site development ...................................................................................................................... 19
3.2.1 Policy tools ......................................................................................................................... 19
3.2.2 Site identification and leasing ............................................................................................ 22
3.2.3 Site surveys ........................................................................................................................ 26
3.2.4 Consenting and permitting ................................................................................................ 27
3.2.5 Lessons learned ................................................................................................................. 29
3.3 Grid policy ................................................................................................................................. 32
3.3.1 Policy tools ......................................................................................................................... 33
3.3.2 Lessons learned ................................................................................................................. 43
3.4 Incentive mechanisms ............................................................................................................... 45
3.4.1 Evolution with market maturity ......................................................................................... 45
3.4.2 Policy tools ......................................................................................................................... 47
3.4.3 Lessons learned ................................................................................................................. 53
3.5 Supply chain development ........................................................................................................ 60
3.5.1 Offshore wind supply chain ............................................................................................... 60
3.5.2 Policy tools ......................................................................................................................... 61
3.5.3 Lessons learned ................................................................................................................. 63
3.6 Innovation support.................................................................................................................... 67
3.6.1 Technology commercialisation .......................................................................................... 67
3.6.2 Policy tools ......................................................................................................................... 69
3.6.3 Lessons learned ................................................................................................................. 71
4 Industry Structures ....................................................................................................................... 74
4.1 Project developers .................................................................................................................... 75
4.1.1 Key players ......................................................................................................................... 76
4.1.2 Success of developer models ............................................................................................. 81
4.1.3 Recent trends in the developer models ............................................................................. 84
4.2 Investor and finance community .............................................................................................. 85
4.2.1 Key players ......................................................................................................................... 85
4.2.2 Key trends .......................................................................................................................... 86
4.3 Supply Chain .............................................................................................................................. 87
4.3.1 WTG Suppliers .................................................................................................................... 88

REWIND OFFSHORE: Comparative Analysis of International Offshore Wind Energy Development, March 2017
4.3.2 Foundation suppliers ......................................................................................................... 91
4.3.3 Cable suppliers ................................................................................................................... 92
4.3.4 Installation contractors ...................................................................................................... 93
4.3.5 Geographical location of industry sectors ......................................................................... 94
4.4 Comparative analysis of national industries ............................................................................. 95
4.4.1 Overview ............................................................................................................................ 95
4.4.2 United Kingdom ................................................................................................................. 95
4.4.3 Germany ............................................................................................................................ 96
4.4.4 The Netherlands ................................................................................................................ 96
4.4.5 Industry structure in emerging markets ............................................................................ 97
4.5 Lessons Learned ........................................................................................................................ 98
5 Project Risk Management ............................................................................................................. 100
5.1 Project lifecycle risks ................................................................................................................. 101
5.2 Developer risk mitigation tools ................................................................................................. 103
5.3 Developer risk mitigation strategies ......................................................................................... 104
5.3.1 Allocation and development risks ..................................................................................... 104
5.3.2 Funding risks ...................................................................................................................... 108
5.3.3 Construction risks .............................................................................................................. 108
5.3.4 Operational risks ................................................................................................................ 115
5.4 Trends in developer risk profiles and drivers ............................................................................ 119
5.5 Lessons learned ......................................................................................................................... 121
6 Synthesis, Conclusions, and Recommendations ........................................................................... 122
6.1 State of the Industry ................................................................................................................. 122
6.2 Policy & Regulation ................................................................................................................... 124
6.3 Industry Structures.................................................................................................................... 130
6.4 Project Risk Management ......................................................................................................... 133
6.5 Recommendations for Policy Makers ........................................................................................ 136
6.6 Recommendations for Industry Players .................................................................................... 137
Bibliography ............................................................................................................................................. 138
Appendix .................................................................................................................................................. 142
Methodology ........................................................................................................................................ 142
REWIND OFFSHORE: Comparative Analysis of International Offshore Wind Energy Development, March 2017
i
E X EC U T I V E S U M M A RY
THE OFFSHORE WIND SUCCESS STORY
Offshore wind power is on the cusp of exponential growth, with installed capacity set to nearly triple in the period
from 2015 to 20201. This growth is being accompanied by marked cost reduction, with recent auction tenders
suggesting that costs have fallen by 60% compared to 2010 levels, already surpassing industry cost targets for 2025,
eight years ahead of schedule. The cost reduction is a signal of the industry’s growing maturity, with high levels of
competition across a robust industry structure.
Furthermore, having been pioneered in a small handful of European countries, offshore wind is set to expand
geographically, with considerable market growth forecast both within and outside Europe, particularly in East Asia
and North America. There are important lessons that can be learned and transferred between maturing and
emerging markets. This report, commissioned by the IEA-RETD, presents a comparative analysis of approaches to
offshore wind development internationally. It has identified a series of key lessons learned across three primary
focus areas: government policy & regulation (Section 3); the development of industry structures (Section 4); and
the risk management strategies adopted by offshore wind developers (Section 5).
A MATURING OFFSHORE WIND SECTOR
A thriving offshore wind sector requires involvement from a broad range and type of organisations, from developers
to various suppliers, contractors, financiers, and regulators. The strength of this industry structure is vital to the
successful delivery of offshore wind projects and achieving long-term cost reduction. Supportive policy frameworks
in Europe have enabled the development of a robust industry structure which has evolved over the past decade.
Following initial periods of market innovation, adaptation, and stabilisation, the European offshore wind sector is
set to enter a period of maturation, with increasing competition from a large number of established industry players.
Indications of market maturation include:
● Steep cost reduction evident in several European countries.
● Several European markets have become commoditised, with financial investors, commonwealth funds and
pension funds now investing in operating assets, allowing utilities to recycle capital to new projects.
● Perceived risks from the investor and finance community have been reduced due to growing confidence in the
ability of developers and the supply chain.
● Project margins have reduced over the last five years due to increased confidence in the industry and perceived
reduction of residual risk levels.
● Consolidation of industry developers, particularly in the UK where significant exits have left fewer players in the
market.
However, while the European market may be demonstrating signs of maturity, emerging markets outside Europe
are at a much earlier stage, with far more nascent industry structures. Furthermore, while the European market has
benefitted from clustering around the North Sea region, which has a rich background in offshore engineering and
maritime sector activities, more isolated emerging markets are expected to encounter greater challenges. Lower
cumulative market size and a lack of established suppliers are therefore likely to require greater government
intervention to reduce investor risk and kick-start the offshore wind industry. Nevertheless, the expansion of several
key European players to East Asia and North America is a sign of increased confidence in these markets.
1 Installed capacity of 12.2 GW in 2015 (GWEC, 2016) is set to increase to 36.2 GW by 2020 (Carbon Trust analysis of project pipelines, central scenario).

REWIND OFFSHORE: Comparative Analysis of International Offshore Wind Energy Development, March 2017
ii
SIX PILLARS OF EFFECTIVE OFFSHORE WIND POLICY
The cost reduction achieved in recent years can to a large extent be attributed to supportive policy frameworks in
several European countries, which have catalysed growth and nurtured the development of a robust industry
structure. Successful regulatory frameworks adopt holistic support policies across six key pillars (Figure 1).
Figure 1. Six pillars of effective offshore wind policy
Policies within these pillars have evolved over time, with greater government intervention in the industry’s
formative years to de-risk private sector investment, before transitioning to more market-based mechanisms as the
sector has matured. Policies have also evolved to transfer best practice between regimes and in response to local
conditions. This evolution is highlighted by two emergent policy trends:
1. Competitive auctions: With offshore wind maturing as an energy technology and with increasing pressure to
drive down costs, incentive mechanisms have evolved from grants and fixed remuneration support to
competitive auctions in several countries (e.g. Denmark, Germany, Netherlands, UK). Recent auction tenders
suggest that this approach has been effective in delivering steep cost reduction, but capacity constrained
auctions have also increased price and allocation risk for developers.
2. Centralised development models: To balance increasing price and allocation risk for developers from capacity
constrained auctions, as well as to manage onshore grid constraints, several governments are taking on greater
up-front risk in the development stage. Development de-risking activities, such as obtaining consent,
undertaking site investigations, and securing grid permits, can limit the risk exposure for prospective developers
who would otherwise need to invest considerable sums undertaking such activities themselves without any
guarantee of ultimately succeeding. As a consequence, there has been a shift from typical open door approaches
to centralised site-specific tendering, often with the provision of offshore transmission assets (e.g. Denmark, the
Netherlands, and Germany).
CHANGING RISK PROFILES FOR DEVELOPERS
Whilst the overall risk levels for offshore wind are decreasing, the policy trends noted above are impacting on the
perceived risk profile for developers. Namely, the transition to competitive auctions has led to an increase in
allocation and price risk, particularly in markets with decentralised development models, such as the UK, where
developers must take on the risk and cost of site development. The move to centralised development models is an
effort to combat this, but allocation risk remains high and also introduces reduced opportunities to develop a
portfolio of projects. Greater government control can also create risks of inefficiency for some developers who
prefer to have greater control of site development and grid asset construction and operation. Nevertheless,
government site de-risking activities are generally considered both desirable and necessary in competitive auction
systems.
REWIND OFFSHORE: Comparative Analysis of International Offshore Wind Energy Development, March 2017
iii
While certain risks are increasing, the growing maturity of the industry is seeing a reduction in other areas. The
transition to centralised auctions is reducing development risks, while greater track record and experience with
increasing cumulative capacity, together with a strengthened industry structure, is reducing technical risks, both in
construction and operational phases. This, in turn, is resulting in greater trust within the investment community,
attracting a more diverse range of funders, including conventionally risk averse investment banks and pension funds.
However, more challenging site conditions, larger equipment requirements and larger projects, combined with
increasing cost pressures, present future challenges. Supportive government policies and strengthened industry
collaboration will therefore be needed to mitigate these risks and continue delivering cost reduction across
established and emerging markets.
RECOMMENDATIONS FOR POLICY MAKERS
Analysis of the evolution of offshore wind policies has revealed several important lessons with regard to best
practice approaches for stimulating deployment and reducing costs.
Governments should re-evaluate their offshore wind ambitions in light of accelerated cost reduction:
Offshore wind is entering a maturation phase which has already seen costs fall dramatically in early tender rounds.
With further cost reduction anticipated, offshore wind could potentially be fully integrated into the market on a
competitive basis in some European countries within the next decade2. In light of this development, governments
should re-evaluate their energy strategies to consider raising ambitions for future deployment.
Governments should consider implementing near-term roadmaps to hedge against long-term
uncertainty: Long-term visibility is a common request from industry players, but does not always align with short
term political cycles. As a compromise, near-term roadmaps – tied to suitable support mechanisms – can provide
the necessary certainty and stability to increase market confidence. This approach has been particularly effective
in the Netherlands, with Germany set to adopt a similar approach.
Competitive auctions can drive down costs, but should be accompanied by government de-risking
activities: The transition to competitive auctions has been hugely effective in delivering steep cost reduction.
However, in order to achieve future cost reduction governments are likely to need to mitigate increased allocation
and price risk by undertaking site development activities to de-risk investments from developers. Undertaking
spatial planning and constraint mapping to identify sites, making site survey data publically available, and securing
necessary permits can all significantly limit the risk exposure for developers. In countries with established
industries, enabling the extension of existing sites can also unlock lower risk and lower cost means of adding new
capacity.
Policymakers in more isolated emerging markets are still likely to require attractive support
mechanisms and enabling policies to kick-start domestic industries: The progress and cost reduction
achieved in Europe has been partly attributed to clustering and concentrated development around the North Sea
region. For more isolated emerging markets, such as Japan, Taiwan, and the United States, greater public
intervention is expected to be required to de-risk investment and develop the necessary industry structures to
deliver cost-effective offshore wind projects.
2 The Dutch Government expects to hold the first tenders for un-subsidised offshore wind farms by 2026, depending on electricity prices.

REWIND OFFSHORE: Comparative Analysis of International Offshore Wind Energy Development, March 2017
iv
Governments must continue supporting technology innovation to achieve long-term cost reduction:
The cost reduction achieved in recent years has been largely driven by technology innovation. Despite the
considerable progress made to date, policymakers should not step back from efforts to support research and
development activities. Rather, government R&D support should be expanded to develop and de-risk technologies
that will be crucial to achieving long-term cost reduction. This is particularly relevant in relation to developing
larger turbines and associated supporting infrastructure, commercialising floating wind technology to unlock new
markets for offshore wind, and developing technologies to withstand extreme weather conditions in these new
markets.
Regulatory frameworks should encourage industry collaboration and information sharing: Despite the
transition to more competitive market conditions, continued industry collaboration will be vital to accelerating
learning and maximising the impact of both public and private investment. Governments should look to foster
collaborative partnerships, forums, and programmes to overcome common challenges, particularly as the industry
expands to new markets.
RECOMMENDATIONS FOR INDUSTRY PLAYERS
The offshore wind industry has evolved considerably in recent years: the supply chain has developed, developers
have become better at managing risk, and the investment community has greater confidence in the industry as a
whole. The following recommendations are derived from the lessons learned and should be applied by industry
players in established and emerging markets.
Embrace collaboration within the industry to manage developer risks on large-scale projects under
auction regimes: The introduction of auction regimes in Europe has introduced greater allocation risk for
developers. Furthermore, project capacities are growing and with it the capital required and impact of failure of a
single project on a developer’s overall business. Developers have approached these trends through collaboration
and forming of consortia between developers and/or with stakeholders from the supply chain to share risks and
increase the chance of winning bids, as well as maintain a reasonably-sized project pipeline.
Build a strong management team and have fall-back plans in place: Developers’ risks are now well
understood and effective risk mitigation strategies have been identified. To ensure industry lessons learned are
applied and learning is continued, an experienced project management team is pivotal to the success of a project,
as well as robust planning and fall-back plans. Developers should involve independent advisors early in the planning
phase when optimisation of the procurement and execution strategy is feasible and has the potential for large
savings later on in the project.
Build strong relationships with regulators, executing authorities, and third parties: In particular, in
emerging markets, where the regulator has little or no experience with offshore wind, industry should engage early
with regulators, interfacing authorities and third parties to clarify requirements and establish a collaborative and
constructive dialogue. Industry players should participate in stakeholder consultations held by regulators to
mitigate unrealistic requirements or unintended risks being introduced to developers and their funders.
Continue to innovate: European offshore wind tenders awarded in 2016 confirm that developers need to achieve
material cost reductions to what has been seen in the industry to date. Developers cannot solely rely on established
technologies, but need to seek to continue to innovate. This can be achieved through participation in industry R&D
initiatives, collaboration with universities and supply chain or regulator-supported pilot-schemes. Developers
should engage early with potential funders to familiarise them with potential innovations and risks mitigation
strategies.
Engage more with the public to improve the public perception of the offshore wind industry: The public
perceives offshore wind to be less reliable and more expensive than other forms of electricity generation. More
could be done by the industry to improve its public standing by promoting the importance of offshore wind in
maintaining grid stability, the recent gains in cost reductions, and the benefits to local and regional economies.

REWIND OFFSHORE – Comparative Analysis of International Offshore Wind Energy Development, March 2017
1
1 I N T RO D UC TI O N
1 . 1 O F F S H O R E W I N D : I N D U S T R Y O V E R V I E W
Offshore wind has experienced considerable growth over the past 15 years, with global installed capacity increasing
from just 83 MW in 2000 to 14.4 GW in 20163. The vast majority of deployment to date (~87%) has been
concentrated in the European region, where a healthy project pipeline means that growth is expected to continue
over the coming decades, with larger projects using more advanced technologies in an increasingly mature industry,
delivering electricity at lower cost and with greater efficiency. The success of the European offshore wind industry
has inspired increased interest in new geographies, particularly in East Asia and North America, where there are
ambitions to significantly ramp up deployment over the coming years. However, these nascent markets will face
multiple challenges in kick-starting their offshore wind industries, with pressure to achieve low cost of energy,
demonstrate benefits to local companies, and overcome unique technical challenges.
Despite some price volatility in the industry’s formative years, the last 5 years have seen considerable cost reduction
in Europe4, achieved through a combination of technological advances, supply chain maturity and economies of
scale, together with the development of more effective developer and contracting models and more favourable
financing terms from an increasingly diverse range of lenders and investors. The introduction of competitive auctions
in several European markets has been particularly effective in driving down costs further to meet ambitious cost
targets for the industry5.
The growth and cost reduction achieved in Europe has been underpinned by policy and regulatory frameworks
which have incentivised steady deployment and attracted investment to the sector. This policy landscape has been
marked by different approaches in different countries, with contrasting drivers and market conditions resulting in a
mosaic of policy levers being applied. With various inter-dependent factors at play, there are inevitably trade-offs
which policy makers must contend with, particularly in relation to how risk is distributed between government,
consumers, and industry players. While some regimes have successfully struck an optimal balance to catalyse
growth, some European markets have also experienced stalled growth from the introduction of ineffective policies
and the uncertainty created from changes to government policy.
There are considerable lessons that can therefore be learned from European experience which can be transferred
to emerging markets, and vice-versa as these new markets develop. Adoption of best practice policy and regulation
can act as a catalyst to facilitate accelerated growth for these nascent industries, helping countries to avoid some of
the pitfalls that have affected early-mover markets and maximise the efficacy of public spend in achieving strategic
goals.
3 Global Wind Energy Council. 2017. Global Wind Statistics 2016. Available at: http://www.gwec.net/wp-content/uploads/vip/GWEC_PRstats2016_EN_WEB.pdf
4 In the UK, LCOE fell by 32% (£142/MWh to £97/MWh; or equiv. €166/MWh to €144/MWh) from 2010-2016 (CRMF, 2017). Recent auction tenders in Denmark and the Netherlands have achieved strike prices of €50-55/MWh, although this does not include the cost of grid connection or site development.
5 Industry target, depending on project jurisdiction of £100/MWh (UK) or €100/MWh (mainland Europe) by 2020,. Several industry players, including DONG Energy and Siemens, have supported these targets. In the UK, the government has set a capped strike price of £105/MWh (equiv. €123/MWh) in the next auction round (expected in 2017), which will fall steadily to £85/MWh (equiv. €100/MWh) by 2025.

REWIND OFFSHORE – Comparative Analysis of International Offshore Wind Energy Development, March 2017
2
1 . 2 R E P O R T O U T L I N E
This report presents a comparative analysis of offshore wind development internationally. The report takes a
particular focus on different approaches to government policy, the development of industry structures in different
markets, and different developer models and contracting strategies adopted.
An evaluation of the evolution of policy frameworks in leading offshore wind markets is provided, extracting insights
and learnings that are relevant to both mature and emerging markets. In particular, the study aims to assess policy
efficacy through the lens of how risk is assigned to different actors, including government bodies, consumers,
developers, grid operators, and suppliers. In this regard, the report assesses risk distribution through the project
lifecycle, together with how policy frameworks can influence developer risk and the development of industry
structures.
The report is structured as follows:
2. Offshore Wind State of the Industry: Section 2 provides an overview of the state of the industry, including the
drivers for offshore wind development, historic and forward-looking deployment across different markets,
technology trends, and cost reduction achieved and expected over the coming decade.
3. Policy & Regulation: Section 3 includes an analysis of the evolution of regulatory frameworks to understand the
effectiveness, strengths and weaknesses of different systems for the development of offshore wind projects. This
section focuses on policy and risk from the perspective of national governments and its impact on project
developers, with country case studies analysed to extract lessons learned.
4. Industry Structures: Section 4 provides a brief analysis of underlying industry structures to understand minimum
requirements and key success factors. This section focuses on the key players in the offshore wind market and the
formation of industry structures in different markets. Case study markets and market models are highlighted.
5. Project Risk Management: Section 5 includes a focussed analysis of interface and risk management regarding
project development and technical, financial and administrative issues to better comprehend key success factors.
This section focuses on risk from the perspective of project developers and the different developer models seen in
the industry.
6. Recommendations: Section 6 includes conclusions drawn from the key findings. A series of recommendations are
proposed to both policy makers and industry players on how to most effectively support offshore wind development
and accelerate market growth.
It should be acknowledged that the policy approach adopted by different countries will depend on national strategic
goals and local context, and as such the most effective policy measures will vary by market. However, the report
aims to draw conclusions and recommendations on how policy makers can use different levers to achieve national
aims.
1 . 3 A P P R O A C H
The report has been produced as part of a collaborative partnership between the Carbon Trust, Mott MacDonald,
and Green Giraffe, all of whom have leaned on considerable industry expertise from having been at the forefront of
the offshore wind industry over the past decade. Insights have been drawn from a combination of in-house
knowledge and experience, an extensive literature review, and a series of targeted interviews with key industry
stakeholders. A detailed methodology is included in the Appendix.

REWIND OFFSHORE – Comparative Analysis of International Offshore Wind Energy Development, March 2017
3
2 O F FS HO R E W I ND : S TATE O F T HE IND U S TR Y
2 . 1 W H Y O F F S H O R E W I N D ?
Offshore wind is widely considered a key energy technology in a growing number of coastal nations, helping
governments to achieve a number of strategically important national goals; including:
Decarbonisation: Offshore wind is a highly scalable renewable energy technology, capable of generating large
volumes of low carbon electricity. Unlike many onshore-based renewables, offshore wind is less constrained by land
availability, enabling large scale build out to replace existing fossil-based power generation. Offshore wind farms can
also be built quicker than most conventional power sources and at large scale, helping to accelerate the move to a
decarbonised energy system. Offshore wind farms typically generate low carbon power for up to 25 years, with
potential for repowering to extend generation asset lifetime.
Energy security: Large scale electricity generation from offshore wind reduces reliance on overseas energy imports,
including volatile commodities such as gas and oil. An increasingly large share of domestic energy generation also
presents opportunities for a country to become a net exporter of electricity. Offshore wind farms are particularly
well placed to operate as transmission interconnectors, delivering low carbon electricity at closer proximity to
demand centres.
Electricity system benefits: The ability to harness strong and abundant wind resource in offshore locations means
that offshore wind can deliver consistent and predictable power to the grid. Offshore wind farms are able to operate
with average load factors in excess of 40%6, considerably higher than most other renewable electricity sources. This
results in a more consistent supply of electricity which is not constrained to cyclical load periods (i.e. day/night,
tidal). Indeed, offshore wind is generally well aligned with energy consumption, with higher load factors during
winter months when energy consumption is highest7. The difference between on- and off-shore weather patterns
can also enable offshore wind to complement generation from onshore wind farms.
As electricity systems evolve and decarbonise, offshore wind could play an increasingly important role in load
balancing. With an increasing share of electricity exported to the grid from a decentralised and variable energy
sources, greater pressures will be placed on transmission networks. As a highly flexible and predictable source of
generation with high load factors, offshore wind can both limit pressures on the onshore grid network and provide
a tool for grid operators to better balance supply and demand. The predictability and flexibility of offshore wind
means that it is well equipped to provide operating reserve and play a key role in stabilising the system.
Opportunities for greater interconnection, for example across the North Sea, could also aid system balancing.
Costs to consumers: Following several years of technology proving, innovation, and de-risking, offshore wind is now
considered a scalable, proven and maturing technology which offers considerable societal benefits to consumers.
Recent cost reduction monitoring and contract awards suggest that the sector is delivering on its cost reduction
potential, with further reductions expected over the coming decades (see Section 2.4).
Economic growth: With the right policies in place, the development of an offshore wind sector can bring
considerable local economic benefits. Offshore wind creates new business opportunities in the supply chain,
particularly those in synergistic sectors such as onshore wind, oil and gas, and marine engineering. As well as
creating jobs to supply a domestic market, initiatives that stimulate innovation can also boost exports to overseas
markets.
6 WindEurope. 2017. Annual Offshore Statistics 2016. Available at: https://windeurope.org/wp-content/uploads/files/about-wind/statistics/WindEurope-Annual-Offshore-Statistics-2016.pdf. Annual load factors in Europe typically range from 33-43%.
7 London Array achieved an average load factor of 78.9% in Dec 2015. WindPowerOffshore. 2016. London Array breaks offshore production record: http://www.windpoweroffshore.com/article/1378756/london-array-breaks-offshore-production-record

REWIND OFFSHORE – Comparative Analysis of International Offshore Wind Energy Development, March 2017
4
2 . 2 D E P L O Y M E N T T R E N D S
Offshore wind deployment trends have been intimately tied to government policies to first demonstrate and develop
the technology, before steadily ramping up build out across a number of front-runner markets. As of the end of
2016, total installed capacity now stands at 14.4 GW, the vast majority of which (~87%) is concentrated in Europe
(Figure 3). This level of deployment may be considered modest relative to that seen in onshore wind (~472 GW
cumulative installed capacity as of end 20168), but the offshore wind sector is on the cusp of a period of exponential
growth. Under a central deployment scenario, offshore wind installed capacity is expected to almost treble from
2015 levels to ~36 GW by 2020 (Figure 2), with annual installed capacity of ~4-6 GW over this period (Figure 3).
Figure 2. Offshore wind market share
Sources: WindEurope; 4coffshore; Carbon Trust analysis9
The majority of this growth is again expected to be seen in Europe, particularly the UK and Germany, however the
emergence of the People’s Republic of China (hereafter ‘China’) as an offshore wind superpower, in addition to
modest additional capacity in several emerging markets, will see offshore wind become a mainstream energy
technology internationally. Beyond 2020 the pipeline is less clear, but several governments at both national and
regional levels have already outlined commitments and targets for offshore wind deployment, while others have
indicated aspirations to increase investment in the sector.
In addition to the current ‘big six’ leading markets (Figure 2), new emerging markets are expected to increase their
activity in the offshore wind sector, particularly in countries beyond the traditional European stronghold, such as
Japan, Taiwan, South Korea, and the United States. Within Europe, outside the current market leaders, France are
expected to significantly increase deployment from 2020, with several projects announced and commitments for
further build out of both fixed and floating offshore wind. Growth elsewhere in Europe is expected to be modest
under current policy regimes, but several project sites have been identified in new markets, particularly in the Baltic
Sea (e.g. Finland, Poland). The emergence of floating wind technology could also unlock new sites for offshore wind
in deeper waters in the Atlantic and Mediterranean.
8 Global Wind Energy Council. 2017. Global Wind Statistics 2016. Available at: http://www.gwec.net/wp-content/uploads/vip/GWEC_PRstats2016_EN_WEB.pdf
9 Pipeline data is based on a central scenario of deployment, according to probability of project build.

REWIND OFFSHORE – Comparative Analysis of International Offshore Wind Energy Development, March 2017
5
Influence of policy on deployment trends
A closer scrutiny of annual installed capacity (Figure 3) highlights the impact of government policy on offshore wind
deployment. The UK’s position as the world’s leading market can be tied to a supportive regulatory environment
from the early 2000s onwards which included: a capital grants scheme to incentivise early demonstration projects;
introduction of a market-based remuneration systems (Renewables Obligation) with attractive support levels for
offshore wind; and phased leasing rounds, administered by The Crown Estate, which sent a strong market signal for
the UK’s long-term deployment goals. However, a lull in deployment in 2016 can be partly attributed to disruption
and uncertainty caused by Electricity Market Reform in the UK, in which Renewable Obligation Certificates have
been replaced by competitive and capacity-constrained Contracts for Difference.
In Germany, despite ambitious plans to become a leading market for offshore wind, deployment stagnated from
insufficient support levels and a series of major delays to the construction of offshore transmission assets in the
North Sea (see Section 3.3 on Grid policy). However, with these issues now alleviated, offshore wind installed
capacity is increasing sharply as annual installed capacity averages >1 GW from 2015-202010. From 2021 to 2030,
annual installed capacity will be more predictable from the introduction of a centrally coordinated auction system,
which will limit installed capacity to 500 MW per year from 2021-2022, 700 MW per year from 2023-2025, and 850
MW per year from 2026-2030.
A similar approach adopted in the Netherlands will see 700 MW of installed capacity per year for 5 years between
2019 and 2023. The success of the first two auction tender rounds has triggered calls for increased build out within
this period and in the subsequent deployment plan to 2030.
Figure 3. Annual and cumulative offshore wind installed capacity
Sources: 4coffshore; WindEurope; Carbon Trust analysis11
10 It should be noted that the phasing of deployment is expected to vary over financial years, as wind farms come online.
11 Pipeline data is based on a central scenario of deployment, according to probability of project build.

REWIND OFFSHORE – Comparative Analysis of International Offshore Wind Energy Development, March 2017
6
2 . 3 T E C H N O L O G Y T R E N D S
Alongside steadily increasing deployment there have also been major trends in offshore wind technology. The most
notable driver has been the increase in turbine size, with average turbine rating (cumulative) increasing from ~0.6
MW in 2000 to ~3.4 MW in 2016 (Figure 4). In 2016, average turbine rating (annual) reached 4 MW, however
isolating European projects revealed a higher rating of 4.8 MW, driven by several projects using 6 MW turbines. In
less mature markets outside Europe, such as China, turbine rating is typically lower, but expected to increase as the
industries mature and develop the necessary infrastructure for the installation of larger turbines.
Turbine rating is expected to continue increasing up to and beyond 2020, with the introduction of 7-9 MW turbines
in upcoming European projects12. A quadrupling in turbine rating from 2 MW to 8 MW has been accompanied by a
doubling in rotor diameter from 80 metres to 164 metres13 and the fewer assets and supporting infrastructure
required for the same power output has been a major driver of cost reduction in the industry. Although yet to be
announced, it is expected that 10+ MW turbines will soon be available on the market.
Similarly, average project capacity (cumulative) has increased considerably, reaching ~100 MW in 2010 and ~163
MW by 2016, with expectations to reach ~233 MW by 2020. However, these averages include several small scale
demonstration and pilot projects. In mature European markets, individual commercial projects are far larger; for
example, UK projects reaching FID in 2016 had an average project capacity of 586 MW, including the 1.2 GW Hornsea
One project. This increased scale is another important driver of cost reduction across the industry.
Figure 4. Average turbine rating (annual and cumulative)
Sources: 4coffshore; WindEurope; Carbon Trust analysis14
Turbine innovation has acted as a catalyst for technology innovation in the supporting infrastructure for offshore
wind farms. Foundations have had to adapt to supporting larger turbines, as well as move into deeper water and
complex seabed conditions. In addition to the advent of novel foundation designs, such as suction buckets, gravity
base structures, and twisted jackets structures, there has been considerable innovation in pushing the boundaries
of conventional monopile and jacket foundations. For example, having originally been considered limited to ~20
metre water depth, research and development activities to optimise monopile designs means that these remain the
most common foundation choice, capable of supporting large turbines in water depths up to ~35 metres.
12 Siemens 7 MW and 8 MW; MHI-Vestas 8 MW and 9 MW.
13 Reference turbines: Vestas V-80 2 MW; MHI-Vestas V-164.
14 Running average – includes all turbines installed since 1990. Average project capacity limited to wind farm with 10+ turbines.
REWIND OFFSHORE – Comparative Analysis of International Offshore Wind Energy Development, March 2017
7
Higher power output from individual turbines and overall project capacity (Figure 4), combined increasing distance
from shore, has led to considerable innovation in the electrical systems for offshore wind farms. Intra-array cabling
is moving from 33kV to 66kV, which will enable larger turbines to be connected in ring circuits, reducing losses and
increasing redundancy in the case of cable faults. Meanwhile, both HVDC transmission technology and optimised
HVAC transmission technology are enabling wind farms to be located further from shore to access higher wind
speeds without incurring major transmission losses.
Further technology advancements have been seen in installation processes and bespoke installation vessels, access
vessels and crew transfer systems, wind resource measurement, and modelling of wake effects and turbulence in
wind farm arrays. Floating offshore wind is another rapidly emerging technology which could unlock vast areas with
high wind speeds in deep water locations. As the sector continues to grow and mature, further innovation is
expected and will be vital in continuing to reduce costs and expanding offshore wind energy to new markets.

REWIND OFFSHORE – Comparative Analysis of International Offshore Wind Energy Development, March 2017
8
2 . 4 C O S T T R E N D S
Importantly, the deployment and technology trends observed have successfully delivered marked cost reduction.
Despite some initial cost increases from 2005-2010, caused by a combination of fluctuating exchange rates, rising
commodity prices, supply chain bottlenecks, and an under-appreciation of costs in early projects, these volatilities
have largely stabilised. Since 2010, the industry has seen marked cost reduction, particularly with the introduction
of competitive auctions.
Analysis for the UK’s Offshore Wind Programme Board under the Cost Reduction Monitoring Framework has
revealed that the levelised cost of energy (LCOE) for UK projects, which account for the majority of global
deployment over this timescale, has decreased by ~32% from 2010 to 2016. The reduction from £142/MWh (equiv.
€166/MWh) for projects reaching financial investment decision (FID) in 2010-2011 to £97/MWh (equiv.
€114/MWh) for projects reaching FID in 2015-2016 means that the industry has surpassed its 2020 cost target
(~€117/MWh15) 4 years ahead of schedule. The level of cost reduction has also exceeded even the most ambitious
projections set at the beginning of the decade (Figure 5).
Figure 5. Offshore wind cost trends in Europe16
* The Crown Estate (TCE) Cost Reduction Pathways (2011); ** Cost Reduction Monitoring Framework (2017) *** Includes grid connection and site development costs for NL and DK projects (uplift of €14/MWh). It should be noted that many of the ‘actual’ projects reaching FID have not yet been built.
15 Industry target of £100/MWh (equiv. €117/MWh) in the UK and €100/MWh in Europe (equiv. to €114/MWh with uplift for grid connection and site development; see footnote 17).
16 TCE 1-4 represent scenarios for offshore wind cost reduction from The Crown Estate Cost Reduction Pathways study in 2011. CRMF (Cost Reduction Monitoring Framework) represents anonymised actuals from UK projects reaching FID in 2010-11, 2012-14, and 2015-16, respectively. Auction tenders represent an average strike price from projects awarded contracts under competitive auction systems (see Table 1; uplift of €14/MWh to account for grid and site development costs; see footnote 17).
0
20
40
60
80
100
120
140
160
180
2010 2011 2012 2013 2014 2015 2016 2017 2018 2019 2020
LCO
E (€
/MW
h)
TCE-1: Slow progression* TCE-2: Technology acceleration
TCE-3: Supply chain efficiency TCE-4: Rapid progression
CRMF (UK average)** EUR auction tenders (average)***
Industry 2020 target Industry 2025 target

REWIND OFFSHORE – Comparative Analysis of International Offshore Wind Energy Development, March 2017
9
In recent years the pace of cost reduction has accelerated further, largely driven by the introduction of competitive
auction-based tendering systems in several front-runner countries, including the UK, Denmark, and the Netherlands.
Table 1 includes details of the projects awarded contracts under competitive tenders since 2016, with uplift of
€14/MWh applied to European projects where grid connection and site development are external to the awarded
strike price17. The cost drivers for each project vary, depending on the regulatory framework, site conditions, and
project size, but a dramatic reduction in cost is evident across markets. Strike prices in the most recent contract
awards, with FID expected in 2017 and 2018, suggest that the industry has already exceeded its 2025 cost target
(€80/MWh, incl. grid connection18) 8 years ahead of schedule.
Table 1. Projects awarded subsidy contracts through competitive auction tenders in Europe.
Year (FID)
Year (online)
Capacity WTG rating
Water depth (ave.)
Distance from shore
Tariff (local currency /MWh)
Tariff (€/MWh)
Tariff (€/MWh - adjusted19)
Horns Rev III (DK) 2016 2018 400 MW 8 MW 16 m 30 km 770 DKR 103.6 117.6
East Anglia I (UK) 2016 2019 714 MW 7 MW 36 m 55 km 119.9 GBP 140.3 140.3
Vesterhav Syd & Nord (DK)
2017 2019 350 MW TBC 20 m 6 km 475 DKR 63.9 72.9
Borssele I&II (NL) 2017 2019 700 MW 8 MW 26 m 31 km 72.7 EUR 72.7 86.7
Kriegers Flak (DK) 2017 2020 600 MW TBC 22 m 25 km 372 DKR 50.0 64.0
Borssele III&IV (NL) 2018 2020 680 MW 8 MW 26 m 36 km 54.5 EUR 54.5 68.5
It is important to note that many of the projects included in the analysis have not yet been built or reached FID.
Engagement with relevant industry stakeholders suggests that there is high confidence that the projects will be
constructed and operated according to the strike prices derived. However, other stakeholders have also voiced
concerns over the downward pressure on suppliers and favourable market economics at present, which may not be
sustainable long-term drivers of cost reduction. As such, a level of cautious optimism should be applied until greater
certainty is evident.
17 €14/MWh derived from €12-15/MWh range suggested by NERA Consulting. 2016. Auctions and Bidding Strategy for Offshore Wind, available at http://www.nera.com/content/dam/nera/publications/2016/PUB_Offshore_Wind_A4_0916.pdf and €14/MWh used by BVG Associates in http://www.offshorewind.biz/2016/10/28/borssele-tender-revealed/
18 €80/MWh target by 2025 set by WindEurope and a group of 11 industry players (Adwen, EDPR, Eneco, E.On, GE, Iberdrola, MHI-Vestas, RWE Innogy, Siemens, Statoil, Vattenfall). €80/MWh including grid connection is expected to equate to ~€66/MWh excluding grid connection.
19 €14/MWh added to tariff of Dutch and Danish projects (excl. Versterhav Syd & Nord) to account for development and grid connection costs. Lower uplift of €9/MWh applied to Vesterhav Syd & Nord to account for near-shore location, which will reduce grid connection costs.

REWIND OFFSHORE – Comparative Analysis of International Offshore Wind Energy Development, March 2017
10
Cost reduction drivers
The level of cost reduction achieved to date is a major success story for the offshore wind industry, a sign of the
sector’s maturity and proving that it is on track to become a low cost and mainstream energy technology. The drivers
of this cost reduction are diverse and wide-ranging. A non-exhaustive list of some of the key drivers includes:
● Scale effects: – Larger individual projects – Larger project portfolios – Project clusters – Cumulative market size – Industrialisation and standardisation – Higher buying power for some key players
● Technology innovation: – Turbines: Higher capacity rating and larger rotor diameter; high availability; high load factors – Foundations: XL monopiles – Electrical systems: 66kV intra-array cables; optimised HVAC and HVDC transmission – Installation: Bespoke installation vessels – O&M: Bespoke access vessels; optimised O&M strategies – AEP: Reduced losses and higher yields
● Competition: – Competition between projects and developers for limited contracts – Top-down pressure on price pushed down through the supply chain – Larger, more competitive supply chain, with competition across the industry structure
● Learning by doing: – Greater experience and confidence from contractors – Less conservative pricing strategies
● Financing: – Offshore wind now considered a bankable asset class – Lower risk perception leading to preferential lending rates (lower WACC) – Innovative financing models, including a more diverse range of investors
● Market economics: – Low interest rates – Low steel and oil prices – Less competition from other sectors (e.g. downturn in vessel activity for oil and gas)
● Project development de-risking: – Site development activities (e.g. consent, permitting, site data) undertaken by government has reduced
project and investment risk for developers
● Site conditions: – Projects in recent tenders have benefitted from close proximity to shore and/or shallow water depths – High wind speeds and larger turbines are delivering higher load factors
Further cost reduction is expected in the coming years, particularly as more countries transition to competitive
tendering systems. It is acknowledged that several drivers listed above may not prevail over the long-term. For
example, more challenging site conditions and changing macroeconomic forces can put an upward pressure on
costs. The cost reduction observed in Europe is also unlikely to be directly transferrable to emerging markets, at
least in the near term. Nevertheless, prevailing trends suggest that, as the industry continues to mature, several
drivers will be re-enforced. This will be equally applicable to emerging offshore wind markets, provided suitable
policy and regulatory frameworks are in place.

REWIND OFFSHORE – Comparative Analysis of International Offshore Wind Energy Development, March 2017
11
3 P O L I C Y & R EG U L AT I O N
Government policy is critical to stimulating offshore wind development. The growth of the industry over the past
two decades has been underpinned by supportive policy frameworks that have catalysed growth in early mover
markets and are beginning to embed themselves in new emerging markets. Over this period policies have evolved
to meet the needs of the industry and adapted to changing political and market environments. Notable recent trends
include the introduction of competitive auction systems (e.g. UK, Netherlands, Denmark) and the transition to
centralised development models (e.g. Denmark, Netherlands, Germany).
No single policy framework can be identified as the optimal approach to supporting offshore wind development. A
variety of different approaches have been adopted by different countries, with varying degrees of success. Although
the importance of local context must be emphasised, some clear examples of best practice and lessons learned can
be identified. This section aims to extract these lessons learned through six key policy areas:
● Market scale and visibility: Target-setting and market signals to provide long-term industry confidence
● Site development: Site identification, leasing, surveying, and consenting
● Grid connection: Provision of electrical infrastructure assets
● Incentive mechanisms: Remuneration support to ensure project profitability and incentivise industry
investment
● Supply chain development: Infrastructure investment and business support to develop and maintain a strong
local supply chain
● Innovation support: R&D initiatives to accelerate the commercialisation of cost-cutting technology innovation
The following sections explore the different approaches that have been adopted in each of these areas, using case
study examples to highlight examples of successful policy interventions. Three primary country case studies have
been assessed – the United Kingdom, Germany, and the Netherlands – with other country examples highlighted
where relevant to capture the breadth of policy measures and approaches observed across the industry. The findings
have been developed through a combination of literature review and a series of interviews with key industry
stakeholders.

REWIND OFFSHORE – Comparative Analysis of International Offshore Wind Energy Development, March 2017
12
3 . 1 M A R K E T S C A L E A N D V I S I B I L I T Y
Engagement with industry stakeholders suggests that market scale and visibility is widely considered the most
important factor in stimulating industry growth. Sufficient market scale is essential in providing the volume of
deployment necessary to maintain a strong and competitive supply chain and achieve economies of scale, while
long-term visibility is vital in allowing developers, suppliers, regulators, and other stakeholders to plan and make
necessary investment decisions. This long-term visibility is arguably more critical to offshore wind than other
renewable energy technologies given the long development timescales for offshore wind project development
(typically ~7-10 years) and the high cost of the supporting infrastructure required (e.g. ports, vessels, grid). Indeed,
these timescales often exceed those of conventional political cycles, which creates challenges in maintaining
accountability and stability for long-term policy goals. However, a number of tools exist for policy makers to send
market signals that can provide confidence to industry players and stimulate investment.
3.1.1 Policy tools
International policy drivers
Fundamental to creating long-term visibility of market scale is the need to integrate offshore wind within a country’s
broader energy strategy. This typically stems from a series of top-down drivers, including decarbonisation,
renewable energy generation, energy security, and industrial strategy goals. From a decarbonisation perspective,
emission reduction targets have been outlined in international climate agreements (e.g. Paris Agreement), which
have informed carbon reduction at regional (e.g. EU legislation) and national level (e.g. NDCs; UK Climate Change
Act). Decarbonisation targets are typically set over long time horizons (e.g. out to 2050), supported by interim
milestones at regular, often decadal, intervals. This clear long-term pathway combined with near-term goals enables
countries to adopt suitable national energy strategies to meet decarbonisation and renewable energy targets.
In addition and where applicable, grid interconnection targets can assist in providing increased visibility. The EU has
set a target of 10% of interconnection capacity between neighbouring countries of their installed electricity
production capacity by 2020, with an increase to 15% by 2030 proposed. Interconnection targets are likely to further
boost the case for offshore wind, which could play a key role in a future meshed North Sea grid.
● Offshore wind policy objectives should form part of a country’s long-term energy strategy
● Visibility is needed over long time horizons
● Ambitious targets can catalyse the industry, but need to be integrated within, and supported by, the
wider policy framework
● Short to medium-term roadmaps can hedge against long-term uncertainty
● Stakeholder engagement can support buy-in and longevity for national deployment strategies
Box 1: European Commission Renewable Energy Directive
EU Directive 2009/28/EC is largely seen as having been a key driver in the development of offshore wind in
Europe in recent years. The Directive contained binding renewable energy targets at Member State level and
required the development of National Renewable Energy Action Plans setting out the individual technologies
expected to contribute to the attainment of the 2020 target at national level. Looking ahead to 2030, the recast
Directive proposed as part of the 2016 Winter Package sees the shift from individual nationally binding targets
towards an overall EU target (27% renewable energy by 2030). Given that the recast Directive has yet to be
negotiated and that the mechanics of how the Directive will work in practice in terms of individual Member
State contributions is still unclear, industry perceives a reduced level of certainty about future developments.

REWIND OFFSHORE – Comparative Analysis of International Offshore Wind Energy Development, March 2017
13
National energy strategies
A long-term vision and commitment to increasing electricity generation from renewable energy sources is vital to
the development of a coherent national energy policy. A clear national strategy sends a powerful signal to the market
that there will be ongoing support for renewable energy technologies. Germany and Denmark, in particular, have
adopted progressive energy strategies to transition towards an increasing share of electricity from renewables,
which is evident through higher renewable energy targets than other neighbouring offshore wind markets (Figure
6; Germany case study in Box 2). This contrasts to other European countries, where a lack of a clear and consistent
energy policy has stalled growth (e.g. Spain).
Figure 6: Target share of renewable energy by 202020
However, providing long-term technology-specific visibility can be challenging for governments, who may prefer
greater flexibility and an ability to challenge industries to demonstrate their value to consumers. Some countries,
such as the UK, have adopted a more free-market approach, with groups of technologies competing against each
other to win subsidy contracts (albeit grouped by technology maturity). Others, such as the Netherlands, have been
more prescriptive on the level of deployment expected from offshore wind, and have introduced ring-fenced
support in subsidy auction to guarantee a minimum level of installed capacity. However, this is typically over shorter
timescales, reflecting a trade-off that governments need to make between the level of certainty and the degree of
visibility provided. In many cases, industry will have a preference for greater certainty over the near term than lower
certainty over the long term. In some cases, continued support over the long-term can be made contingent on
achieving particular price points, which hedges government risk and continues to incentivise cost reduction.
20 European Commission. 2016. Renewable energy in the EU. Available at: http://ec.europa.eu/eurostat/documents/2995521/7155577/8-10022016-AP-EN.pdf/38bf822f-8adf-4e54-b9c6-87b342ead339
0 10 20 30 40
Denmark
Belgium
Netherlands
France
Germany
UK
Europe
% Renewable Energy

REWIND OFFSHORE – Comparative Analysis of International Offshore Wind Energy Development, March 2017
14
Dedicated offshore wind policies
For a number of European countries, offshore wind is seen as an important pillar to achieving renewable energy
targets. This has manifested itself through a variety of mechanisms to provide confidence in the scale of the market
and create an attractive environment for inward investment, including:
● Deployment targets: The simplest form of target-setting, this sets a target installed capacity over a given
timeline. Provided these are enforced and tied to appropriate supporting policy, targets give a clear indication
to industry over the anticipated scale of deployment.
– Example: Germany has set a target of 6.5 GW by 2020 and 15 GW by 2030.
● Site identification and leasing: Identifying suitable sites for offshore wind development, which may be
auctioned and leased to prospective developers, sends a strong signal to the market that future growth will
follow. However, again, site leasing must be accompanied by suitable policy and regulatory frameworks to
deliver on expectation.
– Example: The Crown Estate has ran several leasing rounds for sites in UK waters with a cumulative capacity
of over 40 GW.
– Example: Following the UK model, Chinese Taipei has released 36 sites for offshore wind development with
a total capacity of ~15.4 GW.
● Capped auctions: With the transition to competitive auction systems, a cap is allocated to constrain deployment,
either as a straightforward cap on capacity (regardless of price) or as a cap on the allocated budget to support
deployment (where price impacts the level of deployment possible).
– Example: The Netherlands have outlined a roadmap to achieve their 2023 offshore wind target, supported
by site auctions capped at ~700 MW per year.
Box 2: Energiewende
In Germany, the government has outlined a clear national energy strategy to transition away from fossil fuel
and nuclear power towards an energy system dominated by renewable energy sources. The Renewable Energy
Act under the Energiewende policy outlines a goal to achieve 80% renewable electricity generation by 2050,
with near term targets of 40-45% by 2025 and 55-60% by 2035. A deployment corridor is assigned to control
the amount of renewables coming online each year, with capped auctions to determine winners of subsidy
contracts and grid permits.
The adoption of these targets has acted as a driver for investment in renewables, including offshore wind, which
can provide higher load factors and provide more operating reserve than other renewable generation sources,
such as onshore wind and solar PV. The ‘WindSeeG’ (German Offshore Wind Act) has set targets of 6.5 GW by
2020 and 15 GW by 2030, supported by a marine spatial plan and federal grid plan to identify sites and plan
grid connection phasing. Although these deployment volumes mark a scaling back from original targets,
Germany is currently one of the world’s fastest growing offshore wind markets and has been particularly
successful in securing considerable market share for leading domestic suppliers, such as Siemens and Senvion,
as well as regenerating several ports, which have served as hubs for offshore wind activity (see section 3.5).
Although proponents of offshore wind are calling for more ambitious offshore wind targets and the transition
to a centralised auction based system has been disruptive to several developers, the visibility provided by the
Offshore Wind Energy Act over the planned capacity of auction rounds up to 2030 will provide greater certainty
for project developers and suppliers to plan accordingly. The offshore wind energy corridor includes 500 MW
per year tendered between 2021 and 2022, 700 MW between 2023 and 2025, and 840 MW annually from 2026
onwards, steadily increasing the level of offshore wind capacity as onshore grid constraints are relaxed.

REWIND OFFSHORE – Comparative Analysis of International Offshore Wind Energy Development, March 2017
15
– Example: The UK provides near and medium-term visibility through the size of the Levy Control Framework,
a fixed budget on the support available to energy technologies through the allocation of Contracts for
Difference. The UK government has allocated funding to support 10 GW of total installed capacity by 2020
and committed to support an additional 10 GW by 2030, provided certain price points are met.
● Legislation: Government legislation can include requirements for a minimum amount of offshore wind
electricity to be procured from utilities.
– Example: Massachusetts has enacted an energy bill that requires state utilities to procure 1.6 GW of offshore
wind power by 2027.
It should be noted that these are not mutually exclusive and are most effective in combination. For example, national
deployment targets can be supported by leasing processes and relevant regulation and delivered using capacity
auctions.
Offshore wind market scale
The high capital expenditure in developing and constructing offshore wind farms requires a given level of market
scale to justify investment costs, deliver economies of scale, and ensure sufficient competition between industry
players. Steadily increasing deployment and forward pipelines in Europe have been one of the primary drivers of
cost reduction, which is aided by concentrated development within the North Sea and neighbouring regions. As
governments enforce downward pressure on price and shift to competitive auction-based systems, maintaining
consistent deployment levels will be critical in continuing the downward cost reduction trend.
Industry body WindEurope are calling for at least 4 GW annual installed capacity across the European region to
maintain a competitive supply chain and encourage continued investment in innovation. However, analysis of
deployment in leading markets suggests that a deployment gap of ~1 GW could exist without increased political
commitment (Table 2). Greater ambition is therefore required from policy makers to outline higher deployment
volume over the years to 2030.
Table 2. Anticipated post-2020 annual installed capacity across Europe
Country Post-2020 annual
installed capacity
Comment
UK ~1,000 MW Based on UK Government commitment for 10 GW from 2020-2030.
Germany 500-840 MW 500 MW/yr in 2021-22; 700 MW/yr in 2023-25; 840 MW/yr in 2026-2030.
Netherlands 700-1000 MW 700 MW/yr from 2018-2023; ~1 GW/yr from 2023-2030.
Denmark 0-300 MW Based on current pipeline to 2020; no firm commitments.
Belgium 0-300 MW Based on current pipeline to 2020; no firm commitments.
France ~500-800 MW 3,000 MW from 2017-2023; 6,000 MW from 2023-2030.
Other Europe TBC No firm commitments.
TOTAL 2,700-4,200 MW
Challenges of market scale are even more acute in emerging markets, where deployment levels are expected to be
considerably lower. This is particularly evident in more isolated markets, such as Japan and Chinese Taipei, where
there are limited opportunities to leverage neighbouring infrastructure and supply chains. Cooperation between
East Asian countries could be critical to industry success, particularly in leveraging the growing Chinese offshore
wind market. Likewise, the USA has the potential to reach volumes of scale rivalling those seen in Europe, but inter-
state cooperation will be vital to delivering costs that are acceptable to consumers, particularly in the near term.
Without suitable coordination and collaboration, these emerging markets will be faced with higher project costs.

REWIND OFFSHORE – Comparative Analysis of International Offshore Wind Energy Development, March 2017
16
3.1.2 Lessons learned
Ambitious targets can catalyse the industry, but need to be integrated within, and supported by, the
wider policy framework
Targets can help to inform regulation and importantly provide the market with a clear indication of a government’s
intent. The availability of credible targets play an important role in giving the industry the confidence that there is
the political will to deploy the technology. However, just as ambitious targets can stimulate industry growth,
downgrading targets can negatively impact on investor confidence in the sector. Downward revisions to offshore
wind targets have occurred across a number of markets:
● EU: It is estimated that the cumulative total for offshore wind of 43.3GW by 2020 contained in the EU Member
States original National Renewable Energy Action Plans will not be achieved with figures closer to 24GW
expected by 2020.
● UK: The UK has downgraded its original 2020 target from ~18 GW to 10 GW. Engagement with industry
stakeholders also suggested that the scale of the Round 3 leasing round was overly ambitious, setting unrealistic
expectations for the sector in its formative years.
● Germany: Germany has downgraded its original targets of 10 GW by 2020 and 30 GW by 2030 to 6.5 GW by
2020 and 15 GW by 2030.
● France: Following 3 leasing rounds, the most recent French multi-annual energy programme sets a target of 3
GW of fixed offshore wind to be installed by end 2023, representing a downgrade of the 2009 target of 6 GW by
2020.
● China: China has downgraded its targets from 5 GW by 2015 and 30 GW by 2020 to 5 GW by 2020 and 30 GW
by 2030. Even these latest targets have been, or are expected to be, missed.
These downgrades have been caused by a number of factors, including higher than expected project costs,
permitting and grid connection delays, and an underappreciation of the complexity and challenges of building
offshore wind farms (i.e. an expectation that offshore wind could be built out at the same rate as onshore wind).
However, most critically, targets were not accompanied by suitable policy and regulatory frameworks or tied to
national energy strategies. Targets in themselves are rarely sufficient to drive increased deployment in the absence
of supporting policy measures, such as incentive mechanisms and appropriate legislation to enable projects to be
constructed on time and on budget. The various elements that make up a supportive policy framework are discussed
in the subsequent report sections (3.2 to 3.6).
Steady, phased deployment is more effective than periods of boom and bust
While high deployment volume is a core driver of cost reduction, policy makers need to ensure that roll out is spread
evenly across delivery years. A lack of coordinated planning can result in peak periods of construction which lead to
supply chain bottlenecks and associated price pinches. Conversely, periods of low activity can derail supply chain
confidence and investment. Such volatility is unfavourable for both industry and governments. As such, tendering
rounds should be phased with necessary delivery milestones to provide a manageable build out schedule, as well
as coincide with planned grid network reinforcements.
Coordination should also be encouraged between countries to manage deployment schedules. In Europe, nine
North Sea countries have signed a cooperation agreement to collaborate on several regulatory issues, including
coordination of national deployment strategies to mitigate supply chain bottlenecks in the region21.
21 Government of Netherlands. 2016. Collaboration between countries in the North Sea region for more wind farms at a lower cost. Available at: https://www.government.nl/latest/news/2016/06/06/collaboration-between-countries-in-the-north-sea-region-for-more-wind-farms-at-a-lower-cost
REWIND OFFSHORE – Comparative Analysis of International Offshore Wind Energy Development, March 2017
17
Short to medium-term roadmaps can hedge against long-term uncertainty
While long-term visibility is always a primary policy request from industry, these timescales often exceed political
cycles and are difficult to enforce with legally binding commitments. However, short to medium term certainty can
often be more effective if this includes a clear roadmap with appropriate policy levers to meet deployment targets.
This can require government actors to take on more up-front development risk to reduce the development
timescales and investment risk for project developers (i.e. centralised development model). In the Netherlands, for
example, the government has outlined a clear 5 year pathway with 700 MW annual installed capacity up to 2023,
with accompanying support mechanisms and all site permits in place (see Box 3). Despite uncertainty beyond 2023,
the level of scale over a 5 year period is sufficient to encourage developers and suppliers to invest in the market.
These nearer term roadmaps are arguably more challenging to adopt with a decentralised development model,
where long development timescales (~7-10 years) require greater long-term certainty to initiate developer
investment in site development.
Stakeholder buy-in can support policy stability
While international, inter-regional, and national framework policies are key, in-country regional authorities and
stakeholders also have an important role to play in engaging with policy development and target setting. Agreeing
a suitable level of deployment with industry players is therefore crucial in setting targets that are both ambitious
but realistic. Maximising buy-in from a wide range of stakeholders across government departments can mitigate risk
from policy changes, particularly if long-term targets exceed political election cycles.
Deployment can be linked to cost reduction targets
While setting targets and committing to support deployment provides confidence to reduce investment risk for
developers, governments can limit their own risk exposure by linking deployment targets to cost reduction goals.
This can be an effective means of challenging the industry to reduce costs and driving the sector towards a subsidy
free future. For example, the UK government has challenged the industry with reaching £105/MWh (equiv.
€123/MWh) by 2021 and £85/MWh (equiv. €100/MWh) by 2026, with continued support for an additional ~10 GW
of installed capacity from 2020 to 2030 under the Levy Control Framework if these price points are achieved.

REWIND OFFSHORE – Comparative Analysis of International Offshore Wind Energy Development, March 2017
18
Box 3: Netherlands offshore wind strategy
Driven by the Dutch Energy Agreement, which identified an important role for offshore wind in meeting national
decarbonisation targets, the Netherlands have introduced a roadmap for offshore wind development out to 2023.
The roadmap includes annual tender rounds for ~700 MW capacity from 2015-2019, which will enable the
Netherlands to meet its offshore wind target of 4.5 GW by 2023.
The approach adopted by the Netherlands incorporates many of the lessons learned listed above, following an
extensive industry consultation led by the Ministries of Economic Affairs and Infrastructure and Environment, the
Netherlands Enterprise Agency (RVO.nl) and Rijkswaterstaat, to design an appropriate policy and regulatory
framework for offshore wind development. The roadmap provides clear visibility for the sector up to 2023 with
clearly defined market scale spread evenly over a 5 year programme. This guaranteed base level of deployment
ensures stability for the industry, allowing developers and suppliers to plan accordingly.
Targets have also been linked to a robust and transparent policy framework, including timely permitting and grid
connection, based on the Danish development model in which the government takes on the cost and risk of site
development. Tenders are launched for specific offshore sites, maximising competition to drive down costs.
The Dutch government outlined a 40% cost reduction target for the
Dutch offshore wind sector, relative to the previous tariff level, with an
initial price cap of €124/MWh falling steadily to €100/MWh for the 2019
auction. However, this was surpassed in the first auction round for
Borssele I and II sites, with DONG Energy winning with a strike price of
€72.7/MWh, 41% below the price cap. The second auction round
exceeded this further, won by the Blauwwind II consortium including
Shell, Eneco, Van Oord, and Mitsubishi/DGE with a landmark low strike
price of €54.5/MWh, 54% below the price cap.
The low strike prices attained in the first two auction rounds are
expected to deliver considerable reductions to public expenditure, with
~€2.7bn of savings anticipated in Borssele I&II and €~4.7bn of savings in
Borssele III&IV. Public support for Borssele III&IV is expected to amount
to just €300m over the first 7 years of operation, with the wind farm
operating without subsidies for the final 18 years of its lifetime
(assuming rising wholesale prices).
Another source of cost savings is expected from the standardisation of 5 equal 700 MW substations designed by
grid operator Tennet, who will have responsibility for building and operating the assets.
The project pipeline beyond 2023 is still unclear, but Dutch authorities have signalled intent to construct ~1 GW
per year from 2023 to 2030, according to the Ministry of Economic Affairs’ ‘Energy Agenda’. The next roadmap
may also consider phasing out subsidies for offshore wind by 2026.
Source: RVO
Source: RVO

REWIND OFFSHORE – Comparative Analysis of International Offshore Wind Energy Development, March 2017
19
3 . 2 S I T E D E V E L O P M E N T
Site development is a fundamental step in the development of an offshore wind farm. Extensive in its scope, site
development compromises several stages, including site identification, site surveying, leasing, consenting, grid
permitting, and eventually the construction of the transmission infrastructure. Given the number of stages and
stakeholders involved, site development can often be a time-intensive process, often between 7 to 10 years, at a
cost of up to £70m (equiv. €82m) per wind farm. Getting it right is therefore essential to maximising the success of
offshore wind project developments.
A sequence is generally followed beginning with marine spatial planning to identify suitable zones or specific sites,
before more detailed site surveys are conducted to confirm the suitability of the sites and inform site layout and
technology options. Once the parties involved are confident of the site’s viability from a financial, environmental,
and technical perspective, site consent and relevant permits need to be obtained before advancing to final
investment and wind farm construction (provided a subsidy contract is obtained).
3.2.1 Policy tools
Three typical models have been evident in offshore wind site development to date:
● Centralised model: Government bears the majority of the up-front financial risk and undertakes the site
identification, surveying, consenting, and grid permitting prior to auctioning the site. In such a system, the
developer only enters into the process at the pre-construction phase, by submitting a bid for a specific project
site. Whilst attractive for developers from a de-risking perspective, it can limit the scope to demonstrate
competitive advantage, with some industry players preferring to obtain greater control of the site selection and
development process.
– Examples: Denmark; Netherlands.
● Decentralised model: Developer takes the lead in undertaking site surveys, acquiring grid permits and consent,
and designing and constructing the electrical infrastructure. Such an approach involves lower risk and up-front
cost for governments, but this will be reflected in higher strike prices once contracts are awarded. For
developers, a decentralised approach can be preferable in the level of control and opportunities to demonstrate
competitive advantage, but can introduce significantly higher up-front risk for developers, particularly if
allocation is constrained through auction-based remuneration systems.
– Examples: United Kingdom; China; Japan.
● The transition to competitive auctions demands greater government site de-risking activities
● Spatial planning is critical to selecting the best development zones and mitigating consenting challenges
● Consenting regimes should provide a clear framework with defined timelines, coordinated
responsibilities, and front-ended consultation
● ‘One-stop-shop’ entities that bundle permits into a single process can streamline the permitting process
and mitigate stakeholder conflicts
● Greater flexibility in the consenting envelope can future-proof sites for the adoption of innovative, low
cost technologies
● Site extensions are a cost-effective and low risk means of deploying additional offshore wind capacity
● Scientific research studies can be used to inform and improve consenting processes
● Cumulative environmental impacts are an increasingly important issue for the industry

REWIND OFFSHORE – Comparative Analysis of International Offshore Wind Energy Development, March 2017
20
● Hybrid model: Government takes control of some, but not all items of the site development process. For
example, government may undertake site identification, initial site surveying, and grid permitting, but require
the developer to obtain full consent and further site surveys.
– Examples: Germany; France (Round 3 projects).
A summary of the site development approaches undertaken in the UK, Netherlands, and Germany is shown in Table
3, below, and a more detailed overview can be found in Box 4.
Table 3. Approaches to offshore wind site development
Zone identification
Site selection Site investigation
Consenting/ permitting
Grid application
Grid design & construction
Government risk/control
Developer risk/control
Crown Estate Developer Developer Developer via PINs
Developer / National Grid
Developer/ OFTO
EEG 2014
Government Developer Developer Developer via BSH
TSO TSO
EEG 2017
Government Government Government Developer via BSH
TSO TSO
Government Government Government Government Government/TSO
TSO
Note: Green indicates government/TSO responsibility; orange indicates developer’s responsibility. The sequence of steps can vary by country (see below).
It should be noted that each model has its advantages and the approach taken by governments will largely depend
on local context, national objectives, and a government’s willingness to share risk. However, particularly with the
transition towards competitive auction systems, there has been a recent shift from decentralised to more centralised
approaches. The centralised approach, pioneered by Denmark (‘the Danish model’), whereby the government
develop a site to the pre-construction phase before auctioning to prospective developers, has also been adopted by
the Netherlands.
Similar models are also in transition elsewhere in Europe. For example, Germany is currently moving towards a more
centralised approach in which governments will auction specific sites, as opposed to the open-door method adopted
previously. However, in Germany consenting remains the responsibility of the developer and is only considered after
contract award. Belgium is also making steps towards more centralised procedures.
The UK, the market leader in deployment to date, is so far maintaining a more decentralised approach, with greater
responsibility and up-front risk for developers. However, the transition to the auction-based CfD regime has
increased allocation and price risk considerably, meaning that more up-front de-risking may be required by public
bodies in future leasing rounds. However, the free-market approach adopted by the UK, in which energy
technologies must compete on a level playing field, may not align with a fully centralised model.
Changing regulatory frameworks can also be a complex process that needs to be managed carefully to minimise
losses from sunk costs under existing regimes. For example, in both the Netherlands and Germany several
developers have had their site leases withdrawn in order to facilitate the transition to centralised auction systems.
These developers have lost considerable investment from site acquisition and development activities, with no
compensation available to offset these losses. Such policy changes can undermine investor confidence and be
disruptive to sector growth.
Low
High
High
Low
Decentralised
Centralised

REWIND OFFSHORE – Comparative Analysis of International Offshore Wind Energy Development, March 2017
21
Box 4: Summary of site development responsibilities across selected EU jurisdictions
United Kingdom:
(i) The Crown Estate, which owns the rights to the UK seabed, identifies areas that qualify for offshore wind
development. These large spatial zones are selected based on site characteristics (e.g. wind speed, seabed
conditions, water depth) and known site constraints (e.g. grid connection, environmental impact). (ii) Developer
submits bids for exclusivity of a given zone. (iii) Developer selects specific area within the zone and reach an
agreement for lease with the Crown Estate. The term of the lease is negotiated on a project-by-project basis, with
fees typically paid based on power production. (iv) Developers conduct site investigations to develop an accurate
understanding of the site characteristics and determine technical and financial feasibility. (v) In England and Wales,
consent and permitting applications are submitted to the planning inspectorate (PINS). This entails a clearly
prescribed stage gated process, with clearly defined timelines. In Scotland, applications are assessed by Marine
Scotland under the Section 36 process. (vi) Once consented and fully permitted, the project is eligible for a ROC
(pre-2017) or to compete for a subsidy contract in CfD auctions (2016 onwards).
Germany (old regime – EEG 2014):
The German model currently follows a similar process to the UK. (i) BSH release site zones for prospective
developers to acquire through auction. Conservation zones and other constraints (e.g. shipping routes) are
excluded. (ii) Developer submits consent application to BSH. (iii) BSH award a lease, with no fee attached. (iii)
Developer conducts site investigations. (iii) TSO applies for grid permits. (iv) Developer is eligible for the feed-in
tariff (pre-2017) or to enter competitive auction (auctions in 2017-2018; commissioning before 2021).
Germany (new regime – EEG 2017):
The new German approach, for projects commissioning from 2021 onwards, is more centralised, with government
taking on more responsibility for developing sites. (i) Sites are selected in advance, according to the nationally
coordinated marine spatial plan and offshore grid plan, with a schedule of when these sites will be auctioned. (ii)
Site investigations are conducted and passed on to developers ~6 months before the auction. (iii) Developers
compete for the sites through an auction process. Winning bidders will get a subsidy contract, grid permits, and
the guarantee that the TSO will build and operate the transmission assets. (iv) Once subsidy contract and grid
permit are in place, developer can commence the legal process to gain consent (via BSH), with a 12 month period
to submit all documents. This accelerated timeframe is possible given that site investigations have largely been
completed. (v) Once permitted, developers can commence with wind farm construction.
Netherlands:
The Dutch Government has adopted a highly centralised approach to site development. (i) The Government
undertakes the selection of specific project sites, conducts the necessary site investigations, and obtains full
consent and grid permits. (ii) Developers compete for sites through an auction process. Winning bidders are
awarded a subsidy contract (SDE+) and all necessary permits to progress with wind farm construction.
Zone identifcuation
Site selection
Negotiate lease
Site investigation
Grid permit ConsentROC / CfD
auction
Zone identifcuation
Site selection
Negotiate lease
Site investigation
Grid permit ConsentFeed-in Tariff
Site selection Site investigation Grid permit Auction Consent
Site selection Site investigation Site ConsentGrid permit and
designAuction

REWIND OFFSHORE – Comparative Analysis of International Offshore Wind Energy Development, March 2017
22
3.2.2 Site identification and leasing
Selecting the location of an offshore wind farm is one of the key determinants that influences a site’s technical and
economic viability, impacting heavily on revenue generation (energy production), capital expenditure (technology
design, installation), and operational expenditure (maintenance, repairs).The location of offshore wind sites can also
impact on the onshore transmission network and energy system balancing requirements.
Approaches to site identification and leasing
To date there have been different approaches to identify sites or zones for offshore wind development, which have
evolved over time across different jurisdictions.
Open-door
With low levels of information on factors such as wind conditions, seabed geology, wave height, and other
environmental and human constraints, as well as limited anticipated deployment, government agencies initially
adopted an open door approach to site identification. In this approach, developers take the lead in identifying
suitable sites and securing agreements for lease with the relevant authorities. This presented a low cost approach
for governments at a time when offshore wind was an immature energy technology, and a more flexible approach
for developers looking to select the most attractive sites in the industry’s formative years. However, open door
approaches have experienced mixed success, with some sites successful in gaining consent relatively quickly, while
others have suffered major setbacks from consenting issues.
The setbacks incurred can largely be attributed to the limited information available to select the most appropriate
sites. In particular, sites were generally selected based on dominant basic parameters, such as wind speed and water
depth, often neglecting key constraints, including ground conditions, grid connection, and environmental sensitivity.
In the UK, this led to some notable project failures, including Shell Flats, Scarweather Sands, and Cromer (see Box
6). Given the nascent state of the industry, setbacks are unsurprising, but important lessons were learned in the
process in terms of the value of undertaking more work up-front to understand site constraints before significant
development expenditure is incurred.
Zoning
With increasing understanding of key parameters and constraints, as well as the application of spatial planning tools
(e.g. The Crown Estate’s MaRS tool; BSH’s GeoSpatial tool), countries have been able to take a more strategic
approach to site identification22. This has manifested in the establishment of strategic environmental assessments
(SEAs) or marine spatial plans (MSPs), which have been used to inform more detailed constraints mapping exercises
to designate appropriate zones for offshore wind development. This important first step in the planning process
mitigates risk of conflict with competing sea users and enables governments to make informed strategic decisions.
In the zoning approach, the controlling authority designates large offshore zones for prospective developers to
acquire through a competitive process23. Once exclusivity is obtained, developers can select the most appropriate
sites for their projects. This approach is favoured by many developers as it allows greater flexibility to pick the sites
they deem the most attractive, with the added certainty that several potential constraints have already been
evaluated and de-risked.
22 It should be noted that some countries have greater ability to select specific sites than others due to better information or restriction of available space. For example, the Dutch and German coasts in the North Sea have higher restrictions arising from shipping routes, oil & gas, and conservation zones, leaving a smaller area to investigate compared to the UK, which has a far larger coastal area to consider.
23 In the UK, zones were assigned based on the quality of the proposal (i.e. technical competence, track record, etc.) rather than price. In contrast, in the United States BOEM runs competitive auctions to acquire leases to the seabed, based purely on price.

REWIND OFFSHORE – Comparative Analysis of International Offshore Wind Energy Development, March 2017
23
Box 5: Spatial planning in Germany
Marine and grid spatial plans are essential mechanisms to identify suitable sites by addressing conflicting
demands for the seabed and mapping out potential constraints to development. These are often derived from
strategic environmental assessments (SEA’s), assessments of suitable grid connections, using spatial planning
tools and GIS to map data on wind, water depth, seabed geology, conservation zones, shipping lanes, military
activity and other potential constraints.
The Federal Maritime and Hydrographic Agency (BSH) is the federal agency overseeing licensing for renewable
energy projects in the EEZ in Germany. BSH has recently produced a maritime spatial plan and offshore grid plan
to identify the most appropriate sites for offshore wind development, which will ensure timely and efficient
offshore transmission extensions and onshore grid reinforcement at least cost to consumers.
Box 6: Spatial planning in the UK
The UK undertook a strategic assessment and constraints mapping exercise when assessing Round 3 sites, which
helped to identify 9 development zones with potential for ~26 GW installed capacity. Combined with other
development rounds, this brought potential installed capacity to over 40 GW in UK waters, acting as an
important catalyst and enabler for offshore wind development in the UK.
However, even past zoning efforts undertaken through SEAs and constraints mapping tools have encountered
setbacks from unexpected issues, such as ground conditions, cumulative impacts, and public opposition,
resulting in the cancellation of ~7.6 GW of capacity. For example, in the UK, challenging ground conditions led
to the cancellation of Atlantic Array (1.2 GW) and Celtic Array (4.2 GW); meanwhile, concerns around cumulative
impacts led to the cancellation of Docking Shoal and curtailed capacity for London Array and Race Bank, and
public opposition led to the cancellation of Navitus Bay (Table 4).
A further 4 GW is currently at risk in the Firth of Forth following a judicial review of the consent awards. These
have produced some important lessons learned for future leasing rounds in better understanding potential
constraints at the outset. For example, more extensive and rigorous site investigations and up-front stakeholder
engagement can aid the identification and mitigation of potential challenges before considerable development
expenditure is made.
Table 4. UK project cancellations
Zone Round Capacity (MW)
Status Reason for cancellation
Cirrus Array (Shell Flats) Round 1 270 Withdrawn Environmental impact.
Cromer Round 1 108 Withdrawn Environmental impact.
Scarweather Sands Round 1 108 Withdrawn Site conditions (geology, wind speed)
Docking Shoal Round 2 540 Refused Environmental impact.
London Array II Round 2 240 Withdrawn Environmental impact.
Atlantic Array Round 3 1,200 Withdrawn Site conditions (geology, water depth)
Celtic Array Round 3 4,200 Withdrawn Site conditions (geology)
Navitus Bay Round 3 970 Refused Public opposition.

REWIND OFFSHORE – Comparative Analysis of International Offshore Wind Energy Development, March 2017
24
Site-specific
The zoning approach contrasts with a site specific approach in which the relevant government authority identifies
specific individual project sites for offshore wind development. This is typically employed in combination with a
centralised development model, whereby government bodies undertake the majority of the site development work,
including site surveys and acquiring relevant permits, before auctioning to developers at the pre-construction phase.
This approach mitigates the risk of not obtaining consent and ensures that developers are well-informed of site
conditions before submitting bids, helping to deliver lower strike prices in competitive auctions. Indeed, the
effectiveness of this approach has been evident in recent low strike prices awarded in the Netherlands and Denmark.
However, a centralised, site-specific approach is not always favourable for developers, as it can limit opportunities
to gain competitive advantage across the project lifecycle. It can also be argued that offshore wind developers are
more experienced and better placed to undertake site development activities than government. However, this needs
to be balanced against the potential sunk costs if wind farm development falls through.
Another consideration is the level of portfolio risk for developers, which is increased with widespread adoption of
centralised site-specific tendering at the pre-construction phase, given the greater uncertainty of achieving success
and lack of visibility ahead of contract wins. In contrast, exclusivity to sites under a zoned approach provides greater
certainty of developing a portfolio of projects that enables developers to justify investments in dedicated personnel,
research and development activities, and developing relationships with local suppliers over a long-term period.
Consultation with industry stakeholders suggests that several developers exhibit a preference for a variety of policy
and regulatory frameworks in different markets, which can help to hedge risk and strike a balance between sufficient
portfolio size and the ability to compete for de-risked project sites.
Evolution of approaches to site identification and leasing
As the industry has matured with increasing deployment volumes, open door approaches have generally been
phased out in favour of zone and site-specific approaches, which enable greater government control in the site
identification process (Figure 7). The UK continues to adopt a zoned approach, given that there remains sufficient
volume to meet near term deployment targets. Depending on the UK government’s long-term ambitions, further
leasing rounds may be required. In the near-term, the UK is supporting extensions to existing projects, which can
serve as a low cost and low risk means of adding additional offshore wind capacity.
For countries running new site identification rounds, recent trends display an evolution towards site specific
approaches. Both the Netherlands and Germany have now transitioned to site specific tenders based on the
perceived benefits of increased coordination and clustering of sites, mirroring the Danish model. This follows the
trend towards centralised site development with competitive tendering for subsidy contracts.
In emerging markets, where industry maturity and deployment levels are lower, there continues to be a preference
for open door and zoning approaches. China and Japan both employ an open door approach while Chinese Taipei
and the United States have adopted a zoning method, similar to the UK (see Box 7).

REWIND OFFSHORE – Comparative Analysis of International Offshore Wind Energy Development, March 2017
25
Figure 7. Evolving approaches to site Identification and leasing
2000 – 2009 2009
1991 – 2004 2004
1997 – 2016 2017
2001 – 2015 2015
Source: Carbon Trust; adapted from O.Fitch-Roy. 201524
24 O, Fitch-Roy. 2015. An offshore wind union? Diversity and convergence in European offshore wind governance. Available at: http://www.tandfonline.com/doi/figure/10.1080/14693062.2015.1117958?scroll=top&needAccess=true
Open Door Zoning Site Specific
Box 7: Site leasing in the United States
Site leasing in the United Stated is coordinated and managed by the Bureau of Ocean Energy Management
(BOEM), part of the US Department for the Interior (DoI). BOEM liaise with relevant federal agencies and state
departments to identify suitable areas for offshore wind development whilst minimising environmental impact
and conflict with other activities. Developers can then enter competitive auctions for lease areas, administered
by BOEM and assessed on price, to gain exclusivity of sites. Once a lease has been awarded, developers can
progress with site investigations and environmental assessments, before obtained the necessary permits to
begin construction.
BOEM’s role in identifying and leasing sites has been crucial in stimulating the industry in the US, providing the
requisite conditions for commercial developers to obtain site control and pursue project development. To date,
BOEM has issued leases covering >1m acres across six US states (Maryland, Massachusetts, New Jersey, New
York, Rhode Island and Virginia), resulting in cumulative lease sales of US$ 58.5m (equiv. €55m).
This includes a lease sale off New York in December
2016, which was won by Statoil for a record high bid of
US$ 42.5m (equiv. €40m). The high demand for the site
was partly driven by a New York state target to generate
50% electricity from renewable sources by 2030, but also
reflects growing optimism and confidence in the
potential for considerable offshore wind development
along the US East Coast. New York State have since
announced plans to develop 2.4 GW of offshore wind by
2050.
Source: BOEM

REWIND OFFSHORE – Comparative Analysis of International Offshore Wind Energy Development, March 2017
26
3.2.3 Site surveys
Site data is key to identifying the right zones or sites. In order to successfully select the most appropriate sites for
offshore wind development, responsible government agencies and/or developers must have a comprehensive
understanding of the wind conditions, water depth, seabed characteristics, environmental sensitivities, and other
constraints. This information is acquired by undertaking site survey and investigations. High quality site data can
improve the confidence in the long-term performance of a site for project developers, but importantly can also
increase the confidence of lenders and investors in the projects, which can help to reduce the cost of finance. Poor
quality site data or a lack of constraint mapping can have detrimental impacts on project development.
In line with the transition to more centralised development models, there has been an increasing shift to
government taking the lead on site data collection, undertaking site surveys and making data publically available in
order to de-risk the sites for prospective developers. The key driver for this approach has been to (i) increase control
and knowledge of the sites; (ii) reduce up-front risk and development expenditure for developers; and (iii) supply
prospective developers with accurate site data in advance of auctions. In reducing uncertainty of site conditions and
consent award, this can enable developers to adopt a less conservative pricing strategy, leading to lower strike prices
and, ultimately, lower costs to consumers. For example, in the Netherlands, government agency RVO undertakes all
site surveys and makes the data publically available. Germany are also transitioning to this approach, under the
coordination and management of BSH.
Box 8: Floating LiDAR as a more cost-effective alternative to traditional metrological masts
Given the higher risk exposure during the project development phase and importance of obtaining high quality site data, a significant amount of innovation has been undertaken to improve the accuracy and lower the cost of gathering data. One notable technological development is the use of floating LIDAR to capture wind speed data, as opposed to conventional meteorological masts. Traditional meteorological masts are fixed to the seafloor with large steel foundations and require expensive jack-up barges to install, costing €10-20m per mast and require a number of years to deploy due to permitting and design requirements. They are only able to measure wind speeds and directions at a single point in a site, and tend to be restricted to measurement altitude of up to ~100m above sea level. Floating LiDAR, however, is a low cost alternative to obtaining accurate wind speed measurement. The technology allows for wind speed measurement at altitudes of up to 200m, which has multiple technical benefits, including wind speed measurements across the whole rotor swept area of a potential turbine, which would reduce the uncertainty of measurements obtained. The floating LiDAR platforms can be towed to a site and anchored, which enables very fast deployment (months rather than years) and significantly reduces the complexity of installation.
Source: Left: Installation of a met mast (Fugro Seacore); Right: Installation of a floating lidar device (RVO.nl).
REWIND OFFSHORE – Comparative Analysis of International Offshore Wind Energy Development, March 2017
27
3.2.4 Consenting and permitting
This section provides an overview of consenting policy and responsible entities, including how the interests of
competing maritime activities are managed and environmental impact assessments are conducted.
Consenting and permitting process
Consenting is typically a long and often complicated process. Consenting for offshore wind can typically take
between 3-7 years and bear significant capital requirements, with costs up to £30m (equiv. €35m), although 2014
analysis by Renewable UK suggests consenting costs typically range between £1.5m to £10m (equiv. €1.8m to 11.7m)
across UK sites, equating to £11k - £20k/MW (equiv. €13k – €23.5k/MW) 25. Although not a large cost in the context
of the full project, which can range from £1-2bn (equiv. €1.2 – 2.3bn) for large-scale offshore wind farms (~£2-
3m/MW) (equiv. €2.3 -3.5m/MW), this level of expenditure in the development stage is high risk, representing a
potentially large sunk cost if consent is declined. The high cost and risk has pushed some governments to support
developers by either taking on full (e.g. Netherlands) or partial (e.g. Germany) responsibility for consenting.
The same EU Framework policies and Directives drive consenting across EU countries. Core policies include the
Strategic Environmental Assessment directive2001/42/EC, the Environmental Impact Assessment directive
2011/92/EU, Habitats Directive 92/43/EEC, Birds Directive 2009/147/EC, and the Marine Strategy Framework.
Regulation across European countries therefore holds many similarities (e.g. environmental monitoring
requirements, approval process, and type of stakeholders involved), but the approach to implementation differs.
The approach differs across jurisdictions in terms of the procedural requirements to acquire relevant permitting and
the responsibility of who does so. In the UK, project developers are obliged to undertake the necessary steps to
obtain consent, with different procedures in England and Wales, where the planning inspectorate (PINS) awards
consent through the ‘Development Consent Orders’ (DCO) process, to in Scotland, where Marine Scotland award
consent through the Section 36 process.
In the Netherlands, the Dutch Government obtains consent prior to site tendering, with auction winners receiving
the necessary construction permit and subsidy contract. This differs again from the newly adopted approach in
Germany, where government undertakes an element of pre-consent during site selection, but project developers
are required to obtain full consent following the auction process, when there is greater certainty of the project going
forward. Germany also apply stricter requirements on piling noise during construction and the thermal impact of
electric cabling.
Arguably, regardless of the nuances between jurisdictions, the most important consideration for any consenting and
permitting policy is to provide clarity and transparency for project developers, with clearly defined timelines for the
submission, review, and decisions relating to consenting applications.
Evolution of consenting and permitting process
The level of effort and size of environmental statements is increasing significantly, suggesting limited learning is
being fed through. Recent debates suggest the level at which the precautionary principle is applied may be too great,
in particular for projects that carry inherent uncertainty and impacts are assessed on limited evidence and multiple
assumptions26. This has resulted in a significant increase of effort and size of consent applications, increasing the
administrative burden on all parties.
25 RenewableUK. 2014. Managing Regulatory and Consenting Costs for Offshore Wind. Available at: http://ruk.pixl8-hosting.co.uk/en/publications/index.cfm/managing-regulatory-consenting-costs-offshore-wind
26 Ibid.

REWIND OFFSHORE – Comparative Analysis of International Offshore Wind Energy Development, March 2017
28
Figure 8 demonstrates the increase in size of environmental statements and scoping reports over time in the UK – a
trend confirmed in other front runner countries through stakeholder interviews. Figure 9 demonstrates that despite
the increasing size of wind farms the cost for consenting has not decreased on a per MW basis, demonstrating that
limited learnings have fed through.
Figure 8. Trends in UK Offshore Wind Environmental Statements
Source: The Crown Estate. Upcoming 2016. Industry Evidence Programme Report: Evidence Based Plans for Offshore Wind27
Figure 9. Cost of Consenting in the UK over time
Source: Renewable UK. 2014. Managing Regulatory and Consenting Costs for Offshore Wind28
27 Figure original taken from Howard. R. 2012. The Bullet-Proof Consent Application. Presentation at Renewable UK Offshore Wind Conference in June 2012.
28 Displays indicative cost profiles and costs per MW overtime, estimated by REUK across select UK offshore wind projects. The absolute cost as increased as expected with the increase in size of the projects. However, the trend in cost per MW has not decreased suggesting learnings and experience have not translated into efficiencies.
Number of Pages in
Environmental Statement
Number of Pages in the
Scoping Report
REWIND OFFSHORE – Comparative Analysis of International Offshore Wind Energy Development, March 2017
29
3.2.5 Lessons learned
The transition to competitive auctions demands greater government site de-risking activities
The reduced certainty of obtaining subsidy contracts through competitive auction systems significantly increases
the risk profile for developers to invest in developing new projects. In order to balance the increased allocation and
price risk, governments can re-balance the risk profile by undertaking several site development activities up-front,
including site investigations, obtaining grid permits, and obtaining full or provisional consent, with data made
publically available to prospective developers. The quality of preliminary site surveys and trust in the system are key
to reducing developer risk and enabling lower project costs. However, it should be acknowledged that internal
capacity building will be necessary to effectively and efficiently deliver de-risked project sites.
Appropriate site selection is critical to mitigating consenting challenges
Most instances where consent has fallen through or been delayed has been due to poor site selection,
demonstrating the importance of adequate spatial planning and site identification. For example, in the UK, despite
some sites achieving consent relatively quickly, some have experienced setbacks, leading to the cancellation of ~7.6
GW capacity. Similar cancellations have been seen in Germany and the Netherlands.
Consenting regimes should provide a clear framework with defined timelines, coordinated
responsibilities, and front-ended consultation
Regardless of the nuances of obtaining consent in different jurisdictions, most critical, particularly where
responsibility lies with project developers, is to provide a clear framework with defined timelines and coordinated
responsibilities between relevant government agencies. This provides developers with the certainty of obtaining a
decision without incurring costly delays. In addition, front ending stakeholder consultation and maintaining this
throughout is important to minimise risks of objectives or legal proceedings.
In the UK, the consenting regime in England and Wales has transitioned from Section 36 to the PINS-DCO process,
which has a predefined timeline and front-ended activity, including extensive stakeholder consultation. In Scotland,
Section 36 is still in force, which has a more flexible approach to timescales by removing the use of predefined
deadlines. This increased flexibility has both benefits and drawbacks where by decisions can be made more quickly
than the PINS-DCO process however not knowing when a decision will be made can also create increased
uncertainty and risk for project developers.
‘One-stop-shop’ entities can streamline the permitting process
The provision of a ‘one stop shop’ for permitting is also beneficial, providing greater clarity for developers and
reducing confusion and potential conflicts between different government agencies. Streamlining the permitting and
consenting process is beneficial to all stakeholders, both governments and developers.

REWIND OFFSHORE – Comparative Analysis of International Offshore Wind Energy Development, March 2017
30
Greater flexibility in the consenting envelope can future-proof sites for the adoption of innovative,
low cost technologies
The degree of flexibility possible in consenting envelopes29 varies by jurisdiction. Some consenting regimes are more
rigid with regard to the wind farm design (e.g. Germany), whilst others can accept a wider range of technology
options, enabling developers to optimise the wind farm design prior to construction (e.g. UK). Given the long time
from consent to final investment decision in many countries and the pace of technology innovation, restricting
design envelopes can hinder opportunities to adopt novel cost-cutting technologies. However, this must be balanced
with the added complexity and confusion of seeking to obtain consent for a technology envelope that is too wide.
The transition to site-specific tendering also demands greater flexibility. In the Netherlands, all necessary permits
are awarded along with the subsidy contract following the auction process, before knowing who will be developing
the site. A wide envelope has therefore been adopted to cater for a broad range of technology options from the
successful bidder.
In Germany, consenting envelopes are typically more rigid, largely due to the more stringent regulations to adhere
to, including noise mitigation, thermal impact of electrical cabling, and more demanding monitoring requirements.
For this reason, final consent has been back-ended for the developer to acquire once they have been awarded a
contract for subsidy support and grid connection.
Site extensions are a cost-effective means of deploying additional offshore wind capacity
In countries with existing operational wind farms, developing site extensions could offer a lower cost and lower risk
alternative to developing new greenfield sites. Extension could be preferable due to (i) existing infrastructure in
place (ii) available of site data and (iii) greater certainty over consent. From the grid operator’s perspective, adding
extra capacity could also be easier to accommodate than connecting new remote sites. Further benefits to
developers are that site characteristics and design profiles are already well established and local communities are
already familiar with offshore wind, limiting the prospect of local objection. Extra flexibility in the consenting regime
can help to facilitate such extensions. However, it should be acknowledged that site extensions may increase wind
farm wake effects, which could impact the wind resource for nearby wind farms.
The UK has already pursued this route with a handful of successful extension projects in operation. For example,
Kentish Flats, Burbo Bank, and Walney have all been extended to add additional capacity, and several developers
are assessing the feasibility to build out sites further, including Vattenfall’s Thanet wind farm. In response to
increased demand, The Crown Estate is developing a more formal process for acquiring leases for site extensions,
which could be particularly attractive in the intensely competitive and capacity-constrained CfD auction process.
29 ‘Envelopes’ refer to the choice of design of the wind farm, for example choice of foundation, wind turbine size, turbine layout, and cable routing.

REWIND OFFSHORE – Comparative Analysis of International Offshore Wind Energy Development, March 2017
31
The quality of staff within government agencies and statutory consultees and quality of consultation
can greatly influence the length and quality of decision making
Criticism has been lodged from developers in the UK that a lack of practical capabilities in statutory consultees can
prolong consenting timelines. Cash strapped statutory consultees can struggle to retain sufficient experienced
personnel to handle the large number of consenting applications being submitted30. In the UK, developers have
sought to overcome this by entering into ‘planning performance agreements’ with the relevant authorities to ensure
the competent authority is adequately resourced and expectations are managed for when consultations will be
issued.
Scientific research studies can be used to inform and improve consenting processes
Consenting challenges relating to environmental issues typically involve uncertainties over the perceived impact of
offshore wind farms on nearby flora and fauna. With over 12 GW of offshore wind installed globally and considerable
data captured, there is an opportunity to undertake research studies that can inform and improve our understanding
of the true impact. Several research bodies and collaborative joint industry projects have been undertaken, or are
currently underway, which are aiming to bridge this gap and reduce the uncertainty and levels of conservativism in
the consenting process. However, ensuring that there is a feedback loop between scientific research and relevant
consenting authorities should be a priority.
Cumulative environmental impacts are an increasingly important issue for the industry
Increasing importance is being placed on the cumulative environmental impacts of offshore wind farms. As
deployment of offshore wind increases, there is now greater risk of cumulative impacts occurring between sites in
near proximity. Particularly as project clusters develop to improve economies of scale and optimise transmission
assets, the potential for greater impact is a concern for nature conservation bodies. Industry efforts should therefore
turn to collecting a robust body of data to better understanding the true impact. In this regard, there is value in
closer analysis of post-consent monitoring data from operational wind farms, which can be used to inform future
consenting decisions and processes (Box 9).
30 RenewableUK. 2014. Managing Regulatory and Consenting Costs for Offshore Wind. Available at: http://ruk.pixl8-hosting.co.uk/en/publications/index.cfm/managing-regulatory-consenting-costs-offshore-wind
Box 9: The Crown Estate’s Industry Evidence Programme
In the UK, The Crown Estate, along with academic and industry partners, are attempting to better leverage
scientific data through the ‘Industry Evidence Programme’ (IEP). The IEP will bring together the results of all
previous EIAs and associated post-consent monitoring from the sector, as well as related research, to produce
a sector specific Industry Evidence Base (IEB). Once gathered, the IEB will be widely consulted upon, before
being published as a living document, with future projects and monitoring studies adding to and enhancing the
evidence base. The outcomes from the research are aiming to determine the most significant issues for wind
farm consent, as well as the issues which are not, so that future consenting processes can be streamlined
accordingly.
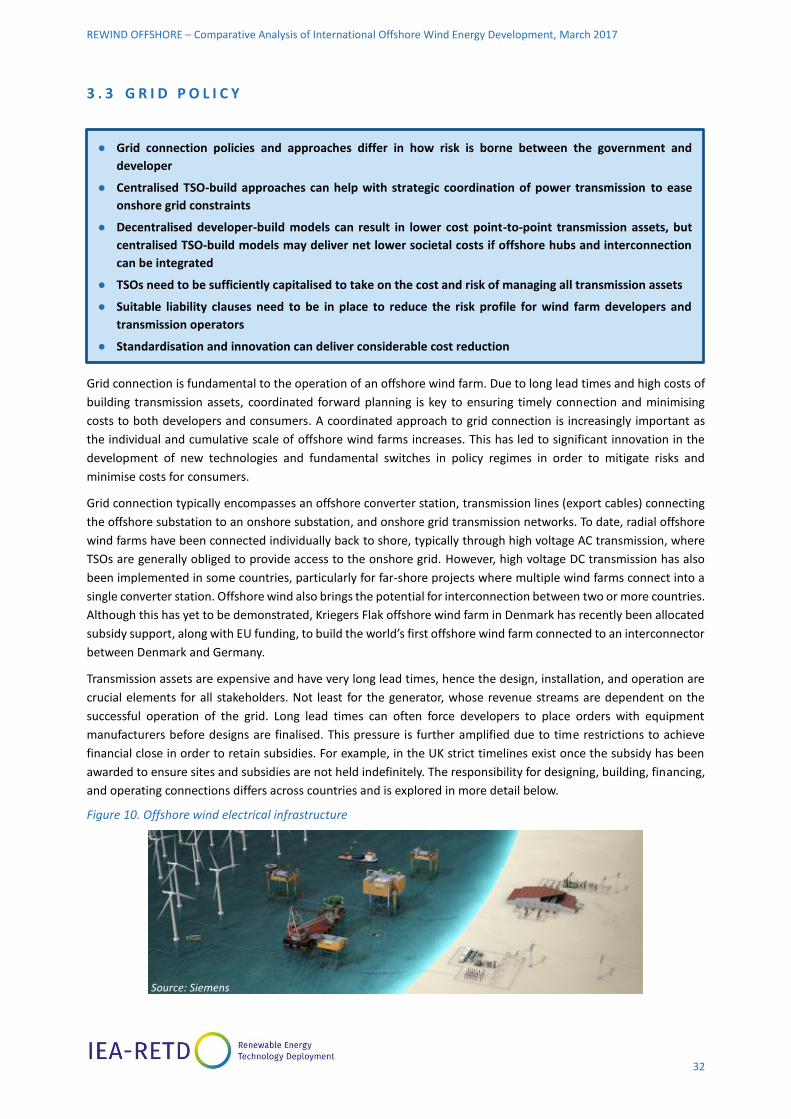
REWIND OFFSHORE – Comparative Analysis of International Offshore Wind Energy Development, March 2017
32
3 . 3 G R I D P O L I C Y
Grid connection is fundamental to the operation of an offshore wind farm. Due to long lead times and high costs of
building transmission assets, coordinated forward planning is key to ensuring timely connection and minimising
costs to both developers and consumers. A coordinated approach to grid connection is increasingly important as
the individual and cumulative scale of offshore wind farms increases. This has led to significant innovation in the
development of new technologies and fundamental switches in policy regimes in order to mitigate risks and
minimise costs for consumers.
Grid connection typically encompasses an offshore converter station, transmission lines (export cables) connecting
the offshore substation to an onshore substation, and onshore grid transmission networks. To date, radial offshore
wind farms have been connected individually back to shore, typically through high voltage AC transmission, where
TSOs are generally obliged to provide access to the onshore grid. However, high voltage DC transmission has also
been implemented in some countries, particularly for far-shore projects where multiple wind farms connect into a
single converter station. Offshore wind also brings the potential for interconnection between two or more countries.
Although this has yet to be demonstrated, Kriegers Flak offshore wind farm in Denmark has recently been allocated
subsidy support, along with EU funding, to build the world’s first offshore wind farm connected to an interconnector
between Denmark and Germany.
Transmission assets are expensive and have very long lead times, hence the design, installation, and operation are
crucial elements for all stakeholders. Not least for the generator, whose revenue streams are dependent on the
successful operation of the grid. Long lead times can often force developers to place orders with equipment
manufacturers before designs are finalised. This pressure is further amplified due to time restrictions to achieve
financial close in order to retain subsidies. For example, in the UK strict timelines exist once the subsidy has been
awarded to ensure sites and subsidies are not held indefinitely. The responsibility for designing, building, financing,
and operating connections differs across countries and is explored in more detail below.
Figure 10. Offshore wind electrical infrastructure
● Grid connection policies and approaches differ in how risk is borne between the government and
developer
● Centralised TSO-build approaches can help with strategic coordination of power transmission to ease
onshore grid constraints
● Decentralised developer-build models can result in lower cost point-to-point transmission assets, but
centralised TSO-build models may deliver net lower societal costs if offshore hubs and interconnection
can be integrated
● TSOs need to be sufficiently capitalised to take on the cost and risk of managing all transmission assets
● Suitable liability clauses need to be in place to reduce the risk profile for wind farm developers and
transmission operators
● Standardisation and innovation can deliver considerable cost reduction
Source: Siemens

REWIND OFFSHORE – Comparative Analysis of International Offshore Wind Energy Development, March 2017
33
3.3.1 Policy tools
Regulating who takes responsibility
Grid connection policy and approach across front runner countries differs in how risk is shared between the TSO,
developer, and third parties. This is characterised by the depth of charging for a wind farm developer.
● Deep charging model: Developer is responsible for constructing and operating all offshore transmission assets,
often including onshore reinforcements (i.e. onshore substation and cable routing). Example: United States.
● Shallow charging model: Developer is responsible for intra-array cabling and offshore substation. TSO provides
transmission infrastructure to export electricity back to shore. Example: Germany.
● Super-shallow charging model: Developer is responsible for intra-array cabling and connection into a substation
only. TSO provides substation, export cabling, and onshore reinforcements. Example: Denmark.
● Hybrid deep-shallow model: Variants on the models above. This can entail a developer constructing the
offshore assets but transferring ownership and operation to a TSO or third party. Example: United Kingdom.
The efficacy and trade-offs of each approach is explored below, but it should be noted that this is heavily dependent
on local context, including available capacity in existing transmission networks, locations of offshore wind farms,
and institutional structures.
Figure 11. Overview of responsibility for construction and operation of offshore transmission assets (orange: developer responsibility; blue: TSO/third party responsibility)
China (mainland)
Chinese Taipei
Japan
United States
France
United Kingdom1
Germany
Netherlands
Denmark2
Belgium3
1 Developer builds assets, sells to OFTO (who operate the asset), and developer pays fee for usage. OFTO-build model, whereby a third party constructs the offshore assets, is also available but has yet to be implemented. 2 Official offshore tender – TSO responsibility for grid connection; Open door or Nearshore – developer responsibility. 3 Developer can choose to build grid connection and receive higher FIT (€150/MWh vs. €138/MWh).
Hybrid
Super-shallow
Shallow
Deep

REWIND OFFSHORE – Comparative Analysis of International Offshore Wind Energy Development, March 2017
34
Denmark were an early adopter of a centralised super-shallow model, whereby the TSO (Energinet.dk) provides the
necessary offshore transmission assets. The Netherlands is also currently transitioning to a super-shallow model in
which TenneT, the state owned TSO, is rolling out a series of grid expansion schemes in line with the offshore
development plan. As well as construction and operation of assets, this centralised approach entails the TSO taking
responsibility for a greater share of the preliminary works, including grid permitting.
The far-shore location of offshore wind farms in the German North Sea has necessitated the use of high voltage DC
transmission, under a shallow model in which the TSO, TenneT, constructs the DC transmission assets and provides
an AC connection point for nearby wind farms. Developers are responsible for constructing the AC substation and
intra-array cabling. In the Baltic Sea, wind farms are connected by AC transmission, administered by the TSO,
50Hertz.
The UK, favouring increased market competition, has adopted a more decentralised hybrid model that includes third
party owners, known as Offshore Transmission Operators (OFTOs). Construction of transmission assets is typically
undertaken by the developer, who are mandated to sell the assets on to an independent offshore transmission
operator (the OFTO). OFTOs are also eligible to build the assets, but despite strong backing by the UK regulator,
Ofgem, and the necessary legal provisions in place, no developers have elected to undertake an OFTO-build
approach. This is largely due to concerns over an OFTO’s ability to deliver on time and on budget, as well as take on
the high risks and costs involved, which are better placed with utility developers.
Most emerging markets, where deployment has been limited to date, appear to favour a deep charging model where
project developers are required to construct and operate transmission assets. As these markets mature and
deployment volumes increase, countries may consider transitioning to shallow charging models. The relative
strengths of the different approaches, as well as challenges to implementation, are discussed further in the
proceeding sections.
Developer vs TSO responsibility
From a developer’s perspective, the ‘developer build’ deep-charging model provides greater control and certainty,
lowering the risk of connection delays. Greater control over the construction and operation of their assets enables
developers to strategically steer decisions over design, innovation, and construction and operation strategies.
However, responsibility for the construction and operation of offshore transmission assets does expand the scope
of activities and level of financing required by the developer, which can impact on the cost of capital for project
financed wind farms.
While a developer-build model arguably results in a lower cost point-to-point transmission asset, in some countries
there are benefits from greater central coordination of onshore and offshore grid networks, which can lower costs
and risks from a systems perspective. This is particularly relevant in countries with onshore grid constraints (e.g.
Germany; see Box 10). Phased deployment with a clearly defined schedule can also help to mitigate potential supply
chain bottlenecks and provide greater visibility for the TSO to coordinate necessary onshore upgrades. This latter
approach has been adopted by the Netherlands.
Table 5 provides a comparison of the different trade-offs across the three models from the developer and
government’s perspective. It should be noted that the approach to offshore transmission assets is very much
contextualised to the country specifics, including the flexibility of the transmission system and the institutional
structure of system operators.

REWIND OFFSHORE – Comparative Analysis of International Offshore Wind Energy Development, March 2017
35
Table 5. Comparison of the different trade-offs across the three models from the developers and governments perspective
Government Perspective Developer Perspective
Developer
Build/Operation
‘Deep model’
+ Lower cost and risk to government + Optimised point-to-point asset minimises
costs to consumers + Increased competition stimulates cost
reduction
- Less control over strategic coordination of grid assets
- Challenging to introduce converter platform hubs or interconnection
+ Greater control over the design and construction of the transmission assets
+ Reduces the risk of unforeseen or uncontrollable connection delays and lost revenue
+ Ability to introduce technology innovation to optimise assets and gain competitive advantage
- Higher cost and added construction risk for
developer - May need to take on additional debt to
finance construction
TSO Build /
Operation
‘Shallow/super-
shallow model’
+ Emphasis on security of supply, rather than cost
+ Ability to strategically build offshore hubs and coordinate onshore upgrades
+ Ability to share assets between multiple wind farms
+ Ability to standardise substation designs for economies of scale savings
- Cost to consumers may be higher if not optimised
- Limited competition can result in higher costs
+ Fewer assets to manage – lower risk provided compensation is in place to mitigate risk of downtime
+ Reduced developer investment, which can lead to lower cost of capital
- Higher risk of delays or design
inefficiencies from TSO – need adequate compensation in place to mitigate
- Risk of low incentives for TSO to maintain to a high standard – downtime causes lost revenue
- Less control over asset design
Box 10: Grid transmission assets in Germany
Onshore grid constraints are a major challenge for the German energy sector, with constraints on transmission
capacity from high load production in the North to high demand centres in the South. The bottlenecks and
delays in reinforcing the onshore transmission network is part of the reason why offshore wind deployment
targets have been scaled back in recent years. Strategically coordinated grid expansion plans have therefore
been introduced to inform the location of future offshore wind farms, which enables more proactive, rather
than reactive, planning. Placing control over grid assets with the TSOs, TenneT (North Sea) and 50Hertz (Baltic
Sea), helps to implement this more coordinated approach. For example, upcoming auction rounds will initially
be limited to wind farms in the North Sea only, due to grid constraints affecting projects in the Baltic Sea.
Another driver for TSO control over offshore grid assets is the far-shore
location of several North Sea offshore wind farms, which need to be
connected by high voltage DC transmission lines and converter stations.
These DC substations act as hubs for nearby wind farms to connect into.
Given the complexity of multiple party ownership of such high cost and
important assets, TSO ownership mitigates the risk of conflicts and
complex charging methods that would be required from developer
ownership.
Source: TenneT

REWIND OFFSHORE – Comparative Analysis of International Offshore Wind Energy Development, March 2017
36
Government Perspective Developer Perspective
- High cost and risk sitting with TSO to build and manage all offshore assets – TSO needs to be suitably capitalised to take on risk
- Public ownership exposes consumers to high risk if TSO is liable to pay compensation
Third Party
Build/Operation
(e.g. OFTO)
‘Hybrid model’
+ Meets objective to unbundle the energy sector
+ Greater competition for asset operation can lower costs for consumers
+ Greater transparency of costs to consumers
- Third party may not be capitalised in such a way to manage risks of expensive assets
+ Fewer assets to manage – lower risk provided compensation is in place to mitigate risk of downtime
+ Reduced developer investment, which can lead to lower cost of capital
- Less control over asset maintenance – risk
of revenue losses - Challenging interface between wind farm
operator, third party, and onshore TSO - Stringent availability targets and
meaningful penalties are required to ensure efficient operation and maintenance of transmission assets
Grid planning
A centralised approach to grid planning assigns the lead authority and its sister government agencies with the
responsibility to plan onshore and offshore transmission upgrades in an effective manner. From a societal
perspective, central planning of offshore wind development can ensure alignment with necessary grid upgrades and
mitigate the risk of connection delays.
In contrast, a decentralised model can make it difficult for the TSO to plan upgrades effectively. With limited visibility
on the sites that will secure subsidy contracts, TSOs may struggle to plan where and to what capacity upgrades will
be required. In addition, strict timescales post-auction can add to these challenges, leaving little lead time to
implement necessary grid reinforcements. This is particularly relevant as wind farms reach GW scale, where onshore
networks are impacted more significantly.
However, the preferred option is heavily dependent on local context. If the onshore grid network has sufficient
capacity and flexibility to accept additional GW scale capacity with shorter lead times, a developer controlled model
may result in lower cost point-to-point transmission assets. Conversely, if the onshore grid is more heavily
constrained, a centralised approach can facilitate tighter control over the scale and timing of new capacity.
Centralised approaches can also enable multiple projects to share electrical infrastructure, although the merits of
this approach diminish as individual project size increases, since each project is likely to require its own substation.

REWIND OFFSHORE – Comparative Analysis of International Offshore Wind Energy Development, March 2017
37
Grid permitting
Grid permits are required in order to construct and operate grids. This typically involves filing for and acquiring
permits, examination of options, and technical studies. In a centralised model, permits and power purchase
agreements are secured by the government in advance of subsidy contract award. This reduces risk for the developer
and shifts the cost of development work on to the government. In a decentralised model, there is a higher risk that
the developer does not obtain the permits required to secure the connection. In the UK, this is typically mitigated
to an extent by the need to secure a connection offer before being eligible to enter auction rounds. However, deep-
charging models can increase the prospect of litigation and or opposition from statutory consultees which could
result in the cable route being re-directed (i.e. to avoid environmental impacts or simply to connect to the best
onshore point connection) and result in higher costs for wind farm developers. Securing power purchase agreements
is also a key challenge in the United States, where several projects have struggled to secure offtake agreements with
state utilities (see Box 12).
Transmission asset construction
Box 11: Planning for upgrades in the UK
The UK’s electricity grid infrastructure is old and whilst it has been upgraded over time and reliably delivers
power, it experiences north-south capacity constraints and limitations on where new high-voltage current can
be interconnected. With the build out of several large power generation sites at Round 3 development zones,
such as East Anglia, Hornsea, Moray Firth, and Dogger Bank, onshore upgrades are likely to be required.
To date, the UK has followed an ‘invest then connect’ approach, where developers apply for connection to the
transmission network and the transmission licensee (National Grid, SSE, or Scottish Power) makes an
assessment of the transmission network reinforcement required to connect the new generation unit(s). The
developer must then wait for these grid reinforcements to be completed by the TSO before it can connect to
the network. This delay can be of an indeterminate period, depending on the rapidity of the TSO and if and how
quickly planning approval can be secured.
Box 12: Power purchase agreements in the United States
The ability to secure a power purchase agreement (PPA) with utilities has been a major obstacle to offshore
wind development in the United States. A PPA is an agreement between the wind farm generator and utility to
purchase the electricity at an agreed price. With the US market currently dominated by small independent
power producers (IPPs) and foreign developers (i.e. lack of active US utilities developing offshore wind farms),
PPAs are essential to enabling projects to proceed.
However, the high relative cost of offshore wind in the United States, particularly for early projects, and a lack
of regulation to mandate the purchase of renewable or offshore wind energy, has left several project developers
without a route to market. For example, two Department of Energy (DOE) funded demonstration projects – the
30 MW WindFloat pilot project off the coast of Oregon and Fishermen’s Energy’s 24 MW project in New Jersey
– have stalled and lost funding support having missed deadlines to secure PPAs. Several other projects are still
in negotiations to obtain the necessary PPAs to proceed with construction, but have suffered from delays and
greater uncertainty of securing an off-take agreement.
This barrier is being mitigated in some states by the introduction of legislation which mandates utilities to
procure electricity from offshore wind. Massachusetts, for example, have enacted an energy bill which includes
a requirement for utilities to enter into long-term contracts for 1.6 GW of offshore wind by 2027.

REWIND OFFSHORE – Comparative Analysis of International Offshore Wind Energy Development, March 2017
38
The timing of grid construction is critical to ensure that there is fully operational grid infrastructure in place when
the offshore wind turbines have been commissioned and are ready for operation. Building out offshore transmission
assets and onshore grid reinforcements is a lengthy and costly process, which often precludes anticipatory works
from being undertaken. This creates a short lead time to construct the transmission assets, leading to the risk of
connection delays.
In a deep-charging model, the developer has greater control of when to start construction and can ensure that this
fits within the development plan. In addition, developers can seek to leverage vessels already under contract to
support the process and ensure that delivery is coordinated with the rest of the wind farm construction schedule.
In a centralised shallow-charging model, where the TSO takes the lead, there is higher risk to the developer that the
grid assets are not built on time, leading to lost revenue, as experienced in Germany (see Box 13). However,
centralised planning can also be designed to reduce the risk of supply chain bottlenecks and mitigate risks for wind
farm developers. Stable and phased deployment of offshore wind with clearly defined timescales can allow TSOs to
plan delivery schedules with longer lead times to avoid potential bottlenecks and support standardisation in the
construction of large converter platforms. Suitable compensation is also a key requirement to alleviate risk in the
event of delays.
The ability to plan and coordinate ahead of time contrasts to the decentralised approach where developers and
TSOs must be more reactive to auction wins, creating a short turnaround from contract award to meeting delivery
milestones. DONG Energy’s model for standardised substation units mitigates this risk to some extent, but only
applies to developers with a sufficiently large portfolio who can spread risks and achieve economies of scale across
a number of projects.
Capitalisation of asset owners
A key requirement for a centralised grid connection model is that the TSO is sufficiently capitalised to take on the
high cost and risk of delivering transmission assets to all of a country’s wind farms. This has proved particularly
challenging in Germany, where grid delays were partly attributed to the high cost and limited lead time for TenneT
to deliver the necessary transmission networks. Public ownership of TSOs can help to mitigate this risk and there
may need to be a mechanism for TSOs to raise the necessary capital. For example, in the Netherlands the
government have a majority stake in TenneT, who have also been able to raise capital through green bonds, co-
investment with equity partners, and debt finance. Coordinating and scheduling a phased delivery of assets can ease
these challenges by facilitating a more even spend profile for TSOs.

REWIND OFFSHORE – Comparative Analysis of International Offshore Wind Energy Development, March 2017
39
Box 13: Grid connection delays in Germany
Offshore wind development in Germany has suffered considerable
setbacks as a result of grid connection delays in the North Sea.
Cause: Having announced a highly ambitious schedule for offshore wind build out, the compressed timeline
and scale of build proved too costly and risky for TenneT to take on. The spike in project development left
TenneT needing to supply 5 HVDC units in a single year, with limited lead time to plan accordingly. The
bespoke custom build required for each substation and added complexity of new HVDC technology also
contributed to the additional time required to deliver the assets.
Most critical was the financial burden this imposed on TenneT, who were not suitably capitalised to take on
the high cost and risk of the proposed construction pipeline, leaving a €5bn hole, almost half of the total
finance required. As a private company, TenneT were unwilling to take on significant levels of debt finance
and had to sell stakes to external investors (e.g. Mitsubishi) and issue green bonds in order to free up the
necessary capital, with the added time leading to considerable delays.
Impact: The impact of project delays has been extremely damaging to industry confidence and suppliers,
leading to national targets being scaled back. Lower deployment levels have limited opportunities for
suppliers to secure market share, losing early mover advantage that could have been gained in the European
market. There were also financial losses incurred by suppliers who had invested ahead of time in anticipation
of orders, hitting revenue streams, particularly in high cost infrastructure, such as installation vessels.
Delays have also been damaging to project developers, who have incurred higher development expenditure
as a result of the delays. Some developers have even incurred costs of having to use diesel generators to
keep turbines operating in necessary working conditions. Later commissioning dates also increase the risk of
projects missing out on preferential remuneration tariffs, with some projects slipping into competitive
auctions where margins will be far tighter.
Mitigation: The delays incurred have triggered the introduction of new
regulation to limit the risk exposure for grid operators. This includes the
adoption of an offshore grid development plan to coordinate transmission
upgrades to a more manageable schedule and the introduction of liability
clauses that limit the risk exposure of the responsible TSO. TSOs are now
able to postpone grid connection dates up to 30 months prior to
completion date, increasing risk of delays for project developers. However,
any changes made within this 30 month window will result in
compensation to wind farm owners. TSOs are also liable to penalties of up
to €110m per year for delays to connection timelines.
Developers are entitled to compensation of 90% of their lost revenues from any delays to connection or
downtime suffered during operation. Alternatively, developers may accept an extension to the feed-in tariff.
It should be noted that developers are only entitled to compensation when continuous downtime exceeds
24 hours, which can increase developer risk and leave no compensation for intermittent downtime over
shorter timeframes.
Learnings: The challenges encountered in Germany have served as important lessons for the industry, which
have been taken on board by RVO and TenneT in their approach to grid connection in the Netherlands. Long-
term planning with capped tendering rounds will result in phased build out at predefined intervals, with
standardised substation designs rolled out across all 5 wind farm zones to aid more efficient production lines.
Visibility and long lead times also mitigates the risk of supply chain bottlenecks. Moreover, liability clauses
have been adopted that will provide compensation to wind farm operators in the case of any delays or
downtime.
Source: Siemens

REWIND OFFSHORE – Comparative Analysis of International Offshore Wind Energy Development, March 2017
40
Grid operation
The operation of the transmission assets is important to ensure (i) a secure supply of electricity is available for the
TSO to call upon to meet energy demand and (ii) secure revenue streams for the owner/operator. A centralised
model allows the developer to run a leaner operation which focusses on operating a smaller number of assets.
Where transmission assets are owned and operated by third parties or TSOs, availability targets are adopted to
incentivise efficient operation to limit the risk of downtime for developers. In the UK, Ofgem has set an availability
target of 98% for OFTOs to achieve31.
However, appropriate penalties need to be in place to ensure that these availability targets are met. This is a critical
aspect of grid policy which must balance considerable financial risk between developers, third parties, and
consumers. Full compensation for lost downtime is preferable for developers but can equate to high cost to asset
owners, which may be beyond the financial capabilities of third parties or could result in high costs to consumers.
Proportional compensation can mitigate this risk for asset owners but places considerably higher risk on developers,
who are more exposed to financial losses from periods of downtime. Downtime may also have to exceed a
prescribed period of time to warrant compensation. For example, in Germany, developers are only compensated for
continuous downtime exceeding 24 hours; although 90% of lost generation is covered after this point.
Standardisation versus innovation
A centralised model provides the ability to standardise cables and substation design over multiple sites, allowing for
serial production that unlocks economies of scale. In contrast, a decentralised model provides opportunity for
greater developer control to produce lower cost point-to-point assets. For developers with a large project portfolio,
standardisation might also be possible if a developer’s portfolio is large enough. For example, DONG Energy have
developed a standardised converter platform design which can be serially fabricated and deployed in multiple
projects across Europe.
Commonly, standardisation and innovation are not viewed as wholly compatible and risk stifling the development
of one another. However, if designed appropriately, standardisation and innovation can both be incorporated into
transmission asset design. Both the examples of DONG Energy and TenneT NL (see Box 14) demonstrate how
technology innovation can be incorporated in standardised designs which are future proofed to adapt to emerging
technology trends.
31 OFGEM. 2014. Offshore Transmission OFTO Revenue Report. Available at: https://www.ofgem.gov.uk/ofgem-publications/91890/es902offshoreoftorevenuereportweb.pdf

REWIND OFFSHORE – Comparative Analysis of International Offshore Wind Energy Development, March 2017
41
Interconnection
Interconnection between countries is priority in the EU with the increasing push to integrate offshore renewables32.
The EU has a target of 10% of interconnection capacity between neighbouring countries of their installed electricity
production capacity by 2020, with an increase to 15% by 2030 having been proposed33. Benefits of increased
interconnection include: more reliable system lowering the risks of blackouts; reduced need to build new power
stations; lower societal energy costs; the ability to better manage intermittent renewables; and in some cases allows
for the development of more renewable energy sources, which can support decarbonisation efforts.
32 See the EU E-Highways 2050 and the NSCOGI (North Sea Countries Offshore Grid Initiative) for more information.
33 European Commission. 2015. Connecting power markets to deliver security of supply, market integration and the large-scale uptake of renewables. Available at: http://europa.eu/rapid/press-release_MEMO-15-4486_en.htm
Box 14: Netherlands – TenneT approach to offshore substations The transition to a centralised development model in the Netherlands (part of the national roadmap for offshore wind) has shifted the responsibility for constructing and operating offshore transmission assets to state-owned TSO TenneT. The roadmap for offshore wind development consists of a 5 year phased deployment of 700 MW per year. The equal size of wind farm capacity has partly been enforced to enable TenneT to standardise the design of the offshore transformer, unlocking economies of scale to deliver cost reduction. Five identical substations have been designed following extensive consultation with stakeholders and adopting learning from their German counterparts, where bespoke substation designs contributed to higher costs and construction delays. Engagement with industry suggested that 700 MW was an optimal size for the transformer, big enough to cater for large scale projects but of sufficient size to align with supply chain and infrastructure capabilities for fabrication and installation. The designs have been future proofed for near term technology innovation, with the ability to accept 66kV inter-array layouts. The centrally coordinated approach has also allowed for optimal cable siting, whereby 220kV export cables will come to shore only 1km away from the existing 380 kV onshore substation. For each 350 MW wind farm, 30 MW of overplanting has been allocated to stay outside of the compensation scheme. The visibility and annual phasing of delivery will allow both TenneT and equipment suppliers to plan accordingly, both in terms of managing production lines and undertaking necessary onshore grid reinforcements. The first substation is expected to be tendered in 2017 for operation in 2019, with annual additions for the following 5 year period. This long lead time will mitigate potential supply chain bottlenecks, resulting in lower fabrication costs. Internal cost analysis from TenneT suggests that this approach will deliver a net lower societal cost relative to a developer build model (RVO Development Framework for Offshore Wind Energy, 2016).
Source: Offshorewind.biz

REWIND OFFSHORE – Comparative Analysis of International Offshore Wind Energy Development, March 2017
42
Where centres of activity are focalised, there are opportunities to interconnect offshore wind farms with each other
and to connect to established or newly planned interconnectors (see Box 15). A centralised approach makes it easier
for international parties to collaborate and to integrate interconnection, namely due to reduction in parties involved.
For example, TenneT’s presence in both the Netherlands and Germany could streamline and simplify commercial
arrangements, whereas the OFTO regime in the UK could make interconnectivity more complex in terms of the
number of parties and interfaces involved.
Box 15: Kriegers Flak Combined Grid Solution
The Danish and German TSO’s responsible for the Baltic Sea, Energinet.dk and 50 Hertz, plan to deploy the
world’s first integrated interconnection with an offshore wind farm, known as the ‘Kriegers Flak- Combined
Grid Solution’. The CGS will connect eastern Denmark with the German state of Mecklenburg Western
Pomerania with a planned transfer capacity of 400 MW. The aim of the project is threefold: firstly, to increase
the supply of renewable energy to EU consumers; secondly, to strengthen regional energy markets; and
lastly, to increase security of supply.
Vattenfall will develop the 600 MW Kriegers Flak project, having been awarded a subsidy contract of just
€49.9/MWh from the tender auction, a new landmark low for the industry. The interconnection link will pass
through two German wind farms, EnBW’s 288 MW Baltic 2 wind farms, which lies 30km adjacent to Kriegers
Flak. Frequency transformation will be required due to Germany and Eastern Denmark operating on two
different synchronous areas. This will be addressed through two voltage source converters (VSC) and
offshore transformers. Two submarine cables will connect the wind farms with the onshore network.
The interconnection has been awarded a PCI (Project of Common Interest) status by the European
Commission and will received up to €150m of financial support from the European Energy Programme for
Recovery. It is expected to receive a permit in 2017, with construction, installation and testing to take place
between January 2017 and December 2018.
Source: Wind Power Offshore, 50Hertz, Renewables-Grid.EU

REWIND OFFSHORE – Comparative Analysis of International Offshore Wind Energy Development, March 2017
43
3.3.2 Lessons learned
Grid connection policies and approaches differ in how risk is borne between the government and
developer
Different policy approaches have emerged to managing the planning, design, construction and operation of
transmission assets across front runner countries. Three key approaches exist: a decentralised model where the
developer is heavily involved; a centralised model where the government takes the lead; and a third party ownership
model where a third party is appointed to manage transmission lines. Stakeholder consultation suggests each
approach as its advantages and trade-offs, with the most appropriate approach dependent on local context,
including the degree of onshore constraints and ability of the grid operator to take on the cost and risk of multiple
transmission assets. There are strong benefits to unbundling grid ownership, competitive tendering, and having a
single system operator for both the onshore and offshore grid infrastructure, but finding the correct balance is highly
dependent on local context and the prevailing market conditions and regulatory regime.
Decentralised developer-build models can result in lower cost point-to-point assets, but centralised
TSO-build models can ease onshore grid constraints and may deliver net lower societal costs
Recent industry trends have seen a transition from decentralised models (government-build) towards more
centralised models (government/TSO build). While developer-build models are likely to result in lower cost point-
to-point assets, given the increased incentives to deliver cost reduction and optimise asset design, a centrally
coordinated and managed approach can be beneficial in enabling strategic coordination of transmission upgrades.
This is particularly beneficial in countries where onshore grid constraints are a major issue and/or where far shore
offshore projects can benefit from shared electrical infrastructure (e.g. Germany). Greater coordination and sharing
of assets, as well as greater interconnection, could lead to lower societal costs. However, a centralised approach will
require TSOs to be suitably capitalised to take on the high cost and risk of building extensive offshore transmission
assets.
Greater coordination and strategic planning is expected to be required as offshore wind deployment
increases
The need for greater coordination between offshore and onshore transmission networks is particularly important
as individual project and cumulative capacity of offshore wind increases. Whilst grid networks across Europe have
generally been able to accommodate the current levels of offshore wind to date, future development plans, which
aim for GW scale wind farms, could pose significant challenges to onshore grid operators. The challenge of
connection such large scale capacity is often under-estimated by policy makers, as these entail high costs, long lead
times, and lengthy stakeholder discussions, as well as public consultations. The example of the Netherlands
demonstrates that a clear and stage-gated approach to developing offshore wind can provide the TSO with the
visibility required to mobilise resources to build out and reinforce the grid. There is therefore the need to go beyond
dialogue and stimulate collaboration between developers, offshore grid operators, transmission system operators,
and regulators to define a harmonised vision, approach and support schemes.
Strong incentives and penalties are required to ensure transmission availability is maintained
If the responsibility for the transmission assets is instilled to a TSO or third party, it is important to ensure that
adequate policies are put in place to ensure that availability targets are met. Stakeholder engagement suggests that
many developers prefer to maintain control of grid assets, due to the added risks of connection delays if
responsibility is held by a TSO or third party. However, if a centralised approach is adopted, it is important to ensure
that suitable provisions are in place to manage liability and provide compensation to wind farm developers if delays
are incurred, as well as downtime during operation.

REWIND OFFSHORE – Comparative Analysis of International Offshore Wind Energy Development, March 2017
44
Standardisation and innovation can both deliver considerable cost savings
The industry has proven it can innovate and reduce costs with the provision of large orders. Both the centralised
and decentralised models can support both innovation and standardisation. While the centralised approach is more
aligned to standardisation, industry engagement on prevailing technology trends can ensure that designs are future
proofed to incorporate novel innovations. The developer-led decentralised approach arguably increases drivers for
design optimisation and innovation to deliver lower costs to wind farm operators, while a degree of standardisation
is still possible, particularly for developers with larger project portfolios. However, ultimately, in order for this to be
possible long term market visibility is required, backed up by transparent and stable policies.
Electricity markets need to be designed to reward the system benefits of offshore wind
Offshore wind is a scalable and flexible energy technology with high load factors which exceed those of other
renewable energy sources, such as onshore wind and solar PV. As a flexible electricity generator, offshore wind can
also be an effective tool for load balancing in an electricity system with an increasing share of decentralised and
intermittent renewable energy, thereby reducing the need for reserve generation capacity. These system benefits
can support national goals on energy security and reducing costs to consumers, but are not rewarded under the
current design of electricity markets, which typically prioritise energy technologies according to their levelised cost
of energy (LCOE). To fully account for and reap the benefits of offshore wind development, governments should look
beyond LCOE to also consider wider benefits for the electricity system, as well as alignment with domestic industrial
policy. Adequate incentives will need to be embedded within the electricity system to reward generators for the
added flexibility in meeting load balancing requirements.

REWIND OFFSHORE – Comparative Analysis of International Offshore Wind Energy Development, March 2017
45
3 . 4 I N C E N T I V E M E C H A N I S M S
Although rapidly maturing, compared to other electricity generation sources (such as coal, gas, onshore wind, solar
PV) offshore wind is a relatively nascent energy technology that requires public funding support to stimulate
deployment. A range of incentive mechanisms have been introduced in different countries and at different stages
of market maturity to attract the inward investment necessary to initially demonstrate the technology and
progressively increase deployment levels, reaching the volumes of scale needed to drive down costs. The recent
cost reduction observed in industry is largely the outcome of stable policy frameworks in several markets which
have adopted attractive incentive mechanisms.
The most effective incentive mechanisms in catalysing deployment have been those that have reduced the level of
risk for developers and investors, providing greater certainty that they will be able to recover costs. However,
incentive mechanisms must strike a balance between offering attractive profit margins to risk-averse investors whilst
avoiding unreasonable costs for the end-user. This can be achieved by balancing a number of design considerations,
as detailed further below.
As industries have matured, incentive mechanisms in offshore wind have evolved to transfer risk from government
to private investors, reducing the level of public expenditure and creating more competitive systems that minimise
price risk for consumers. This shift to competitive auction systems has been successful in delivering substantial cost
reduction, as evident in a number of recent contract awards across Europe. However, emerging markets should use
caution to move to competitive auctions prematurely, and must ensure that support schemes are designed
appropriately to limit risk exposure for government and industry players.
3.4.1 Evolution with market maturity
Incentive mechanisms have evolved over time in response to growing technology and market maturity. Typically,
governments will take on greater risk in early development stages with grant and fixed remuneration support
offering stability and lower financial risk for investors. As markets mature, fixed remuneration levels gradually fall
before eventually moving to competitive auction-based systems.
● Various incentive mechanism design options are available to policy makers, which balance risk between
government and developers
● Governments must balance low costs with the risk of non-delivery
● Beyond mechanism design, the most important factor is providing clarity, visibility, and stability
● Transitions from fixed-remuneration systems to competitive auctions can introduce higher allocation and
price risk and need to be managed carefully
● Emerging markets should carefully consider when to adopt competitive auction systems
● Ability to adopt competitive approach depends on domestic capabilities
● Competitive auctions should be designed to deter speculative bids and penalise non-delivery

REWIND OFFSHORE – Comparative Analysis of International Offshore Wind Energy Development, March 2017
46
Table 6. Incentive mechanism requirements by market and technology maturity
Demonstration projects Early commercial projects Large-scale commercial projects
Capital grants Fixed off-take contracts Competitive auctions
Supports early projects where costs are uncertain due to lack of experience
E.g. UK Offshore Wind Capital Grants Scheme
Market-based mechanism
Provides commercial returns for developers, based on energy generation
E.g. Feed-in premium; UK ROCs
Increased competition encourages cost reduction
Auction budgets can help to control government spend
E.g. UK Contracts for Difference
Source: Carbon Trust Analysis
While this pathway has been common in some early mover markets, such as the UK (see Box 16), it is unlikely that
this same trend will be followed in new emerging markets, particularly those in the EU where state aid and electricity
market rules are prompting a shift away from fixed remuneration levels. In the UK, a capital grants scheme was
adopted to guard against high uncertainty and risk in deploying a novel technology in challenging offshore
environments. Higher up-front funding could cover high capital expenditure and negate the need for unfavourable
debt financing. However, the greater track record and experience of deploying over 12 GW of offshore wind
internationally means that the entry point for new markets is being brought forward. This is already evident in many
emerging markets, where fixed remuneration systems are common and some are even moving directly to
competitive auctions. Grant funding still has a role to play, but this is typically reserved for higher risk technology
demonstrations.
Box 16: United Kingdom incentive mechanism evolution
The UK has used three major mechanisms to support offshore wind, and has deployed them at different times
to achieve different results. The incentives that have been used are:
● Offshore Wind Capital Grants Scheme (2002-2012): The Offshore Wind Capital Grants Scheme was designed
to stimulate an initial pipeline of project proposals that would be used by the government to gather data on
sites and project costs, and to inform the design of future incentive cost structures and cost levels. High up-
front funding support reduced risk for developers of these early and smaller scale projects, typically <100
MW in capacity. The Capital Grants Scheme funded just over 1 GW of offshore wind in the UK, before
transitioning to the RO regime.
● Renewables Obligation (2002-2017): The Renewables Obligation (RO) pushed electricity suppliers to source
low carbon electricity and also provided financial incentives for different types of renewable energy,
including offshore wind. Renewable Obligation Certificates (ROCs), dictated by auction, were issued to
developers in addition to wholesale power price. Low allocation risk and a 20 year support structure helped
to incentivise considerable activity in the UK, supporting ~5.5 GW of deployment.
● Contracts for Difference (2017-Present): New mechanism following Electricity Market Reform (EMR) in the
UK to provide greater certainty on the expected revenue generated by renewable projects. Contracts for
Difference provide a fixed level of support over a 15 year period, giving project developers a more predictable
level of financial support than the RO and therefore greater confidence in the economic viability of their
projects. A shorter 15 year support period is also more favourable, providing more up-front remuneration to
pay off debt financing on large scale commercial projects. Increased competition has been successful in
driving down costs, but this change in mechanism design has created uncertainty through higher allocation
and price risk for developers.
Together, these incentives have been designed to carve a path for offshore wind from a position of weak data,
high costs, and high risks, to one that enjoys richer data, longer term certainty, lower risk, and more investible
offshore wind development opportunities.
Maturity

REWIND OFFSHORE – Comparative Analysis of International Offshore Wind Energy Development, March 2017
47
3.4.2 Policy tools
Remuneration system design
A multitude of different remuneration systems have been adopted to stimulate renewable energy markets
worldwide across a number of technologies, including offshore wind. The most common form of remuneration is
through feed-in tariffs or premiums, which provide subsidy payments per unit of electricity generated. As of 2015,
110 jurisdictions had live feed-in tariffs policies in place, making them the most widely used policy mechanism to
incentivise clean energy production. As renewable technologies mature and transition towards competitive
auctions, sliding feed-in premiums are increasingly seen as the preferred incentive mechanism for governments. In
addition, other fiscal policies, including grants, loans and tax incentives remain important tools.
Offshore wind has been supported by a range of incentive schemes. The level of support and design of the incentive
scheme differs per country, equating to different levels of risk and cost for generators, investors, and consumers.
Governments have adopted different approaches to reduce the risk profile for investors, creating the necessary
incentives to drive deployment and cost reduction to achieve national energy goals. Lower risk for investors can
result in a lower cost of capital, resulting in a lower cost of energy and ultimately lower cost to consumers, at least
on a per MWh basis. However, governments must balance this with the total level of public expenditure available
and maximising deployed capacity over a given funding period.
A range of levers and options available to policymakers in designing suitable incentive mechanisms is outlined in
Table 7 and a summary of the different incentive mechanisms adopted across a number of leading offshore wind
markets is outlined in Table 9.
Table 7. Incentive mechanism design options
Policy tool Options Trade-off Example
Allocation Demand-led: Incentive
mechanisms are offered to all
qualifying generation.
+ Minimises allocation risk for developers,
lowering barriers to market entry.
- Exposes government to overspend risk.
UK (ROC)
Capacity constrained: Incentives
mechanism contracts are capped
by either power capacity or
budget.
+ Greater budgetary control for government.
- Increases allocation risk for developers.
UK (CfD);
NL (SDE+)
Subsidy type Feed-in tariff: Fixed level of
support, independent of the
wholesale power price.
+ Stable price reduces risk for generators.
- Higher cost to government.
- Less compatible with competitive electricity
markets.
CH; JP
Fixed feed-in premium: Fixed
level of support, in addition to
the wholesale power price.
- Generator exposed to wholesale price volatility.
+ Predictable government expenditure.
+ More compatible with competitive electricity
markets.
UK (ROC);
BE
Sliding feed-in premium: Top-up
payment between fixed strike
price and wholesale power price.
- Government exposed to wholesale price
volatility.
+ Predictable generator remuneration.
+ More compatible with competitive electricity
markets.
UK (CfD);
NL (SDE+)
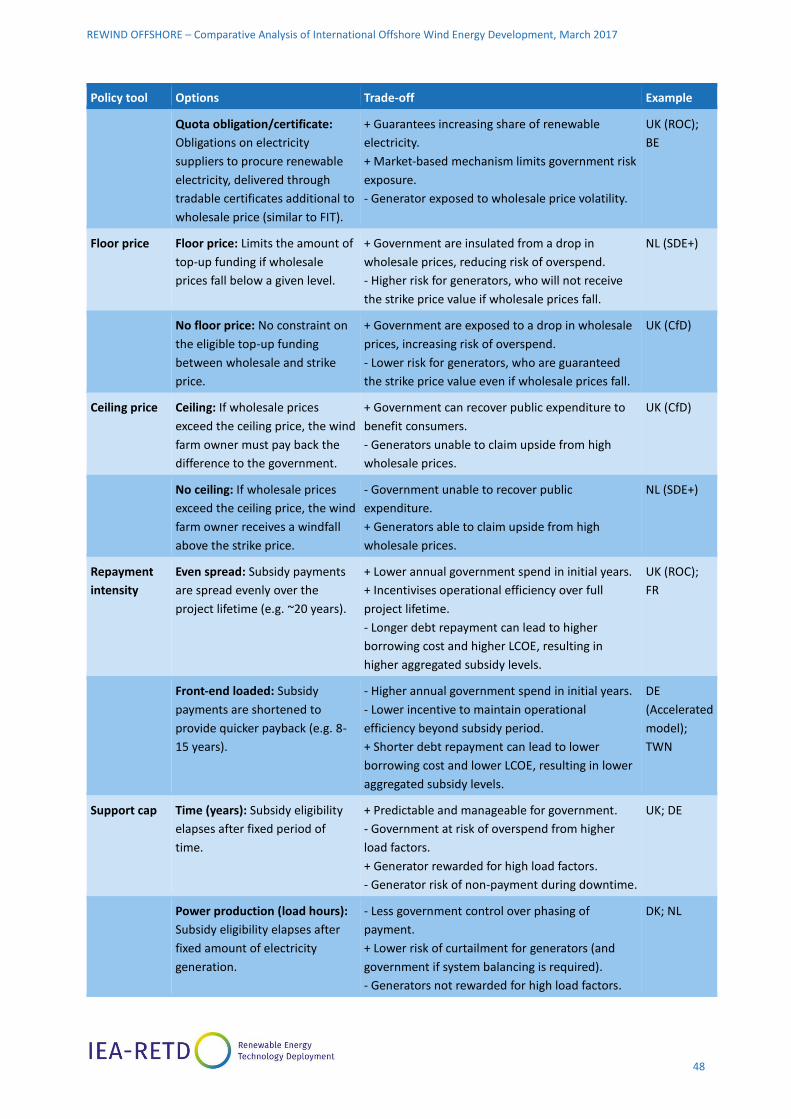
REWIND OFFSHORE – Comparative Analysis of International Offshore Wind Energy Development, March 2017
48
Policy tool Options Trade-off Example
Quota obligation/certificate:
Obligations on electricity
suppliers to procure renewable
electricity, delivered through
tradable certificates additional to
wholesale price (similar to FIT).
+ Guarantees increasing share of renewable
electricity.
+ Market-based mechanism limits government risk
exposure.
- Generator exposed to wholesale price volatility.
UK (ROC);
BE
Floor price Floor price: Limits the amount of
top-up funding if wholesale
prices fall below a given level.
+ Government are insulated from a drop in
wholesale prices, reducing risk of overspend.
- Higher risk for generators, who will not receive
the strike price value if wholesale prices fall.
NL (SDE+)
No floor price: No constraint on
the eligible top-up funding
between wholesale and strike
price.
+ Government are exposed to a drop in wholesale
prices, increasing risk of overspend.
- Lower risk for generators, who are guaranteed
the strike price value even if wholesale prices fall.
UK (CfD)
Ceiling price Ceiling: If wholesale prices
exceed the ceiling price, the wind
farm owner must pay back the
difference to the government.
+ Government can recover public expenditure to
benefit consumers.
- Generators unable to claim upside from high
wholesale prices.
UK (CfD)
No ceiling: If wholesale prices
exceed the ceiling price, the wind
farm owner receives a windfall
above the strike price.
- Government unable to recover public
expenditure.
+ Generators able to claim upside from high
wholesale prices.
NL (SDE+)
Repayment
intensity
Even spread: Subsidy payments
are spread evenly over the
project lifetime (e.g. ~20 years).
+ Lower annual government spend in initial years.
+ Incentivises operational efficiency over full
project lifetime.
- Longer debt repayment can lead to higher
borrowing cost and higher LCOE, resulting in
higher aggregated subsidy levels.
UK (ROC);
FR
Front-end loaded: Subsidy
payments are shortened to
provide quicker payback (e.g. 8-
15 years).
- Higher annual government spend in initial years.
- Lower incentive to maintain operational
efficiency beyond subsidy period.
+ Shorter debt repayment can lead to lower
borrowing cost and lower LCOE, resulting in lower
aggregated subsidy levels.
DE
(Accelerated
model);
TWN
Support cap Time (years): Subsidy eligibility
elapses after fixed period of
time.
+ Predictable and manageable for government.
- Government at risk of overspend from higher
load factors.
+ Generator rewarded for high load factors.
- Generator risk of non-payment during downtime.
UK; DE
Power production (load hours):
Subsidy eligibility elapses after
fixed amount of electricity
generation.
- Less government control over phasing of
payment.
+ Lower risk of curtailment for generators (and
government if system balancing is required).
- Generators not rewarded for high load factors.
DK; NL

REWIND OFFSHORE – Comparative Analysis of International Offshore Wind Energy Development, March 2017
49
Policy tool Options Trade-off Example
Rate of
regression
Shallow: Slow decrease in
support levels per allocation
round or commissioning date.
+ Lower risk for generators to make long-term
investments.
- Risk of government overspend / excessive
generator profit margins.
+ Greater certainty of meeting deployment
targets.
UK (ROC)
Steep: Rapid decrease in support
levels per allocation round or
commissioning date.
- Higher risk for developers to make long-term
investments.
+ Stimulates cost reduction for lower government
spend.
- Risk of stalling deployment.
UK (CfD)
Site-
neutrality
Site-neutral: Support levels are
fixed, independent of site
conditions.
+ Incentivises the most attractive and lowest cost
sites to be developed first.
UK; DK; NL
Site-specific: Additional support
levels are available to sites in
deeper water or further from
shore.
+ Provides support to develop strategically
important development zones.
- Higher generation costs will require higher
incentives.
DE
Price
indexation
Index-inflation: Strike price is
adjusted annually for inflation.
+ Guarantees suitable remuneration to reflect
changes in the broader economy.
- Less predictable cumulative revenue/subsidies.
UK; FR
No index-inflation: Strike price is
fixed, not linked to inflation.
- Real values of revenue not accounted for.
+ More predictable cumulative revenue/subsidies.
NL; DE; DK
Additional considerations for incentive mechanism design include the tax rate and whether grid connection is the
responsibility of the wind farm developers or the transmission system operator (TSO), which will impact on the level
of subsidy required. Regarding grid connection, it should be noted that the cost will still be passed on to consumers,
either through taxation or energy bills. A discussion on the cost effectiveness of each approach is included in section
3.3 (‘Grid policy’).
Tax rates are more challenging to influence, but can impact on the investment risk profile. Lower tax rates in
countries like the United Kingdom are more attractive than higher rates of taxation in countries like France and the
Netherlands. Only Belgium provides a specific offshore wind tax incentive, representing a one-off investment
deduction of 13.5% on the acquisition value34.
Auction-based incentive mechanisms
As technologies and markets have matured, competitive tendering has become increasingly prominent, with 64
countries choosing to adopt auction-based systems as the preferred mechanism to assign publically funded support.
From 2017, European Union State Aid guidelines will even mandate that energy subsidies be granted through
competitive bidding processes.
34 TKI Wind op zee. 2015. Subsidy Schemes and tax regimes. Available at: http://tki-windopzee.eu/files/2015-09/20150401-rap-subsidy.and.tax.policies-pwc-f.pdf
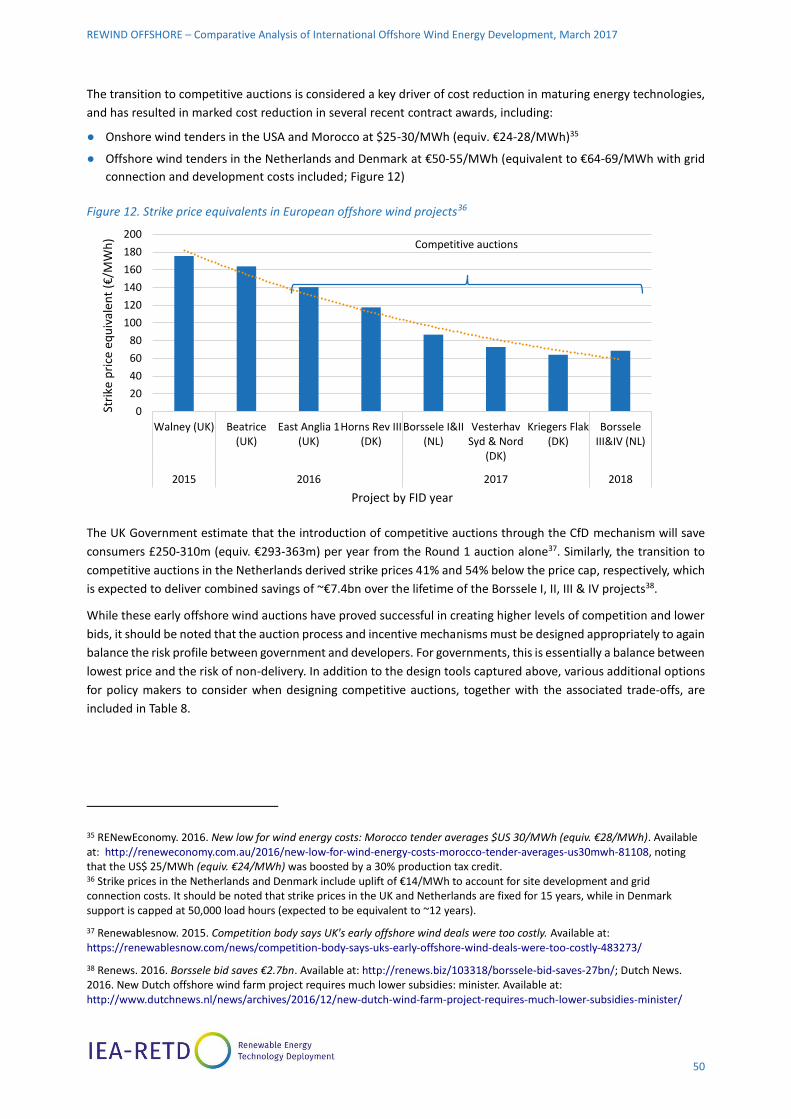
REWIND OFFSHORE – Comparative Analysis of International Offshore Wind Energy Development, March 2017
50
The transition to competitive auctions is considered a key driver of cost reduction in maturing energy technologies,
and has resulted in marked cost reduction in several recent contract awards, including:
● Onshore wind tenders in the USA and Morocco at $25-30/MWh (equiv. €24-28/MWh)35
● Offshore wind tenders in the Netherlands and Denmark at €50-55/MWh (equivalent to €64-69/MWh with grid
connection and development costs included; Figure 12)
Figure 12. Strike price equivalents in European offshore wind projects36
The UK Government estimate that the introduction of competitive auctions through the CfD mechanism will save
consumers £250-310m (equiv. €293-363m) per year from the Round 1 auction alone37. Similarly, the transition to
competitive auctions in the Netherlands derived strike prices 41% and 54% below the price cap, respectively, which
is expected to deliver combined savings of ~€7.4bn over the lifetime of the Borssele I, II, III & IV projects38.
While these early offshore wind auctions have proved successful in creating higher levels of competition and lower
bids, it should be noted that the auction process and incentive mechanisms must be designed appropriately to again
balance the risk profile between government and developers. For governments, this is essentially a balance between
lowest price and the risk of non-delivery. In addition to the design tools captured above, various additional options
for policy makers to consider when designing competitive auctions, together with the associated trade-offs, are
included in Table 8.
35 RENewEconomy. 2016. New low for wind energy costs: Morocco tender averages $US 30/MWh (equiv. €28/MWh). Available at: http://reneweconomy.com.au/2016/new-low-for-wind-energy-costs-morocco-tender-averages-us30mwh-81108, noting that the US$ 25/MWh (equiv. €24/MWh) was boosted by a 30% production tax credit. 36 Strike prices in the Netherlands and Denmark include uplift of €14/MWh to account for site development and grid connection costs. It should be noted that strike prices in the UK and Netherlands are fixed for 15 years, while in Denmark support is capped at 50,000 load hours (expected to be equivalent to ~12 years).
37 Renewablesnow. 2015. Competition body says UK's early offshore wind deals were too costly. Available at: https://renewablesnow.com/news/competition-body-says-uks-early-offshore-wind-deals-were-too-costly-483273/
38 Renews. 2016. Borssele bid saves €2.7bn. Available at: http://renews.biz/103318/borssele-bid-saves-27bn/; Dutch News. 2016. New Dutch offshore wind farm project requires much lower subsidies: minister. Available at: http://www.dutchnews.nl/news/archives/2016/12/new-dutch-wind-farm-project-requires-much-lower-subsidies-minister/
0
20
40
60
80
100
120
140
160
180
200
Walney (UK) Beatrice(UK)
East Anglia 1(UK)
Horns Rev III(DK)
Borssele I&II(NL)
VesterhavSyd & Nord
(DK)
Kriegers Flak(DK)
BorsseleIII&IV (NL)
2015 2016 2017 2018
Stri
ke p
rice
eq
uiv
alen
t (€
/MW
h)
Project by FID year
Competitive auctions
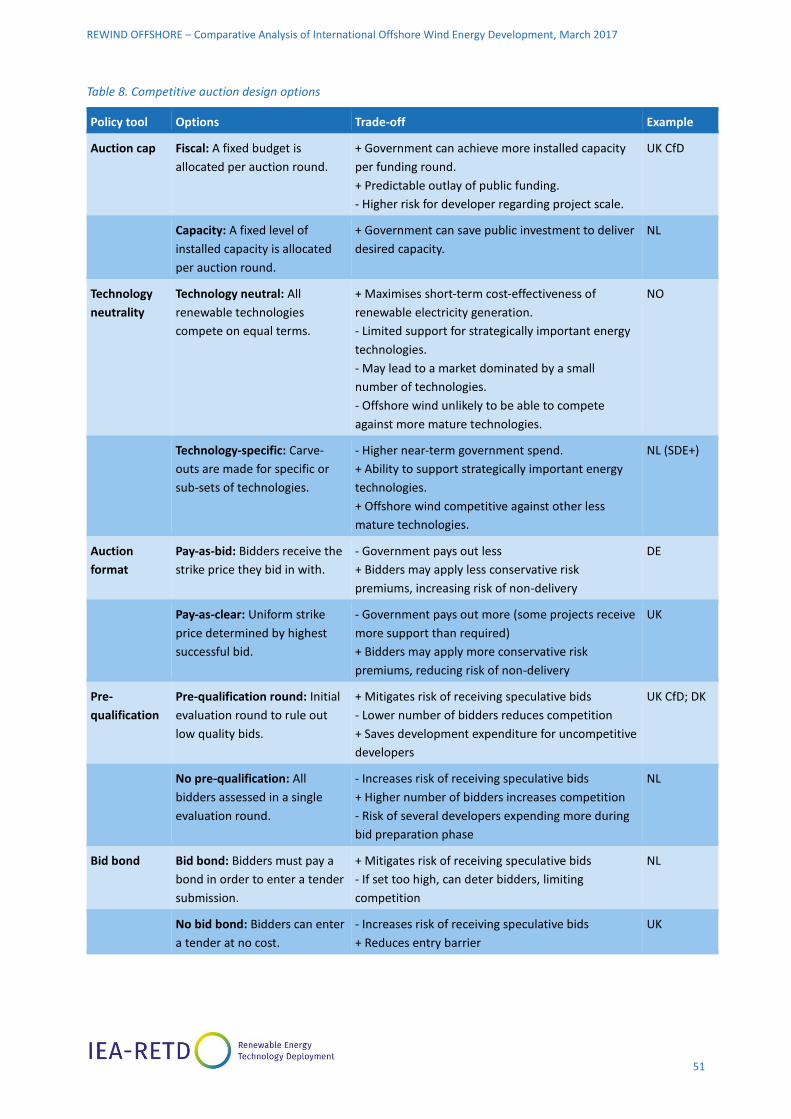
REWIND OFFSHORE – Comparative Analysis of International Offshore Wind Energy Development, March 2017
51
Table 8. Competitive auction design options
Policy tool Options Trade-off Example
Auction cap Fiscal: A fixed budget is
allocated per auction round.
+ Government can achieve more installed capacity
per funding round.
+ Predictable outlay of public funding.
- Higher risk for developer regarding project scale.
UK CfD
Capacity: A fixed level of
installed capacity is allocated
per auction round.
+ Government can save public investment to deliver
desired capacity.
NL
Technology
neutrality
Technology neutral: All
renewable technologies
compete on equal terms.
+ Maximises short-term cost-effectiveness of
renewable electricity generation.
- Limited support for strategically important energy
technologies.
- May lead to a market dominated by a small
number of technologies.
- Offshore wind unlikely to be able to compete
against more mature technologies.
NO
Technology-specific: Carve-
outs are made for specific or
sub-sets of technologies.
- Higher near-term government spend.
+ Ability to support strategically important energy
technologies.
+ Offshore wind competitive against other less
mature technologies.
NL (SDE+)
Auction
format
Pay-as-bid: Bidders receive the
strike price they bid in with.
- Government pays out less
+ Bidders may apply less conservative risk
premiums, increasing risk of non-delivery
DE
Pay-as-clear: Uniform strike
price determined by highest
successful bid.
- Government pays out more (some projects receive
more support than required)
+ Bidders may apply more conservative risk
premiums, reducing risk of non-delivery
UK
Pre-
qualification
Pre-qualification round: Initial
evaluation round to rule out
low quality bids.
+ Mitigates risk of receiving speculative bids
- Lower number of bidders reduces competition
+ Saves development expenditure for uncompetitive
developers
UK CfD; DK
No pre-qualification: All
bidders assessed in a single
evaluation round.
- Increases risk of receiving speculative bids
+ Higher number of bidders increases competition
- Risk of several developers expending more during
bid preparation phase
NL
Bid bond Bid bond: Bidders must pay a
bond in order to enter a tender
submission.
+ Mitigates risk of receiving speculative bids
- If set too high, can deter bidders, limiting
competition
NL
No bid bond: Bidders can enter
a tender at no cost.
- Increases risk of receiving speculative bids
+ Reduces entry barrier
UK

REWIND OFFSHORE – Comparative Analysis of International Offshore Wind Energy Development, March 2017
52
Table 9. International comparison of offshore wind incentive mechanisms
UK Germany Netherlands Denmark France Belgium China Chinese Taipei Japan
Subsidy type
(i) Renewable Obligation Certificates
(ROC): Feed-in premium (fixed) (ii) Contract for
Difference (CfD): Feed-in premium
(sliding)
(i) EEG 2014: Feed-in premium (sliding)
(ii) EEG 2017: Feed-in premium (sliding)
SDE+: Feed-in premium
(sliding)
Feed-in premium (sliding)
(i) Rounds 1 & 2: Feed-in-Tariff - Rounds 1 & 2
(ii) Round 3: Feed-in-Premium
Feed-in premium (sliding)
Feed-in tariff Feed-in tariff Feed-in tariff
Subsidy allocation
(i) Demand-led (ii) Competitive
(budget constrained)
(i) Demand-led (ii) Competitive
(capacity constrained)
Competitive (capacity constrained)
Competitive (capacity constrained)
(i) Rounds 1 & 2: Competitive (capacity
constrained) (ii) Round 3:
Competitive (capacity range)
Demand-led Demand-led Demand-led Demand-led
Site allocation (i) Zoning (ii) Zoning
(i) Zoning (ii) Site-specific
Site specific Site specific Zoning Zoning Open-door Zoning Open-door
Subsidy level (i) 1.8-2.0 ROCs
(ii) Determined by auction
(i) €150/MWh (20 yrs) / €190/MWh (8 yrs) (ii) Determined by
auction
Determined by auction
Determined by auction
Project specific
(i) €138/MWh excl. grid connection
(ii) €150/MWh incl. grid connection
Nearshore: 0.85 CNY/kWh
Intertidal: 0.75
CNY/kWh (1)
$199/MWh (20 yrs) Or
$233/MWh (10 yrs) &
$144/MWh(2)
¥36/kWh
Support duration (i) 20 years (ii) 15 years
(i) 20 years (front-loaded for first 8 or 12
years) (ii) 15 years
15 years (+1 year for banking if
full load hours not met)
50,000 load hours (~12 years)
20 years 20 years 20 years
(i) 20 years (fixed) Or
(ii) 20 years (front loaded for 10 years)
20 years
Floor price (i) No (ii) No
(i) Yes (ii) Yes
Yes No No No No No No
Ceiling price (i) No (ii) Yes
(i) No (ii) No
No No No No No No No
Grid connection (i) Generator build (ii) Generator build
(i) TSO build (ii) TSO build
TSO build TSO build TSO build or
Generator build
(i) TSO build Or
(ii) Generator build w/ uplifted tariff
Generator build Generator build Generator build
Corporate tax rate
20% 22.4-32.4% 25% 22% 33% 33%
(13.5% deduction on acquisition value)
25% 17% 32%
(1)equiv. € 0.12/KWh and € 0.10/KWh (2) €188/MWh, €220/MWh, and €136/MWh

REWIND OFFSHORE – Comparative Analysis of International Offshore Wind Energy Development, March 2017
53
3.4.3 Lessons learned
In general, the remuneration systems adopted in Europe have proved successful in creating an attractive investment
environment for developers. This has been reflected in high deployment volumes in countries with support schemes
that limit allocation and investment risk, such as the UK. However, several countries have had to scale back
deployment targets, in part due to inadequate incentive mechanisms that failed to stimulate the desired level of
activity. A number of lessons can therefore be learned from past experience.
Governments should engage with industry and use early projects to set the right level of support
Setting appropriate levels of subsidy support for new technologies can be challenging for policymakers. In Europe,
cases have been seen where remuneration support has been too low to stimulate activity. In Germany, for example,
the level of support set under the EEG FIT in 2004 was too low to provide a suitable return on investment for project
developers. Despite increasing the tariff in 2008, it required a further increase in 2012 to provide greater certainty
to developers of the economic viability of their projects. While influenced by other market factors which led to
increased costs, this iterative approach did not provide the stability and certainty needed for investors.
To mitigate these risks, governments in emerging markets may need to accept higher costs in early projects to
catalyse the sector, but can limit the scale of build out to minimise their risk exposure. Engaging with industry and
mandating a certain level of data sharing on project costs, notwithstanding commercial sensitivities, can then help
to inform the design of incentive mechanisms for long-term deployment. For example, the UK successfully
implemented a capital grants scheme to prove the technology and collect data to inform future design, manifested
in the highly successful Renewable Obligation, which in turn has informed strike price levels in the Contracts for
Difference regime.
Likewise, having learned from past experience, Germany will be using the upcoming Phase 1 auctions in 2017 to
determine the prescribed strike price cap for future auction rounds. However, caution should be taken with this
approach not to undermine effective bidding (i.e. discouraging low bids in early auction rounds).
Front-loading subsidy payments can reduce investor risk and deliver lower cost of energy
As financing for offshore wind has evolved from grant and balance sheet funding to project financing models with
increasing debt, so too have incentive mechanisms evolved to provide a quicker return on investment (see Box 17).
Front-loading subsidy payments to enable generators to repay loans quicker leads to a lower cost of capital and
lower cost of energy for the project. While higher up-front payment is higher risk for government, this is balanced
with the opportunity to reduce the overall level of subsidy required.
It should be noted that for developers opting for balance sheet financing, a longer subsidy duration may be
preferable. Spreading subsidy payments over the project lifetime can also incentivise efficient wind farm operation
over a longer period, and this may be preferable with developers adopting a balance sheet financing approach which
is less impacted by debt repayment.

REWIND OFFSHORE – Comparative Analysis of International Offshore Wind Energy Development, March 2017
54
An appropriate cap or assumption needs to be set on power production
When assigning public funding to support renewable energy through remuneration systems, governments must
either set a cap or make an assumption on the level of power production expected. Determining an appropriate
number of load hours or capacity factor is critical and if poorly designed can result in either limited incentives for
generators or government overspend.
In the UK, no cap is set on power production, with generators eligible to receive top-up funding through the CfD
mechanism for every unit of electricity generated. This rewards generators for maintaining high output and
optimising the performance of the wind farm. However, the UK government has been criticised in the face of
overspend to the Levy Control Framework as a result of applying an estimate on anticipated load factors that has
proved to be too low. Having applied a load factor of just 37.7% when determining the allocated budget for CFD
contracts, high load factors exceeding this level have resulted in higher payments to generators. Upcoming CFD
rounds will adopt a revised load factor assumption of 47.7%.
Emerging markets should carefully consider when to adopt competitive auction systems
Recent auction prices have demonstrated the impact of increased competition on price and with over 12 GW of
installed capacity, offshore wind technology has matured as a proven and low risk asset class. For this reason, some
emerging markets may consider moving directly to competitive auction-based systems, following the same trend
seen in onshore wind and solar PV, where countries like Chile, Argentina, and South Africa have successfully adopted
competitive systems from the outset.
However, caution should be taken in adopting a similar strategy with offshore wind, which involves more complex
offshore construction methods and may require considerable up-front infrastructure investment. Squeezing
developers and suppliers on price from the outset increases the risk of non-delivery, which could stall deployment
(see Box 18).
Box 17: Accelerated feed-in tariffs in Germany and Chinese Taipei
An example of front-loaded subsidy support is seen in the German accelerated FIT model, under the EEG 2014,
which includes a higher tariff (€190/MWh) for the first 8 years of operation, before dropping to a lower tariff
(€35/MWh) for the following 12 years. This contrasts with the standard FIT of 12 years at a modestly higher rate
(€150/MWh) before falling to the same base level (€35/MWh) for the final 8 years of operation.
The accelerated tariff is also subject to an annual €10/MWh degression from 2017 to 2019, while the base tariff
will decrease by €5/MWh over the same period. From 2021, tariffs will be determined by competitive tender.
A similar approach is being adopted in Chinese Taipei, where an attractive accelerated tariff of US$233/MWh
(equiv. €220/MWh) is available for the initial 10 years, followed by a lower tariff of US$144/MWh (equiv.
€136/MWh) for the next 10 years. Alternatively, a fixed tariff of US$199/MWh (equiv. €188/MWh) is available
for 20 years. Even though the average tariff, and total support, is higher in the fixed model, the ability to receive
more up-front payment in the accelerated model is likely to make this preferable for developers, and at a lower
total cost to government.

REWIND OFFSHORE – Comparative Analysis of International Offshore Wind Energy Development, March 2017
55
In emerging markets with limited existing supply chain capabilities and a lack of experienced market players,
adopting fixed remuneration support would reduce the risk of non-delivery, enabling the domestic market to build
capability and construction volume before transitioning to competitive auction systems. For markets with strong
supply chain capabilities or an ability to attract experienced industry players, competitive auctions may be possible
from the outset, but policy frameworks will need to be designed to balance the risk profile accordingly. For example,
a greater level of government de-risking may be required to limit the scope of responsibilities for developers and
reduce the risk of non-delivery (e.g. Denmark; see Box 19).
Box 18: Incentive mechanisms in China
China has experienced considerable project delays from adopting incentive mechanisms that have resulted in
feed-in tariffs too low to stimulate deployment. The decision to move directly to competitive allocation led to
low bids in early tender rounds, which have made projects economically unviable. Despite running the first
tender round in 2010, none of the 4 successful projects progressed until the government intervened with the
introduction of higher fixed tariffs. The delays caused have seen national deployment targets scaled back
considerably. Introduction of the fixed feed-in tariff in 2014 has stimulated more activity, with a steady
regression outlined for projects commissioned after 1st January 2017.
Table 10. Offshore wind feed-in tariffs in China
Project type First concession round FiT (CNY per KWh)
Revised FiT – before 2017 (CNY per KWh)
Revised FiT – from 2017 (CNY per KWh)
Nearshore 0.7047 - 0.7370 (equiv. €0.097 – 0.102/KWh)
0.85 (equiv. €0.12/KWh)
0.80 (equiv. €0.11/KWh)
Intertidal 0.6235 - 0.6396 (equiv. €0.086 – 0.088/KWh)
0.75 (equiv. €0.10/KWh)
0.70 (equiv. €0.098/KWh)
In addition to the feed-in tariffs outlined above, some provinces have decided to provide additional support to
stimulate local activity. For example, the Shanghai Municipal Government are offering an additional 0.2
CNY/kWh for offshore wind projects, which is triggering increased deployment in the Shanghai area.

REWIND OFFSHORE – Comparative Analysis of International Offshore Wind Energy Development, March 2017
56
Transitions from fixed-remuneration systems to competitive auctions can introduce higher allocation
and price risk and need to be managed carefully
The transition from fixed remuneration support to competitive auction systems is a logical evolution for utility-scale
renewable energy technologies, helping to drive down cost and prepare for a ‘subsidy free’ future. However, this
transition can be highly disruptive if not managed carefully. Allocation risk, in particular, in moving from demand-
led to competitive allocation can have a considerable impact on the risk profile for developers (see Box 20).
Particularly in countries adopting a decentralised approach to offshore wind development, whereby developers
must take on considerable risk and expense in developing the site, the uncertainty of a competitive auction process
could be a major deterrent to investment.
Box 19: Incentive mechanisms in Denmark
Denmark has adopted a competitive auction-based system since 2005. The Danish government has adopted a
more interventionist and centralised approach, whereby government bodies undertake considerable site
development work, including site surveys, consenting, permitting, and construction of grid assets. Projects are
then tendered on a site-specific basis at pre-construction phase. This approach is arguably more favourable
when moving to competitive auction systems in immature markets, particularly where there is limited
experience of project development. However, it should be noted that some developers have a preference for
greater control over the development process.
Table 11. Offshore wind tenders in Denmark
Project Auction Year Project capacity (MW) Strike price (øre/kWh)
Horns Rev 2 2004-05 209 MW 51.8 (equiv. €6.97)
Rodsand 2 2008 207 MW 62.9 (equiv. €8.46)
Anholt 2009-10 400 MW 105.1 (equiv. €14.14)
Horns Rev 3 2013-15 392 MW 77.0 (equiv. €10.36)
Vesterhav Syd & Nord 2016 350 MW 47.5 (equiv. €6.39)
Kriegers Flak 2016 600 MW 37.2 (equiv. €5.00)

REWIND OFFSHORE – Comparative Analysis of International Offshore Wind Energy Development, March 2017
57
To maintain investor confidence, industry needs visibility and transparency of changes to support policies. This
should include how much time or deployment should be expected before a transition to competitive auctions is
made. Providing a long lead time for developers to assess the viability of their projects in future auction rounds can
help to inform investments decisions, and limit potential sunk development costs in less attractive projects. This
level of planning also enables the supply chain to adapt and plan investment in new facilities and products
accordingly.
Technology neutrality/competition should align with national objectives
The level of allocation risk a government is willing to assign to developers is dependent on national objectives.
Where governments are looking to deliver energy at lowest cost to consumers, particularly over the short-term, a
technology-neutral approach can ensure that subsidy contracts are awarded to the most competitive forms of
generation. This approach is adopted in Norway, where high energy security and low carbon electricity is provided
through considerable hydroelectric power resources. Consequently, there has been very little offshore wind
deployment in Norway beyond a handful of innovative prototype demonstrations.
Box 20: UK transition from the Renewable Obligation to Contracts for Difference
The UK has experienced a considerable shift in the design of incentive mechanisms for offshore wind. Under
the demand-led approach of the Renewable Obligation, allocation and price risk was low, with predictable
remuneration support available (albeit subject to wholesale prices and RO certificate auction pricing). This
greater certainty of obtaining remuneration support was a key driver in stimulating the market and encouraging
private investment to develop UK sites, at a development cost of up to £70m (equiv. €82m) per project.
However, the transition to the capacity constrained and competitive CfD regime has significantly increased
allocation risk, providing lower guarantees of a route to market, as well as price risk, given uncertainty over the
strike price to be attained.
In order to maintain market confidence during the transition between regimes, the UK government introduced
a Final Investment Decision Enabling Round for Renewables (FIDeR), which awarded early CfD contracts to five
offshore wind projects in advanced stages of development, totalling >3.1 GW capacity). Despite reducing
investment risk in several projects, the contracts were awarded fixed strike prices without competition, which
has led to criticism in the wake of low strike prices achieved in the first CfD auction round and elsewhere across
Europe. The Competition and Markets Authority’s estimate that the FIDeR CfD contracts for offshore wind may
have cost £250-£310m (equiv. €293 – 363m) a year more than if they had been subject to price competition.
Table 12. UK offshore wind contract for difference (CfD) awards
FIDeR CfD contract awards CfD Round 1 auction
Burbo Bank
Extension
Dudgeon Walney
Extension
Beatrice Hornsea 1 East Anglia
1
Neart na
Gaoithe
MW 258 402 660 664 1200 714 448
£/MWh £150 (€176)
£150 (€176)
£150 (€176)
£140 (€164)
£140 (€164)
£120 (€141)
£115 (€135)
Commissioning 2017 2017 2017/18 2018/19 2019/20 2019/20 2020/21
Competitive? No No No No No Yes Yes

REWIND OFFSHORE – Comparative Analysis of International Offshore Wind Energy Development, March 2017
58
For countries with particular long-term strategic aims (e.g. industrial and energy strategies), governments may
choose to ring-fence subsidy budgets for technologies which may not be competitive in the short-term. In the UK, a
hybrid approach is adopted whereby CfD auction rounds are divided into two pots – one for established energy
technologies (e.g. onshore wind, solar PV) and another for strategically important less-established technologies (e.g.
offshore wind, biomass CHP, wave & tidal). Meanwhile, in the Netherlands, the SDE+ mechanism includes a separate
carve out specifically allocated to offshore wind.
Ultimately, the approach adopted should reflect national objectives and form part of a country’s long-term energy
strategy. But with EU State Aid guidelines pushing towards greater technology-neutrality, there may be increasing
pressure for offshore wind to compete with other electricity generation sources, particularly if costs continue to fall.
Competitive auctions should be designed to deter speculative bids and penalise non-delivery
While competitive auctions are an effective tool to drive cost reduction, without the necessary breaks in place a
government can be exposed to speculative low bids that result in non-delivery, as seen in the first concession tender
in China. To limit exposure to such risk, governments can design tendering systems to deter speculative bids and
penalise non-delivery (see Box 21). Policy instruments include:
● Pre-qualification rounds consist of an initial evaluation round to remove uncompetitive or unrealistic bids. This
can limit developer expenditure in preparing full tenders, but also reduces the level of competition in the final
bidding process.
● Bid bonds represent a financial commitment from prospective developers to enter a tender round. The size of
the bid bond must strike a balance between the level needed to suitably penalise non-delivery whilst not
creating an entry barrier which could limit competition.
● Financial penalties for delays or non-delivery following contract award can provide further safeguards to
governments, but can deter bidders and reduce competition.
Relaxing delivery milestones can limit risk exposure for developers
Incentive mechanisms are often awarded on the condition of meeting prescribed milestones, set by the awarding
authority. These milestones ensure that developers move forward with their projects and meet government
timelines for securing online capacity. However, overly aggressive milestones can increase the risk profile for
developers, particularly milestones early in the post-award process (e.g. United Kingdom CfD milestones; see Box
22).
Box 21: Offshore wind tender design in the Netherlands and Denmark
Despite both adopting more centralised development models and auction-based systems, tender submission
requirements differ between the Netherlands and Denmark. Danish offshore wind tenders include a pre-
qualification round and bid bonds of ~€10m per 100 MW to deter speculative bids and ensure that bidders have
suitable competencies to deliver the project, should they be successful. This reduces the risk of non-delivery
but can also reduce the level of competition between bidders. In contrast, recent tenders in the Netherlands
have not included a pre-qualification round and have assigned a lower bid bond of €10m per 350 MW in order
to maximise competition. The bond increases to €35m within one year within which developers should reach
financial close.
Denmark previously included financial penalties for delays to strict delivery schedules, including the auction for
Anholt wind farm. However, these have since been withdrawn due to the additional risk for project developers
leading to low interest and low competition between bidders and resulting in more conservative strike prices,
as evident in the higher tariff for Anholt wind farm (see Table 7). In the Netherlands, a financial penalty applies
through lost remuneration if wind farms are connected after the fixed start date for subsidy support.

REWIND OFFSHORE – Comparative Analysis of International Offshore Wind Energy Development, March 2017
59
Government-backed banks can de-risk investments in offshore wind
Access to finance is a key enabler for the industry, particularly as project size and developer project portfolios
increase. To realise the significant growth potential for offshore wind, developers need to be capitalised in such a
way that they can continue to invest in new projects. As project portfolios increase, developers no longer have the
capital required to build and hold these assets, so are reliant on external investors to free up capital reserves. Several
European governments have therefore created dedicated banking institutions to invest in low carbon technologies,
including offshore wind. Banks such as KfW in Germany, EKF in Denmark, the Green Investment Bank in the UK (see
Box 23), and the European Investment Bank, have all made sizeable investments in offshore wind farms, during both
construction and operational phases. By investing on fully commercial terms, these banks have demonstrated the
attractiveness of offshore wind investments that has attracted a more diverse range of financiers, including pension
funds.
State banks can therefore play a critical role in reducing financing costs for developers, driving down cost of energy
and freeing up the necessary capital to make continued investment in expanding project portfolios. However, state
banks need sufficient capital resources to have a major impact.
Box 22: UK Contract for Difference milestone conditions
In the UK, project developers must have spent 10% of their pre-commissioning budget within 1 year of securing
a CfD contract, which in some cases can mean that contracts need to be in place with suppliers before the
auction process even begins. As well as adding risk to both developers and suppliers, this can increase
development expenditure for companies looking to line up supplier contracts before a final investment
decisions have been made on the project. Greater flexibility post-contract award would therefore be beneficial.
Box 23: UK Green Investment Bank
The UK Green Investment Bank was created in 2012 by the UK Government,
its sole shareholder, to invest in the offshore wind, waste and bioenergy and
energy efficiency sectors. Since being capitalised with an initial £3.8bn
(equiv. €4.5bn) of public funds, the GIB has invested almost £7bn (equiv.
€8.2bn) in 46 projects across the UK. This has included ~£1.3bn (equiv.
€1.5bn) invested in 8 offshore wind projects with a total capacity of 2.9 GW.
The GIB has pursued a dual strategy of financing construction projects to help the UK offshore wind
development pipeline and financing operational projects to free up developers’ capital to re-invest in the
development and construction phases of projects.
The GIB has also recently created a subsidiary, UK Green Investment Bank Financial Services Limited, the world’s
first dedicated offshore wind fund. The fund has been established with the aim of attracting capital into the
UK’s offshore wind sector, with a target size of £1bn (equiv. €1.2bn). Attracting new capital and creating a liquid
market for operating assets helps to reduce long-term cost of finance by enabling developers to sell down their
stakes and use the proceeds to finance new projects.

REWIND OFFSHORE – Comparative Analysis of International Offshore Wind Energy Development, March 2017
60
3 . 5 S U P P LY C H A I N D E V E L O P M E N T
Securing economic and industrial benefits is often a key motivation for policy makers when assigning public funding
to support offshore wind development. Offshore wind projects are capital intensive, representing high potential to
create jobs and stimulate business, both at home and overseas through export opportunities. A range of policy tools
exist to enable governments to support domestic companies, some of which may clash with parallel goals of
maximising deployment levels and driving cost reduction. These three aims are often a high priority for government
officials, but are rarely mutually compatible. The degree of interventionism and types of policies introduced is
therefore highly dependent on a government’s primary objectives and the extent to which energy policy aligns with
industrial strategy.
Across Europe, a variety of approaches have been adopted by different countries. Some, such as the UK, have
adopted a more open and free-market approach, with deployment and cost reduction prioritised over industrial
benefits. Others, such as Denmark, Germany, and the Netherlands, have taken a more interventionist approach,
strategically aligning energy policy with industrial aims. Some countries have gone to even greater lengths to secure
local economic benefits, with stringent local content requirements imposed (e.g. France). Meanwhile, other
countries have managed to exploit favourable market economics to play a major role in the supply chain, despite
limited deployment levels (e.g. Spain, Poland).
3.5.1 Offshore wind supply chain
Offshore wind development requires more extensive and complex supply chains than other renewables, such as
onshore wind and solar PV. In addition to challenging offshore construction methods, increasing project size and
turbine rating is adding more stringent requirements to project logistics and the facilities and components required.
Certain components are more easily transported than others, enabling importation from manufacturing bases
across a given region and greater market competition. The scale of the facilities required and limited demand in
single countries means that suppliers will typically concentrate production in a small number of manufacturing
facilities which can service the wider market. This can create challenges for governments in maximising local
content, particularly if domestic suppliers are uncompetitive in procurement tenders.
● Suppliers need long-term visibility and certainty of market scale
● Local content requirements can support domestic industrial policy, but are likely to be a barrier to cost
reduction
● Bottom-up initiatives may be more effective in balancing government objectives to reduce costs and
maximise local economic benefit
● Public investment in infrastructure can catalyse private sector investment, leading to the creation of
supply chain clusters
● Business support programmes can attract new market entrants and improve supplier competitiveness
● Specialisation, through leveraging existing capabilities and investing in innovation, can create competitive
advantage for domestic suppliers
● While Europe has been relatively insulated from supply chain bottlenecks due to cumulative market scale
and regional cooperation, isolated emerging markets (e.g. USA, Japan, Chinese Taipei) with limited
market size will face greater challenges
● International and inter-state cooperation can remove entry barriers for emerging markets
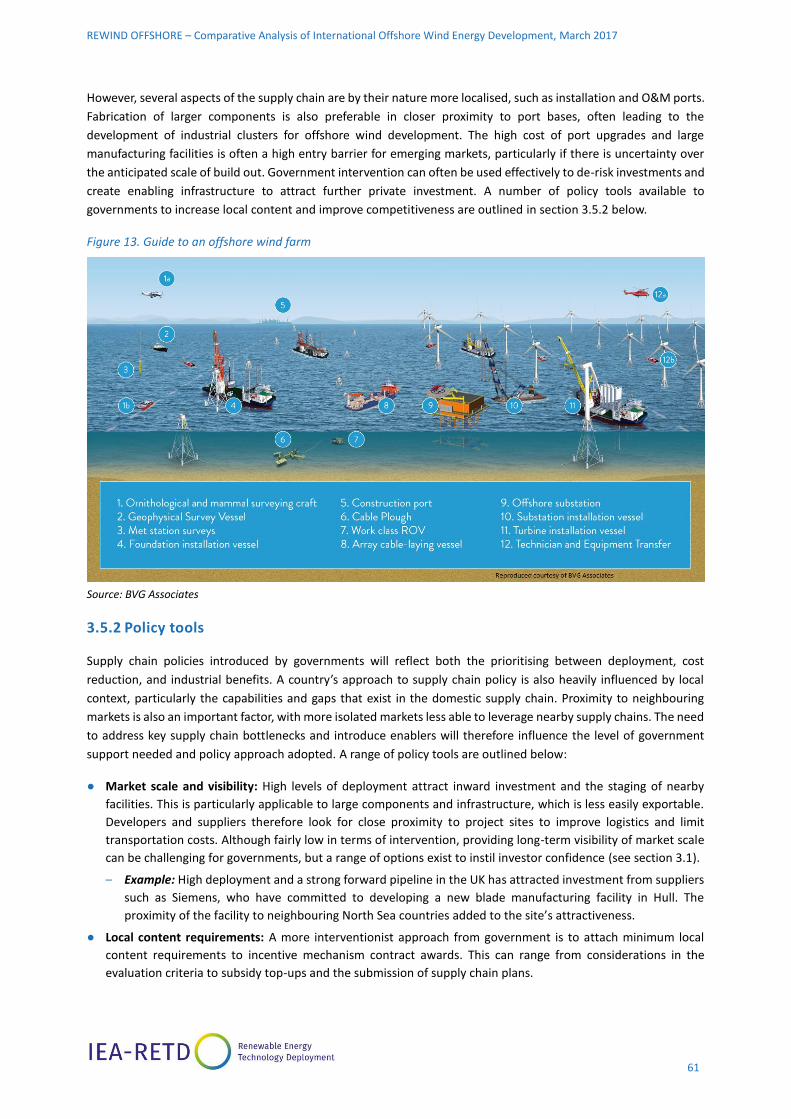
REWIND OFFSHORE – Comparative Analysis of International Offshore Wind Energy Development, March 2017
61
However, several aspects of the supply chain are by their nature more localised, such as installation and O&M ports.
Fabrication of larger components is also preferable in closer proximity to port bases, often leading to the
development of industrial clusters for offshore wind development. The high cost of port upgrades and large
manufacturing facilities is often a high entry barrier for emerging markets, particularly if there is uncertainty over
the anticipated scale of build out. Government intervention can often be used effectively to de-risk investments and
create enabling infrastructure to attract further private investment. A number of policy tools available to
governments to increase local content and improve competitiveness are outlined in section 3.5.2 below.
Figure 13. Guide to an offshore wind farm
Source: BVG Associates
3.5.2 Policy tools
Supply chain policies introduced by governments will reflect both the prioritising between deployment, cost
reduction, and industrial benefits. A country’s approach to supply chain policy is also heavily influenced by local
context, particularly the capabilities and gaps that exist in the domestic supply chain. Proximity to neighbouring
markets is also an important factor, with more isolated markets less able to leverage nearby supply chains. The need
to address key supply chain bottlenecks and introduce enablers will therefore influence the level of government
support needed and policy approach adopted. A range of policy tools are outlined below:
● Market scale and visibility: High levels of deployment attract inward investment and the staging of nearby
facilities. This is particularly applicable to large components and infrastructure, which is less easily exportable.
Developers and suppliers therefore look for close proximity to project sites to improve logistics and limit
transportation costs. Although fairly low in terms of intervention, providing long-term visibility of market scale
can be challenging for governments, but a range of options exist to instil investor confidence (see section 3.1).
– Example: High deployment and a strong forward pipeline in the UK has attracted investment from suppliers
such as Siemens, who have committed to developing a new blade manufacturing facility in Hull. The
proximity of the facility to neighbouring North Sea countries added to the site’s attractiveness.
● Local content requirements: A more interventionist approach from government is to attach minimum local
content requirements to incentive mechanism contract awards. This can range from considerations in the
evaluation criteria to subsidy top-ups and the submission of supply chain plans.

REWIND OFFSHORE – Comparative Analysis of International Offshore Wind Energy Development, March 2017
62
– Example: Tender rounds 1 and 2 for projects in France applied a high weighting on local content (40% in the
evaluation criteria) although this provision was subsequently removed for Round 3 (see Box 24).
– Example: In Denmark, developers are obliged to assign 20% of construction costs to Danish firms and offered
an enhanced subsidy (0.01 øre/kWh)39 if local content surpasses 30%.
– Example: In the UK, In order to submit tenders for CfD auctions, prospective developers must submit supply
chain plans, which include targets for local content. However, it is unclear how these plans will be enforced
if developers fail to meet these targets.
● Infrastructure investment: Governments can provide fiscal stimulus (i.e. grants, low-interest loans, tax relief)
to develop key enabling infrastructure, such as ports. In addition to meeting construction requirements, these
investments can attract private investment in companies looking to leverage the facilities and position
themselves within dedicated hubs and clusters for offshore wind development.
– Example: Government bodies in Germany have injected considerable investment into developing port
infrastructure, which has resulted in ports like Cuxhaven and Bremerhaven establishing themselves as
leading hubs for the sector.
● Business and innovation support: Grants and low-interest loans can also targeted to local businesses and
innovators to develop new products and services for the sector. As well as funding support, this can also involve
identifying synergies with other industries, communicating market opportunities, and facilitating brokering
between industry players.
– Example: The GROW initiative in the UK has supported a number of businesses to develop products and
services for the offshore wind market (see Box 26).
– Example: TKI in the Netherlands works closely with SMEs, academia, and industry to support Dutch
companies in the sector, creating campus environments for start-ups to collaborate when developing
technology innovations.
● Training: Offshore wind entails complex and high risk offshore activities that require highly skilled professionals.
Public support can therefore be channelled towards education institutions and bespoke training centres for
offshore wind and related industries.
– Example: A network of National Wind Farm Training Centres have been set up in conjunction with industry
body, RenewableUK.
Table 13. Impact of government supply chain intervention
Policy tool Government
intervention
Impact:
Local supply chain
Impact:
LCOE
Market scale and visibility High
Local content requirements High
Infrastructure investment High
Business and innovation support Medium
Training Low
39 Equiv. €1.3/MWh

REWIND OFFSHORE – Comparative Analysis of International Offshore Wind Energy Development, March 2017
63
3.5.3 Lessons learned
Suppliers need long-term visibility and certainty of market scale
Market scale and visibility is consistently seen as the most important factor for suppliers. Medium to long-term
visibility attracts companies to enter the offshore wind supply chain, providing the certainty needed to invest in new
facilities, products, and services. Particularly given the high cost and long-lead times to develop key enabling
infrastructure, such as ports, manufacturing facilities, and vessels, suppliers need confidence that the market will
offer sufficient business opportunities over extended timescales to secure a return on investment. High and
consistent levels of deployment also ensures sufficient market share for a larger number of suppliers, increasing
competition to drive down costs.
WindEurope estimate that ~4-7 GW of annual installed capacity is needed in Europe to maintain a sufficient project
pipeline that will sustain competitive market forces and deliver on cost reduction targets. Existing national targets
suggest that ~2-3 GW of annual installed capacity can be expected in the early 2020s, indicating a gap that needs to
be filled through more ambitious deployments targets or new market entrants (i.e. Baltic nations). In emerging
markets outside Europe, achieving the levels of scale necessary to justify substantial investment decisions is even
more challenging. International and inter-state cooperation is therefore vital to replicate the economies of scale
derived across the North Sea region.
Local content requirements can support domestic industrial policy, but are likely to be a barrier to
cost reduction
Introducing local content requirements is a direct means of increasing economic and industrial benefits. However,
this approach is rarely compatible with delivering low project costs due to limited supplier competition and the high
cost and long lead time in having to develop new manufacturing facilities. The restriction that this adds to
procurement strategies for developers is a key reason why very few countries have enforced stringent requirements
to date.
From a wider supply chain and cost reduction perspective, it is also unrealistic and uneconomical to set up new
production facilities in every country to meet local content demands. Local content is also constrained by EU
competition guidelines which aim to promote the free movement of goods and fair procurement practices across
member states.
Despite these potential restrictions and dis-benefits, for countries looking to closely align energy and industrial
policy, local content requirements can be introduced to provide greater guarantees of maximising domestic
economic benefits (see Box 24). But to deliver cost reduction, these constraints either need to be relaxed or high
levels of national deployment will be necessary to achieve sufficient economies of scale.
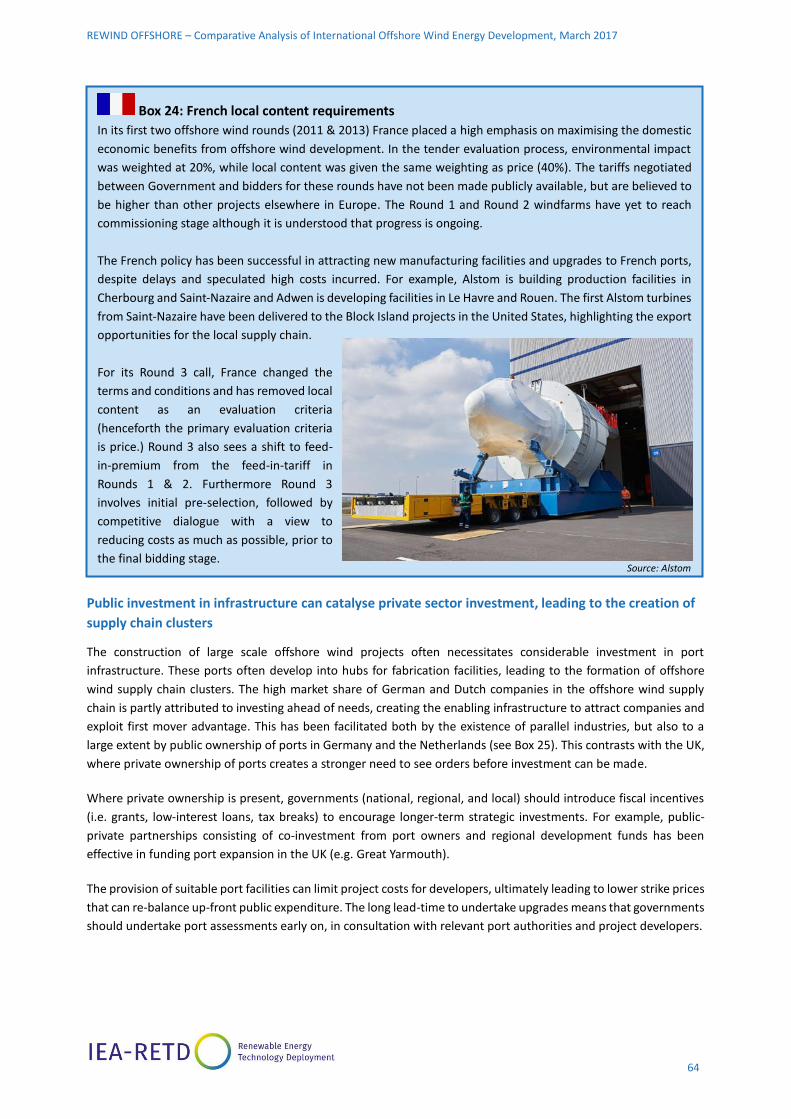
REWIND OFFSHORE – Comparative Analysis of International Offshore Wind Energy Development, March 2017
64
Public investment in infrastructure can catalyse private sector investment, leading to the creation of
supply chain clusters
The construction of large scale offshore wind projects often necessitates considerable investment in port
infrastructure. These ports often develop into hubs for fabrication facilities, leading to the formation of offshore
wind supply chain clusters. The high market share of German and Dutch companies in the offshore wind supply
chain is partly attributed to investing ahead of needs, creating the enabling infrastructure to attract companies and
exploit first mover advantage. This has been facilitated both by the existence of parallel industries, but also to a
large extent by public ownership of ports in Germany and the Netherlands (see Box 25). This contrasts with the UK,
where private ownership of ports creates a stronger need to see orders before investment can be made.
Where private ownership is present, governments (national, regional, and local) should introduce fiscal incentives
(i.e. grants, low-interest loans, tax breaks) to encourage longer-term strategic investments. For example, public-
private partnerships consisting of co-investment from port owners and regional development funds has been
effective in funding port expansion in the UK (e.g. Great Yarmouth).
The provision of suitable port facilities can limit project costs for developers, ultimately leading to lower strike prices
that can re-balance up-front public expenditure. The long lead-time to undertake upgrades means that governments
should undertake port assessments early on, in consultation with relevant port authorities and project developers.
Box 24: French local content requirements
In its first two offshore wind rounds (2011 & 2013) France placed a high emphasis on maximising the domestic
economic benefits from offshore wind development. In the tender evaluation process, environmental impact
was weighted at 20%, while local content was given the same weighting as price (40%). The tariffs negotiated
between Government and bidders for these rounds have not been made publicly available, but are believed to
be higher than other projects elsewhere in Europe. The Round 1 and Round 2 windfarms have yet to reach
commissioning stage although it is understood that progress is ongoing.
The French policy has been successful in attracting new manufacturing facilities and upgrades to French ports,
despite delays and speculated high costs incurred. For example, Alstom is building production facilities in
Cherbourg and Saint-Nazaire and Adwen is developing facilities in Le Havre and Rouen. The first Alstom turbines
from Saint-Nazaire have been delivered to the Block Island projects in the United States, highlighting the export
opportunities for the local supply chain.
For its Round 3 call, France changed the
terms and conditions and has removed local
content as an evaluation criteria
(henceforth the primary evaluation criteria
is price.) Round 3 also sees a shift to feed-
in-premium from the feed-in-tariff in
Rounds 1 & 2. Furthermore Round 3
involves initial pre-selection, followed by
competitive dialogue with a view to
reducing costs as much as possible, prior to
the final bidding stage.
Source: Alstom

REWIND OFFSHORE – Comparative Analysis of International Offshore Wind Energy Development, March 2017
65
Business support programmes can attract new market entrants and improve supplier
competitiveness
EU State Aid regulations and competition law pose a challenge to governments in increasing local content in
commercial projects. Rather than mandating local content, many governments have turned to applying targeted
support for businesses to improve their competitiveness in the global marketplace. Business support programmes
are typically led by employment and trade bodies and can include:
● Funding to develop innovative products
● Communicating the business opportunities presented by offshore wind
● Facilitating brokerage events between suppliers and prospective customers
● Trade missions to overseas markets
● Business incubation support
Box 25: Port infrastructure building in Germany – Bremerhaven
Several German ports have received public funding to redevelop port infrastructure to service North Sea and
Baltic Sea offshore wind developments. Bremerhaven, in particular, has established itself as a major hub for
offshore wind. The transformation from economic decline to booming industrial growth is routed in a series of
strategic investments to regenerate the area and tap into the opportunities emerging from the growing offshore
wind sector. Driven by North Sea offshore wind deployment targets exceeding 25 GW by 2030, initial
investments of ~€250m were supplemented by a further €180m in 2010 from the Federal Land of Bremen to
add a quayside dedicated to offshore wind activities. There are also plans for the construction of the dedicated
Offshore Terminal Bremerhaven, which would consolidate and improve Bremerhaven’s position as an industrial
powerhouse in the offshore wind sector.
These investments have catalysed considerable inward private investment with several wind energy companies
setting up business in Bremerhaven. A highly specialised wind energy cluster has emerged, with particular
expertise in the serial manufacture of offshore wind turbines and components. In addition to manufacture, the
port has developed into a leading centre for research and development, with new turbine models being tested
ahead of commercial deployment. The power generated from these prototype installations has also helped the
city to achieve its own decarbonisation targets.
Source: Eurogate
REWIND OFFSHORE – Comparative Analysis of International Offshore Wind Energy Development, March 2017
66
This softer, bottom-up approach is arguably more aligned with cost reduction efforts by ensuring that suppliers are
exposed to competition and encouraged to develop new innovative products and services (see Box 26).
Specialisation, through leveraging existing capabilities and investing in innovation, can create
competitive advantage for domestic suppliers
Supply chain development in Europe has been categorised by specialisations across different countries to service a
single European market. For example, Denmark and Germany have been able to take advantage of their world-
leading status in onshore wind to dominate the turbine market (e.g. Siemens, Vestas, Senvion, Areva) and the
Netherlands has benefited from a rich history in the maritime sector (e.g. Van Oord, Smulders, SIF, VSMC). The UK
has been less successful in the goods market, but has developed a strong services offering in the form of leading
engineering consultancies, as well as some specialist companies in areas such as cable supply (e.g. JDR Cables).
Similar trends are being observed in emerging markets overseas. China, for example, has placed a strong emphasis
on building the capability of local suppliers, leveraging their position as the largest onshore wind market. Turbine
manufacturers such as Goldwind, Sinovel, Shanghai Electric, XEMC, and MingYang are all developing models for the
offshore wind market.
As well as leveraging local capabilities, some countries may be able to exploit unique environmental conditions to
establish niche capabilities. For example, in Japan companies are developing technology solutions which can operate
with resilience to extreme events, such as earthquakes and typhoons.
International and inter-state cooperation can remove entry barriers for emerging markets
The different specialisations seen in Europe have partly been made possible by the close proximity of neighbouring
markets. For more isolated emerging markets overseas, this could place increasing pressures to develop the
requisite supply chain capabilities to deliver offshore wind cost-effectively. Without high levels of domestic
deployment, greater isolation is likely to result in higher project costs and require even greater public support to
develop suitable infrastructure. This could prove a major barrier to developing offshore wind industries, particularly
in formative years when deployment is low. Increasing cooperation between countries and states to form larger
regional supply chains can lower the risk of supply chain bottlenecks that drive up costs.
Box 26: GROW initiative
In response to limited involvement of UK suppliers in early projects, the UK Government has introduced a
number of initiatives with the aim of increasing local content to ~50%. One of the more successful was the
GROW Offshore Wind initiative, backed by ~£20m (equiv. €23m) from the Regional Growth Fund to provide
support to SMEs with the capability to enter the offshore wind sector.
The programme provided companies with access to market
insights, funding grants, and tailored support, based on close
interaction with customers to understand industry needs, as well
as access to a national network of technology centres.
Collaboration between the four delivery bodies – RenewableUK,
Grant Thornton, the Advanced Manufacturing Research Centre,
and the Manufacturing Advisory Service – also ensured that
contract opportunities were identified and pursued to maximise
opportunities for UK companies.

REWIND OFFSHORE – Comparative Analysis of International Offshore Wind Energy Development, March 2017
67
3 . 6 I N N O V AT I O N S U P P O R T
Technology innovation is key to overcoming technical challenges, developing windfarms in more challenging site
conditions, and reducing cost of energy for offshore wind. Significant progress has been made across Europe to
develop commercial wind farms that can operate in challenging offshore environments, but continued effort is
required to expand offshore wind to new markets and further reduce costs as the sector strives towards a ‘subsidy
free’ future.
Innovation has been core to cost reduction efforts in offshore wind, with several studies indicating that technology
advancements could cut the cost of offshore wind by ~33% by 2030 (KIC InnoEnergy, 2016) and ~60% by 2050 (TINA,
2015). An element of this reduction can be achieved through learning rates that come with increasing deployment,
but there is also a critical need for targeted R&D activities to develop and de-risk cost-cutting innovations ready for
commercial application. However, the high cost and risk associated with new technologies is a major barrier to
commercialisation, necessitating government intervention to share the risk of undertaking R&D activities.
3.6.1 Technology commercialisation
Innovation of new technologies follows a progression from initial conception to basic and applied research, before
part and full-scale demonstration to pave the way for commercial application. Typically, these are assessed by
technology readiness levels. Each stage along the commercialisation pathway requires different levels of
government intervention, reflecting a transition from technology push to market pull. Technology push for early
stage technologies will consist of high government intervention through grant research funding, with increasing
private contribution as technologies progress to higher readiness levels.
Basic R&D
At early stages of technology development, technology push R&D is dominant in supporting fundamental scientific
research, often without a specific market application in mind. Small scale research of this kind is typically low cost
but more extensive in the scope of research areas covered, providing grants to academic institutions to investigate
the potential for a range of technology solutions, often more radical innovations with lower probability of market
penetration.
● Strategic identification and prioritisation of technology innovation needs can focus R&D efforts
● Creating close ties between academic research centres and industry can maximise market penetration of
novel technologies
● Industry-led collaborative R&D programmes can maximise the impact of public and private funding
● Involving financial institutions and lending advisers early in the R&D process can mitigate high risk
perception of new technologies
● Policies should be designed to enable integration of technology demonstrations in commercial projects
● A balance of innovation support should be maintained across technology readiness levels

REWIND OFFSHORE – Comparative Analysis of International Offshore Wind Energy Development, March 2017
68
Figure 14. Technology commercialisation R&D pathway
Source: Carbon Trust
Applied R&D
The most promising innovations are taken forward for further research, often through research programmes
delivered by dedicated R&D centres. Here, the cost of R&D may increase but public expenditure can be supported
by match-funding from the private sector to undertake more desk-based design modelling and laboratory testing of
concepts. Collaborative R&D of this kind can help to share the cost and risk of R&D activities. A considerable amount
of applied R&D may also be undertaken in-house by technology companies, particularly in areas where there is
greater competition between suppliers (e.g. turbine manufacturers).
Demonstration
The final de-risking step before technologies can enter commercial projects is to demonstrate at part or full scale.
The high cost of prototype demonstrations is a major barrier to commercialisation, often referred to as the valley of
death. To bridge this valley of death, public investments will need to leverage a higher portion of private sector
funding, which can be mandated in the terms for funding calls. In offshore wind, demonstration opportunities are
further hindered by the availability of suitable test sites with low entry barriers, such as consent and grid availability.
Integrating demonstrations within commercial deployments can be a more cost-effective means of demonstrating
innovative technologies, but this requires appropriate policies and incentive mechanisms to prevent a barrier to
implementation, particularly where competitive auctioning is present.
Deployment
Once demonstrated and proven in appropriate environmental conditions, technologies can adopted in commercial
projects. However, barriers still remain in integrating novel technologies into commercial projects due to the higher
risk perception associated. Particularly where project financing is prevalent, higher perceived risk can result in less
favourable lending rates, leading to higher cost of capital and higher cost projects. As such, developers may opt for
proven lower risk technology options over more innovative alternatives, as the higher CAPEX may be wiped out by
higher WACC. Undertaking comprehensive de-risking activities is therefore critical throughout the R&D process to
lower the barriers to market uptake.

REWIND OFFSHORE – Comparative Analysis of International Offshore Wind Energy Development, March 2017
69
3.6.2 Policy tools
The technology advancements seen across the industry have been made possible by concerted research and
development efforts to develop and de-risk new technology solutions. A range of government interventions have
been implemented to stimulate R&D activity in offshore wind. Some countries, such as Germany, have favoured a
greater emphasis on technology push research, with considerable public funding channelled towards academic
institutions and research centres. In other countries, such as the UK, a greater emphasis has been applied to market
pull initiatives that engage the private sector. Crucially, an appropriate balance of R&D activities is needed to ensure
a steady stream of new technologies reaching the market.
A range of possible government interventions to support technology innovation are outlined below, from low to
high technology readiness.
Research and development initiatives
● Basic R&D: Grant funding to academic institutions and dedicated research centres, typically associated with low
TRL technologies. Limited private contribution.
– Examples: DTU (Denmark); ECN (Netherlands); Fraunhofer IWES (Germany); NREL (USA)
● Applied R&D: Grant funding for mid-TRL technologies, often delivered with match funding from the private
sector. The collaborative nature of these R&D initiatives lends them well to regional or international
cooperation, often in the form of consortia addressing cross-industry challenges. But this can also involve direct
grants to companies and innovators to develop technology solutions, as well as business incubation support to
improve supplier route to market.
– Examples: Carbon Trust Offshore Wind Accelerator (UK); TKI Wind op Zee (Netherlands); Horizon 2020 (EU);
IEA-Wind (International)
● Demonstration: Funding for part- and full-scale technology demonstrations, at higher TRL levels. High cost
requires large government grants, supplemented by private sector match-funding. It should be noted that
funding for demonstrations needs to be supplemented with the availability of suitable test sites, which is often
a major hurdle for single unit prototypes.
– Examples: InnovateUK (UK); EUDP (Denmark); NEDO (Japan); DemoWind (EU)
● Collaboration programmes & forums: Across all levels of R&D, collaboration and information sharing between
industry players is critical to maximising the impact of research activities. Commercial sensitivities can be a
barrier to information sharing, but, if designed appropriately, collaborative research programmes and forums
can provide mutual benefits which increase the pace of innovation.
– Examples: IEA-Wind (International); ORE Catapult/Crown Estate SPARTA project (UK)40
Test and demonstration facilities
● Onshore component testing: Onshore component testing is vital to validating performance and improving
designs before offshore application. Several onshore test facilities have been set up across Europe with the help
of public funding support.
– Examples: Fraunhofer (Germany); ORE Catapult/NAREC (UK); LORC (Denmark); MARIN (Netherlands).
40 SPARTA: System performance, Availability and Reliability Trend Analysis; a database for sharing anonymised offshore wind farm performance and maintenance data.

REWIND OFFSHORE – Comparative Analysis of International Offshore Wind Energy Development, March 2017
70
● Onshore demonstration: Full-scale onshore testing of turbine prototypes can mitigate some of the additional
costs and risks of deploying offshore, provided the environmental conditions are suitably representative. Easy
access can also enable closer monitoring and inspection for a range of R&D activities.
– Examples: ECN Wieringerwerf (Netherlands); Levenmouth (UK)
● Offshore – dedicated site: An offshore test sites is designated for demonstration of novel technologies. These
are typically high cost and must overcome barriers in securing consent, permits, and grid connection. However,
these dedicated test sites can be used effectively to increase the innovative elements of the installation, due to
the limited conflict with commercial activities.
– Examples: Alpha Ventus (Germany; see Box 29); Blyth (UK); European Offshore Wind Deployment Centre
(UK); Nissum Bredning (Denmark)
● Offshore – adjacent to commercial wind farms: Test sites designated next to commercial projects can leverage
existing site permits and grid connection to remove barriers to entry.
– Examples: Gunfleet Sands III (UK); Borseele V (Netherlands)
● Offshore – integrated within commercial wind farms: A select number of units in the wind farm are designated
for innovative technology demonstrations.
– Examples: Borkum Riffgrund (Germany); Belwind (Belgium)
Remuneration incentives
● Enhanced subsidy support: As a means of bridging the gap from prototype demonstration to widespread
commercial application, higher subsidies can be awarded to particularly novel technologies for small scale
commercial projects. Floating wind, for example, currently requires higher subsidy support for pre-commercial
projects before it can compete on an equal commercial basis with fixed-bottom offshore wind.
– Examples: Enhanced ROCs for innovative foundation technologies (Scotland); Pilot floating offshore wind
tender (France)
● Innovation requirements: Similar to local content provisions, governments can impose requirements to include
a certain amount of technology innovation in projects. This high interventionist approach is difficult to assess
and apply consistently, usually conflicting with cost reduction efforts. As such, this approach is rarely compatible
with competitive auction-based systems, where separate support mechanisms will be required (i.e. grant or
enhanced subsidy). Minimum innovation requirements are more likely to be effective in dedicated
demonstration projects.
– Example: Eneco Luchterduinen/Q10 (Netherlands); US Department of Energy demonstration projects.

REWIND OFFSHORE – Comparative Analysis of International Offshore Wind Energy Development, March 2017
71
3.6.3 Lessons learned
Strategic identification and prioritisation of technology innovation needs can focus R&D efforts
Given the high cost of undertaking R&D activities, it is important that governments channel funding towards
activities that will provide greatest impact to the industry, as well as maximising benefit for domestic companies. In
this regard, governments can align innovation funding with industrial strategy, identifying and prioritising areas of
specialisation to support companies with the potential to achieve a competitive advantage in the global marketplace
(see Box 27).
Creating close ties between academic research centres and industry can maximise market
penetration of novel technologies
Achieving market penetration is a common challenge for technology-push academic research. A lack of convergence
between R&D activities in academia and industry can limit the potential to convert research into commercial
application. Closing the gap by creating strong links between industry and academic research centres can mitigate
this risk, ensuring that technologies are developed to respond to industry need and that industry players are aware
of cutting edge research within research centres that can be applied in future offshore wind projects. This low TRL
research and development is vital to achieving long-term cost reduction goals and evaluating the potential of more
radical technology innovations. An example of forging such links includes DTU in Denmark, which has established
strong links with Danish industry players such as DONG Energy, Siemens, and Vestas.
Collaborative R&D programmes can maximise the impact of public and private funding
Another effective means of generating greater market pull has been seen through the creation of collaborative R&D
initiatives and joint industry projects. Collaboration enables the costs and risks of R&D activities to be shared
between industry players, leveraging public and private funding to undertake targeted R&D addressing common
industry challenges. Having industry players steer R&D activities can ensure that investment is focussed on the most
pressing challenges and increases the probability that technology solutions will find application in the market.
Box 27: UK Technology Innovation Needs Assessment
UK R&D activity has been underpinned by strategic identification and prioritisation of R&D needs.
Commissioned by the Low Carbon Innovation Coordination Group (LCICG), a network of UK R&D bodies, and
delivered by the Carbon Trust, a series of Technology Innovation Needs Assessments (TINAs) have been
undertaken across a range of low carbon technologies, including offshore wind. The assessments have used a
range of key metrics, including impact on cost of energy, domestic value creation, and export value creation,
to highlight focus technology areas for R&D activity across its member organisations.
Box 28: Carbon Trust Offshore Wind Accelerator
The Offshore Wind Accelerator (OWA) is a collaborative R&D programme between the UK and Scottish
Governments and 9 of Europe’s leading offshore wind developers. Set up in 2008, the programme has delivered
over 100 R&D projects with a cumulative value of over $100m (equiv. €95m). Research priorities are set by the
industry partners, maximising the impact of both public and private funding. The programme has supported a
number of offshore wind innovations, providing funding support to commercialise cost-cutting technology
solutions and connecting innovators with industry end-users.
Source: Carbon Trust

REWIND OFFSHORE – Comparative Analysis of International Offshore Wind Energy Development, March 2017
72
Involving financial institutions and lending advisers early in the R&D process can mitigate high risk
perception of new technologies
One of the biggest barriers to bringing new technology innovations into commercial projects is the added perceived
risk compared to existing solutions with a longer track record. The impact of higher perceived risk manifests itself in
less favourable financing terms and higher costs of capital, which could mitigate any CAPEX or OPEX savings from
the new technology solution. Closer involvement of financial institutions and lending advisers in R&D activities can
ensure that risks and benefits of innovative technologies are fully understood and that R&D de-risking activities are
designed accordingly. Particularly with the transition to competitive auctions in many countries, de-risking the
uptake of cost-cutting innovation should be a priority for industry.
Policies should be designed to enable integration of technology demonstrations in commercial
projects
Achieving full-scale demonstration in a representative offshore environment is a critical step in the de-risking
process, but one of the most difficult to achieve. The high cost and limited access to suitable permitted sites makes
this a major barrier to implementation. Several dedicated offshore wind test sites have been developed with the
help of public funding, demonstrating new technologies and serving as hubs centres for ongoing testing and
monitoring (e.g. Alpha Ventus, Germany; see Box 29).
However, while dedicated test sites are effective for R&D purposes, they are more expensive and require
considerable public funding. A more cost-effective means of enabling technology demonstrations is to integrate
within or alongside commercial wind farms. This approach results in easier and lower cost permitting and grid
connection and also ensures that technology demonstrates are commercially-driven and aligned with industry
priorities. Examples include the demonstration of a suction bucket jacket foundation as part of the Borkum Riffgrund
I wind farm in Germany and the Gunfleet Sands III extension project in the UK, consisting of two 6 MW Siemens
turbines. However, with the transition to competitive auctions putting increasing pressure on price to win contracts,
for future demonstrations there will need to be a suitable policy framework and incentive mechanism to cover the
higher costs and risks involved (e.g. enhanced remuneration support).
Box 29: Alpha Ventus & RAVE
The Alpha Ventus test site, installed in 2010, was Germany’s first offshore wind
farm, consisting of 12 innovative 5 MW Areva (x6) and Senvion (x6) turbines
supported by novel jacket and tripod foundations. The €250m project has
served as the basis for considerable R&D activity, including the RAVE initiative,
a ~€50m research programme with over 50 partners delivering over 40 R&D
projects. Experience gained in constructing and operating the wind farm has
been fundamental in preparing for the large scale roll out of offshore wind in
Germany and wider European market.
Source: Sean Gallup/Getty Images
Europe

REWIND OFFSHORE – Comparative Analysis of International Offshore Wind Energy Development, March 2017
73
A balance of innovation support should be maintained across technology readiness levels
While a focus on mid- to high-TRL solutions through market-pull initiatives is likely to deliver greater immediate
impact in the near term, policy makers should ensure that public funding is still channelled towards low-TRL basic
and applied R&D activities. Even as the industry matures, offshore wind will need to continue innovating and
developing new, sometimes radical, solutions to deliver cost reduction and open new markets for the sector.
Innovation activity may also need to evolve in response to changing electricity markets, including greater
interconnection and integrating system balancing technologies within wind farms (e.g. energy storage; see Box 31).
Box 30: Borssele V test site
As part of the Dutch offshore wind roadmap to 2023, a site for 20 MW
installed capacity has been made available by RVO for up to two turbine
demonstrations, which will connect to the Beta substation for Borssele III
and IV. The provision of consent and grid connection reduces development
cost and risk, and the close proximity to commercial projects will enable
easier operation and maintenance. The incentive mechanism for the
project has yet to be determined, but is expected to include an enhanced
subsidy on top of the SDE+ tariff determined for Borssele site III. The
project will be subject to competitive tender, but evaluated on quality of
technology innovation, as opposed to price. The evaluation criteria will
also include a local content requirement to maximise benefits for Dutch
technology companies.
Box 31: Hywind-Batwind Pilot Project
Statoil are currently developing a highly innovative project in Scotland which will consist of the world’s first pre-
commercial array of floating wind turbines and the demonstration of a new battery storage solution. The 30
MW Hywind Pilot Park, comprising five 6 MW Siemens turbines supported by floating spar-buoy platforms, will
be connected to a 1 MWh lithium battery, highlighting the opportunities for wind power and energy storage to
offer an integrated solution with system benefits.
Source: Statoil
Source: RVO

REWIND OFFSHORE – Comparative Analysis of International Offshore Wind Energy Development, March 2017
74
4 I N D U S TRY ST R U C T U R ES
A growing body of evidence suggests that the offshore wind industry in the established markets of Northern Europe
has matured in recent years. The industry has moved from innovation (1990 to 2001), adaptation (2002 to 2008), to
market stabilization (2009 to 2015) 41,42,43. The market stabilisation phase is marked by an increase in project size;
the development of dedicated manufacturing facilities and a supply chain distinguishing itself from the oil & gas and
onshore wind industries. Evidence from the stakeholder interviews suggest further developments through the
market stabilisation phase, suggesting that the industry may be moving into a ‘market maturation’ phase:
● Steep cost reduction evident in several European countries.
● Several European markets have become commoditised, with financial investors, commonwealth funds and
pension funds now investing in operating assets, allowing utilities to recycle capital to new projects.
● Perceived risks from the investor and finance community have been reduced due to growing confidence in the
ability of developers and the supply chain.
● Project margins have reduced over the last five years due to increased confidence in the industry and perceived
reduction of residual risk levels.
● Consolidation of industry developers, particularly in the UK where significant exits have left fewer players in the
market.
The following sections identify the dominant industry structures and how they have changed in recent years,
through discussion of:
● Project Developers: companies whose business model is to develop a project through one or more phases of
an offshore wind farm.
● Investor Community: companies who provide capital for offshore wind projects in the form of equity or debt.
● Supply chain: companies involved in the manufacturer and installation of offshore wind farms.
41 Dedecca et al. 2016. Market strategies for offshore wind in Europe: A development and diffusion perspective. Renewable and Sustainable Energy Reviews. available at: http://www.sciencedirect.com/science/article/pii/S1364032116304233
42 Higgins and Foley. 2014. The evolution of offshore wind power in the United Kingdom. Renewable and Sustainable Energy Reviews. available at: http://www.sciencedirect.com/science/article/pii/S1364032114003839
43 Kern et al. 2014. From laggard to leader: Explaining offshore wind developments in the UK. SPRU Working Paper. available at: http://sro.sussex.ac.uk/48296/1/2014_02_SWPS_Kern_etal.pdf
● The industry has developed in recent years and may be entering a market maturation phase in key
established markets such as the UK and Germany.
● The market has been comprised of two distinct models: the utility and independent power producer
developer (IPP) models.
● Developer models have evolved, with growing use of project finance by utility developers, and a trend
towards development consortia.
● Predictions of capital constraints have not been borne out, due to slower pace of development and
increasing trust by funders in the industry’s capabilities.
● Emerging markets have significant supply chain capabilities due to pre-existing onshore wind and oil &
gas industries. However, lack of vessels for WTG lifting and O&M servicing could present as bottlenecks
for non-European markets.

REWIND OFFSHORE – Comparative Analysis of International Offshore Wind Energy Development, March 2017
75
4 . 1 P R O J E C T D E V E L O P E R S
Utility vs. independent power producers (IPP)
There are two broad categories of developer model: the utility-developer and IPP-developer (see Table 14).
Historically, utility-developers relied mainly on balance sheet financing with less third party scrutiny which enabled
them to adopt higher risk approaches, with more contracts and more aggressive scheduling. In contrast, IPP-
developers tended to adopt risk adverse strategies, with a smaller number of construction contracts, conservative
scheduling and technology choices to meet requirements of debt providers.
Table 14: Contrasting development strategies in offshore wind
Development
aspect
Utility-Developer Model IPP-Developer Model
Size of
development
team
Relatively large, with the potential for
hundreds of staff to be working on projects.
Large teams create communications
challenges
Relatively small, typically using tens of staff.
Typically have better communication but struggle
with resource when material issues occur
Risk tolerance Relatively high and mitigated through use of
a large owner management team
Relatively low, driven by external financing
requirements
Scheduling Often attempt to perform more tasks either
in parallel or with limited float44 between
packages to attempt to obtain a shorter
construction timeframe
Typically a conservative schedule with greater float
between contractual packages
Level of
innovation
Typically tolerant of new technologies which
may lead to cost reduction or performance
enhancement
Preference for more proven technology to reduce
risk
Number of
construction
contracts
Relatively large, often tens of main contracts
used
Typically two to six
Construction
contract terms
Typically fixed price contracts, backed by
strong warranties, guarantees and damages
used, to pass the majority of construction
risk to contractors. Utilities may be more
willing to accept certain contractual risks
such as weather downtime sharing.
Typically fixed price contracts, backed by strong
warranties, guarantees and damages used, to pass
the majority of construction risk to contractors.
More conservative contracting approaches, with
limited sources of cost over-runs preferred
O&M strategy Often looking to take over O&M within 2 to
5 years and build an O&M business
In recent years have been able to access long term
O&M contracts with turbine suppliers and have
typically procured 15 year terms.
O&M contract
terms
Utilities provide fixed or variable cost O&M
agreements after expiry of WTG O&M
agreement
Fixed price, availability warranty backed contracts
with WTG suppliers’ standard
Source: Mott MacDonald, based on stakeholder interviews and project experience
44 A float is a buffer between sequential works to have contingency for delays (to cover weather risk, technical, other delays)

REWIND OFFSHORE – Comparative Analysis of International Offshore Wind Energy Development, March 2017
76
4.1.1 Key players
The ownership of cumulative offshore wind installed capacity is displayed in Figure 15. The top five players by
ownership assume technical roles, hence can be classified as developers and have a cumulative market share of
46.8%. Major shareholders Green Investment Bank (GIB), Blackstone and Caisse de dépôt et placement du Québec
(CPDQ) by contrast do not assume any key technical roles in the projects. The large share of “other” demonstrates
that ownership is spread among a large number of stakeholders and is also a reflection of equity divestment once
projects are operational.
Figure 15: Cumulative installed capacity by developer, 2010 and 2015
Source: WindEurope
The majority of developers are utilities that typically have a thermal power generation, power distribution and
transmission background with no previous offshore experience. IPP-developers typically have an onshore wind
and/or broader renewables background. However, individuals within the developers’ project teams can have much
more diverse backgrounds than the corporate CV of the Developer.
While utility-developers initially focussed on their domestic market, all major developers are now active in several
country markets across Europe. This has led to similar developer structures across Europe. The only exception is
France, where some of the successful bidders have no previous offshore wind experience and have entered the
market as consortia partners with more experienced developers. This may be partly attributable to the use of
domestic content by France as a key evaluation criteria in Rounds 1 and 2. Generally, the industry has seen a
consolidation of the market leaving fewer players than five years ago, including the announced market exit by utility-
developers Statkraft and Centrica.
DONG Energy, 15.6%
E.On, 9.6%
Innogy, 9.0%
Vattenfall, 8.8%
Stadtwerke München, 3.8%
Ocean Breeze Energy, 3.6%
SSE, 3.2%
Green Investment Bank, 2.8%
Blackstone, 2.1%
Trianel, 1.8%
Iberdrola, 1.8%
Eneco, 1.7%
EnBW, 1.6%
SEAS-NVE, 1.5%
CPDQ, 1.4%
Others, 31.8%
2015
DONG, 26%
Vattenfall, 21%
E.On, 16%
Centrica, 8%
Belwind, 6%
Innogy, 5%
Noordzee Wind, 4%
Pension-Denmark, 3%
Econcern, 2%Eneco, 2%
EWE, 1%
WindPark Varnen, 1%
C-Power, 1%Others, 4%
2010

REWIND OFFSHORE – Comparative Analysis of International Offshore Wind Energy Development, March 2017
77
Developer-supply chain collaboration
Original Equipment Manufacturers (OEMs) only rarely take on an investor or even developer role. Siemens and
DEME (a marine contractor) and most recently Van Oord and MHI Vestas are notable exceptions. Likewise, the
developer’s involvement within the supply chain is limited and typically includes shareholding in logistics suppliers
or acquisition of vessels, for example, Dong’s shareholding in logistics provider A2SEA. Innogy had previously
acquired jack-up vessels but decided to sell them during 2013 and 2015. With the introduction of auctions, the
market has seen greater involvement of the supply chain on the developer side and the industry is looking to
establish a closer liaison between developers and the supply chain to collaborate and achieve further cost
reductions.
Developer profiles
Key utilities and IPP developers are discussed further in the text boxes below.
Installed capacity: 1,964 MW
DONG Energy was established in 2006 by the merger of six Danish energy companies: Dong, Elsam, Energi
E2, Nesa, Københavns Energi and Frederiksberg Forsyning. At this time its predecessors had a sizable
portfolio of operating offshore wind farms, including the world’s first offshore wind farm Vindeby that
entered into operation in 1991 and is undergoing decommissioning at the date of this report. Elsam had
successfully constructed Horns Rev 1 that was completed in 2002, while the Danish energy company Energi
E2 operated Nysted Offshore Wind Farm that was completed in 2003. Dong also had a large and well-
developed pipeline of offshore wind projects.
Today, DONG Energy is the largest offshore wind developer in the world, with shareholding in 18 operating
offshore wind farms totalling a capacity of 3 GW by November 2016. Dong has also been a successful bidder
under the Dutch auction round for Borssele I & II.
DONG Energy is active across Europe, including the Denmark, UK, Netherlands, Germany and France, but
also provided a substantial boost to the US offshore wind industry when it bought into a 1 GW project in
development in Massachusetts. DONG Energy recently established presence in Chinese Taipei too and, as
such, is covering all key offshore wind markets to date.
DONG Energy’s business model follows that of a typical utility developer whereby construction is financed
on balance sheet. DONG Energy takes over responsibility for WTG operation and maintenance after the end
of the warranty period and divests equity typically when a project enters into operation, albeit divestment
may be earlier in the project lifecycle depending on the risk appetite of the investor.

REWIND OFFSHORE – Comparative Analysis of International Offshore Wind Energy Development, March 2017
78
Installed capacity: 1,057 MW
Innogy, formally a subsidiary of German utility RWE, has recently been through a successful IPO process and
now focuses its activities in three core areas: renewables, gas & electricity networks and retail. Innogy
entered the offshore wind market in 2003 with the construction of the first commercial offshore wind farm
in the U.K. The utility has the 3rd largest offshore wind capacity in the world, owning 9% of operational
capacity at the end of 2015, according to Wind Europe; four projects in the UK and one in Germany and one
in Belgium. Two more projects are under construction in 2016 in the UK and Germany. Further projects are
under construction in the UK and Germany with more being developed and would need to succeed in auction
rounds to obtain revenue incentives and proceed with construction.
Innogy was the first owner to purchase large vessels to assist in installation and maintenance of its wind
farms. However, one vessel was sold and one chartered for five years in 2015. Innogy stated this was because
construction was no longer part of its core business activities. This vessel ownership approach has not been
replicated by any other wind farm developers. To date Innogy has not yet been successful in bidding under
the recent auction regimes.
Installed capacity: 1,049 MW
Eon is a German utility which owned 9.6% of operational European capacity at the end of 2015, including
eight offshore wind farms in the UK, Germany, Sweden and Denmark. Eon entered the offshore wind market
with the first offshore wind farm in German waters, Alpha Ventus, Robin Rigg in the UK and Rodsand 2 in
Denmark. For the majority of its operating portfolio, Eon is the sole shareholder. However, for its larger
projects, including London Array, Eon has worked in consortia with other developers.
Two projects are under construction in the UK and Germany in 2016 and one project is under development
and obtained construction permit in Germany. To date, Eon has participated in auctions but not yet been
successful with a bid. While the company is headquartered in Germany it has been more active in the UK to
date. In 2011, Eon signed a six-year vessel charter agreement for offshore wind construction.
As of January 2016, Eon’s fossil power business is entirely separated from its renewables business to focus
on renewables and energy efficiency services.
Installed capacity: 902 MW
To date, Vattenfall has secured the highest cumulative capacity of the recently introduced auctions in Europe
of which all is located in Denmark and with tariff levels well below successful auctions in other countries. All
Vattenfall auction wins have been achieved without development partners and it remains to be seen
whether Vattenfall is going to seek partners to proceed with the construction of these projects. Vattenfall
had been initially consortia partner with Iberdrola for the successful bid on East Anglia offshore wind farm,
but exited from the project.
With its pipeline, the success of Vattenfall in delivering the auctioned projects will be pivotal for the wider
confidence among investors and lenders that such material cost reductions can be achieved to make project
viable with low tariff levels.

REWIND OFFSHORE – Comparative Analysis of International Offshore Wind Energy Development, March 2017
79
Key emerging utility developers
Tenders that have been awarded under auction regimes between 2012 and 2016 demonstrate that the
majority of the market share is assumed by established developers. Some new entrants have been driven by
local content requirements in France. As no project under auctions has been constructed as of quarter 1 of
2017, developer roles and split of responsibilities within a bidder consortia are not always evident and will
only become more evident as projects progress in development and construction.
Iberdrola is a Spanish utility and acquired UK-utility Scottish Power
Renewables in 2007. To date Iberdrola has been the 11th largest
developer with one operational offshore wind farm in the UK that is
jointly owned with Dong. One wind farm is under construction in
Germany and wholly owned by Iberdrola. In terms of the market share of
awarded bids under auctions, Iberdrola is ranked second, ahead of Dong,
with its successful bid for East Anglia One and the first French offshore
round under which Iberdrola participated in a bidder consortium.
EDF is a French power utility. EDF owns Teeside, the 62 MW operational
wind farm in the UK, is developing the 41.5 MW Blyth farm in the UK, and
is part of the successful bidder consortia of three round one projects of
the French offshore wind tender that are currently under development
(Saint-Nazaire, Courseulles-sur-Mer, and Fécamp).
Enbridge is a Canadian power utility and entered the offshore wind
market in 2015 with the acquisition of shares in one UK offshore wind
project that is under construction in 2016. Enbridge is in the process of
acquiring shares in a German offshore wind project that is due to enter
into construction in 2017 and has acquired shares in French offshore
wind farms that have been awarded tender in the first round of French
offshore wind tenders.
Engie (former Gaz de France Suez) is a French gas utility that to date does
not own operational assets or those under construction. Engie was
successful as a partner of a consortium on two projects in the second
round of the French offshore wind tenders. Participation in tenders
outside France is not known.
Energias de Portugal Renovaveis (EDPR) is a Portuguese power utility
that similarly to Engie does not have previous offshore wind experience
and was a successful consortium bidder alongside Engie in the second
round of French offshore wind tenders. Participation in tenders outside
France is not known.
Shell, the Dutch oil and gas company, has re-entered the offshore wind
industry after it’s exit in 2008. The company was part of an unsuccessful
consortium (including Eneco) for Borssele 1&2, but was successful in a
consortium with Eneco and Mitsubishi/DGE in the 700 MW Borselle III
and IV tenders at €54/MWh.

REWIND OFFSHORE – Comparative Analysis of International Offshore Wind Energy Development, March 2017
80
Key IPP developers
IPP developers by their nature are typically smaller sized organisations limited by their financial capabilities
and which often sell projects prior to entering into construction. As such, these are not ranked among the
top developers in terms of market share. Nevertheless, they can be equally successful in developing and/or
delivering projects. This section sets out some of the key IPP developers, acknowledging that there are
numerous others.
Parkwind is a Belgian-based developer responsible for the Belwind,
Northwind and Nobelwind offshore wind farms financed in 2009, 2012
and 2015 respectively. The company was formed after the insolvency of
Ecoventures B. V., with staff responsible for early offshore wind
developments such as Princess Amalia in the Netherlands. Over time the
company has grown from a small entity with few employees, reliant on
contractors and consultants to deliver its services, to one of the largest
independent developers in Europe, with almost 100 staff.
WPD is a successful onshore and offshore wind developer and operator
based in Germany. Its first three offshore wind projects were developed
to the consenting phase before being sold to utility EnBW. Following this
success, the company developed German offshore wind project
Butendiek (in operation) and acquired Nordegrunde from Energiekontor
(in construction). WPD has been successful as consortium partner of the
French offshore wind auction and owns a project at an early development
stage in Sweden, albeit there is no certainty of the regulatory regime.
WPD has competed for auctions (for Kriegers Flak and the nearshore
offshore wind tender) in Denmark as a consortia partner but has been
unsuccessful to date.
Deepwater Wind was created in 2008 specifically for the development of
offshore wind projects in US waters. Deepwater is owned primarily by
affiliates of D.E. Shaw & Co, which has invested in a number of energy
projects. The Deepwater’s Block Island Wind Farm is the first offshore
wind project in the United States and it declared COD December 2016.

REWIND OFFSHORE – Comparative Analysis of International Offshore Wind Energy Development, March 2017
81
4.1.2 Success of developer models
Market share of utility and IPP developers
Acknowledging that the market share can only provide limited indication of success of developer models, the market
share and drivers of the biggest utility developers for operating projects in the key European offshore wind markets
were assessed. The analysis shows that the market share of the biggest utility developers varies materially between
the different country markets and that both utility and IPP developers have a place in the market (see Figure 16). In
Denmark and the UK, the big utilities jointly own more than half of the operating capacity. In the Netherlands and
Belgium, the market has been dominated by IPP-developers. In Germany, there is more of a balance between utility-
developers and IPP-developers. Notable in the German offshore wind market is the participation of municipality
utilities such as Stadtwerke Muenchen and Trianel, which is a consortium of 56 municipality utilities from Germany,
the Netherlands, Austria and Switzerland. Trianel’s business model demonstrates the appetite of smaller utilities to
participate in the market.
Drivers for the high utility share in the UK can include the pre-selection of sites using an auction mechanism for
exclusivity agreements that required a minimum credit rating and a smaller domestic onshore wind IPP market
which is typically the background of IPPs in the offshore wind market. With its quota obligation, UK-based utilities
had an enhanced incentive to establish renewable technologies within their portfolio.
In Belgium and the Netherlands, IPPs have been successful in attracting funding from lenders relatively early in the
market and built on that success. The smaller country market volume may also be less attractive to international
utilities than larger volume markets with established presence.
Figure 16: Market share of utility-developers in operating projects
Source: Mott MacDonald analysis, based on Wind Europe, 2016
As the European offshore wind market is in the process of transitioning to auction regimes, the industry track record
is still limited and, as such, a potential impact on the market share of developer models is yet to be validated. To
date, 13 projects have been awarded contracts under a competitive auction regime of which one developed by an
IPP has been terminated (Neart Na Gaoithe, UK). The terminated contract has been excluded for this analysis. The
remaining 12 projects represent a total capacity of 5,680 MW awarded via competitive auctions to date. None of
the awarded projects have proceeded to construction at the date of this report.
46%
4%8%
42%
Denmark12%
8%
8%
4%
5%
6%4%
53%
Germany
3%
97%
Netherlands
5.24.1
1.3 1.1 0.7
GW19%
13%
13%10%3%
7%4%
31%
The United Kingdom
16%
84%
Belgium
DONG , 12%
Innogy, 8%
Eon , 8%
Vattenfall , 4%Stadtwerke
München , 5%SSE , 6%
EnBW , 4%
IPPs, 53%
Germany DONG
RWE Innogy
Eon
Vattenfall
StadtwerkeMünchen
DONG , 19%
Innogy, 13%
Eon , 13%
Vattenfall , 10%SSE , 3%
Trianel , 7%
Iberdrola , 4%
IPPs, 31%
The United Kingdom
DONG RWE Innogy Eon Vattenfall SSE Trianel Iberdrola IPPs

REWIND OFFSHORE – Comparative Analysis of International Offshore Wind Energy Development, March 2017
82
Of the European auctions, 92% of awarded project capacity was won owned by utility-developers (see Figure 17).
The only IPP-developers that were successful in auctions to date, and remain shareholders in the projects, are RES
and WPD, which were successful in French auctions through bidding in consortia with utility developers. This early
auction structure appears to indicate that the emerging regime favours utility-developers and that IPP-developers
will rely on collaboration with utility developers.
Figure 17: Developer market share based on awarded bids under auction regimes
Source: Mott MacDonald analysis based on published auction results covering European offshore wind tender
awards between 2012 and 11/2016 in the UK, France, Denmark and Netherlands
The increasing market share of utility-developers is partially driven by the increase in project sizes, hence the
associated investment volume and requirement for placing a substantial bid bond. Increased project sizes have also
led to utilities no longer being able and/or willing to wholly assume the construction risk of a project, which is
reflected in the consortia that have been formed between the major utilities. Among the utilities, the strategies vary
in when equity partners are brought in, i.e. prior to or after bid submission.
Except for Engie and Caisse des Depots, all developers that were successful in auctions are developers with previous
offshore wind experience under quota and feed-in tariff regimes.
Vattenfall24%
Iberdrola19%
Dong12%
EDF11%
Enbridge11%
GDF Suez8%
EDPR7%
WPD4%
Caisse des Depots
2%
RES2%
REWIND OFFSHORE – Comparative Analysis of International Offshore Wind Energy Development, March 2017
83
Key success factors
Experience in the market has shown that both utilities and IPPs have established successful business models and
can operate in and adjust to different policy frameworks provided the risk-reward balance of a policy framework is
acceptable to developers.
Our analysis, stakeholder interviews and literature review confirm that there have been successes for both utility
and IPP developers. Key differentiators of successful from less successful developers are not the developer model
or policy framework design but include:
● Financial capabilities;
● Technical capabilities and experience of developer team;
● Robust planning with fall-back plans;
● Robust project agreements; and
● Appointment of experienced contractors.
With an increase of project size, investment volume and introduction of auctions and bid bonds, sound financial
capabilities are key to a developers’ success, as was confirmed with stakeholder interviews. Financial and technical
capabilities may or may not be delivered by the same entity within a developer consortium.
Technical capabilities of the developer team have been proven to be pivotal to the success of a project. Whilst risks
have been identified across the industry, the capability of effectively managing and mitigating risks varies between
developers and is a key determinant for success. Experience has shown that increasing the size of developer teams
does not always result in better results as it tends to compartmentalise teams and introduce interfaces that are
more challenging to be overseen.
With a trend towards developer consortia, it will be key that the developers’ project management teams are
equipped with sufficient authority to act swiftly. Successful developer teams tend to have established fall back plans
early in the process which enables them to deal with risks effectively as and when they arise.
With a greater number of project agreements, the interface risk is higher. However, experience in the industry to
date has shown that there is no direct relationship between developer success, project cost and the number of
contracts. The driver for success is less to do with the number of contracts, but rather the detail of the terms and
conditions under each contract and how interface risks are managed. Contracts of successful projects tend to be
clearer in their risk allocation and interfaces, as such leaving less potential for disputes and cost overrun. Contract
suites of successful projects include a robust incentive and penalty regime that focusses on mitigation of key
developer risks. With the provision of schedule float between the works under different contracts interface risks can
be managed effectively.
Likewise, experienced contractors are a key success factor but it is crucial that they are experienced in the assigned
scope of work. Additionally, familiarity between different (consortia) contractors and/or between the contractor
and the developer can be a supporting factor for successful delivery.
Factors of failure
Examples in the early days of the offshore wind industry have shown that some contractors pre-maturely took on
EPC contractor roles for work packages that were not always successfully delivered. Lower number of contracts in
the beginning of the industry did not result in lower contingency expenditure by developer, as contractor’s were not
yet ready to manage EPC contractor risk and owners effectively provided support. Contrary, some IPP-developers
that rely on project finance, were not able to attract debt funding due a contracting strategies using too many
construction contracts and inadequate risk mitigation.

REWIND OFFSHORE – Comparative Analysis of International Offshore Wind Energy Development, March 2017
84
4.1.3 Recent trends in the developer models
Table 15: Trends in developer strategies
Developer Utility-Developer IPP-Developer
Development Consortia set up with other utilities and/or IPP developers to share development risk pre-construction/pre-bid award and manage risks of increasing project sizes, hence investment volumes.
Increasing pressures for cost reduction led to the adoption of innovative technologies with shorter track records e.g. larger WTGs.
Teams growing in size and experience.
Finance parties more willing to accept technologies with shorter track records e.g. larger WTGs.
New entrants (such as marine contractors and oil and gas companies) participating in recent auctions in development roles.
Option to partner with utilities as bidder
consortium under auction regimes (e.g. WPD and
RES in French offshore tenders).
Procurement Utilities are tending to use fewer contracts, similar to the IPPs, reflecting greater levels of trust in the supply chain.
Some utilities have offered EPC contracts between the utility and Special Purpose Vehicle (SPV) to attract pre-construction finance. Underwriting below these EPC contracts (where offered).
Projects with high levels of construction risk (e.g. a large number of contracts and no EPC arrangements) have typically had to offer some level of protection at shareholder level to attract pre-construction finance.
Use of multi-contract strategy, typically 4 – 6, becoming acceptable and investors becoming comfortable with the SPV taking more risk within the contractual suite (e.g. weather risk sharing).
Move to auction systems may require developers to
take more construction risk to remain competitive.
Financing Costs associated with larger project sizes are requiring external equity and in some cases debt. Wide variety of financing options being seen, with associated impacts on development style:
Pre-construction finance becoming available from financial institutions with higher level of construction risk appetite.
Project-finance being used as alternative to balance-sheet financing.
Recycling capital at the date operations commences becoming easier, although investors typically require some insulation from O&M cost downsides.
Due to lack of capital at the independent developer
level, equity and debt financing typically required
before construction commences.
Operations Utilities still typically take over O&M after 2 to 5 years but are becoming willing to offer more robust contractual terms to the SPV, e.g. relatively fixed price long term availability warranty backed O&M contracts, to attract investment.
Utilities with large portfolios in a certain area e.g. around Barrow-in-Furness, UK, setting up O&M hubs to serve multiple wind farms.
Larger scope/packages for balance of plant O&M.
Financial investors have preferred the lower risk option of a long-term WTG O&M contract although it is unclear whether the increased cost of these contracts will allow developers to remain competitive in upcoming auctions without reducing contract term.
While earlier projects often contracted balance of
plant O&M to a single institution, developers are
becoming experienced at delivering these services
and investors comfortable taking associated risks.
Source: Mott MacDonald
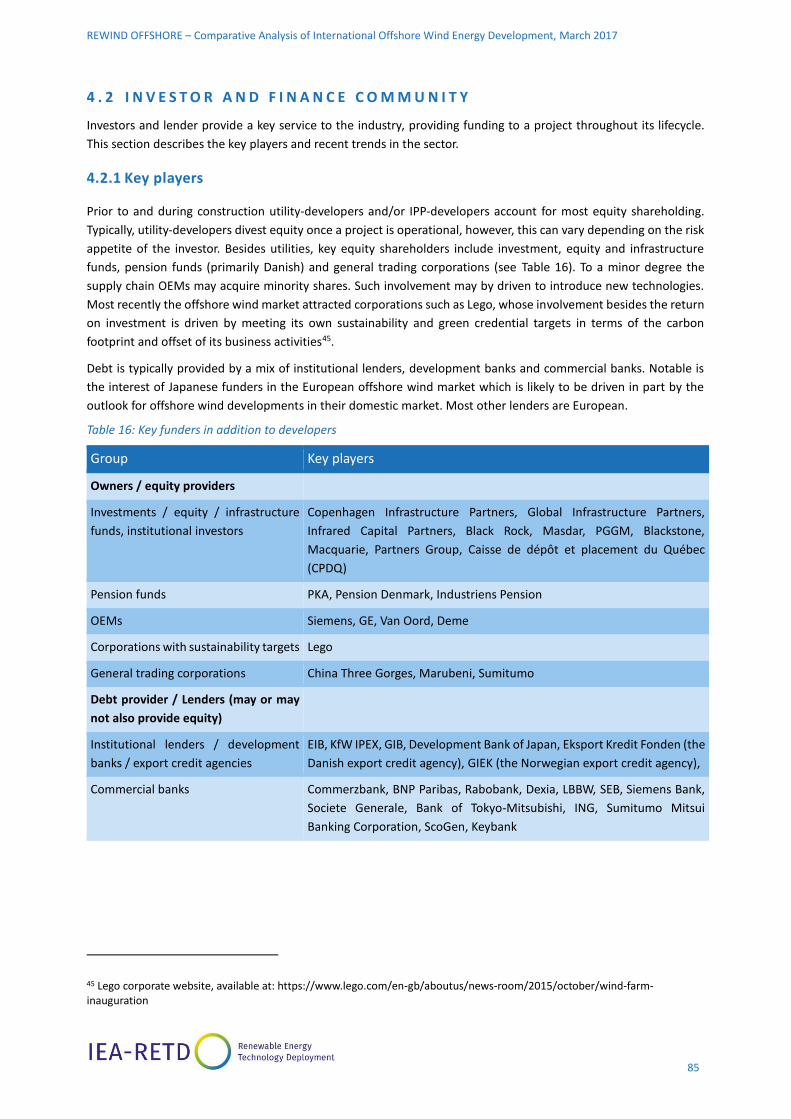
REWIND OFFSHORE – Comparative Analysis of International Offshore Wind Energy Development, March 2017
85
4 . 2 I N V E S T O R A N D F I N A N C E C O M M U N I T Y
Investors and lender provide a key service to the industry, providing funding to a project throughout its lifecycle.
This section describes the key players and recent trends in the sector.
4.2.1 Key players
Prior to and during construction utility-developers and/or IPP-developers account for most equity shareholding.
Typically, utility-developers divest equity once a project is operational, however, this can vary depending on the risk
appetite of the investor. Besides utilities, key equity shareholders include investment, equity and infrastructure
funds, pension funds (primarily Danish) and general trading corporations (see Table 16). To a minor degree the
supply chain OEMs may acquire minority shares. Such involvement may by driven to introduce new technologies.
Most recently the offshore wind market attracted corporations such as Lego, whose involvement besides the return
on investment is driven by meeting its own sustainability and green credential targets in terms of the carbon
footprint and offset of its business activities45.
Debt is typically provided by a mix of institutional lenders, development banks and commercial banks. Notable is
the interest of Japanese funders in the European offshore wind market which is likely to be driven in part by the
outlook for offshore wind developments in their domestic market. Most other lenders are European.
Table 16: Key funders in addition to developers
Group Key players
Owners / equity providers
Investments / equity / infrastructure
funds, institutional investors
Copenhagen Infrastructure Partners, Global Infrastructure Partners,
Infrared Capital Partners, Black Rock, Masdar, PGGM, Blackstone,
Macquarie, Partners Group, Caisse de dépôt et placement du Québec
(CPDQ)
Pension funds PKA, Pension Denmark, Industriens Pension
OEMs Siemens, GE, Van Oord, Deme
Corporations with sustainability targets Lego
General trading corporations China Three Gorges, Marubeni, Sumitumo
Debt provider / Lenders (may or may
not also provide equity)
Institutional lenders / development
banks / export credit agencies
EIB, KfW IPEX, GIB, Development Bank of Japan, Eksport Kredit Fonden (the
Danish export credit agency), GIEK (the Norwegian export credit agency),
Commercial banks Commerzbank, BNP Paribas, Rabobank, Dexia, LBBW, SEB, Siemens Bank,
Societe Generale, Bank of Tokyo-Mitsubishi, ING, Sumitumo Mitsui
Banking Corporation, ScoGen, Keybank
45 Lego corporate website, available at: https://www.lego.com/en-gb/aboutus/news-room/2015/october/wind-farm-inauguration

REWIND OFFSHORE – Comparative Analysis of International Offshore Wind Energy Development, March 2017
86
4.2.2 Key trends
A majority of early offshore wind projects were funded on balance sheet, reflecting the preferences of early
investors (i.e. utility-developers) rather than a lack of bank appetite. However, the absolute volume of project
financed transactions has grown steadily since 2013 (see Figure 18).
Figure 18: Market share of project-financing
Source: Green Giraffe, based on WindEurope data and internal database
The reasons for a higher share of non-recourse funded projects compared to the industry’s infancy years is driven
by the following:
● The parties which used to prefer the balance sheet route, utilities, are now seeing severe constraints on their
ability to fund projects in full themselves, under pressure from investors and rating agencies to reduce their
corporate debt. They will now either use project finance themselves or sell part of the project to investors which
want to use project finance.
● There is a growing number of experienced independent developers which are competent enough to bring a
project to the stage it can be built, but do not have the funding themselves. Such developers, like Parkwind,
WPD, Deepwater and Northland Power, typically raise project finance both to raise the necessary funding and
to improve the return on equity of their investment.
● More importantly, the project finance market has shown itself to provide sufficient depth and capacity to fund
large scale offshore wind projects on competitive terms (like the €2.8 billion, 600 MW Gemini project in the
Netherlands reaching financial close in 2014, or the £2.2 billion/ equiv.€2.6bn , 588 MW Beatrice project in the
UK reaching financial close in 2016).
● Cost of project financing has come down due to increased confidence from lenders.
With close to 50 lenders which have taken offshore wind risk today - of which the majority have construction
exposure - at least €3-5 billion in risk commitments are available per year from the commercial market. In addition,
public financial institutions like export credit agencies, the European Investment Bank, or national institutions like
KfW (Germany) or the GIB (UK) have been willing to provide substantial funding to the sector as part of broader
policies to support investment in low-carbon projects. They will typically contribute as much and often more than
all the commercial banks put together in any given deal.
27%
59% 79%42%
18%56%
46%
81%
0
500
1,000
1,500
2,000
2,500
3,000
3,500
2009 2010 2011 2012 2013 2014 2015 2016e
An
nu
al c
apac
ity
add
itio
ns
(MW
)
Installed capacity (MW)
Project financed capacity (MW)
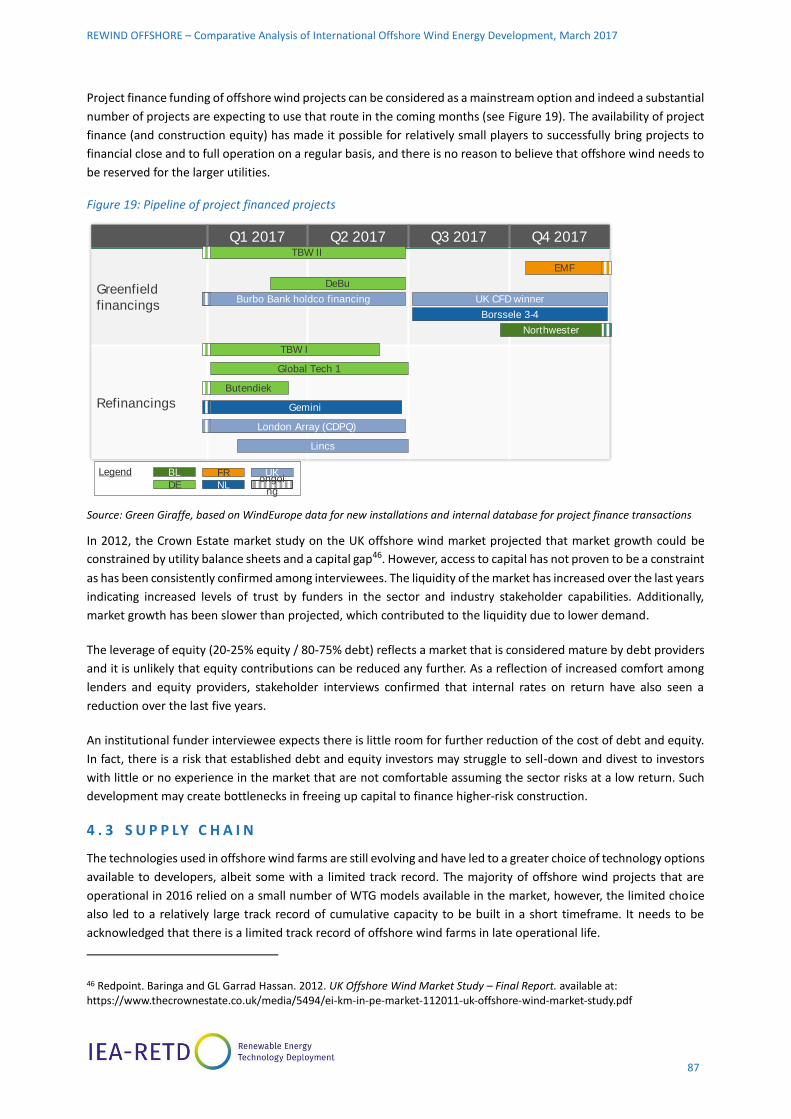
REWIND OFFSHORE – Comparative Analysis of International Offshore Wind Energy Development, March 2017
87
Project finance funding of offshore wind projects can be considered as a mainstream option and indeed a substantial
number of projects are expecting to use that route in the coming months (see Figure 19). The availability of project
finance (and construction equity) has made it possible for relatively small players to successfully bring projects to
financial close and to full operation on a regular basis, and there is no reason to believe that offshore wind needs to
be reserved for the larger utilities.
Figure 19: Pipeline of project financed projects
Source: Green Giraffe, based on WindEurope data for new installations and internal database for project finance transactions
In 2012, the Crown Estate market study on the UK offshore wind market projected that market growth could be
constrained by utility balance sheets and a capital gap46. However, access to capital has not proven to be a constraint
as has been consistently confirmed among interviewees. The liquidity of the market has increased over the last years
indicating increased levels of trust by funders in the sector and industry stakeholder capabilities. Additionally,
market growth has been slower than projected, which contributed to the liquidity due to lower demand.
The leverage of equity (20-25% equity / 80-75% debt) reflects a market that is considered mature by debt providers
and it is unlikely that equity contributions can be reduced any further. As a reflection of increased comfort among
lenders and equity providers, stakeholder interviews confirmed that internal rates on return have also seen a
reduction over the last five years.
An institutional funder interviewee expects there is little room for further reduction of the cost of debt and equity.
In fact, there is a risk that established debt and equity investors may struggle to sell-down and divest to investors
with little or no experience in the market that are not comfortable assuming the sector risks at a low return. Such
development may create bottlenecks in freeing up capital to finance higher-risk construction.
4 . 3 S U P P LY C H A I N
The technologies used in offshore wind farms are still evolving and have led to a greater choice of technology options
available to developers, albeit some with a limited track record. The majority of offshore wind projects that are
operational in 2016 relied on a small number of WTG models available in the market, however, the limited choice
also led to a relatively large track record of cumulative capacity to be built in a short timeframe. It needs to be
acknowledged that there is a limited track record of offshore wind farms in late operational life.
46 Redpoint. Baringa and GL Garrad Hassan. 2012. UK Offshore Wind Market Study – Final Report. available at: https://www.thecrownestate.co.uk/media/5494/ei-km-in-pe-market-112011-uk-offshore-wind-market-study.pdf
Q1 2017 Q2 2017 Q3 2017 Q4 2017
Greenfield
financings
Refinancings
Northwester
Burbo Bank holdco financing
EMF
Borssele 3-4
BLLegend
DE
FR UK
NLongoi
ng
TBW II
DeBu
UK CFD winner
Gemini
TBW I
Global Tech 1
Butendiek
London Array (CDPQ)
Lincs
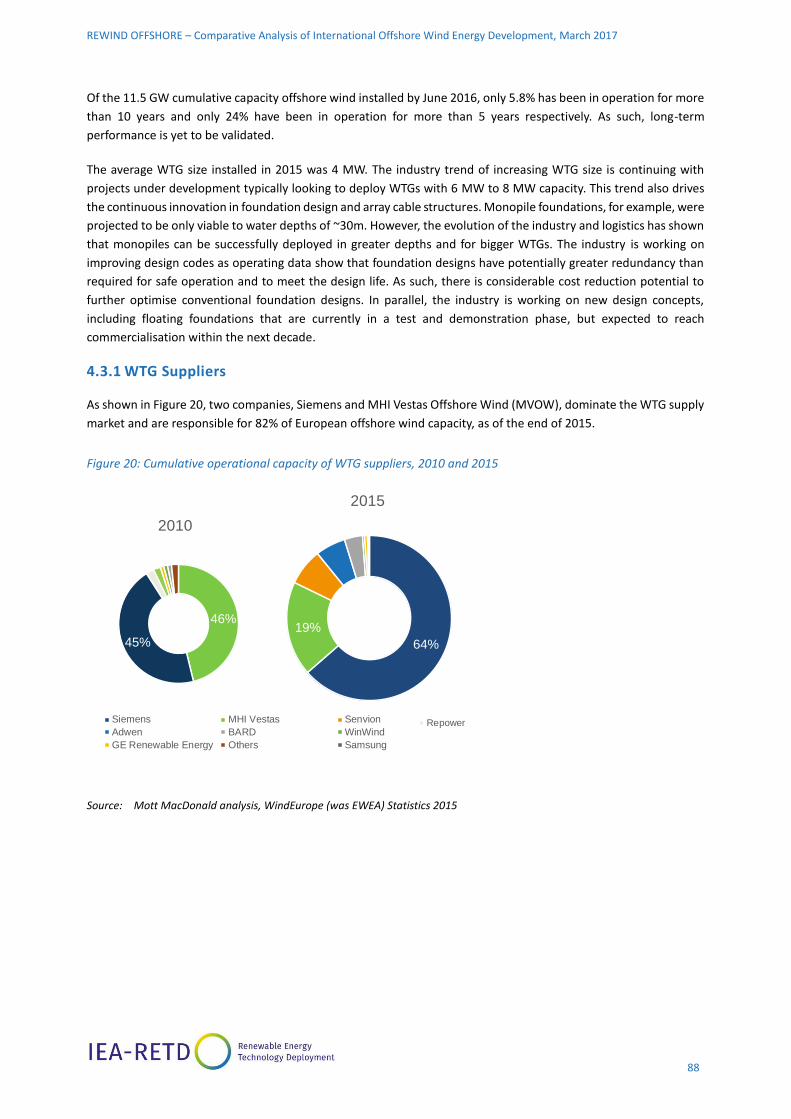
REWIND OFFSHORE – Comparative Analysis of International Offshore Wind Energy Development, March 2017
88
Of the 11.5 GW cumulative capacity offshore wind installed by June 2016, only 5.8% has been in operation for more
than 10 years and only 24% have been in operation for more than 5 years respectively. As such, long-term
performance is yet to be validated.
The average WTG size installed in 2015 was 4 MW. The industry trend of increasing WTG size is continuing with
projects under development typically looking to deploy WTGs with 6 MW to 8 MW capacity. This trend also drives
the continuous innovation in foundation design and array cable structures. Monopile foundations, for example, were
projected to be only viable to water depths of ~30m. However, the evolution of the industry and logistics has shown
that monopiles can be successfully deployed in greater depths and for bigger WTGs. The industry is working on
improving design codes as operating data show that foundation designs have potentially greater redundancy than
required for safe operation and to meet the design life. As such, there is considerable cost reduction potential to
further optimise conventional foundation designs. In parallel, the industry is working on new design concepts,
including floating foundations that are currently in a test and demonstration phase, but expected to reach
commercialisation within the next decade.
4.3.1 WTG Suppliers
As shown in Figure 20, two companies, Siemens and MHI Vestas Offshore Wind (MVOW), dominate the WTG supply
market and are responsible for 82% of European offshore wind capacity, as of the end of 2015.
Figure 20: Cumulative operational capacity of WTG suppliers, 2010 and 2015
Source: Mott MacDonald analysis, WindEurope (was EWEA) Statistics 2015
64%
19%
2015
46%
45%
2010
Vestas46.0%
Siemens45.0%
Repower2.0%
WinWind2.0%
GE1.0%
Areva1.0%
BARD1.0%
Others2.0%
2010
Vestas
Siemens
Repower
WinWind
GE
Areva
BARD
Others
Siemens, 63.5%
MHI Vestas, 18.5%
Senvion, 7.4%
Adwen, 5.7%
BARD, 3.6%
WinWind, 0.5%
GE Renewable Energy, 0.4%
Others, 0.3%
Samsung , 0.1%
Siemens MHI Vestas Senvion
Adwen BARD WinWind
GE Renewable Energy Others Samsung

REWIND OFFSHORE – Comparative Analysis of International Offshore Wind Energy Development, March 2017
89
Trends
The market has seen several new players entering the market but also a consolidation in ownership of market players
which is typical for new markets and technologies. Market exits include Bard, Clipper, Alstom, Areva and Samsung.
Ownership of WTG suppliers has transitioned from OEMs whose sole background was onshore WTG manufacturing
to multi-sector-multinational technology corporations such as GE and MHI with greater financial capabilities.
A significant share of the industry’s cost reduction is expected to come from the use of larger and more efficient
WTG technology47. Table 17 outlines the ten largest offshore WTGs that are under development and/or in serial
production. Only two of the ten are owned by the two major players of the market to date. Another two were
developed by Adwen, a joint venture between Areva and Gamesa. In September 2016, Areva announced sale of its
50% shareholding in Adwen to Gamesa to take on sole ownership of Adwen. Gamesa, in turn, is undergoing
acquisition by Siemens.
47 ORE Catapult. 2015. Cost reduction monitoring framework – summary report to the Offshore Wind Programme Board. available at: https://ore.catapult.org.uk/wp-content/uploads/2016/05/CRMF-ORE-Catapult-report-to-the-OWPB.pdf
Capacity installed (Europe): 7,002 MW
Since 1980, with the development of the first 22kW wind turbine, Siemens (originally Bonus Energy) has
built a track record for the development of wind energy devices. Nowadays Siemens is a global leader, with
more than 27 GW of wind power installed to date, of which 7.3 GW is offshore wind capacity.
Siemens has held the worldwide leading position in offshore wind turbine sales since 2008, albeit with a
reduction in market share recently. The company’s success has primarily been based around a 3.6/4 MW
unit. However, Siemens has scaled up its offerings with 6 MW and 7 MW units and its next generation of 8
MW units. In 2010, Siemens also acquired minority shares in the offshore wind installation company A2SEA.
Capacity Installed: 2,040 MW
MHI Vestas Offshore Wind (MVOW) was founded in April 2014, as a 50/50 joint venture between Vestas
Wind Systems and Mitsubishi Heavy Industries. Since then, MVOW has employed about 1,300 people and
has orders amounting to 1.7 GW in the pipeline. A new blade factory was set up in 2015 on the Isle of Wight
to manufacture the blades for the V164-8.0 wind turbine.
Vestas Wind Systems is a Danish based company and a leading manufacturer of onshore and offshore wind
turbines. The company has a track record in the production and installation of more than 58,000 turbines
worldwide as of 30 September 2016 and has been involved with offshore wind since 1995. Mitsubishi has
been involved in the research and development of WTGs since 1980 and subsequently went on to
manufacture WTGs in the range of 250 kW to 2.4 MW. While Vestas had suffered some technical and financial
issues which affected its attractiveness in the late 2000s and early 2010s, since forming the MVOW joint
venture the firm has regained its foothold in the industry and has become well regarded in projects currently
under development. MVOW offers a range of offshore wind turbines from 3 MW units to the largest wind
turbine currently available, the V164-9 MW.

REWIND OFFSHORE – Comparative Analysis of International Offshore Wind Energy Development, March 2017
90
As such, it remains yet to be seen how Siemens is going to manage its overall product portfolio after acquisition.
After its involvement in Arklow Bank in 2004, GE exited the market and only returned in November 2015 with the
acquisition of Alstom, taking ownership of the 6 MW Haliade technology.
Eight of the ten largest WTG models are provided by WTG suppliers with European headquarters. Assembly facilities
of key components such as blades and the nacelle are typically located within Europe, however, sub-suppliers of key
components may deliver from outside Europe. Chinese suppliers such as Dongfang and Ming Yang are aiming to
deliver internationally, however, no Chinese suppliers had concluded a contract in Europe at the date of this report.
Table 17: Largest offshore wind turbines
WTG Capacity Supplier Market readiness Technology
V164 9MW 9MW MHI-Vestas Launched January 2017 Based on the V164 8MW Medium-speed geared
AD-180 8MW Adwen Selected for 3 French projects Medium-speed geared
V164 8MW 8MW MHI Vestas Serial production Medium-speed geared
SWT-9.0-154 8MW Siemens 7MW version obtained type certificate in 01/2016
Direct drive
6.2M152 6.15 MW Senvion Serial production, prototype installed in 12/2014, 200+ units operational or under construction
High speed geared
Haliade 6 MW GE Commissioned on first commercial project Block Island Selected on 3 French projects and Merkur, Germany
Direct drive
SCO 6.0 MW 6 MW Ming Yang Prototype installed in 2014, 8 MW version is being worked on for markets in and outside China
Medium-speed geared
SL6000 6 MW Sinovel Launched in 2011, but only deployed in 1 commercial project to date, financial difficulties delayed development of 10 MW unit
High speed geared
Dongfang/Hyundai Heavy Industries 5.5 MW
5.5 MW Dongfang/ Hyundai Heavy Industries
Under development High-speed geared
AD5-135 5 MW Adwen Serial production, more than 200 in operation of this and predecessor models
Low-speed geared
Source: Wind Power Monthly (2016), and Offsore Wind Industry (2017)

REWIND OFFSHORE – Comparative Analysis of International Offshore Wind Energy Development, March 2017
91
4.3.2 Foundation suppliers
Foundations are often manufactured by large steel companies, such as Bladt Industries, which has been the lead
foundation supplier in the offshore wind market over the last four years (see Figure 21). Founded in 1965, Bladt is
active in the offshore wind market, as well as the oil and gas industry and infrastructure (including bridges, harbour
and marine, buildings and steel tanks). Bladt provides monopiles, transition pieces, XL foundations and jacket
foundations for offshore wind. Since the first foundation in 2002, Bladt has delivered more than 1,300 foundations
to offshore wind farms.
EEW Special Pipe Constructions GmbH (EEW SPC), established in 2008, is part of the larger EEW Group.
Erndtebrücker Eisenwerk GmbH & Co. KG (EEW) was founded in 1936 in Germany and has developed to one of the
key large-diameter steel pipe manufactures for oil & gas industry, offshore wind industry, power plants and civil
construction. Manufacturing of offshore foundation is done in EEW SPCs production facilities in Rostock, Germany.
In March 2016, EEW SPC manufactured the heaviest monopole at the time for the German Veja Mate offshore wind
warm. The monopile has a diameter of 7.8m, a length of 82.2 and weighs 1,300 tons48.
In 2014, Bladt and EEW SPC established a joint venture Offshore Structures (Britain) Limited, a manufacturing facility
in Stockton, UK to extend its presence in the UK market49. Sif, the third key player in the foundation market, is a
Dutch steel tubular manufacturer for the offshore oil & gas and wind industry with an experience of over 65 years
and more than 1,200 foundations manufactured to date50.
While most of the foundation manufacturing is based in Europe, there are some examples of component
manufacturing based elsewhere. CS Wind supplies transition pieces for WTG and Offshore High Voltage Substations
(OHVS). The company can produce 2,300 towers annually at its production facilities in Vietnam, China and Canada.
Foundation design is the one of the key aspects and risk factors in the development of an offshore wind farm with
only a few capable foundation designers (such as the Danish consultancies Ramboll and COWI) being available in
the market.
Figure 21: Market share of foundation suppliers (period 2012 – 2015)
Source: Mott MacDonald analysis, Wind Europe (formerly EWEA) Statistics 2015
48 EEW Special Pip Constructions corporate website, available at: http://www.eewspc.com/products.html
49 4C Offshore. 2015. Offshore Structures (Britain) opens its doors. available at: http://www.4coffshore.com/windfarms/offshore-structures-(britain)-opens-its-doors-nid2374.html
50 Sif group corporate website, available at: https://sif-group.com/en/references/13-references
Bladt Industries
36%
EEW17%
Sif16%
Ambau GmbH6%
Smulders4%
Others21%

REWIND OFFSHORE – Comparative Analysis of International Offshore Wind Energy Development, March 2017
92
4.3.3 Cable suppliers
Cabling for offshore wind projects is split between array cables (between turbines) and export cables (which takes
electricity generated by the farm to the substation).
Nexans has been a key provider for array cables over the last three years, with over 405 cables (25% market share)
manufactured and energised (see Figure 22)51. The French cable supplier was founded in 2000 and its core
businesses includes power transmission and distribution, energy resources (renewables, Oil & Gas), transportation
and building. Nexans supplies and lays MV subsea array cables as well as MV and HV export links to the onshore
substation and owns a cable-laying vessel, the C/S Nexans Skagerrak.
Prysmian Group is a key player in both the export cable (45% market share – see Figure 23) and array cables (23%
market share). Prysmian Group is a global player in energy and telecom cable and systems sectors, with over 140
years of experience. Headquartered in Milan, Italy, the group was established through a merger of Prysmian Srl and
Draka in February 2011. Prysmian Group owns three cable-laying vessels; Ulisse, Giulio Verne and Cable Enterprise.
The German cable manufacturer, NSW (Norddeutsche Seekabelwerke) had a 26.3% share in the array cable market
in 2015, up from 16% between 2013 and 2015. Founded in 1899, NSW core business lies within the submarine cable
technology and communications. NSE covers the design, manufacture, delivery and installation of the cables utilising
the NWS operated cable lay barge Nostag 10.
JDR Cable Systems, with 13% of the array cable market share between 2013 and 2015, was established in the early
1990s with the merger of the British Jacques Cable Systems and the Dutch De Regt Special Cable company. Its main
manufacturing facility to supply the offshore wind market is in Hartlepool, UK, and JDR supplied the inter array
cabling the Greater Gabbard project in the UK and the Meewind project in Germany.
NKT cables was founded in 1891 and has presence in China, Germany, Sweden, Poland, Czech, Norway and Denmark.
NKT provided the infield and export cables for the first commercial offshore wind farm in Germany, Baltic 1. In
September 2016, it was announced that NKT cables will acquire ABB’s HV cable business, including a new cable
laying vessel to be delivered in Q1 201752,53. ABB HV Cables is a key market player in the high-voltage cable system
market for submarine power transmission systems.
Figure 22: Array cable supplier (period 2013 – 2015)
Figure 23: Export cable supplier (2015)
Source: WindEurope
51 Nexans corporate website, available at: http://www.nexans.com/eservice/Corporate-en/navigate_-10/Global_expert_in_cables_and_cabling_systems.html
52 Bloomberg. 2016. ABB to sell cables business to Danish NKT for US$ 934 million (equiv. €884). available at: https://www.bloomberg.com/news/articles/2016-09-21/abb-to-sell-cable-business-to-nkt-cables-for-934-million
53 NKT cables corporate website, available at: http://www2.nktcables.com/about-us/news-events/news/news-report/news/nkt-cables-to-acquire-abbs-high-voltage-cables-business-creating-a-leading-power-cable-company.html
Nexans26%
Prysmian23%NSW
16%
JDR13%
Park Scanrope
9%
NKT8%
ABB4%
Others1%
Prysmian45%
NKT21%
ABB15%
NSW13%
LS Cable & Systems
6%
REWIND OFFSHORE – Comparative Analysis of International Offshore Wind Energy Development, March 2017
93
4.3.4 Installation contractors
Installation can be broken down to three main categories: foundations, WTGs and cables. As mentioned above, most
cable suppliers own cable laying vessels. Other companies specialised in cable laying operations are Siem Offshore
Contractors (SOC) and VBMS BV. Installation of offshore cables requires a dedicated cable laying vessel (CLV) or barge
equipped with a turntable storage facility. The handling of the cable during installation is important as specific cable
properties, such as the limit of the bend radius or the cable burial depth, define the installation methods.
Key installation companies are A2SEA (partially owned by Dong), GeoSea (DEME Group), Scaldis Salvage (DEME
Group), Jan de Nul Group, MPI Offshore, Seaway Heavy Lifting, Fred.Olsen, and Van Oord. Most of these installation
companies come from a marine oil & gas background and existing vessels have been adapted to execute turbine
and foundation installation.
Offshore substations are usually developed by consortia or joint ventures, made up of a civil and an electrical
company and delivered under an EPCI approach. Offshore substation design services and equipment, such as
transformers and switchgear, are usually provided by large players in electrical system supply, such as ABB, Siemens
and Alstom (now GE Grid). Manufacturers of the topsides include companies such as Bladt, Engie Fabricom (formerly
Cofely Fabricom GDF Suez), and Herema Hartlepool Ltd.

REWIND OFFSHORE – Comparative Analysis of International Offshore Wind Energy Development, March 2017
94
4.3.5 Geographical location of industry sectors
Wind turbine manufacturing
With the sector’s infancy in Denmark, a number of WTG manufacturing facilities in the offshore wind industry are
located in these areas including Brande, Aarlborg and the port of Esbjerg in Denmark. Since then, the industry has
seen a growth and geographical diversification of the supply chain facilities, including the hubs in Rostock,
Bremerhaven and Cuxhaven in Germany, as well as the Humber region in the UK where Siemens is establishing blade
manufacturing facilities and Dong a service harbour.
Emerging markets in which no projects are yet operational aim to establish at least a partial domestic supply chain,
including France, the USA and Chinese Taipei. In France, the use of a domestic supply chain by developers was
encouraged through local content requirements in the auction design. In response, Alstom has established nacelle
assembly facilities in Saint-Nazaire.
The USA has a strong focus on ensuring local participation in the sector as it grows. The country has an indigenous
supply chain with substantial oil and gas experience and the supply chain has reasonable transferrable capabilities
in cable and foundation manufacture and marine contracting. However, availability of large vessels for foundation
and WTG installation is currently a challenge, in part due to legislation which heavily restricts the operation of non-
US flagged vessels in US waters (“The Jones Act”). Alstom, which is in the process of being procured by US firm
General Electric, provided the WTGs for Block Island and has a strong presence in the USA. Siemens is also
committed to the country and is working to supply a number of projects in development.
Chinese Taipei is looking to grow its local supply chain for offshore wind but appears set to use Siemens and other
European turbines in the short term.
For larger components and assembly, manufacturing facilities typically require harbour access to mitigate
requirement for road transport, which may not be feasible for greater dimension parts. While wind turbine
manufacturers generally assemble key components, they do not necessarily manufacture all key components in-
house, including procurement from non-European facilities.
Balance of plant
Balance of plant manufacturing facilities are more widely spread, including the UK, Germany, Netherlands, Belgium,
France, Spain, and Korea. The majority of the supply chain and value creation to date though remains in Europe.
However, a number of plans for manufacturing facilities across Europe have been cancelled or put on hold over the
last years due to delays in projects and market growth, as well as a lack of confidence in the size of the market
beyond 202054. Following the Brexit vote, investors in the UK supply chain are facing increased uncertainty levels.
Siemens, for example, announced putting further investments in the UK supply chain on hold due to the
uncertainties caused by the Brexit vote55.
Overall, as was confirmed by stakeholder interviews, the level of competition has improved and the overall supply
chain is perceived to be more robust than a few years ago.
54 ORE Catapult. 2015. Cost reduction monitoring framework – summary report to the Offshore Wind Programme Board. available at: https://ore.catapult.org.uk/wp-content/uploads/2016/05/CRMF-ORE-Catapult-report-to-the-OWPB.pdf
55 The Guardian. 2016. Siemens freezes new UK wind power investment following Brexit vote. available at: https://www.theguardian.com/environment/2016/jun/28/siemens-freezes-new-uk-wind-power-investment-following-brexit-vote

REWIND OFFSHORE – Comparative Analysis of International Offshore Wind Energy Development, March 2017
95
4 . 4 C O M P A R AT I V E A N A LY S I S O F N AT I O N A L I N D U S T R I E S
4.4.1 Overview
This section sets out a comparative analysis of industry structures in the key European offshore wind markets the
UK, Germany and the Netherlands, as well as emerging markets.
4.4.2 United Kingdom
The United Kingdom has been one of the driving forces behind development of the offshore wind sector in the
2000s, and represents the largest offshore wind market in the world, with just over 5 GW of operational capacity as
of June 2016. Figure 24 shows a map of the UK’s offshore wind developments.
Figure 24: UK offshore wind map
Source: Crown Estate, 2016
The UK industry is characterised by a high level of international participation. Major developers that currently own
operating offshore farms are Dong, Innogy, E.ON, Vattenfall, SSE, Trianel and Iberdrola. Note that only one of these
developers (SSE) is indigenous, after the market exit of Centrica and the acquisition of Scottish Power by Iberdrola.
Large utility-developers, as opposed to IPP-developers, dominate project development with almost 70% ownership
of operating windfarms. Dominance of the utility-developers goes hand in hand with the historically relatively low
use of project finance, with the utility developers preferring to fund projects on balance sheet. However, there are
signs of change, given the requirements of increased investment volumes due to larger wind farms.
As the UK industry has matured the risks (perceived and real), particularly in the operational phase of an offshore
wind farm, have reduced. Lower risk perception has brought in more risk averse investors into commissioned
projects, allowing large utilities to recycle equity into project development.
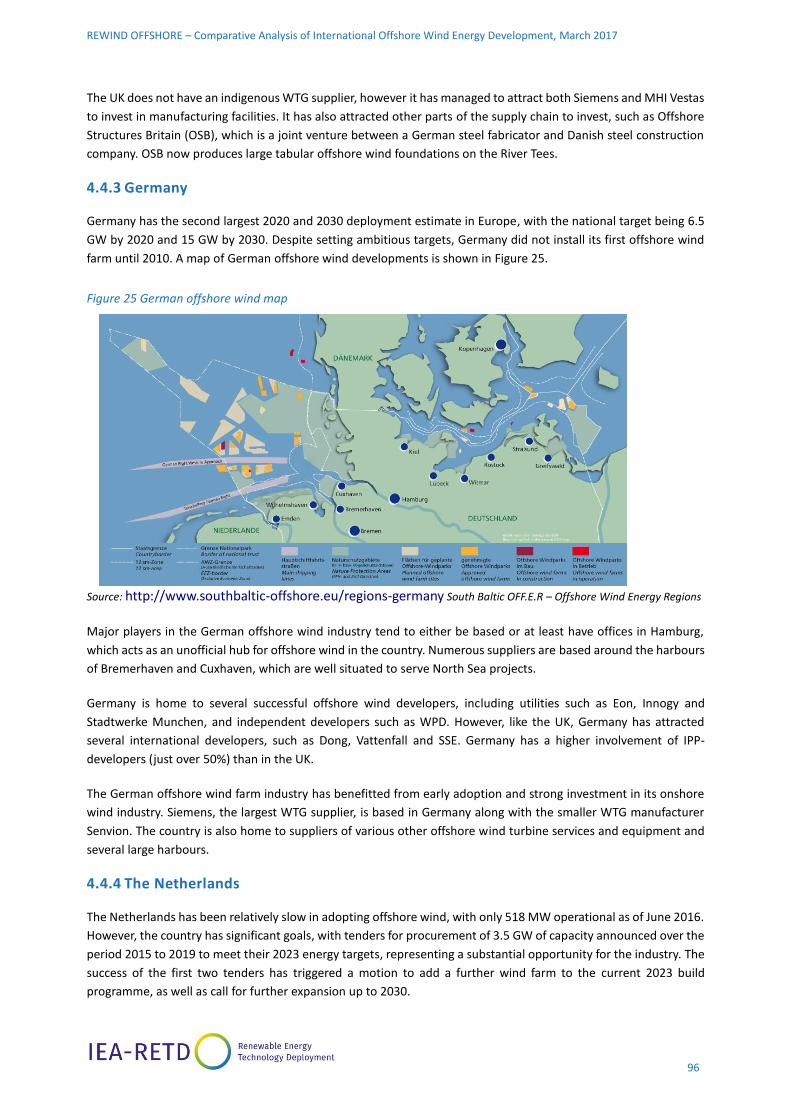
REWIND OFFSHORE – Comparative Analysis of International Offshore Wind Energy Development, March 2017
96
The UK does not have an indigenous WTG supplier, however it has managed to attract both Siemens and MHI Vestas
to invest in manufacturing facilities. It has also attracted other parts of the supply chain to invest, such as Offshore
Structures Britain (OSB), which is a joint venture between a German steel fabricator and Danish steel construction
company. OSB now produces large tabular offshore wind foundations on the River Tees.
4.4.3 Germany
Germany has the second largest 2020 and 2030 deployment estimate in Europe, with the national target being 6.5
GW by 2020 and 15 GW by 2030. Despite setting ambitious targets, Germany did not install its first offshore wind
farm until 2010. A map of German offshore wind developments is shown in Figure 25.
Figure 25 German offshore wind map
Source: http://www.southbaltic-offshore.eu/regions-germany South Baltic OFF.E.R – Offshore Wind Energy Regions
Major players in the German offshore wind industry tend to either be based or at least have offices in Hamburg,
which acts as an unofficial hub for offshore wind in the country. Numerous suppliers are based around the harbours
of Bremerhaven and Cuxhaven, which are well situated to serve North Sea projects.
Germany is home to several successful offshore wind developers, including utilities such as Eon, Innogy and
Stadtwerke Munchen, and independent developers such as WPD. However, like the UK, Germany has attracted
several international developers, such as Dong, Vattenfall and SSE. Germany has a higher involvement of IPP-
developers (just over 50%) than in the UK.
The German offshore wind farm industry has benefitted from early adoption and strong investment in its onshore
wind industry. Siemens, the largest WTG supplier, is based in Germany along with the smaller WTG manufacturer
Senvion. The country is also home to suppliers of various other offshore wind turbine services and equipment and
several large harbours.
4.4.4 The Netherlands
The Netherlands has been relatively slow in adopting offshore wind, with only 518 MW operational as of June 2016.
However, the country has significant goals, with tenders for procurement of 3.5 GW of capacity announced over the
period 2015 to 2019 to meet their 2023 energy targets, representing a substantial opportunity for the industry. The
success of the first two tenders has triggered a motion to add a further wind farm to the current 2023 build
programme, as well as call for further expansion up to 2030.

REWIND OFFSHORE – Comparative Analysis of International Offshore Wind Energy Development, March 2017
97
Unlike the UK and Denmark, where a large percentage of projects has been developed by utilities, the Netherlands
has attracted more independent developers. Princess Amalia was the first project financed offshore wind farm when
it achieved financial close in 2007, and in 2014, the Dutch offshore wind project Gemini achieved financial close.
This 600 MW scheme represents the largest renewables facility ever financed through a project finance scheme and
forms a substantial industry milestone. The recent auction for Borssele I&II was awarded to utility developer Dong
and, as such, following an industry wide trend of favouring utility developers under auction regimes. Borselle III &
IV was awarded to a consortium of Shell, Eneco and Mitsubishi/DGE.
The Netherlands is also home to several the largest marine contractors in offshore wind, including Van Oord and
Seaway Heavy Lifting. Finally, the country has several harbours which have been used in offshore wind, not only in
The Netherlands but also to service projects in Belgium and the UK.
4.4.5 Industry structure in emerging markets
By the end of 2016, total offshore wind installed capacity was 14.4 GW, of which 87% was installed in Europe and
11% in China. Demonstrator plants are installed in Japan, South Korea and during 2016 the first offshore wind farm
was constructed in the US. In terms of policy commitments and outlook, key emerging markets outside Europe
include China, the US, Japan and Chinese Taipei. India is soon to join this group of emerging offshore wind markets,
with announcements of a centralised site selection policy 56.
USA
The USA commissioned its first offshore wind farm in 2016; the 30 MW, 5 turbine Block Island offshore wind farm
developed by Deep Water Wind. The USA has a well-developed onshore WTG manufacturing sector (including
suppliers such as GE) and an established offshore oil & gas industry. However, the USA lacks appropriate vessels for
providing O&M services and WTG lifting, which means European vessels are currently required.
China
China relies almost entirely on a domestic supply chain and market entry for international suppliers has also proven
to be challenging in the onshore wind market. China’s industry structure differs from other offshore wind markets,
in that the industry is not using EPCI contract packages, but procures design separately from supply and installation.
Planning and project development is jointly undertaken by developers and so called ‘design institutes’. With only
over 1 GW installed at the end of 2015, the offshore wind manufacturers evolved from onshore WTG manufacturers,
as was seen in Europe. Other aspects of the supply chain, including balance of plant scope of work, are still
immature. Experience from the offshore oil and gas sector has been utilised for installation of foundations and
electrical infrastructure.
Japan
No commercial scale project has yet been built in Japan. In the onshore wind sector there is a preference for
domestic suppliers (around one third of WTG are from domestic suppliers), which is likely to be repeated offshore,
particularly with several domestic OEMs developing bespoke turbine designs to withstand typhoon conditions. With
Vestas’s merger with MHI for offshore wind, MHI Vestas would appear well positioned, in addition to Hitachi and
Japan Steel Works, who have provided turbines for early demonstration projects.
56 Clean Tech Media. 2015. India approves offshore wind energy policy. available at: https://cleantechnica.com/2015/09/11/india-approves-offshore-wind-energy-policy/

REWIND OFFSHORE – Comparative Analysis of International Offshore Wind Energy Development, March 2017
98
4 . 5 L E S S O N S L E A R N E D
The industry has developed in recent years and may be entering a market maturation phase in key
established markets such as the UK and Germany
Project developers and supply chain have grown in experience, and there are greater levels of trust from investors
and lenders. This greater confidence in the industry, having established effective risk mitigation strategies, has led
to lower costs of funding, and attracted new risk averse funders. Additionally, the market has consolidated in key
markets over the last years leading to fewer, more mature players in today’s market.
On the technology side, increasing options, in size, design and manufacturer, are becoming available to developers
albeit with limited track record to date. The industry has transitioned from WTG suppliers having solely an onshore
wind background to joined ownership with global multi-technology firms.
The market has been comprised of two distinct models: the utility and IPP models
Utility-developers could typically rely on balance sheet, had greater risk appetite, whilst IPP-developers relied on
non-recourse finance and therefore operated under the lenders’ approach to risk which is more conservative. Utility-
developers tended to use a greater number of construction contracts, resulting in greater interface risk whereas IPP-
developers had limited number of contracts and lesser interfaces. Utility-developers typically took over O&M
contractor role after end of warranty period whilst IPP-developers commissioned OEMs for 10 to 15 years to
undertake WTG O&M.
Developer models have evolved, with growing use of project finance by utility developers, and a trend
towards development consortia
● Evolution of developer models:
– Utility-developers are now also using non-recourse finance because the cost of debt financing has reduced
and project size has increased therefore making it difficult to source funding from equity alone.
– The contracting strategies of utilities and independent power producers have become more similar, with
utilities using less contracts than they used to.
– Larger project sizes, hence higher investment volumes, has caused a recent trend towards building
consortia in order to spread the risk across parties.
– These trends are driven by greater confidence in the market by investors and lenders and improvement of
capabilities across the supply chain.
● Key success factors of developers are:
– Sound financial capabilities.
– Technical capabilities and experience of developer team.
– Robust planning with fall-back plans.
– Robust project agreements.
– Appointment of experienced contractors.

REWIND OFFSHORE – Comparative Analysis of International Offshore Wind Energy Development, March 2017
99
Predictions of capital constraints have not been borne out, due to availability of project finance and
reduced ambitions
The predictions of capital constraints for offshore wind were based balance sheet analysis of the key utilities.
However, there is now a wide availability of project finance for offshore wind, due the industries maturity and trust
in the sector. The availability of project finance (and construction equity) has made it possible for relatively small
players to successfully bring projects to financial close and to full operation on a regular basis, and there is no reason
to believe that offshore wind needs to be reserved for the larger utilities.
Emerging, non-European, markets have significant supply chain capabilities due to pre-existing
onshore wind and oil & gas industries. However, the lack of vessels for WTG lifting and O&M servicing
could present bottlenecks.
The established markets in Europe (the UK, Denmark, Germany, Belgium, and the Netherlands) have benefitted from
mature onshore wind and oil & gas industries with well-developed supply chains. While in the largest market, the
UK, there is limited indigenous WTG manufacturing capability, the country has benefitted from proximity to other
European countries. Northern Europe has become a hub for offshore industry, where individual countries’ industries
can complement each other.
The lack of vessels with the necessary capabilities could prove a bottleneck for emerging markets. Individual
countries may benefit from becoming part of regionalised industries until a critical mass of offshore wind
deployment is achieved. Vessels may also require the ability to be utilised in the offshore oil & gas sector.
Industry players need to better communicate the success story and benefits of offshore wind
Public perception of the offshore wind industry is positive due to the environmental benefits. However, lack of public
support for offshore wind is a potential barrier to future development due to the perceived lack of reliability and
high cost57. While there are some eye-catching examples of offshore wind public relations campaigns, such as the
75m rotor blade installed in the city of Hull, the UK58, more can be done to improve the industry’s public standing.
57 Hattam et al. 2015. Public Perceptions of Offshore Wind Farms. Croan Estate. available at: https://www.thecrownestate.co.uk/media/501973/ei-public-perceptions-of-offshore-wind-farms.pdf
58 See: http://www.bbc.co.uk/news/uk-england-humber-38547052
REWIND OFFSHORE – Comparative Analysis of International Offshore Wind Energy Development, March 2017
100
5 P ROJ EC T R IS K M A N A GE M E N T
As outlined in Section 3, regulatory frameworks act as enabling factor for offshore wind developments by providing
clear rules and requirements for developers on how to secure sites, a grid connection, and a permit to construct
and operate. To attract developers and investments, regulatory frameworks also have to provide risk mitigation
where developers and/or the market cannot (yet) assume or afford to assume such risks. As such, the risk profile
for developers depends not only on the regulatory framework design but also on site specific technical and
environmental risks, and the status of the wider wind offshore market and industry environment, as well as
competing markets and technologies. This section focuses on the developers’ perspective on risks and risk mitigation
strategies and outlines:
● Project lifecycle risks
● Developers’ risk mitigation tools
● Developers’ risk mitigation strategies
● Trends in developers’ risk profile and drivers
● Collaboration within the industry helps to manage developer risks on large-scale projects under
auction regimes
● More successful projects build a strong management team and have fall-back plans in place
● Strong relationships with regulators, executing authorities and third parties lead to more successful
projects
● Continued innovation is required to achieve cost reductions
● Developers do not require all risks to be mitigated but regulatory frameworks need to ensure risk-
reward balance for developers
● Allocation of grid connection risk to the grid operator by regulators requires effective performance
incentives for the grid operator
●

REWIND OFFSHORE – Comparative Analysis of International Offshore Wind Energy Development, March 2017
101
5 . 1 P R O J E C T L I F E C Y C L E R I S K S
This section sets out key project lifecycle risks, irrespective of the allocation between developers and regulators.
Figure 26 highlights the basic stages of project development and expenditure profiles.
Figure 26: Expenditure over the project lifecycle
Source: Green Giraffe
Key project phases are:
● Allocation risks – Risk of obtaining the right to develop, construct, operate and receive revenue incentive
● Price risk – Risk of not obtaining an adequate price for the project (i.e. in a competitive auction) or price
uncertainty if exposed to changes in the wholesale electricity market.
● Development risk – High risk, mainly due to cost of geotechnical and geophysical studies, only attracts funders
with high risk appetite, project is subject to risk of cancellation
● Funding risk - Relatively risky as a project prior to Financial Close or Final Investment Decision remain virtual and
can be subject to cancellation
● Construction risks - The full amounts required to build a project are committed, the project becomes “real” and
can attract different investors, projects become valued on the basis of their future cash flows, discounted at a
rate which is the rate of return expected by the investors. Given the amounts required, and the different (lower)
risk profile, new investors typically get involved at this point in time.
● Operation risks - At completion (“commercial operation date” or “COD”) a project is fully operational and starts
generating cash flow. This phase typically lasts for 20 to 25 years. With constructions done, the project is further
de-risked and can attract yet-more-risk-adverse investors, with a lower cost of capital.
Permitting Contracting / Financing Construction Operations
(EUR M/MW)
Years
2+ years 25 years
Equity
Debt/Opex
Project value
Permit obtained Start operationStart construction
1
-1
-2
-3
-4
1-2 years

REWIND OFFSHORE – Comparative Analysis of International Offshore Wind Energy Development, March 2017
102
Table 18 outlines generic project lifecycle risks of an offshore wind project during its lifecycle which are further
detailed in Section 5.3. Our categorisation of risks are based on Mott MacDonald experience, interviews and the
literature,59,60,61.
Table 18. Project lifecycle risks
Risk category Risks Potential impacts
Allocation risk Risk of securing rights to develop, construct and/or operate
an offshore wind site and to obtain revenue support
Introduces uncertainty and challenges in
retaining and growing capabilities
Development
risks
Wind resource and/or energy yield lower than expected
Environmental risks
Secure permitting
Ground risk
Grid connection
Securing tariff
Adverse change of regulatory framework
Loss of development expenditures
(potentially EUR 10s of millions) in case of
project cancellation
Funding risks Risk of not finding enough funders
Risks of delay in funders approval
Cost of funding greater than expected
Delays
Lower developer margin
Reduction / loss of tariff due to delays
Construction
risk
Weather risk
Interface risks
Availability of contractors and equipment
New technologies
Health and safety risks
Quality risks
Cost overrun
Delay of construction contractors
Delay of grid connection works
Project cancellation / suspension
Operation risk Weather and accessibility risk
Major intervention risk
Lead time risk for major spares and logistics equipment
Availability of specialist O&M personnel
Health and safety risks
Quality risks
Performance / energy yield below
expectations
Operating cost greater than budgeted
59 Altran and Arthur D Little. 2011. IEA-RETD: Risk Quantification and Risk Management in Renewable Energy Projects. IEA-RETD. available at: http://iea-retd.org/wp-content/uploads/2011/11/RISK-IEA-RETD-2011-6.pdf
60 Mott MacDonald. 2011. Accelerating the deployment of offshore renewable energy technologies. IEA-RETD. available at: http://iea-retd.org/wp-content/uploads/2011/09/ADORET-Final-Report-2011-2-Main.pdf
61 IRENA. 2016. Innovation Outlook – Offshore Wind. available at: http://www.irena.org/DocumentDownloads/Publications/IRENA_Innovation_Outlook_Offshore_Wind_2016.pdf

REWIND OFFSHORE – Comparative Analysis of International Offshore Wind Energy Development, March 2017
103
5 . 2 D E V E L O P E R R I S K M I T I G AT I O N T O O L S
Table 3 outlines the principal risk mitigation tools available to developers in order of preference and cost impact.
Where possible the aim is to wholly eliminate or avoid risk at a development and design stage. Where residual risks
cannot be fully foreseen or mitigated through design out, passing on to third parties is not viable, contingency
budgets and insurance may be required. With the sections below, key developer risks are highlighted as well as
established or preferred risk mitigation tools. Developer’s risk mitigation strategies for particular risk categories are
outlined under Section 5.3.
Table 19. Risk mitigation tools
Risk mitigation tool Objective Example Cost impact on
developers
Design out Eliminate risks by development of safe
designs or avoidance of risk through
technology selection.
E.g. Revision of design standards for
foundations to mitigate grouted
connection failure in monopiles.
Low
High
Pass on to third parties Pass risks on to parties that in control
of and have the capabilities of
managing the risk
E.g. Pass on P50 weather risk to
construction contractors
Contingency Allow for a contingency budget for
risks that cannot be mitigated with
above strategies
E.g. Include construction contingency for
known and unknown unknown such as
residual interface risk
E.g Include float for delays in schedule of
works between the works of different
construction contracts
Insurance Take out insurance for risks that
cannot be mitigated with above
strategies
E.g. Insurance for public liability or
unforeseen loss,

REWIND OFFSHORE – Comparative Analysis of International Offshore Wind Energy Development, March 2017
104
5 . 3 D E V E L O P E R R I S K M I T I G AT I O N S T R AT E G I E S
This section sets out developers’ risk mitigation strategies for each of the key project risk categories based on
industry experience to date as well as feedback from stakeholder interviews. Throughout the section, we present a
series of risk tables which categorise risks through the project lifecycle by their risk level. We also present risk
mitigation options for both developers and regulators. These tables can be used as a reference for industry
stakeholders. The risks are colour coded as follows:
● Red (high): material impact on the Developer’s project business case, potential risk of project cancellation or
loss.
● Amber (medium): moderate to high impact on the Developer’s project business case, however low risk of project
cancellation or loss.
● Green (low): low to moderate impact on the Developer’s business case.
5.3.1 Allocation and development risks
The developer’s risk profile can vary greatly depending on the regulatory framework design. As such, we have
reviewed the impact on developers’ risks and risk mitigation strategies of two contrasting regulatory framework as
set out under Table 20, as well as the required or desired regulatory risk mitigation. Scenario A largely reflects the
traditional model that was applied in European offshore wind markets prior to the introduction of auctions and
Scenario B reflects a central model auction, whereas site selection and development are undertaken by the
regulator.
Table 20. A comparison of the developers’ risk profile
Scenario Site selection
Site investigation
Consenting/ permitting
Grid design & construction
Revenue incentive
Developer risk
Developer control
A – Traditional model Developer Developer Developer Developer Tariff for eligible
technologies
High Low
B – Central Auction model
Regulator Regulator Regulator Grid operator Tariff via auction Low High
Prior to the introduction of competitive auctions to secure development rights and/or revenue support in Europe,
regulators typically determined requirements to obtain a construction permit and grid connection and provided
such requirements were fulfilled, eligible technologies would receive defined revenue incentives. This approach
provided developers with relative certainty over the level of revenue support and timescale requirements to secure
the revenue support, however left the development risk entirely with the developer.
Under competitive auction regimes, developers no longer have security if and in which auction they may be
successful, hence leaving a great level of uncertainty over the size, geography and nature of their project pipeline
that will proceed to construction.
Table 21 outlines the developers’ risk profile under regulatory framework scenario A (traditional model) and risk
mitigation that can be applied by developers and regulators.

REWIND OFFSHORE – Comparative Analysis of International Offshore Wind Energy Development, March 2017
105
Table 21. Risk mitigation strategies for development risks under Scenario A
Developer risk Developers’ mitigants Risk level
post
developer
mitigation
Regulator’s mitigants Risk level post
regulator
mitigation
Risk of project cancellation
during development phase and
loss of substantial development
cost (potentially EUR 10s of
millions) due to
1. Technical or
environmental fatal flaws
2. Adverse regulatory
changes during long
timescales from project
initiation to COD
3. Adverse market changes /
cost increase
● Creating consortia to share
development risks
● Apply good industry
practice to site selection,
site investigations
● Maintain a diverse pipeline
to compensate losses with
successful projects
High ● Zoning/pre-selection of
eligible areas for offshore
wind development by
regulator to rule out key
risks for the feasibility of a
project
● Tariff level support that
accounts for development
cost and risk
● Clear permitting regime
and grid connection
regime
Medium
Risk of (planned) tariff
depreciation (based on COD
date) or phase-out of tariff
● Apply good industry
practice to site
development and
construction to mitigate
delays and tariff
depreciation
● Float in schedule
● Reduction in project
capacity to complete the
project in time to secure
tariff
Medium ● Provide long-term
visibility over regulatory
frameworks
● Avoid frequent and/or
retroactive changes to
regulatory frameworks
● Allow for transition period
when frameworks are
changed
Low
Table 22 outlines the developers’ risk under regulatory framework scenario B (central auction model) and risk
mitigation that can be applied by developers and regulators.
Table 22. Risk mitigation strategies for development risks under Scenario B
Developer risk /
impact
Developers’ mitigants Risk level post
developer
mitigation
Regulator’s mitigants Risk level post
regulator
mitigation
Lack of financial
capabilities to
participate in
auctions
● Seek partners Low n/a n/a

REWIND OFFSHORE – Comparative Analysis of International Offshore Wind Energy Development, March 2017
106
Developer risk /
impact
Developers’ mitigants Risk level post
developer
mitigation
Regulator’s mitigants Risk level post
regulator
mitigation
Bid loss (cost of
bidding)
● Create consortia with
required technical and
financial capabilities to
increase chances of
winning, spread risks and
enable participation in
greater number of auctions
● Market consolidation
High ● Provide clear information on
project risks and findings of site
investigations to minimise
uncertainties for bidders
● Define realistic tender
requirements
● Provide clear tender evaluation
criteria to encourage
participation of bidders
reasonable chance of
succeeding
High
Obsolete
development
capabilities
● Transfer to deploy in
markets where project
development is developer
responsibility
● Separate development and
construction business,
offer developer capabilities
to regulators
Known impact ● n/a n/a
Lack of control/
uncertainty over
long-term project
pipeline and resulting
utilisation and
retention of staff
● Bidding in consortia
● Research markets and
requirements and build
relationships to optimise
positioning in a market
High ● n/a n/a
Increasing cost
reduction pressure
under competitive
auctions / lower tariff
levels
● Bring contractors into
consortium / risk/reward
sharing with contractors
● Innovative technologies to
reduce cost
● Use of larger WTGs
● Bidding for cluster sites to
achieve economies of
scales
High ● Support R&D
● Support evolution of design
codes to mitigate overly
conservative designs and
enable cost reductions
● Encourage sharing of industry
knowledge and lessons learnt
● Consideration of developers’
risk levels, project scale and
status of market to determine
reasonable tariff levels / strike
price
● Enact a robust penalty regime
under auctions to mitigate
unrealistic tariff levels from
bidders and cancellation post
bid award
Medium
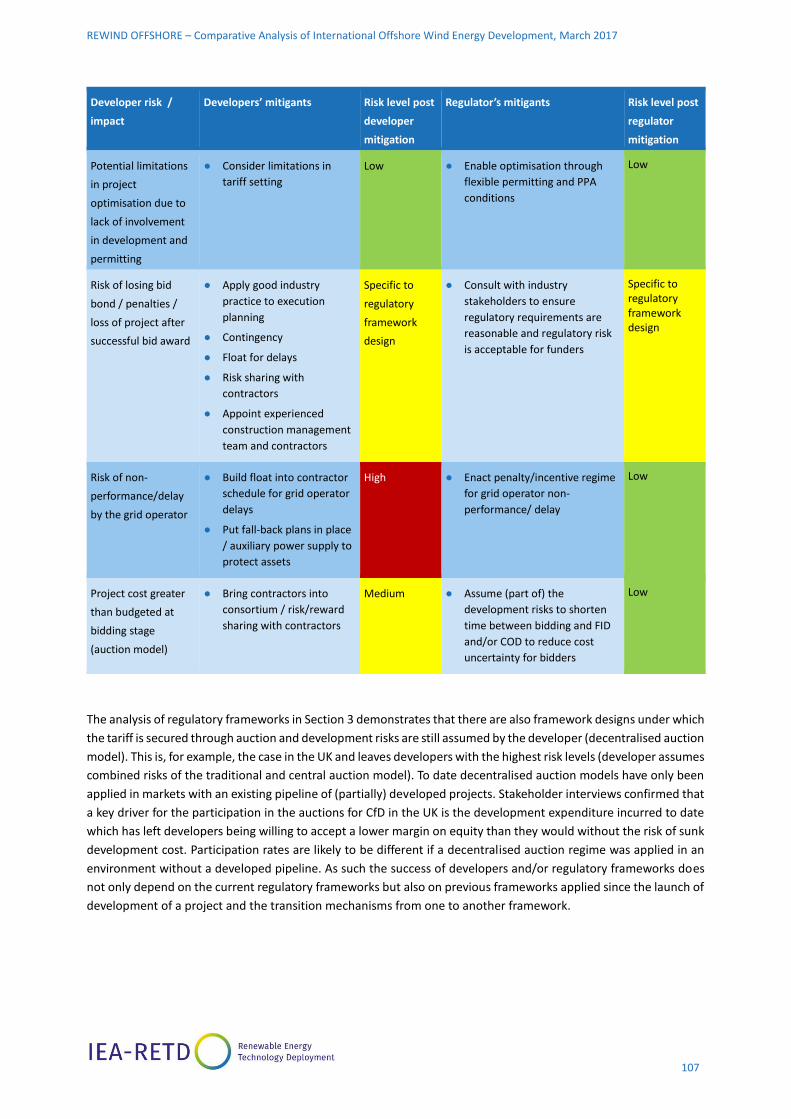
REWIND OFFSHORE – Comparative Analysis of International Offshore Wind Energy Development, March 2017
107
Developer risk /
impact
Developers’ mitigants Risk level post
developer
mitigation
Regulator’s mitigants Risk level post
regulator
mitigation
Potential limitations
in project
optimisation due to
lack of involvement
in development and
permitting
● Consider limitations in
tariff setting
Low ● Enable optimisation through
flexible permitting and PPA
conditions
Low
Risk of losing bid
bond / penalties /
loss of project after
successful bid award
● Apply good industry
practice to execution
planning
● Contingency
● Float for delays
● Risk sharing with
contractors
● Appoint experienced
construction management
team and contractors
Specific to
regulatory
framework
design
● Consult with industry
stakeholders to ensure
regulatory requirements are
reasonable and regulatory risk
is acceptable for funders
Specific to regulatory framework design
Risk of non-
performance/delay
by the grid operator
● Build float into contractor
schedule for grid operator
delays
● Put fall-back plans in place
/ auxiliary power supply to
protect assets
High ● Enact penalty/incentive regime
for grid operator non-
performance/ delay
Low
Project cost greater
than budgeted at
bidding stage
(auction model)
● Bring contractors into
consortium / risk/reward
sharing with contractors
Medium ● Assume (part of) the
development risks to shorten
time between bidding and FID
and/or COD to reduce cost
uncertainty for bidders
Low
The analysis of regulatory frameworks in Section 3 demonstrates that there are also framework designs under which
the tariff is secured through auction and development risks are still assumed by the developer (decentralised auction
model). This is, for example, the case in the UK and leaves developers with the highest risk levels (developer assumes
combined risks of the traditional and central auction model). To date decentralised auction models have only been
applied in markets with an existing pipeline of (partially) developed projects. Stakeholder interviews confirmed that
a key driver for the participation in the auctions for CfD in the UK is the development expenditure incurred to date
which has left developers being willing to accept a lower margin on equity than they would without the risk of sunk
development cost. Participation rates are likely to be different if a decentralised auction regime was applied in an
environment without a developed pipeline. As such the success of developers and/or regulatory frameworks does
not only depend on the current regulatory frameworks but also on previous frameworks applied since the launch of
development of a project and the transition mechanisms from one to another framework.

REWIND OFFSHORE – Comparative Analysis of International Offshore Wind Energy Development, March 2017
108
5.3.2 Funding risks
Funding risk is largely driven by the market environment. Stakeholder interviews confirmed growing trust in the
industry and access to capital is not a bottleneck in the current market environment contrary to industry projections
a few years ago. However, to secure funders trust, developers are required to demonstrate robust project planning
and risk mitigation. Table 23 sets out risk mitigation strategies for funding risks.
Table 23. Risk mitigation strategies for funding risks
Possible developer
risks
Developers’ mitigants Risk level post
developer
mitigation
Regulator’s mitigants Risk level post
regulator
mitigation
Inability to attract
sufficient finance for
relevant project
● Obtain comprehensive financial,
technical, legal and insurance
advice to ensure project is
developed to standards of target
investors
● Allow sufficient time for due
diligence process and FID by
investors considering growing
project size, hence investment
volume and number of funders
required.
Low ● Provide low interest
funding from
development banks
where there are gaps in
market funding and/or
to promote innovative
technologies.
● Provide lender-friendly
tariff support (higher
support for period of
loan)
Low
Risk of delay in
funders’ approval and
resulting project delays
● Consider experience of the
targeted funders in the sector
and allow appropriate timescales
depending on the experience and
number of funders required
● Seek to confirm particular
requirements of each funder
early in the process
Medium ● n/a
5.3.3 Construction risks
The construction phase is the part of the project lifecycle where expenditures and impact of risks, if not adequately
mitigated, is greatest. .

REWIND OFFSHORE – Comparative Analysis of International Offshore Wind Energy Development, March 2017
109
Table 24 outlines the key construction risks and risk mitigation strategies. The main risk mitigation tool developers
apply is to pass on risks to construction contractors. As passing on risks to contractors comes at a cost, developers
will have to find a risk-reward balance of risks passed on to contractors and risks retained by the project. An example
is the allocation of weather risks under construction (and operation contracts) as outlined in Box 32: Trends in
weather risk allocation and risk mitigation strategies.

REWIND OFFSHORE – Comparative Analysis of International Offshore Wind Energy Development, March 2017
110
Table 24. Risk mitigation strategies for construction risks
Risk Developers’ mitigants Post
mitigation
risk level
Regulator’s mitigants Post
mitigation
risk level
Planning Risks
Capability of project
team crucial to project
success
● Maintain a good industry network
and strong retention policy
● Do not proceed through decision
gates without an appropriate team
Medium ● As above Medium
Capability of
contractors crucial to
project success
● Maintain a good industry network
● Currently a reasonably competitive
market in most areas with some
new entrants e.g. Asian companies
moving into foundation
manufacture
● Due diligence into experience and
performance of staff within
contractor team and right to
replace staff reserved in Contract
Medium ● Establish stable regulatory
regimes worldwide to support
the sector, allowing greater
industry investment in
training, re-skilling and
research
● Provide support for businesses
with transferrable skills to
move into the offshore wind
industry, including Tier 2 and 3
suppliers, increasing
competition throughout the
supply chain
Medium
Construction cost
overrun, including
materials and services
● Construction contingency to deal
with cost overrun
● Robust construction contracts
● Experienced contractors and
project management team
● Float in construction schedule
Low/
Medium
● Clear and reasonable
construction milestone
requirements drafted in
consultation with industry
Low/
Medium
Foundation design
requirements greater
than estimated in
tender phase leading
to material costs or
delays
● Best practise is to complete and
certify foundation design prior to
final investment decision/financial
close
● Support research and development
into new foundation design
techniques
Low ● Support research and
development into new
foundation design techniques,
aimed at producing
standardised foundation
designs for a range of turbine
types and soil conditions
Low
Poorly defined
interfaces lead to cost
overruns - scope
● Robust contract development with
strong communication between
different Package Manager
● Sign an Interface Matrix into all
contracts, clearly specifying which
contractor will perform which role
in what area
● Independent contract review
Low/
Medium
N/A N/A
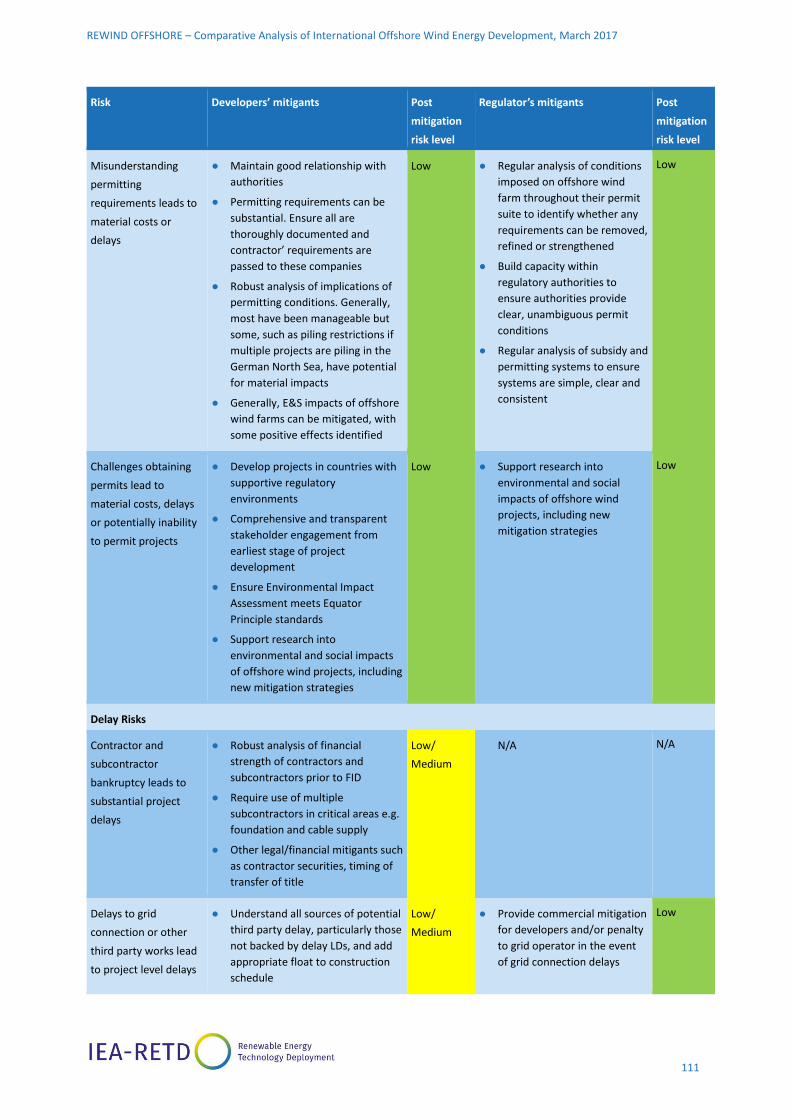
REWIND OFFSHORE – Comparative Analysis of International Offshore Wind Energy Development, March 2017
111
Risk Developers’ mitigants Post
mitigation
risk level
Regulator’s mitigants Post
mitigation
risk level
Misunderstanding
permitting
requirements leads to
material costs or
delays
● Maintain good relationship with
authorities
● Permitting requirements can be
substantial. Ensure all are
thoroughly documented and
contractor’ requirements are
passed to these companies
● Robust analysis of implications of
permitting conditions. Generally,
most have been manageable but
some, such as piling restrictions if
multiple projects are piling in the
German North Sea, have potential
for material impacts
● Generally, E&S impacts of offshore
wind farms can be mitigated, with
some positive effects identified
Low ● Regular analysis of conditions
imposed on offshore wind
farm throughout their permit
suite to identify whether any
requirements can be removed,
refined or strengthened
● Build capacity within
regulatory authorities to
ensure authorities provide
clear, unambiguous permit
conditions
● Regular analysis of subsidy and
permitting systems to ensure
systems are simple, clear and
consistent
Low
Challenges obtaining
permits lead to
material costs, delays
or potentially inability
to permit projects
● Develop projects in countries with
supportive regulatory
environments
● Comprehensive and transparent
stakeholder engagement from
earliest stage of project
development
● Ensure Environmental Impact
Assessment meets Equator
Principle standards
● Support research into
environmental and social impacts
of offshore wind projects, including
new mitigation strategies
Low ● Support research into
environmental and social
impacts of offshore wind
projects, including new
mitigation strategies
Low
Delay Risks
Contractor and
subcontractor
bankruptcy leads to
substantial project
delays
● Robust analysis of financial
strength of contractors and
subcontractors prior to FID
● Require use of multiple
subcontractors in critical areas e.g.
foundation and cable supply
● Other legal/financial mitigants such
as contractor securities, timing of
transfer of title
Low/
Medium
N/A N/A
Delays to grid
connection or other
third party works lead
to project level delays
● Understand all sources of potential
third party delay, particularly those
not backed by delay LDs, and add
appropriate float to construction
schedule
Low/
Medium
● Provide commercial mitigation
for developers and/or penalty
to grid operator in the event
of grid connection delays
Low

REWIND OFFSHORE – Comparative Analysis of International Offshore Wind Energy Development, March 2017
112
Risk Developers’ mitigants Post
mitigation
risk level
Regulator’s mitigants Post
mitigation
risk level
Delay risks (general)
due to multi-contract
strategy, contractor,
third party or weather
delay
● Robust contract development with
strong communication between
different Package Managers
● Ensure project schedule and
contract schedules are aligned
● Provide reasonable float between
contractual packages
● Ensure allocation of weather risk is
clearly specified in contracts and
accurately captured in the project
schedule
● Procure weather measurement
equipment at site to confirm
weather downtime is attributed
according to contractual
arrangements
● Design schedule and contracts so
winter period can be used to catch
up delays if necessary
Medium ● Provide some flexibility in
subsidy mechanisms so that
developers are not penalised
in the event of unseasonably
poor weather
● Support research and
development into new
installation techniques which
are less weather sensitive
N/A
Manufacturing delays
lead to material
impacts at project level
● Design a robust project schedule
which can absorb a reasonable
level of manufacturing delay
● Robust due diligence of ability of
suppliers to deliver, considering
other industry commitments
● Careful monitoring of progress at
owner level to identify issues early
so risks can be mitigated effectively
Low/
Medium
● Provide support for businesses
with transferrable skills to
move into the offshore wind
industry, including Tier 2 and 3
suppliers, increasing
competition and capacity
throughout the supply chain
● Support research and
development into new
manufacturing techniques
including standardisation to
reduce delay risk
Low/
Medium
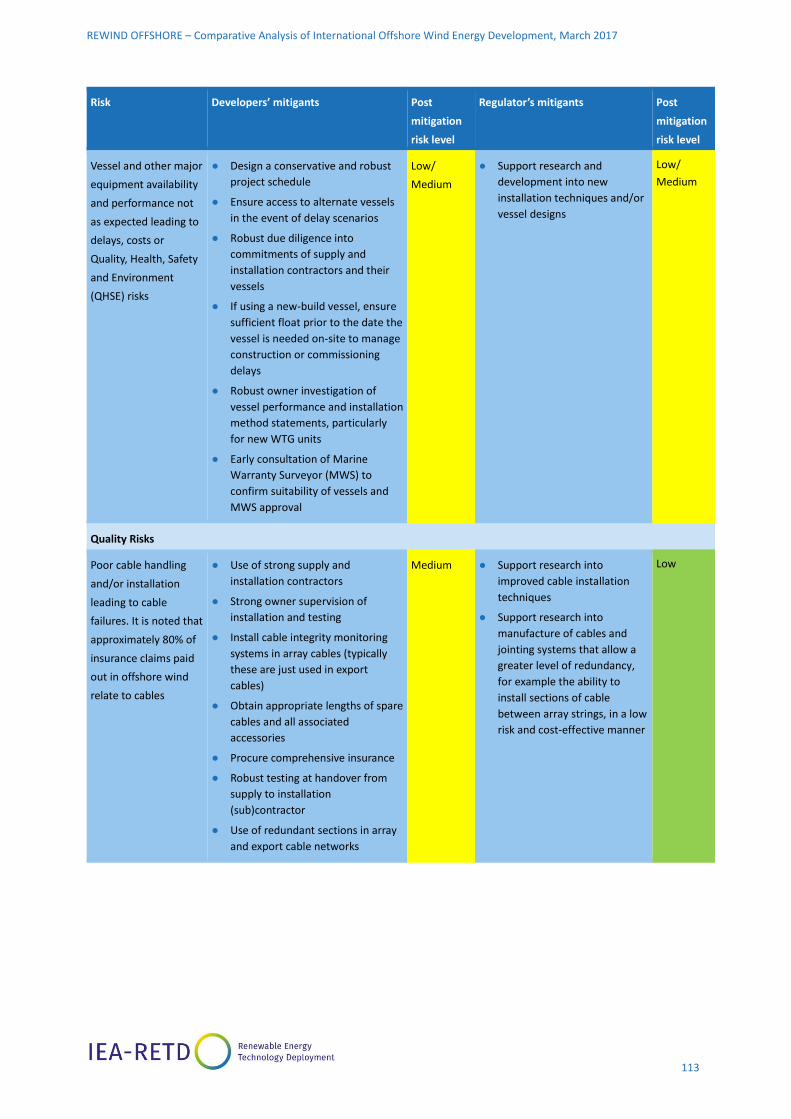
REWIND OFFSHORE – Comparative Analysis of International Offshore Wind Energy Development, March 2017
113
Risk Developers’ mitigants Post
mitigation
risk level
Regulator’s mitigants Post
mitigation
risk level
Vessel and other major
equipment availability
and performance not
as expected leading to
delays, costs or
Quality, Health, Safety
and Environment
(QHSE) risks
● Design a conservative and robust
project schedule
● Ensure access to alternate vessels
in the event of delay scenarios
● Robust due diligence into
commitments of supply and
installation contractors and their
vessels
● If using a new-build vessel, ensure
sufficient float prior to the date the
vessel is needed on-site to manage
construction or commissioning
delays
● Robust owner investigation of
vessel performance and installation
method statements, particularly
for new WTG units
● Early consultation of Marine
Warranty Surveyor (MWS) to
confirm suitability of vessels and
MWS approval
Low/
Medium
● Support research and
development into new
installation techniques and/or
vessel designs
Low/
Medium
Quality Risks
Poor cable handling
and/or installation
leading to cable
failures. It is noted that
approximately 80% of
insurance claims paid
out in offshore wind
relate to cables
● Use of strong supply and
installation contractors
● Strong owner supervision of
installation and testing
● Install cable integrity monitoring
systems in array cables (typically
these are just used in export
cables)
● Obtain appropriate lengths of spare
cables and all associated
accessories
● Procure comprehensive insurance
● Robust testing at handover from
supply to installation
(sub)contractor
● Use of redundant sections in array
and export cable networks
Medium ● Support research into
improved cable installation
techniques
● Support research into
manufacture of cables and
jointing systems that allow a
greater level of redundancy,
for example the ability to
install sections of cable
between array strings, in a low
risk and cost-effective manner
Low
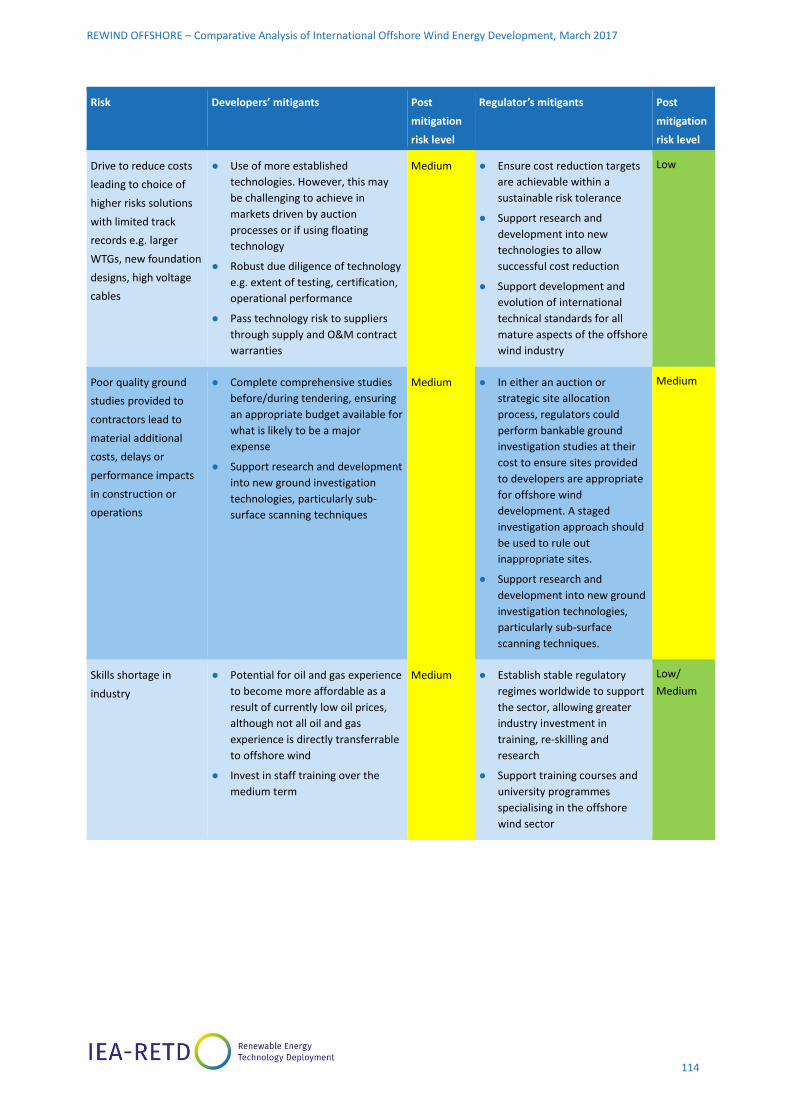
REWIND OFFSHORE – Comparative Analysis of International Offshore Wind Energy Development, March 2017
114
Risk Developers’ mitigants Post
mitigation
risk level
Regulator’s mitigants Post
mitigation
risk level
Drive to reduce costs
leading to choice of
higher risks solutions
with limited track
records e.g. larger
WTGs, new foundation
designs, high voltage
cables
● Use of more established
technologies. However, this may
be challenging to achieve in
markets driven by auction
processes or if using floating
technology
● Robust due diligence of technology
e.g. extent of testing, certification,
operational performance
● Pass technology risk to suppliers
through supply and O&M contract
warranties
Medium ● Ensure cost reduction targets
are achievable within a
sustainable risk tolerance
● Support research and
development into new
technologies to allow
successful cost reduction
● Support development and
evolution of international
technical standards for all
mature aspects of the offshore
wind industry
Low
Poor quality ground
studies provided to
contractors lead to
material additional
costs, delays or
performance impacts
in construction or
operations
● Complete comprehensive studies
before/during tendering, ensuring
an appropriate budget available for
what is likely to be a major
expense
● Support research and development
into new ground investigation
technologies, particularly sub-
surface scanning techniques
Medium ● In either an auction or
strategic site allocation
process, regulators could
perform bankable ground
investigation studies at their
cost to ensure sites provided
to developers are appropriate
for offshore wind
development. A staged
investigation approach should
be used to rule out
inappropriate sites.
● Support research and
development into new ground
investigation technologies,
particularly sub-surface
scanning techniques.
Medium
Skills shortage in
industry
● Potential for oil and gas experience
to become more affordable as a
result of currently low oil prices,
although not all oil and gas
experience is directly transferrable
to offshore wind
● Invest in staff training over the
medium term
Medium ● Establish stable regulatory
regimes worldwide to support
the sector, allowing greater
industry investment in
training, re-skilling and
research
● Support training courses and
university programmes
specialising in the offshore
wind sector
Low/
Medium

REWIND OFFSHORE – Comparative Analysis of International Offshore Wind Energy Development, March 2017
115
Risk Developers’ mitigants Post
mitigation
risk level
Regulator’s mitigants Post
mitigation
risk level
Poor quality control
leads to suboptimal
project being delivered
● Use of strong contractors
● Appreciate that regardless of
contractor strength, experience of
industry is that owner
management is crucial
● Owner Quality Assurance (QA) Plan
should envisage inspection of all
facilities and owner presence
potentially including use of full-
time supervision in challenging
sites. An appropriate budget
should be provided for a
substantial staffing level
Low/
Medium
● N/A N/A
5.3.4 Operational risks
Operation risks are influenced by the industry and the market environment in general and largely controlled by the
developer through risk allocation under operation and maintenance contractors. Regulators have no explicit impact
or influence on operation risks but can act as enabler to support continued development of the industry. Table 25
outlines the key operation risks and risk mitigation strategies that can be applied by developers and regulators. An
example of industry learning and evolution of risk mitigation strategies is provided in Box 33: Evolution of risk
mitigation strategies of non-accessibility for maintenance.
Box 32: Trends in weather risk allocation and risk mitigation strategies
Initially, as a result of the lack of experience within the offshore wind supply chain, contractors were reluctant
to take weather risk or offered to assume the risk at a material premium. Developers assumed very different
strategies. Utilities tended to assume all weather risk and dealt with it by allowing float in the construction
schedule and paying contractors for additional cost due to weather downtime. IPPs on the other hand were
facing lenders with no experience in the sector who were unwilling to assume weather risk. As such, some IPPs
passed on all weather risk to the contractors at a material premium.
Over the years and with maturing industry, weather and safe working limits of the different works are better
understood and site weather risk can be determined based on long-term historic data. As such, there has been
a trend among utility and IPP developers towards sharing the weather risk with the contractor and introducing
incentives for the contractor to optimise its planning to minimise weather downtime risk. This approach has
resulted in lower contractor margins.

REWIND OFFSHORE – Comparative Analysis of International Offshore Wind Energy Development, March 2017
116
Table 25. Risk mitigation strategies for operation risks
Risk / challenge Developers’ mitigants Post
mitigation
risk level
Regulator’s mitigants Post
mitigation
risk level
Identification of
experienced contractors
and deployment of
experienced contractor
teams
● Currently strong reliance
on OEMs and utility
developers performing
O&M
● Third party O&M provider
entering the market
● Maintain a strong industry
network
● Definition of minimum
training/seniority
requirements for key staff
under O&M contracts
Medium ● Establish stable regulatory regimes
worldwide to support the sector,
allowing greater industry
investment in training, re-skilling,
and research
● Provide support for businesses
with transferrable skills to move
into the offshore wind industry,
including Tier 2 and 3 suppliers,
increasing competition throughout
the supply chain
Medium
Drive to reduce costs
leading to choice of
higher risks solutions
with limited track records
e.g. larger WTGs, new
foundation designs, high
voltage cables
● Use of experienced O&M
Contractors
● Robust due diligence of
technology e.g. extent of
testing, certification,
operational performance
● Pass technology risk to
suppliers through supply
and O&M contract
warranties
Medium ● Support research and
development into new
technologies to allow successful
cost reduction
● Support development and
evolution of international technical
standards for all mature aspects of
the offshore wind industry
Low
Poor O&M Contract
wording leads to cost
over-runs or undermines
strength of Availability
Warranty
● Ensure any weather risk
sharing clearly
documented in Contract
● Careful analysis of
Availability Warranty
provisions, ensuring these
are accurately reflected in
the financial model
● Independent contract
review
Low ● N/A N/A
Insufficiently robust
contractor management
leads to cost over-runs,
undermines strength of
Availability Warranty or
leads to QHSE issues
● Robust Contractor
supervision including
Owner site
representatives,
comprehensive analysis of
SCADA availability data
and ongoing performance
analysis
Low ● N/A N/A

REWIND OFFSHORE – Comparative Analysis of International Offshore Wind Energy Development, March 2017
117
Risk / challenge Developers’ mitigants Post
mitigation
risk level
Regulator’s mitigants Post
mitigation
risk level
Poor quality energy yield
assessment leads to
lower than expected
performance
● Robust measurement
campaign
● Use of robust energy yield
methodology using the
latest techniques
● Obtain independent view
on potential production
● Support industry in
developing new tools
Low/
Medium
● In either an auction or strategic
site allocation process, regulators
to perform bankable wind
measurement campaigns and/or
energy yield studies to ensure
developers have sufficient
information to value their projects
appropriately.
● Provide funding to install
meteorological masts capable of
generating bankable wind data,
which can be used for sites a
relatively large distance from the
masts.
● Support industry in developing
R&D and commercialisation of
new tools such as floating LiDAR.
Low/
Medium
Poor understanding of
site accessibility leads to
performance below
expectations
● Develop comprehensive
operational accessibility
study pre-FID to quantify
risk in this area
● Consider the use of
mitigating technologies
such as helicopters, hotel
vessels and new access
concepts
Low ● Support research into improved
access concepts
Low
Slow response in major
interventions
● Negotiate strongest
availability warranty
possible with O&M
Contractor
● Possibility to take over
O&M as developer,
however assure transition
period, training by and
support from OEM until
robust capabilities have
been built
Medium ● Support research into improved
major intervention techniques
including vessels.
● Support training courses and
university programmes specialising
in the offshore wind sector.
● Provide support for businesses
with transferrable skills to move
into the offshore wind industry,
including Tier 2 and 3 suppliers,
increasing competition throughout
the supply chain
Low
Poor end of warranty
inspections means issues
that should have been
addressed by supply
contractors are not
addressed
● Develop a comprehensive
end of warranty inspection
program and deliver well
in advance of warranty
expiry.
Low ● Support research into improved
inspection techniques such as use
of drones and robots.
Low

REWIND OFFSHORE – Comparative Analysis of International Offshore Wind Energy Development, March 2017
118
Risk / challenge Developers’ mitigants Post
mitigation
risk level
Regulator’s mitigants Post
mitigation
risk level
Health and safety risk ● Ensure all staff have
appropriate training.
● Instil commitment to HSSE
throughout supply chain –
incentives for near miss
and hazardous
observation reporting.
● Strong owner analysis of
method statements and
risk assessments, plus
strong owner presence
particularly in high risk
areas
Medium ● Build capacity within regulatory
authorities, increasing support to
developers and contractors in
delivering robust HSSE
management
Medium
Risk of offtaker or grid
operator not accepting
energy
● Clarify grid code and
testing requirements and
pass on to construction
and operation contractors.
● Budget for residual grid
downtime and/or
curtailment risk.
Low ● Grant priority of dispatch to
offshore wind farm operators
Low
Box 33: Evolution of risk mitigation strategies of non-accessibility for maintenance
A key differentiator of offshore wind projects compared to onshore wind projects is the risk of non-accessibility,
which can materially increase the downtime and cost impact of a technical fault. This risk is typically accounted
for within the developers’ business case and underlying availability assumptions based on long-term weather
data. For the first wind farms that entered into operation WTGs were typically accessed using crew transfer
vessels (CTVs) with an operating limit of 1.5m significant wave height. Crews would return to the onshore
harbour at the end of the working day and, as such, effective working hours are reduced by the time required
to travel to and from the site.
With the industry moving towards larger sites further offshore, accessibility strategies have evolved to reduce
the risk of non-accessibility. This includes the use of onsite hotel vessels on which technicians are able to stay
onsite overnight, eliminating travel time and increasing effective working hours. The use of hotel vessels may
be combined with hydraulic access systems, such as Ampelmann, that can work in more adverse weather
conditions than CTVs. Whilst these strategies reduce the risk of non-accessibility, they come at a cost and are
generally only viable for larger scale projects further offshore.

REWIND OFFSHORE – Comparative Analysis of International Offshore Wind Energy Development, March 2017
119
5 . 4 T R E N D S I N D E V E L O P E R R I S K P R O F I L E S A N D D R I V E R S
Table 26 outlines the trends in how developer risk profiles are evolving and the key drivers. It shows that the
introduction of auctions in the European offshore wind market has materially changed the risk profile and scope of
developers.
Table 26. General trends in developers’ risk levels
Project risk
category
Trends in
developer
risk level
Drivers
Allocation risk
● Introduction of auctions and cap on market growth
● Trend towards “central model” with site selection by regulator and cap on
market growth rate
● High levels of competition under auctions to date
● Uncertainty over timing and size of auction rounds
● Need for differentiated support for innovative technologies
Price Risk ● Competitive auctions create strike price uncertainty.
● Wholesale price uncertainty.
● Commodity price volatility.
Development
risk
● Trend of regulators assuming part or majority of the development scope to
derisk project for developers, increase chance of project realisation and to meet
policy targets.
● Increasing project size and scale of overall industry requires coordinated
approach to grid connection.
Funding risk
● Inreasing trust by funders
● Attraction of new funders to the market
● Increase in project size requires greater number of funders per project
Construction
risk
● Learning of the industry
● Greater trust in contractor capabilities
● Greater availability and compeitition of contractors
● Continued evolution of technologies and use of technologies with limited track
record
● Sites conditions become more challenging (deeper waters, further offshore,
larger capacity and larger equipment)
● Increasing cost reduction pressure due to lower tariff levels
Operation risk
● Learning of the industry
● Greater trust in contractor capabilities
● Greater availability and compeitition of contractors
● Limited track record of aging assets
● Sites conditions become more challenging (deeper waters, further offshore)
● Increasing cost reduction pressure due to lower tariff levels
Decreasing No clear trend/mixed drivers Increasing

REWIND OFFSHORE – Comparative Analysis of International Offshore Wind Energy Development, March 2017
120
With the introduction of auctions to allocate rights to develop, construct and operate offshore wind farms,
developers’ risk of securing such rights has increased and with it introduced uncertainty for developers over the
location, size and nature of their project pipeline. In order to increase the chances of winning a bid, spread the risks
and enable participation in a greater number of bids, there is a trend of bidding in consortia, including the big utility
players.
Auctions introduced a cap on market growth which has led to a consolidation in greater levels of collaboration in
the market. For example, utility developers such as Centrica and Statkraft announced their exit from the offshore
wind market. Stakeholder interviews indicate that the consolidation provides greater comfort in the market for the
remaining players. However, the participation rates in the European 2016 auctions suggest that the allocation risk
for developers remains high.
Once a bid is won, the development and grid connection risk assumed by the developer tends to be lower than
under traditional pre-auction regimes as the regulator assumes part or the majority of these risks through
development prior to tender award to developers. This shift in risk allocation is driven largely by the regulators as
country markets tend to be comprised of a small number of projects with a large scale. As such, the impact of failure
of a single project on policy targets is relatively high. With regulators assuming parts of development and grid
connection risks they are reducing the risk of a project cancellation after bid award.
Stakeholder interviews confirmed that there are developers in the market with the capability and willingness to
assume greater development and grid connection responsibilities provided rewards reflect such greater developer
risk.
Several interviewees pointed to developments in the relationships between developers and the supply chain, stating
that there has been increased collaboration in recent years. One developer observed benefits to working with both
WTG suppliers and electrical infrastructure suppliers to optimise the design of a project to reduce the cost of the
whole project, rather than just their contracts. Collaboration through the supply chain is also seen as having
potential for further cost reduction.
Interviewees also expressed concern that, while the new auction regime increases competition and appears to drive
down costs, there is a potential to put too much pressure on the supply chain, which may not be sustainable. This
is an observation that is also shared by WindEurope. Developer strategies to achieve the required cost reductions
are yet to be confirmed, however, it is expected that the use of larger WTGs will play a key part in driving down cost.
As outlined throughout our analysis, auction regimes with decentralised site selection have only been applied in
markets with an existing pipeline of developed projects. Under centralised auction regimes, the regulator pre-selects
sites and undertakes at least partial development of sites which reduces developer scope and risk and subsequently
tariff levels. When considering a centralised auction model, regulators should assess whether they have the
capabilities to deliver such a role in a cost effective and timely manner.

REWIND OFFSHORE – Comparative Analysis of International Offshore Wind Energy Development, March 2017
121
5 . 5 L E S S O N S L E A R N E D
Allocation and price risks are increasing due to recent regulatory changes
While the recent falls in prices can be attributed, at least in part, to the move to competitive tenders and
centralisation of project development, regulatory risks have increased for developers. Developers now have to
compete on price against each other to secure power purchase agreements, raising the risk of lower prices and of
the project not going ahead.
Technical risks, including construction and operation, are decreasing
Experience with increasing cumulative capacity, together with a strengthened industry structure, is reducing
perceived technical risks, both in construction and operational phases. However, more challenging site conditions,
larger equipment requirements and larger projects, combined with increasing cost pressures, present future
challenges.
Regulatory risk is a major contributor to the overall risk for an offshore wind project
While offshore wind projects are technically challenging, over the recent year the supply chain has matured, and
project developers have grown in experience to the extent that the technical risks are known and can be effectively
mitigated. Risks relating to possible regulatory changes, poor medium term visibility of tenders and uncertainty
around long term strategies present the greatest risks to developers and the supply chain.
Developers don’t require all risks to be mitigated, but regulatory frameworks need to ensure a
suitable risk-reward balance for developers
Developers are willing to assume risks they can control such as development risks or the construction of the grid
connection, provided rewards are reasonable. Policy makers should consider the costs and benefits the impacts of
assuming the development risks.
Allocation of risks to third parties requires effective third party performance incentives
Well-meaning regulators have passed on grid connection risk to grid operators with the aim to reduce developer
risk and attract developers to the market. Experience has shown that in order for such strategy to be successful the
following needs to be fulfilled:
Grid operator to have the capabilities to assume the risks.
Grid operator is subject to effective performance incentives / penalty regimes that provide developers with
confidence that poor performance of the grid operator is mitigated.

REWIND OFFSHORE – Comparative Analysis of International Offshore Wind Energy Development, March 2017
122
6 SY N T H ES I S , CO N C LU S I O N S , A N D R ECO M M E NDAT IO NS
6 . 1 S T AT E O F T H E I N D U S T R Y
Offshore wind is a rapidly maturing energy technology which can offer multiple benefits to policy makers wanting
to decarbonise the electricity system at low cost and with significant local economic benefits. Following several years
of technology proving and steadily increasing deployment, the industry is entering a period of maturation and
exponential growth, with global installed capacity set to increase by >150% from 14.4 GW at the end of 2016 to 36.2
GW by 2020. Having been pioneered by a handful of leading European countries, offshore wind is also expanding to
a number of emerging markets in Asia and North America.
Figure 27. Annual and cumulative offshore wind installed capacity
Sources: 4Coffshore, 2017; WindEurope, 2017; Carbon Trust analysis62
The growing maturity of the sector is particularly evident in the steep cost reduction achieved in recent years, which
has far exceeded industry projections and targets. In particular, the introduction of competitive auctions has seen
an acceleration in the pace of cost reduction in several front-runner markets. Recent contract awards place the cost
of new offshore wind capacity well below the 2025 target of €80/MWh, 8 years ahead of schedule, with projects in
Denmark and the Netherlands entering FID in 2017-2018 attaining strike prices equivalent to below €70/MWh63.
This marks a reduction of 60% from 2010 levels.
62 Pipeline data is based on a central scenario of deployment, according to probability of project build.
63 Borssele III & IV tender achieved a strike price of €54/MWh, equivalent to ~€68/MWh once a €14/MWh uplift is applied to account for grid connection and site development costs.

REWIND OFFSHORE – Comparative Analysis of International Offshore Wind Energy Development, March 2017
123
Figure 28. Offshore wind cost trends in Europe
* The Crown Estate (TCE) Cost Reduction Pathways (2011); ** Cost Reduction Monitoring Framework (2017) *** Includes grid connection and site development costs for NL and DK projects (uplift of €14/MWh64). It should be noted that many of the ‘actual’ projects reaching FID have not yet been built.
The cost reduction achieved has been driven by several factors, including: considerable technology innovation,
particularly larger turbines; scale effects through increasing project size, clustering, and cumulative installed
capacity; increased competition throughout a more mature supply chain; greater experience and capability through
learning by doing; preferential financing terms from a more diverse range of investors viewing offshore wind as a
bankable asset class and an attractive investment opportunity; and increased government intervention to de-risk
projects for developers. Many of these drivers are expected to continue driving down costs over the coming years
as offshore wind establishes itself as a vital component of the energy system for many countries in Europe and
further afield.
64 €14/MWh derived from €12-15/MWh range suggested by NERA Consulting (2016) Auctions and Bidding Strategy for Offshore Wind, available at http://www.nera.com/content/dam/nera/publications/2016/PUB_Offshore_Wind_A4_0916.pdf and €14/MWh used by BVG Associates in http://www.offshorewind.biz/2016/10/28/borssele-tender-revealed/
0
20
40
60
80
100
120
140
160
180
2010 2011 2012 2013 2014 2015 2016 2017 2018 2019 2020
LCO
E (€
/MW
h)
TCE-1: Slow progression* TCE-2: Technology acceleration
TCE-3: Supply chain efficiency TCE-4: Rapid progression
CRMF (UK average)** EUR auction tenders (average)***
Industry 2020 target Industry 2025 target
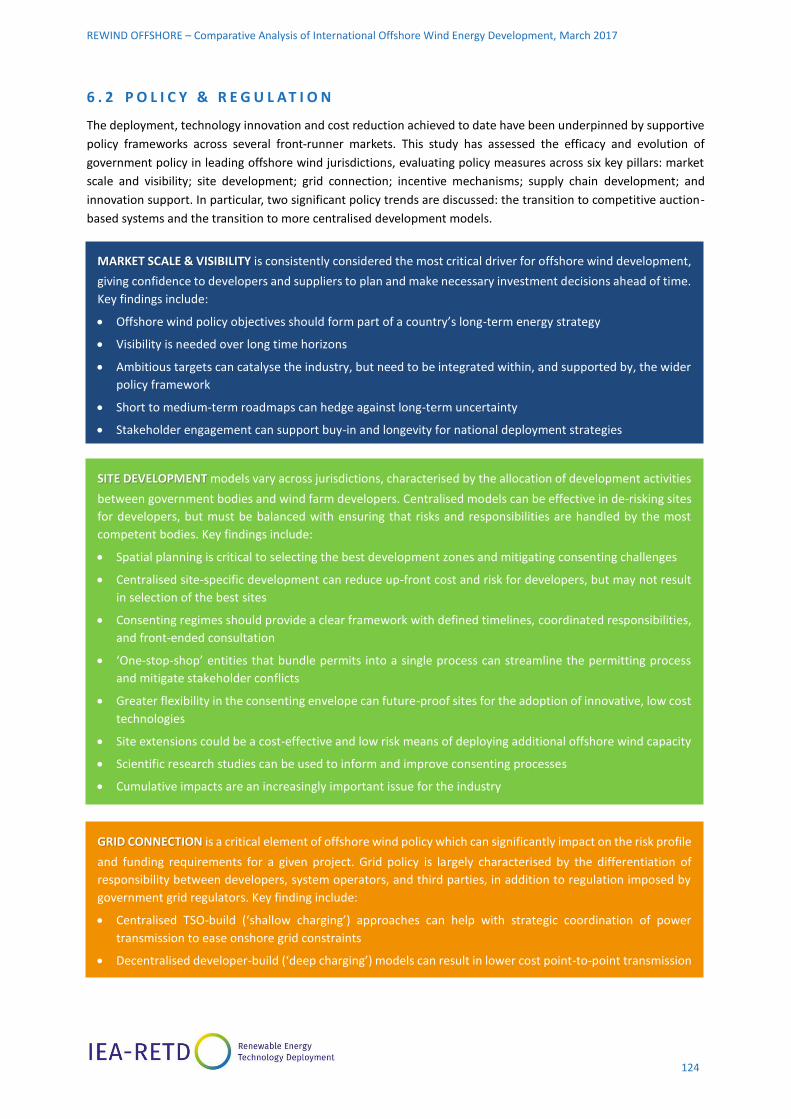
REWIND OFFSHORE – Comparative Analysis of International Offshore Wind Energy Development, March 2017
124
6 . 2 P O L I C Y & R E G U L AT I O N
The deployment, technology innovation and cost reduction achieved to date have been underpinned by supportive
policy frameworks across several front-runner markets. This study has assessed the efficacy and evolution of
government policy in leading offshore wind jurisdictions, evaluating policy measures across six key pillars: market
scale and visibility; site development; grid connection; incentive mechanisms; supply chain development; and
innovation support. In particular, two significant policy trends are discussed: the transition to competitive auction-
based systems and the transition to more centralised development models.
MARKET SCALE & VISIBILITY is consistently considered the most critical driver for offshore wind development,
giving confidence to developers and suppliers to plan and make necessary investment decisions ahead of time.
Key findings include:
Offshore wind policy objectives should form part of a country’s long-term energy strategy
Visibility is needed over long time horizons
Ambitious targets can catalyse the industry, but need to be integrated within, and supported by, the wider
policy framework
Short to medium-term roadmaps can hedge against long-term uncertainty
Stakeholder engagement can support buy-in and longevity for national deployment strategies
SITE DEVELOPMENT models vary across jurisdictions, characterised by the allocation of development activities
between government bodies and wind farm developers. Centralised models can be effective in de-risking sites
for developers, but must be balanced with ensuring that risks and responsibilities are handled by the most
competent bodies. Key findings include:
Spatial planning is critical to selecting the best development zones and mitigating consenting challenges
Centralised site-specific development can reduce up-front cost and risk for developers, but may not result
in selection of the best sites
Consenting regimes should provide a clear framework with defined timelines, coordinated responsibilities,
and front-ended consultation
‘One-stop-shop’ entities that bundle permits into a single process can streamline the permitting process
and mitigate stakeholder conflicts
Greater flexibility in the consenting envelope can future-proof sites for the adoption of innovative, low cost
technologies
Site extensions could be a cost-effective and low risk means of deploying additional offshore wind capacity
Scientific research studies can be used to inform and improve consenting processes
Cumulative impacts are an increasingly important issue for the industry
GRID CONNECTION is a critical element of offshore wind policy which can significantly impact on the risk profile
and funding requirements for a given project. Grid policy is largely characterised by the differentiation of
responsibility between developers, system operators, and third parties, in addition to regulation imposed by
government grid regulators. Key finding include:
Centralised TSO-build (‘shallow charging’) approaches can help with strategic coordination of power
transmission to ease onshore grid constraints
Decentralised developer-build (‘deep charging’) models can result in lower cost point-to-point transmission
assets, but centralised TSO-build models may deliver net lower societal costs if offshore hubs and
interconnection can be integrated
TSOs need to be sufficiently capitalised to take on the cost and risk of managing all transmission assets
Suitable liability clauses need to be in place to reduce the risk profile for wind farm and transmission
operators
Standardisation and innovation can deliver considerable cost reduction

REWIND OFFSHORE – Comparative Analysis of International Offshore Wind Energy Development, March 2017
125
transmission assets, but centralised TSO-build models may deliver net lower societal costs if offshore hubs
and interconnection can be integrated
TSOs need to be sufficiently capitalised to take on the cost and risk of managing all transmission assets
Suitable liability clauses need to be in place to reduce the risk profile for wind farm developers and
transmission operators
Standardisation and innovation can deliver considerable cost reduction
INCENTIVE MECHANISMS are critical enablers for offshore wind deployment. Incentive mechanisms have
evolved as the sector and technology have matured, from grants and feed-in tariffs in the industry’s formative
years to more market-based mechanisms today, including the recent adoption of competitive auction systems.
Key findings include:
Various incentive mechanism design options are available to policy makers, which balance risk between
government and developers
Governments must balance low costs with the risk of non-delivery
Beyond mechanism design, the most important factor is providing clarity, visibility, and stability
Transitions from fixed-remuneration systems to competitive auctions can introduce higher allocation and
price risk and need to be managed carefully
Emerging markets should carefully consider when to adopt competitive auction systems
Ability to adopt competitive approach depends on domestic capabilities
Competitive auctions should be designed to deter speculative bids and penalise non-delivery
SUPPLY CHAIN DEVELOPMENT is vital to build the necessary capability to deliver projects on time and on
budget, as well as improve the competitiveness of domestic suppliers. Linking energy policy to industrial
strategy can maximise the capture of local economic benefits, but local content objectives will need to be
balanced with cost reduction goals. Key findings include:
Suppliers need long-term visibility and certainty of market scale
Local content requirements can support domestic industrial policy, but are likely to be a barrier to cost
reduction
Bottom-up initiatives may be more effective in balancing government objectives to reduce costs and
maximise local economic benefit
Public investment in infrastructure can catalyse private sector investment, leading to the creation of supply
chain clusters
Business support programmes can attract new market entrants and improve supplier competitiveness
Specialisation, through leveraging existing capabilities and investing in innovation, can create competitive
advantage for domestic suppliers
While Europe has been relatively insulated from supply chain bottlenecks due to cumulative market scale
and regional cooperation, isolated emerging markets (e.g. USA, Japan, Chinese Taipei) with limited market
size will face greater challenges
International and inter-state cooperation can remove entry barriers for emerging markets
REWIND OFFSHORE – Comparative Analysis of International Offshore Wind Energy Development, March 2017
126
Emergent policy trends
While policy change can be disruptive to investor confidence, a certain degree of policy evolution is necessary in
order to adapt to prevailing market conditions and growing technology maturity, as well as capture and implement
best practice learnings. At present, two key emergent trends are apparent:
1. Transition to competitive auctions
With offshore wind maturing as an energy technology and with increasing pressure to drive down costs, competitive
auctions have been introduced in several countries. Recent auction tenders suggest that this approach has been
effective in delivering steep cost reduction, but capacity constrained auctions have also increased price and
allocation risk for developers.
It is expected that many countries will be able to move directly to competitive auction-based systems. However, this
approach may increase the risk of non-delivery, particularly if a country lacks access to a robust supply chain. More
isolated markets are therefore expected to adopt fixed remuneration support systems, such as feed-in tariffs, to
stimulate local industry before introducing greater price competition.
2. Transition to centralised development models
To balance increasing price and allocation risk for developers from capacity constrained and competitive auctions,
as well as manage onshore grid constraints, several governments are taking on greater up-front risk in the
development stage. Development de-risking activities, such as obtaining consent, acquiring site data, and securing
grid permits, can limit the risk exposure for prospective developers who would otherwise need to invest tens of
considerable sums in undertaking these activities without any guarantee of ultimately succeeding. As a
consequence, there has been shift from typical open door approaches to site-specific tendering, often with the
provision of offshore transmission assets (for example in Denmark, the Netherlands, and Germany).
However, it should be noted that, to be delivered effectively, centralised approaches require considerable capacity
building within government departments and relevant third parties, such as transmission system operators, as well
as suitable regulation to balance the risk profile for relevant parties. Indeed, wind farm developers often exhibit a
preference for greater control of many development activities and offshore transmission assets. This is partly based
on a perception of greater efficiency from developers compared to government bodies, a desire to be able to
demonstrate competitiveness across a wider scope of activities, and also heightened portfolio risk from widespread
adoption of site-specific tendering.
INNOVATION SUPPORT is essential to complement supply chain policies and drive cost reduction across the
industry. Technology innovation has been a cornerstone of cost reduction achieved to date and will continue
to play a major role going forward. Key findings include:
Strategic identification and prioritisation of technology innovation needs can focus R&D efforts
Creating close ties between academic research centres and industry can maximise market penetration of
novel technologies
Industry-led collaborative R&D programmes can maximise the impact of public and private funding
Involving financial institutions and lending advisers early in the R&D process can mitigate high risk
perception of new technologies
Policies should be designed to enable integration of technology demonstrations in commercial projects
A balance of innovation support should be maintained across technology readiness levels

REWIND OFFSHORE – Comparative Analysis of International Offshore Wind Energy Development, March 2017
127
Aligning policies with government objectives
This report highlights a large number of best practice policy measures for offshore wind development. However, the
specific policies adopted by governments will be highly contingent on both local context and national objectives.
Indeed, local context often defines the stated objectives of national governments. The inter-related nature of
different policy measures often results in trade-offs for policy makers to consider. Thus, while governments may
desire achieving multiple competing objectives, these are not always compatible. Table 27 provides an indicative
example of policy approaches in order to achieve four common government objectives, highlighting the trade-offs
that can exist.
Table 27. Indicative policy measures and prioritisation by government objective
Government Objective
Catalyse
deployment
Maximise cost
reduction
Maximise local
economic benefits
Alleviate onshore
grid constraints
Po
licy
Me
asu
re
Market scale &
visibility
High deployment targets
Long-term visibility
High deployment targets
Long-term visibility
High deployment targets
Long-term visibility
Constrained deployment
Long-term visibility
Site
development Site de-risking activities Site de-risking activities Site de-risking activities Site-specific tendering
Grid
connection Country-specific Country-specific Country-specific
Centralised coordination of
transmission networks
Incentive
mechanism
Fixed remuneration support
Auction-based system Local content within evaluation criteria
Capacity-constrained auctions
Supply chain Supply chain enabling
policies
Innovation support; Maximise supplier
competition
Infrastructure investment
Investment in grid infrastructure
Innovation Focus on high TRL Balanced support
across TRLs Targeted support for
areas of specialisation
Focus on system balancing/
interconnection
Key: Green = High emphasis; Amber = Moderate emphasis; Red = Low emphasis; Grey = Dependent on local context.
Catalyse deployment: Policy makers looking to catalyse deployment to meet decarbonisation and energy security
goals should prioritise giving long-term visibility of market scale, combined with fixed remuneration support (e.g.
feed-in tariff/premium). Particularly in more isolated emerging markets, providing guaranteed levels of fixed support
can reduce revenue risk for developers and encourage new suppliers to enter the market. This should be
complemented with targeted supply chain support programmes, tailored to local requirements and specialisations.
The risk of non-delivery might also be mitigated by government de-risking activities, such as the provision of pre-
consented sites. However, policy makers will need to consider whether the level of internal capacity building
required is feasible with high deployment volumes, or whether the cost and level of resources is justified if
anticipated deployment levels are low.
Innovation support may be considered lower priority, but can be focussed towards higher TRL technologies that can
be adopted in early projects. However, countries with long-term deployment aims are encouraged to maintain
support for innovation across TRL levels. Countries may also need to support R&D activities to overcome specific
local challenges, such as resistance to natural hazards.

REWIND OFFSHORE – Comparative Analysis of International Offshore Wind Energy Development, March 2017
128
Maximise cost reduction: Long-term visibility of market scale is equally important for policymakers prioritising
cost reduction. As opposed to fixed remuneration support, the adoption of auction-based systems is likely to be
more effective in driving down costs. Indeed, the recent shift to competitive auctions is largely driven by
governments prioritising cost reduction as their primary objective.
However, the tighter margins can put pressure on suppliers and increase the risk of non-delivery if projects
encounter issues or market forces lead to increased costs. Innovation is likely to be high priority across all TRL levels,
creating a strong pipeline of low cost technology innovations. This may converge with supply chain support,
however, countries with low consumer costs as a primary objective may be able to achieve cost reduction goals by
leveraging non-domestic supply chains.
Maximise local economic benefits: Maximising local economic benefits and aligning energy policy with
industrial strategy will require more targeted supply chain support, through a combination of investment in enabling
infrastructure and support for domestic businesses. This can include a prioritisation to provide innovation support
for companies with potential to service both domestic and overseas markets.
Local content requirements can also be introduced and tied to incentive mechanisms. Although this can be effective
in ensuring supplier contracts are concentrated domestically, stringent requirements can be a barrier to achieving
cost reduction goals.
Alleviate onshore grid constraints: For several countries, onshore grid constraints are a barrier to deploying
large volumes of offshore wind. Policy makers may therefore look to control the amount and phasing of additional
installed capacity. This is likely to be enabled through capacity constrained tenders for specific sites, under a
centralised development model. A site-specific approach can enable government departments to manage
connection points for new capacity and ensure that onshore grid reinforcements are coordinated to meet demand.
Key overarching principles
Despite the competing objectives and trade-offs that policy makers must consider, there are several key principles
that should remain embedded in government policy in order to effectively achieve national goals and support
offshore wind development:
Figure 29. Key principles and policy areas for effective offshore wind development

REWIND OFFSHORE – Comparative Analysis of International Offshore Wind Energy Development, March 2017
129
● Stability: Stability is vital to maintain trust between government and industry and ensure continuity in the
sector. Retroactive changes to policy can be extremely damaging to investor confidence, leading to higher risk
premiums and higher energy costs. A clear and transparent legal framework is essential, and any changes to
policy should be communicated ahead of time and managed to limit damage to industry confidence.
● Visibility: Given the long development cycles for offshore wind farms, visibility is essential to enable developers,
suppliers, and responsible authorities to plan and make necessary investment decisions. This can include
visibility of long-term market scale (i.e. deployment targets, subsidy support budgets), the scale and timing of
auction rounds, and the timeline and requirements for permitting and consenting procedures.
● Flexibility: Flexibility in regulatory regimes can maximise opportunities for wind farm developers to reduce
project costs. This can include flexibility in consenting envelopes to enable the adoption of novel technologies,
flexibility in site selection and layout, flexibility in the phasing of delivery milestones, and, depending on national
objectives, flexibility in local content requirements.
● Coordination: Clear and coordinated responsibilities between government departments with shared objectives
is vital to ensuring a smooth and efficient delivery of offshore wind programmes. One-stop-shop entities can be
an effective means of ensuring coordination and maximising efficiency and clarity for wind farm developers.
Consultation should also be expanded to all impacted stakeholders and front-ended to mitigate potential
conflicts.
● Collaboration: Collaboration between governments and industry will be critical to delivering low cost offshore
wind across geographies. Inter-governmental collaboration can foster greater interconnection, help to manage
deployment schedules to avoid supply chain bottlenecks, and maximise consistency in consenting regulations.
Meanwhile, collaboration across industry and government in innovation activities can maximise the impact of
R&D spend and deliver lower cost technology solutions.

REWIND OFFSHORE – Comparative Analysis of International Offshore Wind Energy Development, March 2017
130
6 . 3 I N D U S T R Y S T R U C T U R E S
Industry maturity
A growing body of evidence suggests that the offshore wind industry in the established markets of Northern Europe
has matured in recent years. The industry has moved from innovation (1990 to 2001), adaptation (2002 to 2008), to
market stabilization (2009 to 2015). The market stabilisation phase is marked by an increase in project size; the
development of dedicated manufacturing facilities; and a supply chain distinguishing itself from the oil & gas and
onshore wind industries. Evidence from the stakeholder interviews suggest further developments through the
market stabilisation phase, suggesting that the industry may be moving into a ‘market maturation’ phase:
● Steep cost reduction evident in several European countries.
● Several European markets have become commoditised, with financial investors, commonwealth funds and
pension funds now investing in operating assets, allowing utilities to recycle capital to new projects.
● Perceived risks from the investor and finance community have been reduced due to growing confidence in the
ability of developers and the supply chain.
● Project margins have reduced over the last five years due to increased confidence in the industry and perceived
reduction of residual risk levels.
● Consolidation of industry developers, particularly in the UK where significant exits have left fewer players in the
market.
Project developers
There are two broad categories of developer model; the utility-developer and IPP-developer. While utility
developers have tended to dominate in the UK and Denmark, IPP-developers have been more successful in Germany,
Belgium and the Netherlands (see Figure 30). Historically, utility-developers have mostly relied on balance sheet
financing with less third party scrutiny. This enabled them to adopt higher risk approaches, with more contracts and
more aggressive scheduling. In contrast, IPP-developers tended to adopt risk adverse strategies, with a smaller
number of construction contracts, conservative scheduling and technology choices to meet requirements of debt
providers.
The development of an offshore wind industry requires involvement from a range of players that make up the
industry structure. As the sector has matured, these industry structures have evolved, with the number and
type of active players, as well as the models and strategies pursued, changing over time. Key findings include:
The industry has developed in recent years and may be entering a market maturation phase in key
established markets such as the UK and Germany
The market has been comprised of two distinct models: the utility and independent power producer
developer (IPP) models
Developer models have evolved, with growing use of project finance by utility developers, and a trend
towards development consortia
Predictions of capital constraints have not been borne out, due to slower pace of development and
increasing trust by funders in the industry’s capabilities
Many emerging markets have significant supply chain capabilities due to pre-existing onshore wind and oil
& gas industries. However, a lack of vessels for WTG installation and O&M servicing could present potential
bottlenecks.
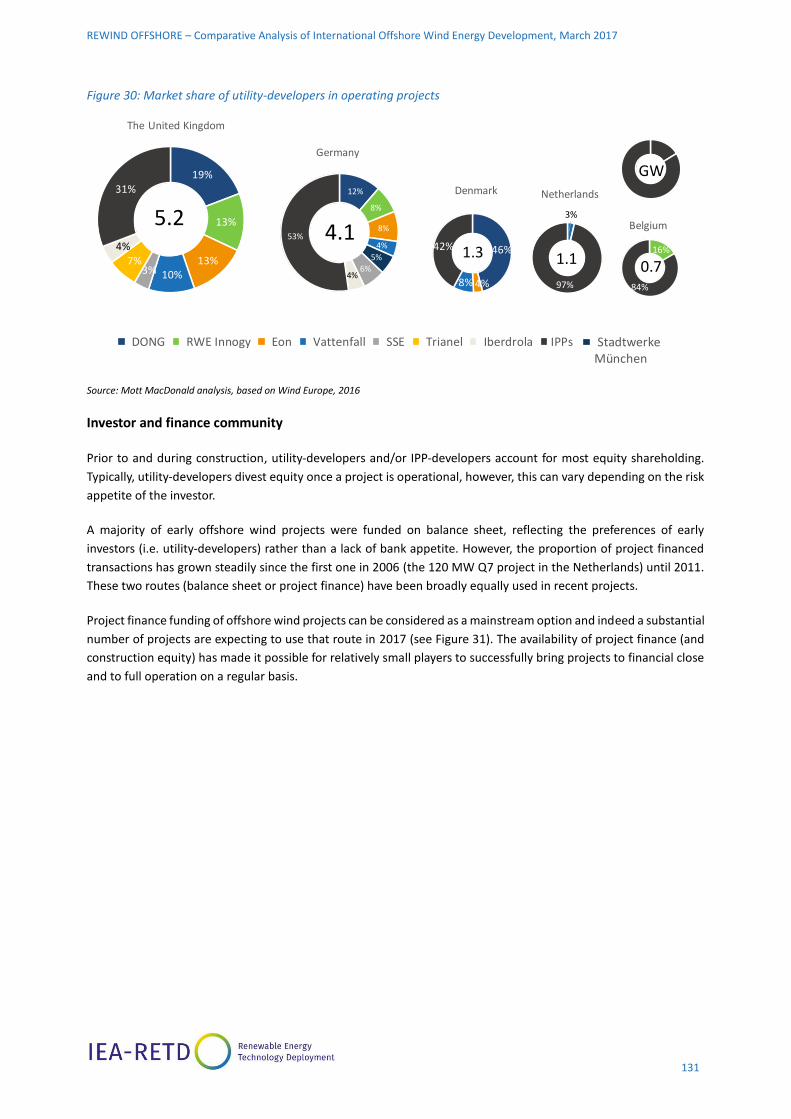
REWIND OFFSHORE – Comparative Analysis of International Offshore Wind Energy Development, March 2017
131
Figure 30: Market share of utility-developers in operating projects
Source: Mott MacDonald analysis, based on Wind Europe, 2016
Investor and finance community
Prior to and during construction, utility-developers and/or IPP-developers account for most equity shareholding.
Typically, utility-developers divest equity once a project is operational, however, this can vary depending on the risk
appetite of the investor.
A majority of early offshore wind projects were funded on balance sheet, reflecting the preferences of early
investors (i.e. utility-developers) rather than a lack of bank appetite. However, the proportion of project financed
transactions has grown steadily since the first one in 2006 (the 120 MW Q7 project in the Netherlands) until 2011.
These two routes (balance sheet or project finance) have been broadly equally used in recent projects.
Project finance funding of offshore wind projects can be considered as a mainstream option and indeed a substantial
number of projects are expecting to use that route in 2017 (see Figure 31). The availability of project finance (and
construction equity) has made it possible for relatively small players to successfully bring projects to financial close
and to full operation on a regular basis.
46%
4%8%
42%
Denmark12%
8%
8%
4%
5%
6%4%
53%
Germany
3%
97%
Netherlands
5.24.1
1.3 1.1 0.7
GW19%
13%
13%10%3%
7%4%
31%
The United Kingdom
16%
84%
Belgium
DONG , 12%
Innogy, 8%
Eon , 8%
Vattenfall , 4%Stadtwerke
München , 5%SSE , 6%
EnBW , 4%
IPPs, 53%
Germany DONG
RWE Innogy
Eon
Vattenfall
StadtwerkeMünchen
DONG , 19%
Innogy, 13%
Eon , 13%
Vattenfall , 10%SSE , 3%
Trianel , 7%
Iberdrola , 4%
IPPs, 31%
The United Kingdom
DONG RWE Innogy Eon Vattenfall SSE Trianel Iberdrola IPPs

REWIND OFFSHORE – Comparative Analysis of International Offshore Wind Energy Development, March 2017
132
Figure 31: Pipeline of project financed projects
Source: Green Giraffe, based on WindEurope data for new installations and internal database for project finance transactions
Supply Chain
With its infancies in Denmark, a number of WTG manufacturing facilities in the offshore wind industry are located
in these areas, including Brande, Aarlborg, and the port of Esbjerg in Denmark. Since then, the industry has seen a
growth and geographical diversification of the supply chain facilities, including the hubs in Rostock, Bremerhaven
and Cuxhaven in Germany, as well as the Humber region in the UK where Siemens is establishing blade
manufacturing facilities and DONG Energy is establishing a service harbour. Emerging markets in which no projects
are yet operational aim to establish at least a partial domestic supply chain, including France, the USA and Chinese
Taipei.
Balance of plant manufacturing facilities are more widely spread, including the UK, Germany, Netherlands, Belgium,
France, Spain, and South Korea. The majority of the supply chain and value creation to date though remains in
Europe.
However, a number of plans for manufacturing facilities across Europe have been cancelled or put on hold over the
last years due to delays in projects and market growth, as well as a lack of confidence in the size of the market
beyond 2020. Overall, as was confirmed by stakeholder interviews, the level of competition has improved and the
overall supply chain is perceived to be more robust than a few years ago.
Q1 2017 Q2 2017 Q3 2017 Q4 2017
Greenfield
financings
Refinancings
Northwester
Burbo Bank holdco financing
EMF
Borssele 3-4
BLLegend
DE
FR UK
NLongoi
ng
TBW II
DeBu
UK CFD winner
Gemini
TBW I
Global Tech 1
Butendiek
London Array (CDPQ)
Lincs

REWIND OFFSHORE – Comparative Analysis of International Offshore Wind Energy Development, March 2017
133
6 . 4 P R O J E C T R I S K M A N A G E M E N T
Project lifecycle risks
Project risks are varied and are influenced by different drivers. The primary lifecycle risks can be classified as:
● Allocation risk: Risk of securing a site, the right to develop, construct and operate an offshore wind farm and/or
to obtain revenue support
● Price risk: Competitive auctions, wholesale price volatility and commodity price volatility.
● Development risks: Risk of cancellation of the project during the development phase (potentially EUR 10s of
millions) due to fatal flaws / non-feasibility due to environmental & permitting issues, undue ground risk, grid
connection approval issues etc.
● Funding risks: Risk of not finding enough funders or delays in obtaining funders approval
● Construction risks: Risk of cost overrun or delays due to adverse weather, interface risks, bottlenecks in the
supply chain, etc.
● Operation risks: Risk of cost overrun and/or underperformance due to accessibility risk, lead time for spares
and logistics, bottlenecks in specialist maintenance staff
Developer risk mitigation tools
Where possible, developers aim to wholly eliminate or avoid risk at a development and design stage. Passing risks
on the third parties, typically construction and operation contractors, is a key tool for developers to manage risks.
To ensure affordability, the level of risks assumed by contractors is typically limited and/or shared with developers.
Where residual risks cannot be fully foreseen or mitigated through design out, or passing on to third parties is not
viable, contingency budgets and insurance may be required.
Policy & regulation, as documented above, can have a major influence on the risk profile for wind farm
developers. However, developers themselves can employ a range of tools and strategies to limit their risk
exposure. Key findings include:
Collaboration within the industry helps to manage developer risks on large-scale projects under auction
regimes
More successful projects build a strong management team and have fall-back plans in place
Strong relationships with regulators, executing authorities and third parties lead to more successful projects
Continued innovation is required to achieve cost reductions
Developers do not require all risks to be mitigated, but regulatory frameworks need to ensure risk-reward
balance for developers
Allocation of grid connection risk to the grid operator by regulators requires effective performance
incentives for the grid operator

REWIND OFFSHORE – Comparative Analysis of International Offshore Wind Energy Development, March 2017
134
Table 28. Developer risk mitigation tools
Risk mitigation tool Objective Example Cost impact on
developers
Design out Eliminate risks by development of safe
designs or avoidance of risk through
technology selection.
E.g. Revision of design standards for
foundations to mitigate grouted
connection failure in monopiles.
Low
High
Pass on to third parties Pass risks on to parties that are best
placed to control and manage the risk
E.g. Pass on P50 weather risk to
construction contractors
Contingency Allow for a contingency budget for
risks that cannot be mitigated with the
above strategies
E.g. Include construction contingency for
known and unknown risks, such as
residual interface risk
E.g Include float for delays in schedule of
works between the works of different
construction contracts
Insurance Take out insurance for risks that
cannot be mitigated with the above
strategies
E.g. Insurance for public liability or
unforeseen loss
Developer risk mitigation strategies
Developer risk mitigation strategies are diverse and subject to regulatory framework design, site specific
environmental, permitting and technical risks, the status of the wider industry, and competing technologies and
markets. General mitigation strategies that should be applied include:
● Assurance that good industry practice is followed through deployment of experienced management teams and
contractors
● Collaboration with other developers and supply chain, e.g. form consortia to spread allocation and development
risks, secure funding, and drive innovation
● Collaboration with regulators and executing authorities to mitigate non-compliances
● Establish fall-back plans early in the development process and maintain flexibility in the approach to
development, e.g. include float in schedule, reduce reliance on single points of failure, one-of-a- kind equipment
● Get project agreement and the project’s execution strategy third party reviewed early in the process to check
that risk mitigation is adequate
Trends in developer risk profiles
The introduction of auctions in Europe has on the one hand materially increased the developers’ allocation risk and,
on the other hand, where centralised site-specific auction models are applied, led to a reduction of the development
risk. Funding, construction, and operation risks are decreasing primarily through industry learning, improving
capabilities and competition in the market. However, it must be acknowledged that technologies are still evolving
at a fast pace and the industry continues to transition to site in deeper more challenging waters which may face
developers with new challenges.

REWIND OFFSHORE – Comparative Analysis of International Offshore Wind Energy Development, March 2017
135
Table 29. General trends in developer risk levels
Project risk
category
Trends in
developer’s
risk level
Drivers
Allocation risk ● Introduction of auctions and cap on market growth
● Trend towards “central model” with site selection by regulator and cap on
market growth rate
● High levels of competition under auctions to date
● Uncertainty over timing and size of auction rounds
● Need for differentiated support for innovative technologies
Price Risk ● Competitive auctions create strike price uncertainty.
● Wholesale price uncertainty.
● Commodity price volatility.
Development
risk
● Trend of regulators assuming part or majority of the development scope to
derisk projects for developers, to increase chance of project realisation and to
meet policy targets.
● Increasing project size and scale of overall industry requires coordinated
approach to grid connection.
Funding risk ● Inreasing trust by funders
● Attraction of new funders to the market
● Increase in project size requires greater number of funders per project
Construction
risk
● Learning of the industry
● Greater trust in contractor capabilities
● Greater availability and compeitition of contractors
● Continued evolution of technologies and use of technologies with limited track
record
● Sites conditions become more challenging (deeper waters, further offshore,
larger capacity and larger equipment)
● Increasing cost reduction pressure due to lower tariff levels
Operation risk ● Learning of the industry
● Greater trust in contractor capabilities
● Greater availability and compeitition of contractors
● Limited track record of aging assets
● Sites conditions become more challenging (deeper waters, further offshore)
● Increasing cost reduction pressure due to lower tariff levels
Decreasing No clear trend/mixed drivers Increasing

REWIND OFFSHORE – Comparative Analysis of International Offshore Wind Energy Development, March 2017
136
6 . 5 R E C O M M E N D AT I O N S F O R P O L I C Y M A K E R S
Analysis of the evolution of offshore wind policies has revealed several important lessons with regard to best
practice approaches for stimulating deployment and reducing costs.
Governments should re-evaluate their offshore wind ambitions in light of accelerated cost reduction
Offshore wind is entering a maturation phase which has already seen costs fall dramatically in early tender rounds.
With further cost reduction anticipated, offshore wind could potentially be fully integrated into the market on a
competitive basis in some European countries within the next decade65. In light of this development, governments
should re-evaluate their energy strategies to consider raising ambitions for future deployment.
Governments should consider implementing near-term roadmaps to hedge against long-term uncertainty
Long-term visibility is a common request from industry players, but does not always align with short term political
cycles. As a compromise, near-term roadmaps – tied to suitable support mechanisms – can provide the necessary
certainty and stability to increase market confidence. This approach has been particularly effective in the
Netherlands, with Germany set to adopt a similar approach.
Competitive auctions can drive down costs, but should be accompanied by government de-risking activities
The transition to competitive auctions has been hugely effective in delivering steep cost reduction. However, in
order to deliver future cost reduction governments are likely to need to mitigate increased allocation and price risk
by undertaking site development activities to de-risk investments from developers. Undertaking spatial planning
and constraint mapping to identify sites, making site survey data publically available, and securing necessary permits
can all significantly limit the risk exposure for developers. In countries with established industries, enabling the
extension of existing sites can also unlock lower risk and lower cost means of adding new capacity.
Policymakers in more isolated emerging markets are still likely to require attractive support mechanisms and enabling policies to kick-start domestic industries
The progress and cost reduction achieved in Europe has been partly attributed to clustering and concentrated
development around the North Sea region. For more isolated emerging markets, such as Japan, Taiwan, and the
United States, greater public intervention is expected to be necessary to de-risk investment and develop the
necessary industry structures to deliver cost-effective offshore wind projects.
Governments must continue supporting technology innovation to achieve long-term cost reduction
The cost reduction achieved in recent years has been largely driven by technology innovation. Despite the
considerable progress made to date, policymakers should not step back from efforts to support research and
development activities. Rather, government R&D support should be expanded to develop and de-risk technologies
that will be crucial to achieving long-term cost reduction. This is particularly relevant in relation to developing larger
turbines and associated supporting infrastructure, commercialising floating wind technology to unlock new markets
for offshore wind, and developing technologies to withstand extreme weather conditions in these new markets.
Regulatory frameworks should encourage industry collaboration and information sharing
Despite the transition to more competitive market conditions, continued industry collaboration will be vital to
accelerating learning and maximising the impact of both public and private investment. Governments should look
to foster collaborative partnerships, forums, and programmes to overcome common challenges, particularly as the
industry expands to new markets.
65 The Dutch Government have outlined plans to hold the first tenders for un-subsidised offshore wind farms by 2026.

REWIND OFFSHORE – Comparative Analysis of International Offshore Wind Energy Development, March 2017
137
6 . 6 R E C O M M E N D AT I O N S F O R I N D U S T R Y P L AY E R S
The offshore wind industry has evolved considerably in recent years: the supply chain has developed, developers
have become better at managing risk, and the investment community has greater confidence in the industry as a
whole. The following recommendations are derived from the lessons learned and should be applied by industry
players in established and emerging markets.
Embrace collaboration within the industry to manage developer risks on large-scale projects under
auction regimes
The introduction of auction regimes in Europe has introduced greater allocation risk for developers. Furthermore,
project capacities are growing and with it the capital required and impact of failure of a single project on a
developer’s overall business. Developers have approached these trends through collaboration and forming of
consortia between developers and/or with stakeholders from the supply chain to share risks and increase the chance
of winning bids, as well as maintain a reasonably-sized project pipeline.
Build a strong management team and have fall-back plans in place
Developers’ risks are now well understood and effective risk mitigation strategies have been identified. To ensure
industry lessons learned are applied and learning is continued, an experienced project management team is pivotal
to the success of a project, as well as robust planning and fall-back plans. Developers should involve independent
advisors early in the planning phase when optimisation of the procurement and execution strategy is feasible and
has the potential for large savings later on in the project.
Build strong relationships with regulators, executing authorities, and third parties
In particular, in emerging markets with little or no experience on the regulator side, industry should engage early
with regulators, interfacing authorities and third parties to clarify requirements and establish a collaborative and
constructive dialogue. Industry players should participate in stakeholder consultations held by regulators to mitigate
unrealistic requirements or unintended risks being introduced to developers and their funders.
Continue to innovate
European offshore wind tenders awarded in 2016 confirm that developers need to achieve material cost reductions
to what has been seen in the industry to date. Developers cannot solely rely on established technologies, but need
to seek to continue to innovate. This can be achieved through participation in industry R&D initiatives, collaboration
with universities and supply chain or regulator-supported pilot-schemes. Developers should engage early with
potential funders to familiarise them with potential innovations and risks mitigation strategies.
Engage more with the public to improve the public perception of the offshore wind industry
The public perceives offshore wind to be less reliable and more expensive than other forms of electricity generation.
More could be done by the industry to improve its public standing by promoting the importance of offshore wind
in maintaining grid stability, the recent gains in cost reductions, and the benefits to local and regional economies.

REWIND OFFSHORE – Comparative Analysis of International Offshore Wind Energy Development, March 2017
138
B I B L I O GR A P H Y
4C Offshore. 2015. Offshore Structures (Britain) opens its doors. available at:
http://www.4coffshore.com/windfarms/offshore-structures-(britain)-opens-its-doors-nid2374.html
4 Power. 2014. EU and Regional Policies for Offshore Wind: Creating Synergies. Available at:
http://www.4-
power.eu/media/6366/2014_4power_sow_eu_and_regional_policies_for_offshore_wind_creating_sy
ne.pdf
50Hertz. 2016. Kriegers Flak – Combined Grid Solution. Available at: http://www.50hertz.com/en/Grid-
Extension/Offshore-projects/Projects/Combined-Grid-Solution
Altran and Arthur D Little. 2011. Risk Quantification and Risk Management in Renewable Energy
Projects. IEA-RETD. available at: http://iea-retd.org/wp-content/uploads/2011/11/RISK-IEA-RETD-
2011-6.pdf
Bloomberg. 2016. ABB to sell cables business to Danish NKT for $934 million. available at:
https://www.bloomberg.com/news/articles/2016-09-21/abb-to-sell-cable-business-to-nkt-cables-for-
934-million
Carbon Trust. 2017. Offshore Wind Accelerator. Available at: https://www.carbontrust.com/client-
services/programmes/offshore-wind/
Clean Tech Media. 2015. India approves offshore wind energy policy. available at:
https://cleantechnica.com/2015/09/11/india-approves-offshore-wind-energy-policy/
Dedecca et al. 2016. Market strategies for offshore wind in Europe: A development and diffusion
perspective. Renewable and Sustainable Energy Reviews. available at:
http://www.sciencedirect.com/science/article/pii/S1364032116304233
Dutch News. 2016. New Dutch offshore wind farm project requires much lower subsidies: minister.
Available at: http://www.dutchnews.nl/news/archives/2016/12/new-dutch-wind-farm-project-
requires-much-lower-subsidies-minister/
European Commission. 2015. Connecting power markets to deliver security of supply. market integration
and the large-scale uptake of renewables. Available at: http://europa.eu/rapid/press-release_MEMO-
15-4486_en.htm
European Commission. 2015. The regulatory framework for wind energy in EU member states. Available
at:http://publications.jrc.ec.europa.eu/repository/bitstream/JRC93792/d1_regulatory_framework_wi
nd_energy_in_ms_march_2015%20(2).pdf
European Commission. 2016. Renewable energy in the EU. Available at:
http://ec.europa.eu/eurostat/documents/2995521/7155577/8-10022016-AP-EN.pdf/38bf822f-8adf-
4e54-b9c6-87b342ead339
Fowind. 2014. Offshore Wind Policy and Market Assessment - A Global Outlook. Available at:
http://www.gwec.net/wp-

REWIND OFFSHORE – Comparative Analysis of International Offshore Wind Energy Development, March 2017
139
content/uploads/2015/02/FOWIND_offshore_wind_policy_and_market_assessment_15-02-
02_LowRes.pdf
Fowind. 2015. Supply Chain, Port Infrastructure and Logistics Study. Available at:
https://www.dnvgl.com/news/offshore-wind-development-in-india-fowind-launches-new-report-on-
supply-chain-ports-and-logistics-69602
Government of Netherlands. 2016. Collaboration between countries in the North Sea region for more
wind farms at a lower cost. Available at:
https://www.government.nl/latest/news/2016/06/06/collaboration-between-countries-in-the-north-
sea-region-for-more-wind-farms-at-a-lower-cost
Global Wind Energy Council. 2016. Global Wind Report - Annual Market Update 2015. Available at:
http://www.gwec.net/wp-content/uploads/vip/GWEC-Global-Wind-2015-Report_April-
2016_19_04.pdf
Global Wind Energy Council. 2017. Global Wind Statistics 2016. Available at: http://www.gwec.net/wp-
content/uploads/vip/GWEC_PRstats2016_EN_WEB.pdf
Green Investment Bank. 2016. Investment Sectors: Offshore Wind. Available at: http://www.greeninvestmentbank.com/investment-sectors/offshore-wind/
The Guardian. 2016. Siemens freezes new UK wind power investment following Brexit vote. available at:
https://www.theguardian.com/environment/2016/jun/28/siemens-freezes-new-uk-wind-power-
investment-following-brexit-vote
Hattam et al. 2015. Public Perceptions of Offshore Wind Farms. Crown Estate. available at:
https://www.thecrownestate.co.uk/media/501973/ei-public-perceptions-of-offshore-wind-farms.pdf
Higgins and Foley. 2014. The evolution of offshore wind power in the United Kingdom. Renewable and
Sustainable Energy Reviews. available at:
http://www.sciencedirect.com/science/article/pii/S1364032114003839
Howard. R. 2012. The Bullet-Proof Consent Application. A presentation presented at Renewable UK in
June 2012.
IRENA. 2016. Innovation Outlook – Offshore Wind. available at:
http://www.irena.org/DocumentDownloads/Publications/IRENA_Innovation_Outlook_Offshore_Wind
_2016.pdf
Kern et al. 2014. From laggard to leader: Explaining offshore wind developments in the UK. SPRU
Working Paper. available at: http://sro.sussex.ac.uk/48296/1/2014_02_SWPS_Kern_etal.pdf
LCICG. 2016. Technology Focus Areas. Available at:
http://www.lowcarboninnovation.co.uk/working_together/technology_focus_areas/overview/
Mott MacDonald. 2011. Accelerating the deployment of offshore renewable energy technologies. IEA-
RETD. available at: http://iea-retd.org/wp-content/uploads/2011/09/ADORET-Final-Report-2011-2-
Main.pdf

REWIND OFFSHORE – Comparative Analysis of International Offshore Wind Energy Development, March 2017
140
NERA Consulting. 2016. Auctions and Bidding Strategy for Offshore Wind. available at
http://www.nera.com/content/dam/nera/publications/2016/PUB_Offshore_Wind_A4_0916.pdf
O. Fitch-Roy. 2015. An offshore wind union? Diversity and convergence in European offshore wind
governance. Available at:
http://www.tandfonline.com/doi/figure/10.1080/14693062.2015.1117958?scroll=top&needAccess=tr
ue
OFGEM. 2014. Offshore Transmission OFTO Revenue Report. Available at:
https://www.ofgem.gov.uk/ofgem-publications/91890/es902offshoreoftorevenuereportweb.pdf
Offshorewind.biz. 2016. Borssele Tender Revealed. Available at:
http://www.offshorewind.biz/2016/10/28/borssele-tender-revealed/
ORE Catapult. 2015. Cost reduction monitoring framework – summary report to the Offshore Wind
Programme Board. available at: https://ore.catapult.org.uk/wp-content/uploads/2016/05/CRMF-ORE-
Catapult-report-to-the-OWPB.pdf
OREC. 2017. Cost Reduction Monitoring Framework. Available at: https://ore.catapult.org.uk/our-
knowledge-areas/knowledge-standards/knowledge-standards-projects/cost-reduction-monitoring-
framework/
Redpoint. Baringa and GL Garrad Hassan. 2012. UK Offshore Wind Market Study – Final Report. available
at: https://www.thecrownestate.co.uk/media/5494/ei-km-in-pe-market-112011-uk-offshore-wind-
market-study.pdf
Renews. 2016. Borssele bid saves €2.7bn. Available at: http://renews.biz/103318/borssele-bid-saves-
27bn/; Dutch News. 2016.
Renewables Grid Initiative. 2016. Fact Sheet Kriegers Flak – Combined Grid Solution. Available at:
http://renewables-
grid.eu/fileadmin/user_upload/Files_RGI/RGI_Publications/Factsheets/RGI_Factsheet_Kiergers_Flak.p
df
RENewEconomy. 2016. New low for wind energy costs: Morocco tender averages $US30/MWh.
Available at: http://reneweconomy.com.au/2016/new-low-for-wind-energy-costs-morocco-tender-
averages-us30mwh-81108
Renewablesnow. 2015. Competition body says UK's early offshore wind deals were too costly. Available
at: https://renewablesnow.com/news/competition-body-says-uks-early-offshore-wind-deals-were-
too-costly-483273/
The Crown Estate. 2011. Offshore Wind Cost Reductions Pathway Study. Available at:
https://www.thecrownestate.co.uk/media/5493/ei-offshore-wind-cost-reduction-pathways-study.pdf
The Crown Estate. 2011. Offshore wind operational report. Available at:
https://www.thecrownestate.co.uk/media/5462/ei-offshore-wind-operational-report-2016.pdf
The Crown Estate. Upcoming 2016. Industry Evidence Programme Report: Evidence Based Plans for
Offshore Wind. Available at : NA

REWIND OFFSHORE – Comparative Analysis of International Offshore Wind Energy Development, March 2017
141
TKI Wind op zee. 2015. Subsidy Schemes and tax regimes. Available at: http://tki-
windopzee.eu/files/2015-09/20150401-rap-subsidy.and.tax.policies-pwc-f.pdf
RenewableUK. 2014. Managing Regulatory and Consenting Costs for Offshore Wind. Available at: http://ruk.pixl8-hosting.co.uk/en/publications/index.cfm/managing-regulatory-consenting-costs-offshore-wind
WindEurope. 2017. Annual Offshore Statistics 2016. Available at: https://windeurope.org/wp-
content/uploads/files/about-wind/statistics/WindEurope-Annual-Offshore-Statistics-2016.pdf.
WindPowerOffshore. 2016. London Array breaks offshore production record. Available at:
http://www.windpoweroffshore.com/article/1378756/london-array-breaks-offshore-production-
record
WindPowerOffshore. 2016. Vattenfall wins Kriegers Flak with €49.9/MWh bid. Available at:
http://www.windpoweroffshore.com/article/1414947/vattenfall-wins-kriegers-flak-%E2%82%AC499-
mwh-bid

REWIND OFFSHORE – Comparative Analysis of International Offshore Wind Energy Development, March 2017
142
A P P E ND I X
M E T H O D O L O G Y
Overview
The report has been produced as part of a collaborative partnership between the Carbon Trust, Mott MacDonald,
and Green Giraffe, all of whom have leaned on considerable industry expertise from having been at the forefront of
the offshore wind industry over the past decade. Insights have been drawn from a combination of in-house
knowledge and experience, an extensive literature review, and a series of targeted interview with key industry
stakeholders.
Approach
The study leant on primary and secondary data in order to answer the proposed research questions. Market
intelligence was gathered through a combination of literature reviews and a series of targeted interviews. Together
these sources provided a comprehensive narrative and picture on how offshore wind has developed across leading
front runner markets with the aim to help inform emerging market policy design. Both secondary and primary data
were the predominant sources used to answer the research questions, with key insights drawn out through
interviews with stakeholders. Existing literature on leading and emerging markets, and associated suite of offshore
wind policies and market structures, is deemed to be of good quality. This secondary data was therefore be used to
build a strong evidence base for the analysis, and inform the design of interview guides. Interviews with key industry
stakeholders were used to draw out opinions and nuances on pertinent aspects such as policy effectiveness, impact
on project risk profile, and perceived best practice.
A multi-step, iterative process was pursued, as illustrated in Figure 32. The proposed method was aligned with
qualitative research concepts, methods and theory outlined within Bryman, A. (2015) Social Research Methods to
ensure validation.
Figure 32. Methodology overview
At the outset of the study, we consulted with the IEA-RETD PSG and internally across the implementing bodies’ in-
house experts to refine the scope of work and research method.
Define scope of workLiterature
reviewInterviews Data analysis
Form conclusions
Work w/ IEA RTD & PSG to define aims, objectives, timeline
Internal Consortium expert consultation
Establish research method
Identify case studies
Identify list of interviewees
Rapid evidence assessment of available and empirical literature
Interview guide design
Targeted sampling applying snowball techniques
c. 20 semi-structured interviews with industry stakeholders
Qualitative content data analysis Thematic and explanatory analysis of interview data
Concepts drawn from different groups, overarching insights combined

REWIND OFFSHORE – Comparative Analysis of International Offshore Wind Energy Development, March 2017
143
Case studies
Across the publication we developed a number of case studies. These were identified from the outset as being
integral to the development of insights and recommendations within this report. By focusing on a particular subset
of countries and specific generation projects we were able to draw out important insights for those markets seeking
to introduce and scale up offshore wind deployment today, and for those looking to integrate offshore wind assets
in the short to medium term.
Case studies were identified at country and project level, in addition to further case studies on industry structures.
Secondary data collection
A rapid evidence assessment66 of existing literature and market data was undertaken. Full details of the literature
reviewed can be found in the ‘References’ section.
Primary data collection: Interview sampling approach and data collection
Following selection of the case study countries and projects, a list of potential interviewees were identified, in order
to provide added insights for the project. A total of 25 interviews were conducted with a range of stakeholders
including developers, investors, OEMs, regulators, transmission operators, and academics.
The interviews provided valuable insights to inform each of the three main sections and report objectives. The
interviews sought to complement the literature review by:
Validating findings from the literature review
Drawing out insights and opinions on what policies have been effective, and conversely which haven’t been
conducive to industry growth
Outlining the key challenges from the perspective of government bodies, developers, and the supply chain
The interviews were conducted through semi-structured telephone interviews (or in person depending on
circumstance). Semi-structured interviews allow for probing and follow-up questions, and encourages the
emergence of unforeseen concepts and insights. Where appropriate, follow-up communication was undertaken
confirm and validate information.
The data collection period ran from week 6 to week 10 of the project. In order to ensure that the interviews were
designed appropriately and fit-for-purpose we conducted a small number of pilot interviews at the beginning of the
process. This allowed an opportunity to verify the current approach and make any necessary adjustments to the
interview structure and format. Furthermore, the staggered inflow of data over the interview period provided the
opportunity to iteratively explore the data and reformulate questions based on early responses.
Data Analysis
Following the data collection period, we applied standard interview response analysis techniques and applied
thematic and explanatory analysis to the interview data sets to draw out key themes.
66 Rapid evidence assessments provide a structured, stream-lined, and rigorous search of available literature and result in a quality and synthesised assessment of the evidence. They are less extensive than a comprehensive or systematic literature review, which can take months to deliver. Importantly, the REA method aligns with the requirements, time and resource available within this study.

REWIND OFFSHORE – Comparative Analysis of International Offshore Wind Energy Development, March 2017
144
Limitations to the study
Given the high number of case studies across different jurisdictions in tandem with limited time and resource we
recognise that seeking thematic saturation will be difficult. Theoretical saturation or thematic exhaustion is the point
at which each additional data response does not introduce new narratives or pertinently impact the data trend. Due
in part to diverse groups and low sample sizes in each group, the interview findings are unlikely to achieve thematic
exhaustion. As we identified this in advance we conducted the interviews with the aim of complementing and
challenging the findings of the secondary data collection.
In addition, because we applied a purposeful and targeted sampling approach (i.e. not random), it may not be
possible to generalise the findings to the entire population. Sampling bias is therefore a potential risk and should be
acknowledged. However, given the diligence applied within the approach to scope in key players within the
interviews, we consider the entailed generalisation to be valid.

REWIND OFFSHORE – Comparative Analysis of International Offshore Wind Energy Development, March 2017
145
M E M B E R CO UN T R I ES O F T H E I EA R E T D T EC H NO LO GY CO L L A B O R AT I O N PRO G R A M M E

The International Energy Agency’s Renewable Energy Technology Deployment Technology Collaboration
Programme (IEA RETD TCP) provides a platform for enhancing international cooperation on policies, measures and
market instruments to accelerate the global deployment of renewable energy technologies.
IEA RETD TCP aims to empower policy makers and energy market actors to make informed decisions by: (1) providing
innovative policy options; (2) disseminating best practices related to policy measures and market instruments to
increase deployment of renewable energy, and (3) increasing awareness of the short-, medium- and long-term
impacts of renewable energy action and inaction.
Current member countries of the IEA RETD Technology Collaboration Programme (TCP) are Canada, France,
Germany, Ireland, Japan, and Norway.
More information on the IEA RETD TCP can be found at
www.iea-retd.org


![[REWIND] - stosacucinecesanomaderno.files.wordpress.com€¦ · Rewind, that is, rewind the tape and go back to the essentials in the forms, elements and colours. The builtin handle](https://static.fdocuments.in/doc/165x107/5f0bc3e97e708231d4321b09/rewind-stos-rewind-that-is-rewind-the-tape-and-go-back-to-the-essentials-in.jpg)


