
OMA LwM2M Workshop - Friedhelm Rodermund, OMA LwM2M in the IoT Space
User’s GuideOMEGAMON Monitoring Agent®
for eBA® Solutions
Version 251
GC32-9291-00
September 2003
Candle Corporation100 North Sepulveda Blvd.
El Segundo, California 90245

2 OMA for eBA Solutions User’s Guide, Version 251
Registered trademarks and service marks of Candle Corporation: AF/OPERATOR, AF/PERFORMER, AF/REMOTE, Availability Command Center, Candle, Candle Command Center, Candle Direct logo, Candle Electronic Customer Support, Candle logo, Candle Management Server, Candle Management Workstation, CandleNet eBusiness Platform, CandleNet Portal, Candle Technologies, CL/CONFERENCE, CL/SUPERSESSION, CommandWatch, CandleNet Command Center, CT, CT/Data Server, CT/DS, DELTAMON, eBA, eBA*ServiceMonitor, eBA*ServiceNetwork, eBusiness Assurance, eBusiness Institute, ETEWatch, IntelliWatch, IntelliWatch Pinnacle, MQSecure, MQView, OMEGACENTER, OMEGAMON, OMEGAMON/e, OMEGAMON II, OMEGAMON Monitoring Agent, OMEGAVIEW, OMEGAVIEW II, PQEdit, Solutions for Networked Applications, Solutions for Networked Businesses, and Transplex.Trademarks and service marks of Candle Corporation: Alert Adapter, Alert Adapter Plus, Alert Emitter, AMS, Amsys, AutoBridge, AUTOMATED FACILITIES, Availability Management Systems, Candle Alert, Candle Business Partner Logo, Candle Command Center/SentinelManager, Candle CommandPro, Candle CIRCUIT, Candle eDelivery, CandleLight, CandleNet, CandleNet 2000, CandleNet eBP, CandleNet eBP Access, CandleNet eBP Administrator, CandleNet eBP Broker Access, CandleNet eBP Configuration, CandleNet eBP Connector, CandleNet eBP File Transfer, CandleNet eBP Host Connect, CandleNet eBP Object Access, CandleNet eBP Object Browser, CandleNet eBP Secure Access, CandleNet eBP Service Directory, CandleNet eBP Universal Connector, CandleNet eBP Workflow Access, CandleNet eBusiness Assurance, CandleNet eBusiness Exchange, CandleNet eBusiness Platform Administrator, CandleNet eBusiness Platform Connector, CandleNet eBusiness Platform Connectors, CandleNet eBusiness Platform Powered by Roma Technology, CandleNet eBusiness Platform Service Directory, CCC, CCP, CEBA, CECS, CICAT, CL/ENGINE, CL/GATEWAY, CL/TECHNOLOGY, CMS, CMW, Command & Control, Connect-Notes, Connect-Two, CSA ANALYZER, CT/ALS, CT/Application Logic Services, CT/DCS, CT/Distributed Computing Services, CT/Engine, CT/Implementation Services, CT/IX, CT/Workbench, CT/Workstation Server, CT/WS, !DB Logo, !DB/DASD, !DB/EXPLAIN, !DB/MIGRATOR, !DB/QUICKCHANGE, !DB/QUICKCOMPARE, !DB/SMU, !DB/Tools, !DB/WORKBENCH, Design Network, DEXAN, e2e, eBAA, eBAAuditor, eBAN, eBANetwork, eBAAPractice, eBP, eBusiness Assurance Network, eBusiness at the speed of light, eBusiness at the speed of light logo, eBusiness Exchange, eBusiness Institute, eBX, End-to-End, ENTERPRISE, Enterprise Candle Command Center, Enterprise Candle Management Workstation, Enterprise Reporter Plus, EPILOG, ER+, ERPNet, ESRA, ETEWatch Customizer, HostBridge, InterFlow, Candle InterFlow, Lava Console, MessageMate, Messaging Mastered, Millennium Management Blueprint, MMNA, MQADMIN, MQEdit, MQEXPERT, MQMON, NBX, NetGlue, NetGlue Extra, NetMirror, NetScheduler, OMA, OMC Gateway, OMC Status Manager, OMEGACENTER Bridge, OMEGACENTER Gateway, OMEGACENTER Status Manager, OMEGAMON Management Center, OSM, PC COMPANION, Performance Pac, PowerQ, PQConfiguration, PQScope, Response Time Network, Roma, Roma Application Manager, Roma Broker, Roma BSP, Roma Connector, Roma Developer, Roma FS/A, Roma FS/Access, RomaNet, Roma Network, Roma Object Access, Roma Secure, Roma WF/Access, Roma Workflow Access, RTA, RTN, SentinelManager, Somerset, Somerset Systems, Status Monitor, The Millennium Alliance, The Millennium Alliance logo, The Millennium Management Network Alliance, TMA2000, Tracer, Unified Directory Services, Volcano and ZCopy.Trademarks and registered trademarks of other companies: AIX, DB2, MQSeries and WebSphere are registered trademarks of International Business Machines Corporation. SAP is a registered trademark and R/3 is a trademark of SAP AG. UNIX is a registered trademark in the U.S. and other countries, licensed exclusively through X/Open Company Ltd. HP-UX is a trademark of Hewlett-Packard Company. SunOS is a trademark of Sun Microsystems, Inc. All other company and product names used herein are trademarks or registered trademarks of their respective companies.
Copyright © September 2003, Candle Corporation, a California corporation. All rights reserved. International rights secured.
Threaded Environment for AS/400, Patent No. 5,504,898; Data Server with Data Probes Employing Predicate Tests in Rule Statements (Event Driven Sampling), Patent No. 5,615,359; MVS/ESA Message Transport System Using the XCF Coupling Facility, Patent No. 5,754,856; Intelligent Remote Agent for Computer Performance Monitoring, Patent No. 5,781,703; Data Server with Event Driven Sampling, Patent No. 5,809,238; Threaded Environment for Computer Systems Without Native Threading Support, Patent No. 5,835,763; Object Procedure Messaging Facility, Patent No. 5,848,234; End-to-End Response Time Measurement for Computer Programs, Patent No. 5,991,705; Communications on a Network, Patent Pending; Improved Message Queuing Based Network Computing Architecture, Patent Pending; User Interface for System Management Applications, Patent Pending.
NOTICE: This documentation is provided with RESTRICTED RIGHTS. Use, duplication, or disclosure by the Government is subject to restrictions set forth in the applicable license agreement and/or the applicable government rights clause.This documentation contains confidential, proprietary information of Candle Corporation that is licensed for your internal use only. Any unauthorized use, duplication, or disclosure is unlawful.
3
Preface . . . . . . . . . . . . . . . . . . . . . . . . . . . . . . . . . . . . . . . . . . . . . . . . . . 7About This Book . . . . . . . . . . . . . . . . . . . . . . . . . . . . . . . . . . . . . . . . . 8Adobe Portable Document Format . . . . . . . . . . . . . . . . . . . . . . . . . . 10Documentation Conventions. . . . . . . . . . . . . . . . . . . . . . . . . . . . . . . 12Candle Customer Service and Satisfaction . . . . . . . . . . . . . . . . . . . . 14
What’s New in Version 251. . . . . . . . . . . . . . . . . . . . . . . . . . . . . . . . . . . . . . . . . . . 15
Chapter 1. Introducing OMA for eBA Solutions . . . . . . . . . . . . . . . . . . . . . 17About OMA for eBA Solutions. . . . . . . . . . . . . . . . . . . . . . . . . . . . . . 18What Are OMEGAMON XE and OMEGAMON DE? . . . . . . . . . . . . . 25What Is CandleNet Portal?. . . . . . . . . . . . . . . . . . . . . . . . . . . . . . . . . 27About OMEGAMON XE . . . . . . . . . . . . . . . . . . . . . . . . . . . . . . . . . . 29About OMEGAMON DE . . . . . . . . . . . . . . . . . . . . . . . . . . . . . . . . . . 32Using the CandleNet Portal Interface . . . . . . . . . . . . . . . . . . . . . . . . . 35Workspaces . . . . . . . . . . . . . . . . . . . . . . . . . . . . . . . . . . . . . . . . . . . . 37Attributes. . . . . . . . . . . . . . . . . . . . . . . . . . . . . . . . . . . . . . . . . . . . . . 38Situations . . . . . . . . . . . . . . . . . . . . . . . . . . . . . . . . . . . . . . . . . . . . . 40Take Action Commands . . . . . . . . . . . . . . . . . . . . . . . . . . . . . . . . . . 42Investigating an Event . . . . . . . . . . . . . . . . . . . . . . . . . . . . . . . . . . . 43Applications Supported . . . . . . . . . . . . . . . . . . . . . . . . . . . . . . . . . . . 45
Chapter 2. Configuring OMA for eBA Solutions. . . . . . . . . . . . . . . . . . . . . 47Prerequisites . . . . . . . . . . . . . . . . . . . . . . . . . . . . . . . . . . . . . . . . . . . 48Configuring the Manager Server for OMA Use . . . . . . . . . . . . . . . . . 55Usage Notes . . . . . . . . . . . . . . . . . . . . . . . . . . . . . . . . . . . . . . . . . . . 57
Chapter 3. Workspaces Accessed from CandleNet Portal . . . . . . . . . . . . . . 59Introducing OMA for eBA Solutions Workspaces . . . . . . . . . . . . . . . . 61OMA for eBA Solutions Workspaces . . . . . . . . . . . . . . . . . . . . . . . . . 65eBA Alerts by Application . . . . . . . . . . . . . . . . . . . . . . . . . . . . . . . . . 73
Contents
4 OMA for eBA Solutions User’s Guide, Version 251
eBA Alerts by Client Host . . . . . . . . . . . . . . . . . . . . . . . . . . . . . . . . . 76eBA Alerts by Transaction . . . . . . . . . . . . . . . . . . . . . . . . . . . . . . . . . 78eBA*SM Detail Summary by Server . . . . . . . . . . . . . . . . . . . . . . . . . 81eBA*SM Detail Summary by Transaction . . . . . . . . . . . . . . . . . . . . . 84eBA*SM Detail Summary by Web Server Type . . . . . . . . . . . . . . . . . 87eBA*SM Object by Client Host . . . . . . . . . . . . . . . . . . . . . . . . . . . . . 90eBA*SM Object by Object Name . . . . . . . . . . . . . . . . . . . . . . . . . . . 93eBA*SM Object by Server Host. . . . . . . . . . . . . . . . . . . . . . . . . . . . . 95eBA*SM Object by Web Server Name. . . . . . . . . . . . . . . . . . . . . . . . 99eBA*SM Object by Web Server Type . . . . . . . . . . . . . . . . . . . . . . . 103eBA*SM3 Audio Summary by Object . . . . . . . . . . . . . . . . . . . . . . . 107eBA*SM3 Object Summary by Web Site . . . . . . . . . . . . . . . . . . . . . 110eBA*SM3 Page Alert Summary by Web Site . . . . . . . . . . . . . . . . . . 113eBA*SM3 Page Summary by Web Site . . . . . . . . . . . . . . . . . . . . . . 116eBA*SM3 Video Summary by Object . . . . . . . . . . . . . . . . . . . . . . . 119ETEWatch Response by Application . . . . . . . . . . . . . . . . . . . . . . . . 122ETEWatch Response by Client Host . . . . . . . . . . . . . . . . . . . . . . . . 125ETEWatch Response by Transaction . . . . . . . . . . . . . . . . . . . . . . . . 128SitePulse (eBA SP) Consensus Script Alert Summary . . . . . . . . . . . 131SitePulse (eBA SP) Consensus URL Alert Summary . . . . . . . . . . . . 133SitePulse (eBA SP) Location Alert Summary. . . . . . . . . . . . . . . . . . 135SitePulse (eBA SP) Script Alert Summary . . . . . . . . . . . . . . . . . . . . 137SitePulse (eBA SP) Script Alert Summary by Location . . . . . . . . . . 139SitePulse (eBA SP) Script Availability Summary . . . . . . . . . . . . . . . 141SitePulse (eBA SP) Script Response Time Summary . . . . . . . . . . . . 143SitePulse (eBA SP) URL Alert Summary . . . . . . . . . . . . . . . . . . . . . 145SitePulse (eBA SP) URL Alert Summary by Location . . . . . . . . . . . 147SitePulse (eBA SP) URL Availability Summary . . . . . . . . . . . . . . . . 149SitePulse (eBA SP) URL Response Time Summary . . . . . . . . . . . . . 151
Chapter 4. Reports Accessed from CMW . . . . . . . . . . . . . . . . . . . . . . . . . 153Introducing Response Time Reports . . . . . . . . . . . . . . . . . . . . . . . . 154General Information about Reports . . . . . . . . . . . . . . . . . . . . . . . . . 156Response Time Detail Reports . . . . . . . . . . . . . . . . . . . . . . . . . . . . . 157Response Time Alerts Report . . . . . . . . . . . . . . . . . . . . . . . . . . . . . 159Response Time Application Summary Reports . . . . . . . . . . . . . . . . 161
5
Response Time Transaction Summary Reports . . . . . . . . . . . . . . . . 163
Chapter 5. Predefined Solutions. . . . . . . . . . . . . . . . . . . . . . . . . . . . . . . . 165Introducing Product-Provided Solutions . . . . . . . . . . . . . . . . . . . . . 166Product-provided Situations . . . . . . . . . . . . . . . . . . . . . . . . . . . . . . 169
Index . . . . . . . . . . . . . . . . . . . . . . . . . . . . . . . . . . . . . . . . . . . . . . . . 181

6 OMA for eBA Solutions User’s Guide, Version 251
Preface 7
Preface
IntroductionThis guide provides you with an understanding of how to use the OMEGAMON Monitoring Agent® for eBA® Solutions (OMA™ for eBA Solutions), Version 251, to monitor response time data and web site usage data obtained by these Candle products:
® CandleNet® ETEWatch®
® eBA*ServiceMonitor®
® eBA*ServiceMonitor®3
® SitePulse
This guide is designed to help you
® understand how OMA for eBA Solutions works with the front ends that are provided by CandleNet Portal® and by Candle Management Workstation® (CMW™)
® access specific information about events in your environment
® use the alerts data and the historical data that OMA for eBA Solutions provides as a management tool
P
About This Book
8 OMA for eBA Solutions User’s Guide, Version 251
About This Book
Who should read this bookThis guide is intended to be used by OMA for eBA Solutions administrators.
This manual assumes that you
® have installed CandleNet Portal
® have installed CandleNet Command Center® (CCC™)
® have installed OMA for eBA Solutions
® have installed and configured CandleNet ETEWatch, eBA*ServiceMonitor, and/or eBA*ServiceMonitor3 and that you are familiar with any of these products’ basic concepts. Refer to the appropriate documentation for details.
® have installed SitePulse, if you purchased this product, and that you are familiar with the product’s basic concepts. Refer to the product documentation for details.
Documentation set informationThis guide assumes that you are familiar with basic CandleNet Portal concepts, tasks, and features. If you are unfamiliar with CandleNet Portal concepts and tasks, please review the Using OMEGAMON Products: CandleNet Portal guide. You should also review the online CandleNet Portal Tour to become familiar with the product’s features and capabilities.
See the Installing Candle Systems on Windows for instructions on installing Candle products on Windows.
Where to look for more informationFor more information related to this product and other related products, please see the
® technical documentation CD-ROM that came with your product
® technical documentation information available on the Candle web site at www.candle.com
® online help provided with this and the other related products
Preface 9
About This Book
We would like to hear from youCandle welcomes your comments and suggestions for changes or additions to the documentation set. A user comment form, located at the back of each manual, provides simple instructions for communicating with the Candle Information Development department. You can also send email to [email protected]. Please include "OMA for eBA Solutions User’s Guide, Version 251" in the subject line.
Adobe Portable Document Format
10 OMA for eBA Solutions User’s Guide, Version 251
Adobe Portable Document Format
Printing this bookCandle supplies documentation in the Adobe Portable Document Format (PDF). The Adobe Acrobat Reader will print PDF documents with the fonts, formatting, and graphics in the original document. To print a Candle document, do the following:
1. Specify the print options for your system. From the Acrobat Reader Menu bar, select File > Page Setup… and make your selections. A setting of 300 dpi is highly recommended as is duplex printing if your printer supports this option.
2. To start printing, select File > Print... on the Acrobat Reader Menu bar.
3. On the Print pop-up, select one of the Print Range options for® All® Current page® Pages from: [ ] to: [ ]
4. (Optional). Select the Shrink to Fit option if you need to fit oversize pages to the paper size currently loaded on your printer.
Printing problems?The print quality of your output is ultimately determined by your printer. Sometimes printing problems can occur. If you experience printing problems, potential areas to check are:® settings for your printer and printer driver. (The dpi settings for both your
driver and printer should be the same. A setting of 300 dpi is recommended.)
® the printer driver you are using. (You may need a different printer driver or the Universal Printer driver from Adobe. This free printer driver is available at www.adobe.com.)
® the halftone/graphics color adjustment for printing color on black and white printers (check the printer properties under Start > Settings > Printer). For more information, see the online help for the Acrobat Reader.
® the amount of available memory in your printer. (Insufficient memory can cause a document or graphics to fail to print.)
For additional information on printing problems, refer to the documentation for your printer or contact your printer manufacturer.
Preface 11
Adobe Portable Document Format
Contacting AdobeIf additional information is needed about Adobe Acrobat Reader or printing problems, see the Readme.pdf file that ships with Adobe Acrobat Reader or contact Adobe at www.adobe.com.
Adding annotations to PDF filesIf you have purchased the Adobe Acrobat application, you can add annotations to Candle documentation in .PDF format. See the Adobe product for instructions on using the Acrobat annotations tool and its features.
Documentation Conventions
12 OMA for eBA Solutions User’s Guide, Version 251
Documentation Conventions
IntroductionCandle documentation adheres to accepted typographical conventions for command syntax. Conventions specific to Candle documentation are discussed in the following sections.
Panels and figuresThe panels and figures in this document are representations. Actual product panels may differ.
Required blanksThe slashed-b (b) character in examples represents a required blank. The following example illustrates the location of two required blanks.
beBA*ServiceMonitorb0990221161551000
Revision barsRevision bars (|) may appear in the left margin to identify new or updated material.
Variables and literalsIn examples of command syntax, uppercase letters are actual values (literals) that the user should type; lowercase letters are used for variables that represent data supplied by the user. Default values are underscored.
LOGON APPLID (cccccccc)
In the above example, you type LOGON APPLID followed by an application identifier (represented by cccccccc) within parentheses.
Note: In ordinary text, variable names appear in italics.
Preface 13
Documentation Conventions
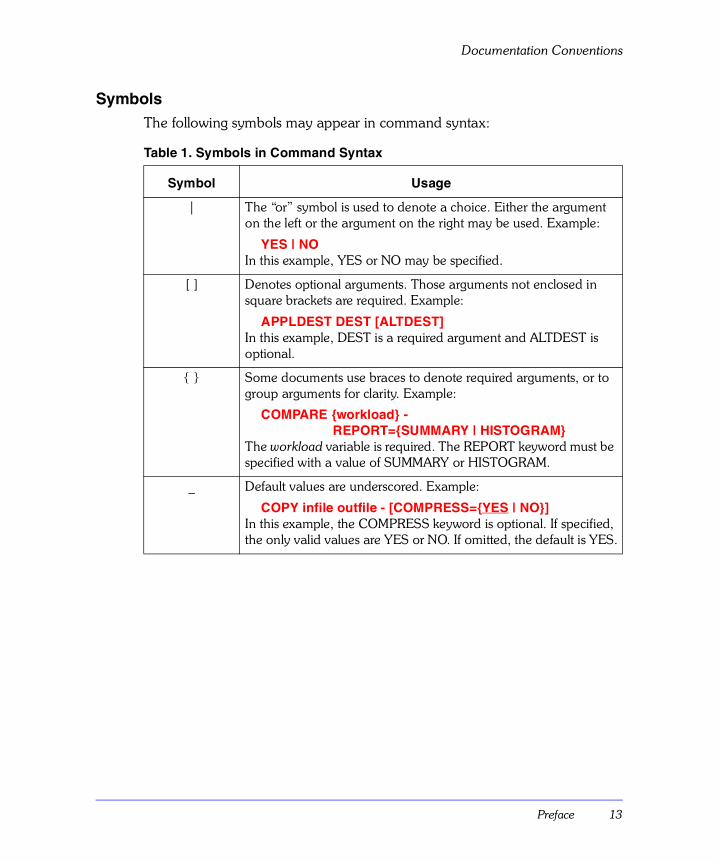
SymbolsThe following symbols may appear in command syntax:
Table 1. Symbols in Command Syntax
Symbol Usage
| The “or” symbol is used to denote a choice. Either the argument on the left or the argument on the right may be used. Example:
YES | NOIn this example, YES or NO may be specified.
[ ] Denotes optional arguments. Those arguments not enclosed in square brackets are required. Example:
APPLDEST DEST [ALTDEST]In this example, DEST is a required argument and ALTDEST is optional.
{ } Some documents use braces to denote required arguments, or to group arguments for clarity. Example:
COMPARE {workload} -REPORT={SUMMARY | HISTOGRAM}
The workload variable is required. The REPORT keyword must be specified with a value of SUMMARY or HISTOGRAM.
_ Default values are underscored. Example:
COPY infile outfile - [COMPRESS={YES | NO}]In this example, the COMPRESS keyword is optional. If specified, the only valid values are YES or NO. If omitted, the default is YES.
Candle Customer Service and Satisfaction
14 OMA for eBA Solutions User’s Guide, Version 251
Candle Customer Service and Satisfaction
BackgroundTo assist you in making effective use of our products, Candle offers a variety of easy-to-use online support resources. The Candle Web site provides direct links to a variety of support tools that include a range of services. For example, you can find information about training, maintenance plans, consulting and services, and other useful support resources. Refer to the Candle Web site at www.candle.com for detailed customer service information.
Candle Customer Service and Satisfaction contactsYou will find the most current information about how to contact Candle Customer Service and Satisfaction by telephone or e-mail on the Candle Web site. Go to www.candle.com support section and choose the link to Support Contacts to locate your regional support center.
What’s New in Version 251 15
What’s New in Version 251
IntroductionThis section details the new features incorporated into the Version 251 release of the OMA for eBA Solutions.
HighlightsThe version 251 features include:
® new workspaces for the OMA user interface in CandleNet Portal to support these Candle products:
– ETEWatch
– eBA*ServiceMonitor
– eBA*ServiceMonitor3
– SitePulse
These new workspaces provide such data as:
– summarized detail data across more flexible intervals and across client hosts, making the data more useful for large installations
– alert data, summarized by client host, by transaction, and by application
– Web object data, summarized by object name, by client host, by server host, by Web server name, and by Web server type
– video and audio object data, summarized by object name
See “Workspaces Accessed from CandleNet Portal” on page 59.
W
16 OMA for eBA Solutions User’s Guide, Version 251
® new attributes that allow you to create situations that fire only when a certain number of alerts are generated, by application, by transaction, or by client host over any interval. The situations can be configured separately for each application or raise just one situation when any application reaches the threshold.
See the CandleNet Portal online Help for OMA for eBA Solutions for information on all of the attributes provided for the OMA.
® new product-provided situations that apply to supported products. The new situations are:
– ETE_Client_Response_Critical
– eBA_App_Response_Critical
– eBA_Server_Response_Warning
– eBA_SM3_Page_Response_Critical
– eBA_SM3_Page_Response_Warning
– eBA_SM3_Server_Response_Critical
– eBA_SM3_Server_Response_Warning
– eBA_SP_Response_Critical
– eBA_SP_Response_Warning
– eBA_SP_URL_Unavailable
– eBA_SP_Location_Unavailable
See “Product-provided Situations” on page 169 for details.
Introducing OMA for eBA Solutions 17
IntroducingOMA for eBA Solutions
IntroductionThis chapter introduces OMA for eBA Solutions, its facilities, and the environment in which it operates.
Chapter ContentsAbout OMA for eBA Solutions . . . . . . . . . . . . . . . . . . . . . . . . . . . . . . . . . 18What Are OMEGAMON XE and OMEGAMON DE? . . . . . . . . . . . . . . . . 25What Is CandleNet Portal? . . . . . . . . . . . . . . . . . . . . . . . . . . . . . . . . . . . . 27About OMEGAMON XE. . . . . . . . . . . . . . . . . . . . . . . . . . . . . . . . . . . . . . 29About OMEGAMON DE. . . . . . . . . . . . . . . . . . . . . . . . . . . . . . . . . . . . . . 32Using the CandleNet Portal Interface . . . . . . . . . . . . . . . . . . . . . . . . . . . . 35Workspaces . . . . . . . . . . . . . . . . . . . . . . . . . . . . . . . . . . . . . . . . . . . . . . . 37Attributes . . . . . . . . . . . . . . . . . . . . . . . . . . . . . . . . . . . . . . . . . . . . . . . . . 38Situations . . . . . . . . . . . . . . . . . . . . . . . . . . . . . . . . . . . . . . . . . . . . . . . . . 40Take Action Commands . . . . . . . . . . . . . . . . . . . . . . . . . . . . . . . . . . . . . . 42Investigating an Event. . . . . . . . . . . . . . . . . . . . . . . . . . . . . . . . . . . . . . . . 43Applications Supported . . . . . . . . . . . . . . . . . . . . . . . . . . . . . . . . . . . . . . 45
1
About OMA for eBA Solutions
18 OMA for eBA Solutions User’s Guide, Version 251
About OMA for eBA Solutions
Features of OMA for eBA SolutionsWhen you install the OMA for eBA Solutions product, you receive a collection of predefined workspaces and reports. The workspaces display in the CandleNet Portal interface. The reports display in the CMW interface.
The workspaces and reports provided by OMA for eBA Solutions are useful for examining trends in response times for business applications and Web browsers. Suppose you have noticed the response time on a particular day is not as good as you would like. For example, say response time on Friday evening is not good. You can use the workspaces and/or the reports to further examine this trend. You can compare this Friday night’s response time with last Friday night’s response time or with the response time on Friday night of one year ago.
You can also use the eBA*ServiceMonitor (EBA SM) workspaces to understand users’ experience of navigating your Web site. You can find out data such as the average response time of each transaction monitored during the specified interval for a particular Web server. You can also find out the number of times each transaction was invoked. This information tells you whether your site is providing efficient service for your customers. Armed with this time and usage information, you can improve your site by making it more responsive and easier to use, thereby improving customer loyalty and retention.
How OMA for eBA Solutions worksOMA for eBA Solutions performs two types of monitoring functions. It
® obtains data from a database and uses the data to create response time and Web site usage reports and workspaces whenever you choose. These reports and workspaces are useful for examining trends in the application or the Web browser being monitored.
® detects response time alerts as they are received and makes them available to your CandleNet Portal and to your CMW.
Introducing OMA for eBA Solutions 19
About OMA for eBA Solutions
Monitoring for alerts requires you to create situations to detect response time exceptions that are meaningful to the transactions you are monitoring. You first specify the filtering criteria on the Exception and Average page of the Manager Client settings notebook so that meaningful alert data is sent to the Manager Server. Sample situations that you can use for your own environment are provided to make this task as easy as possible. See “Predefined Solutions” on page 165.
Note: Keep in mind that whatever criteria you define for your situations must match the filtering criteria set in the Exception and Average page of the Manager Client settings notebook.
Additionally, OMA for eBA Solutions obtains its data from these products:
® CandleNet ETEWatch. See “What is ETEWatch?” on page 22.
® eBA*ServiceMonitor. See “What is eBA*ServiceMonitor?” on page 23.
® eBA*ServiceMonitor3. See “What is eBA*ServiceMonitor3?” on page 24.
® SitePulse. “What is SitePulse?” on page 24.
See the documentation for these products for complete details.
User interface to OMA for eBA SolutionsOMA for eBA Solutions uses the CandleNet Portal® interface. By providing a consolidated view of your environment, CandleNet Portal permits you to monitor and resolve performance issues throughout the enterprise. The special characteristics of this user interface include
About OMA for eBA Solutions
20 OMA for eBA Solutions User’s Guide, Version 251
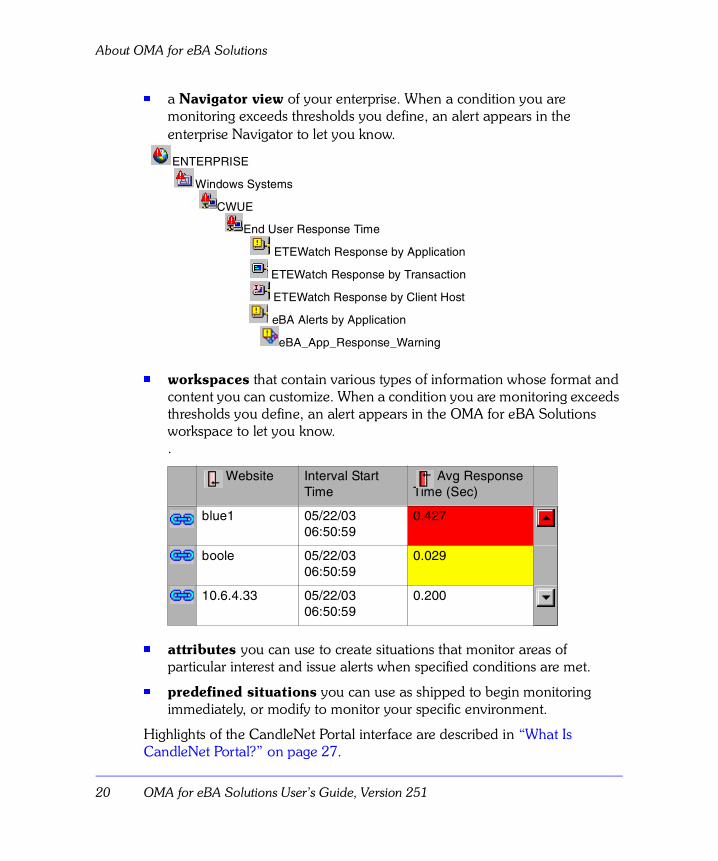
® a Navigator view of your enterprise. When a condition you are monitoring exceeds thresholds you define, an alert appears in the enterprise Navigator to let you know.
® workspaces that contain various types of information whose format and content you can customize. When a condition you are monitoring exceeds thresholds you define, an alert appears in the OMA for eBA Solutions workspace to let you know. .
® attributes you can use to create situations that monitor areas of particular interest and issue alerts when specified conditions are met.
® predefined situations you can use as shipped to begin monitoring immediately, or modify to monitor your specific environment.
Highlights of the CandleNet Portal interface are described in “What Is CandleNet Portal?” on page 27.
ENTERPRISE
Windows Systems
CWUE
End User Response Time
ETEWatch Response by Application
ETEWatch Response by Transaction
ETEWatch Response by Client Host
eBA Alerts by Application
eBA_App_Response_Warning
Website Interval Start Time
Avg Response Time (Sec)
blue1 05/22/03 06:50:59
0.427
boole 05/22/03 06:50:59
0.029
10.6.4.33 05/22/03 06:50:59
0.200
Introducing OMA for eBA Solutions 21
About OMA for eBA Solutions
Historical Data CollectionIn addition to the real-time reports offered by CandleNet Portal workspaces, you can set up historical data collection to store and save the data being collected by your monitoring agents. You can specify
® attribute groups for historical data collection
® data collection intervals
® data warehousing interval (if you choose to write your data to a data warehouse)
® storage location for the collected data. Historical data can be stored either at the location of the monitoring agent or on the Candle Management Server (CMS).
To ensure that data samplings are saved to populate your predefined historical workspaces, you must first configure and start historical data collection. This requirement does not apply to workspaces using attributes groups that are historical in nature and show all their entries without your starting data collection separately.
See “Configuring Historical Data Collection” on page 71. See also the Historical Data Collection Guide for OMEGAMON XE and CandleNet Command Center document.
Benefits of using OMA for eBA SolutionsOMA for eBA Solutions provide these benefits.
® Increases knowledge—with extensive reporting capabilities that provide real-time access to reliable, up-to-the-minute data. Thus, you can make faster, better-informed operating decisions.
® Enhances system performance—by letting you integrate, monitor, and manage your system, environment, console, and mission-critical applications. For example, OMA for eBA Solutions can alert you when conditions in your environment meet or exceed the thresholds you set. These alerts notify your system administrator to limit and control system traffic.
® Simplifies application and system management—by managing applications, platforms, and resources across your system.
About OMA for eBA Solutions
22 OMA for eBA Solutions User’s Guide, Version 251
OMA for eBA Solutions operating environmentOMA for eBA Solutions can help you address the increasing challenges presented by today’s technical environment. The environment in which OMA for eBA Solutions operates includes
® the OMEGAMON® XE product set. See “What Are OMEGAMON XE and OMEGAMON DE?” on page 25.
® OMEGAMON DE. See “What Are OMEGAMON XE and OMEGAMON DE?” on page 25.
® the CandleNet Portal user interface. See “What Is CandleNet Portal?” on page 27.
What is ETEWatch?ETEWatch is a Candle product that measures, analyzes, consolidates, and reports on the end-to-end response time of business application transactions. You can also use it to measure Web site usage.
Additionally, for non-Web browser applications, response time measurements for each transaction are segmented into Client Time, Network Time, and back-end Application Time. Segmentation data displays in the CandleNet Portal interface.
ETEWatch consists of these components:
® Collector installed on each user's workstation measures the amount of time the user waits while the application completes a requested transaction. The response time information for each transaction is recorded in a log file.
® Manager Client retrieves the detail data logged at the client workstation and sends the detailed, summarized, and filtered data to Manager Server at preset intervals.
® Manager Server receives data from Manager Clients and from other Manager Servers, and then consolidates the data for use by the Reporter and other reporting tools (for example, Microsoft Excel).
Introducing OMA for eBA Solutions 23
About OMA for eBA Solutions
® eBA Reporter provides a graphical interface to the many Seagate Crystal report templates provided with ETEWatch. Using these templates, you can view and print reports on business application performance and Web site usage.
Note: You cannot use the eBA Reporter to create your own report templates. For that purpose, you must have a Seagate Crystal Reports CD.
® Reporter analyzes the consolidated data and generates service-level reports. It can also analyze local data logged on each desktop.
For more about ETEWatch, see the CandleNet ETEWatch User’s Guide.
What is eBA*ServiceMonitor?eBA*ServiceMonitor is a Candle product that measures, analyzes, consolidates, and reports on the experience of visitors to your Web site. This server-based product:
® collects the actual response time for Web page downloads measured from the browser
® records the amount of time the user spends on each page
® anonymously tracks the user’s navigation path through the site
® requires no installation of product components on client workstations
eBA*ServiceMonitor has four components:
® eCollector is the response time monitoring agent.
® Manager Client sends detailed, summarized, and filtered data to Manager Server at specified intervals.
® Manager Server consolidates the data from one or more Manager Clients for use by the Enterprise Reporter and by other reporting tools.
® Enterprise Reporter analyzes the consolidated data and generates reports.
Note: The reports generated by the OMA and introduced in this guide differ from the reports generated by the Enterprise Reporter. Both types of reports can be used to analyze response time data collected and stored by the Manager Server.
About OMA for eBA Solutions
24 OMA for eBA Solutions User’s Guide, Version 251
What is eBA*ServiceMonitor3?eBA*ServiceMonitor3 is a Candle product that uses non-invasive technology to measure the performance of Web-based applications. It provides response time and other performance data, and tracks navigation paths and usage behavior for
® Web pages
® Web objects
® audio streams
® video streams
Its performance metrics help you determine the quality of service of your Web-based applications, as actually experienced by your customers and other requestors. Those requestors can be
® human end users visiting Web sites
® machines performing application-to-application or business-to-business processes
What is SitePulse?SitePulse is a Candle Corporation product that issues alerts and reports on the availability and performance of your Web sites. To determine the health of your Web-based applications, SitePulse emulates simple queries or complex sequences of Web transactions, using protocols representative of online user activity initiated at several locations. In real time, SitePulse analyzes response time data and other performance statistics, isolates fault domains and performance bottlenecks, and sends e-mail notification of any problems discovered. Problem alerts can be sent to desktop and/or mobile e-mail addresses.
Reports sent to the desktop e-mail address cover reliability, availability, and serviceability (RAS), as well as response time, to provide you with critical information for solving specific availability problems and generally improving your online business processes.
Introducing OMA for eBA Solutions 25
What Are OMEGAMON XE and OMEGAMON DE?
What Are OMEGAMON XE and OMEGAMON DE?
What OMEGAMON XE doesOMEGAMON XE is a suite of Candle® products that monitor and manage system and network applications on a variety of platforms. These products keep track of the availability and performance of all parts of your enterprise from one or more designated workstations, and provide reports you can use to track trends and troubleshoot problems.
How you can use OMEGAMON XEYou can use OMEGAMON XE to
® create situations (conditions to test when monitoring)
® establish performance thresholds, and raise alerts when thresholds are exceeded or values are matched
® trace the causes leading up to an alert
® create and send commands to systems in your managed enterprise by means of the Take Action feature
® create comprehensive reports about system conditions
® define your own queries, using the attributes provided by OMA for eBA Solutions, to monitor conditions of particular interest to you.
Components of the OMEGAMON XE platformThe client/server/agent implementation includes
® a client, CandleNet Portal, with a Java-based user interface for viewing and monitoring your enterprise. CandleNet Portal offers two modes of operation: desktop and browser.
® a CandleNet Portal server that retrieves, manipulates, and analyzes data from the Candle agents in your enterprise
® a CMS, which acts as a collection and control point for alerts received from the agents, and collects their performance and availability data
What Are OMEGAMON XE and OMEGAMON DE?
26 OMA for eBA Solutions User’s Guide, Version 251
® Candle monitoring agents installed on the systems or subsystems you want to monitor. These agents collect and distribute data to a CMS. OMA for eBA Solutions is such an agent.
What OMEGAMON DE doesOMEGAMON DE offers a dashboard view of your enterprise. It gives you a single point of control for managing the resources your business-critical applications rely on, including a range of operating systems, servers, databases, mainframes, and Web components. For example, a typical IT network might have a Web server running on Windows NT, an application server running on UNIX, a database on OS/390, and a transaction processor on CICS on the mainframe. OMEGAMON DE brings all these views together in a single window, so you can see when any component is not working as expected.
Introducing OMA for eBA Solutions 27
What Is CandleNet Portal?
What Is CandleNet Portal?
What CandleNet Portal doesCandleNet Portal is the interface into your OMEGAMON XE products. In the same way you use your browser home page as a starting point for navigating the Internet, you use CandleNet Portal to get a high-level overview of your network environment. One section of the window displays the Navigator, a tree-like view of your monitored network, with alert icons that appear when problems arise. The rest of the window is filled with views pertinent to the chosen item in the Navigator tree. From the top level or from your home workspace, you can navigate to specific locations to check activity and investigate problems.
Modes of operationCandleNet Portal offers two modes of operation:
® desktop mode, in which the CandleNet Portal client is installed on your workstation and runs as a desktop application.
® browser mode, in which the system administrator installs the CandleNet Portal client on the Web server, and you start CandleNet Portal from your browser. In browser mode, thin client software is downloaded to your system the first time you log on to CandleNet Portal, and thereafter only when there are software updates.
When using CandleNet Portal in browser mode, you can start it from any workstation by entering the URL for the Web server where the browser mode client is installed. Each CandleNet Portal workspace also has a URL, so that you can save the workspace to your Favorites list or specify it as your home page.
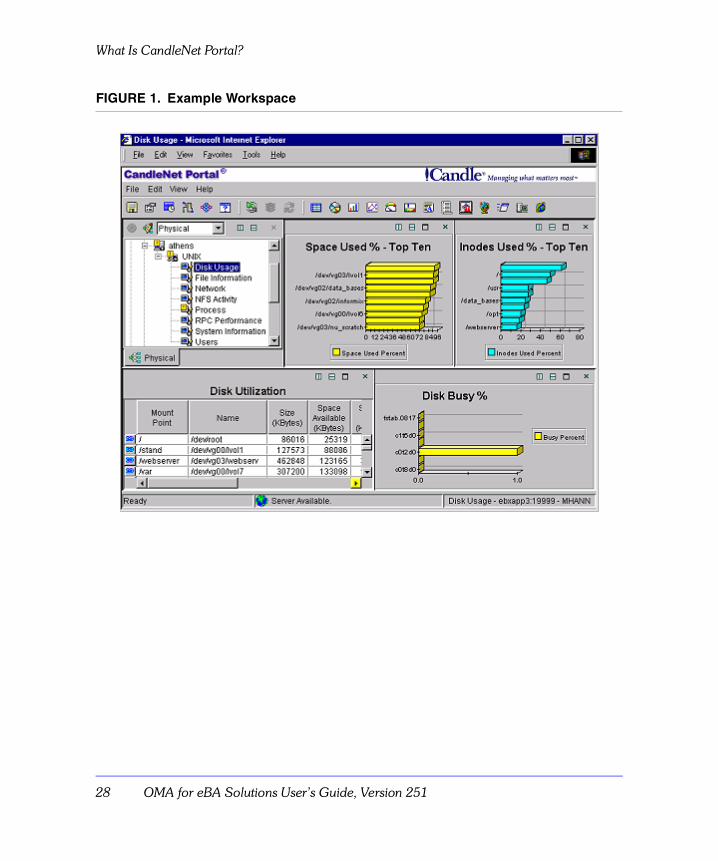
Figure 1 on page 28 shows a workspace for the item chosen in the tree. This workspace was designed with bar charts and a table containing critical, warning, and informational thresholds.
What Is CandleNet Portal?
28 OMA for eBA Solutions User’s Guide, Version 251
FIGURE 1. Example Workspace
Introducing OMA for eBA Solutions 29
About OMEGAMON XE
About OMEGAMON XE
Features of OMEGAMON XEThe features listed below are available with CandleNet Portal V195 interface for OMEGAMON XE.
Customized workspaces for each information group
CandleNet Portal retrieves monitoring data at regular intervals and sends the results to the workspace in the form of charts and tables. You can start monitoring activity and system status immediately with the predefined workspaces. With just a few clicks of the mouse, you can tailor your own workspaces to look at specific conditions, display critical threshold values in red, and filter incoming data so you see only what matters.
Workspace views
CandleNet Portal offers a set of views you can use to build and customize workspaces: ® Table views display data the Candle monitoring agents
have gathered. You can also display data from ODBC databases.
® Chart views—pie, bar, plot, gauge—also display data from Candle monitoring agents.
® Notepad view opens a simple text editor for writing text that can be saved with the workspace.
® Message log view shows the status of the situations running on your managed network.
® Take Action view lets you enter a command or select a predefined command, and execute it on any system in your managed network.
® Terminal view starts a 3270 or 5250 session for working with OS/390 or OS/400 applications.
® Browser view opens the integrated browser.
Linked workspaces
If you often go from one workspace to another, you can build a link between them to speed the transition. You can also build links that originate from a table or from a bar or pie chart, and use relevant data from the source link to determine the link target.
About OMEGAMON XE
30 OMA for eBA Solutions User’s Guide, Version 251
User-defined queries
Every Candle monitoring agent comes with a set of predefined queries for every attribute group. These queries tell the CMS what monitoring data to retrieve from the agent to display in a chart or table view. You can create your own queries to specify exactly which attributes to retrieve for the table or chart, thus saving valuable resources by retrieving only the data you want and nothing more. For example, you can build a filter into the query to retrieve only those records whose file size is greater than 5 megabytes.
Additionally, you can write SQL queries to ODBC data sources and apply the results to any chart or table. This enables you to show Candle data and data from other sources (such as third-party databases) in a single workspace.
User administration
CandleNet Portal provides the user administration feature for adding new user IDs, complete with selectable permissions for the major features and specific managed systems.
Managed System lists
You can create and maintain named lists of managed systems that can be applied to:® situation distribution lists® policies correlated by business application group® managed system assignments for queries® managed system assignments in custom Navigator views
Historical data You can configure CandleNet Portal to retain data samplings in history files and, if you have data warehousing set up, roll off to a historical database. Using chart and table views, you can then look over what happened hours, days, or weeks past to find a pattern, or you can filter out unwanted data to see specific areas of interest.
Interaction with systems from your console
The Take Action feature lets you enter a command or select a predefined command, and execute it on any system in your managed network.
Conditional alerts with the Situation editor
You can write comparisons with threshold values that CandleNet Portal tests against monitored data. When it finds a matching value (or one within a range), it displays an indicator to alert you.
Introducing OMA for eBA Solutions 31
About OMEGAMON XE
Sound for open events (optional)
Sound files (.wav) can be associated with situation states. For example, when any warning situation becomes true, an associated sound file plays when the event indicator appears on the Navigator item. The options for setting up sound enable you to specify one sound for one situation or one sound for all situations of the same state or all situations of the same Candle agent type. This feature is turned off by default.
About OMEGAMON DE
32 OMA for eBA Solutions User’s Guide, Version 251
About OMEGAMON DE
Features of OMEGAMON DEOMEGAMON DE V195 provides all the features of CandleNet Portal included with OMEGAMON XE, plus these application integration components.
Multiple applications in one workspace
In one workspace you can build a table or chart with data from one type of monitoring agent, and another table or chart with data from a different agent, showing views from as many different agent types as are included on that branch of the Navigator.
Linking between application workspaces
You can define a link from a workspace associated with one application to the workspace of another.
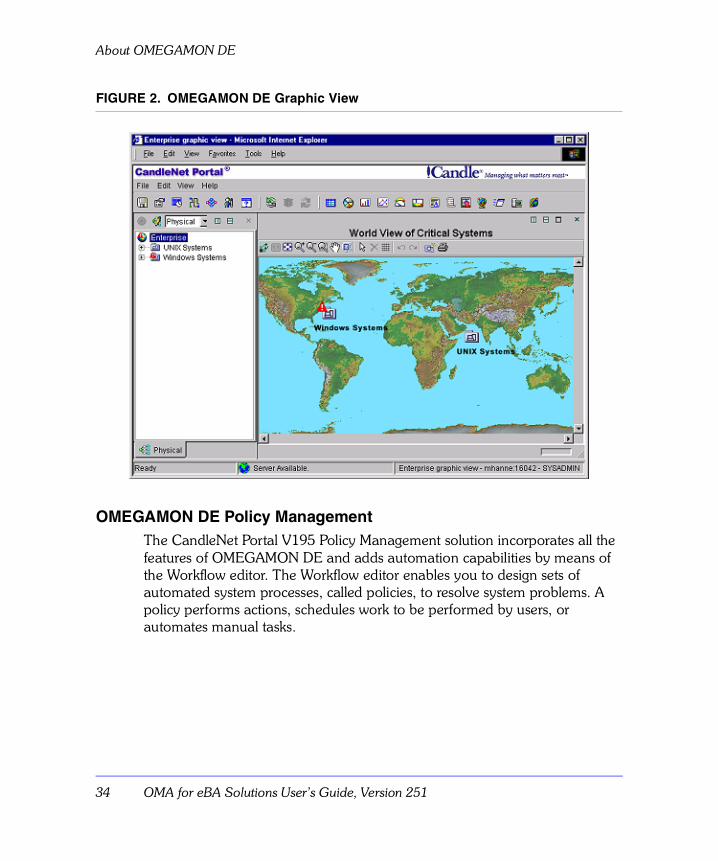
Graphic view The graphic view lets you place icons of Navigator items on a map or other background graphic, giving you a visual orientation for quick detection of problems anywhere in your monitored enterprise. You can zoom in and you can add such graphics as floor plans and organization charts. Figure 2 on page 34 illustrates a graphic view.
Custom Navigator views
CandleNet Portal comes with the Navigator physical view, which organizes your managed enterprise by operating platform and agent type, and the Navigator business view, which initially shows one Navigator item or, if you have a Candle Management Workstation® (CMW™) installation, a hierarchy of your managed objects. You can also define Navigator views for any logical hierarchy, such as a departmental or site hierarchy.
Introducing OMA for eBA Solutions 33
About OMEGAMON DE
Event Console view
In a single console, you can see the entire list of alerts that have occurred over a certain period. The Event Console view lists each alert, including such information as the age of the alert, where and when it occurred, and the situation name. The console has a toolbar for filtering the view to show only the alerts you want to see and a pop-up menu for managing alerts.
Additionally, the data view manipulation enhancements listed under “What Are OMEGAMON XE and OMEGAMON DE?” on page 25, also apply to the Event Console view: page size control, maintaining column width settings, and so on.
Universal Agent support
Candle's OMEGAMON Universal Agent is an agent you can configure to monitor any data you collect. It lets you integrate data from virtually any platform and any source, such as custom applications, databases, systems, and subsystems. Your defined data providers are listed in the Navigator, and default workspaces are automatically created for them. As with any other Candle monitoring agent, you can display data from your Universal Agent’s attributes in workspace views and use them in situations for monitoring.
Activities based on OMEGAMON Web Services
Activities such as Get a Candle Report and Execute an AF/Operator Command are available in the Workflow editor. These activities apply to the OMEGAMON Web Services product.
About OMEGAMON DE
34 OMA for eBA Solutions User’s Guide, Version 251
FIGURE 2. OMEGAMON DE Graphic View
OMEGAMON DE Policy ManagementThe CandleNet Portal V195 Policy Management solution incorporates all the features of OMEGAMON DE and adds automation capabilities by means of the Workflow editor. The Workflow editor enables you to design sets of automated system processes, called policies, to resolve system problems. A policy performs actions, schedules work to be performed by users, or automates manual tasks.
Introducing OMA for eBA Solutions 35
Using the CandleNet Portal Interface
Using the CandleNet Portal Interface
Where to find the detailsThis unit provides a high-level summary of CandleNet Portal’s operation. You can find detailed instructions for using CandleNet Portal in
® the CandleNet Portal online Help
® Using OMEGAMON Products: CandleNet Portal
® Administering OMEGAMON Products: CandleNet Portal
® Historical Data Collection Guide for OMEGAMON XE and CandleNet Command Center
Application window
The CandleNet Portal application window displays information about your enterprise. On the left is the Navigator, which shows the arrangement of your monitored network and any alerts associated with systems and applications on the network. On the right is a workspace. As you select each item in the Navigator, the workspace changes to show views for that item.
Using the CandleNet Portal Interface
36 OMA for eBA Solutions User’s Guide, Version 251
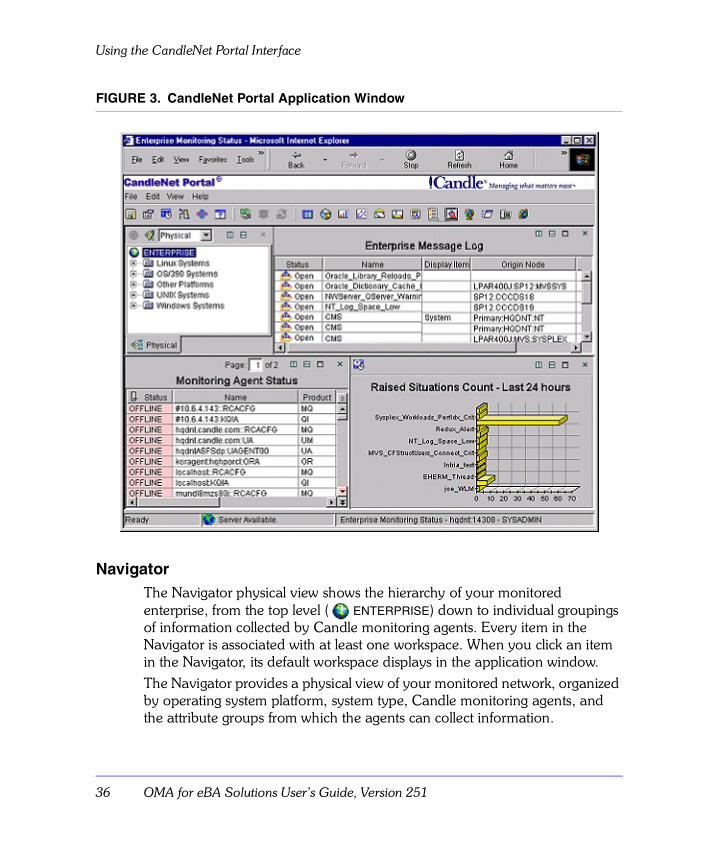
FIGURE 3. CandleNet Portal Application Window
NavigatorThe Navigator physical view shows the hierarchy of your monitored enterprise, from the top level ( ENTERPRISE) down to individual groupings of information collected by Candle monitoring agents. Every item in the Navigator is associated with at least one workspace. When you click an item in the Navigator, its default workspace displays in the application window.The Navigator provides a physical view of your monitored network, organized by operating system platform, system type, Candle monitoring agents, and the attribute groups from which the agents can collect information.
Introducing OMA for eBA Solutions 37
Workspaces
Workspaces
What is a workspace?CandleNet Portal displays information in workspaces. A workspace is the working area of the CandleNet Portal application window and is made up of one or more views. A view is a pane in the workspace, typically a chart or table showing data collected from a Candle monitoring agent, such as the process detail running on the UNIX operating system.
A workspace may be linked to other workspaces. A link may be context-sensitive, whereby you right-click a row in a table or a data series in a chart to link to more detailed information about one of the attributes in the row or data series.
As you select items in the Navigator, the workspace presents views pertinent to your selection. Every workspace has at least one view, and every workspace has a set of properties associated with it. You can customize the workspace by working in the Properties editor to change the style and content of each view. Another way to customize the workspace is to change the type of view or to add views to the workspace.
Predefined workspacesOMA for eBA Solutions is shipped with predefined workspaces that you can use as shipped or modify by using the Properties editor. Predefined workspaces make it easy for you to quickly start using OMA for eBA Solutions effectively to monitor your environment.
Workspaces, views, and attributesEach table view corresponds to an attribute group and each column of the table corresponds to an individual attribute from the group. Each workspace displays real-time information for many of the attributes. The information is available to you whether or not you are monitoring situations. For more information about attributes, see “Attributes” on page 38.
Attributes
38 OMA for eBA Solutions User’s Guide, Version 251
Attributes
What are attributes?OMA for eBA Solutions gathers data on the managed systems of your network and stores the data as system elements called attributes. You can use these attributes to
® build situations to monitor the performance of the managed systems you are concerned with
® create queries and use the resulting data to build custom views
Related attributes are grouped into attribute groups, or attribute tables. A given table view contains information provided by a single attribute group.
Using attributesTo use attributes effectively, you must first understand their structure.
® An attribute group associates attributes that refer to some unique characteristic of the data being stored.
® An attribute item stores data for a single property of an attribute group.
® The name of each attribute is composed of the attribute’s group name, then a period, then the name of the attribute item.
For example, in the attribute
ADDRESS_SPACE_CPU_UTILIZATION.CPU_Percent
CPU_percent is an attribute item that stores a value representing the percentage of CPU utilized by an address space over the current interval. Attribute item CPU_Percent is a member of the ADDRESS_SPACE_CPU_UTILIZATION group.
Introducing OMA for eBA Solutions 39
Attributes
Using attributes in situationsYou use attributes to create situations that monitor the state of your operating system, database, or application. A situation describes a condition you want to test. When you start a situation, CandleNet Portal compares the values you have assigned for the situation’s attributes with the values collected by OMA for eBA Solutions and registers an event if the condition is met. You are alerted to events by indicator icons that appear in the Navigator.
Using attributes in queriesChart and table views use queries to specify which attribute values to request from a Candle monitoring agent. You can use the Query editor to create a new query, modify an existing one, or apply filters and set styles to define the content and appearance of a view based on an existing query.
For more information on attributesFor complete descriptions of the attributes for OMA for eBA Solutions, refer to the OMA for eBA Solutions online Help.
Situations
40 OMA for eBA Solutions User’s Guide, Version 251
Situations
What is a situation?A situation is a logical expression involving one or more system conditions. Situations are used to monitor the condition of systems in your network. You can manage situations from CandleNet Portal by using the Situation editor.
What is a predefined situation?OMA for eBA Solutions is shipped with a set of predefined situations that you can use as-is or modify to meet your requirements.
Predefined situations are precoded to check for system conditions common to many enterprises. Using predefined situations can improve the speed with which you can begin using OMA for eBA Solutions. You can examine and, if necessary, change the conditions or values being monitored by a predefined situation to those best suited to your enterprise.
Note: Candle suggests that if you choose to modify a predefined situation, you first use CandleNet Portal’s Create another situation function to make a copy of the original situation. This ensures that you can fall back if necessary.
Using situations You manage situations from CandleNet Portal using the Situation editor. Using the Situation editor, you can
® create, edit, or delete a situation
® create another situation identical to the first
® display a situation
® associate a situation with the current Navigator item
® start and stop a situation
® open the event workspace for a situation to investigate the condition that caused the event
Introducing OMA for eBA Solutions 41
Situations
For detailed information about situations, see Using OMEGAMON Products: CandleNet Portal or the online Help provided with CandleNet Portal.
OMA for eBA Solutions predefined situationsSee “Product-provided Situations” on page 169 for a list of the predefined situations provided with OMA for eBA Solutions, together with the situations’ descriptions and formulas. This information can also be found in the online Help distributed with OMA for eBA Solutions.
Take Action Commands
42 OMA for eBA Solutions User’s Guide, Version 251
Take Action Commands
Take Action featureThe Take Action feature lets you issue a command to any system in your network where one or more Candle monitoring agents are installed. You can implement commands from a workspace, from a situation, in an ad hoc mode, or by recalling a saved command.
For more information on Take Action commandsFor detailed information about creating and using Take Action commands, see Using OMEGAMON Products: CandleNet Portal or the online Help provided with CandleNet Portal.
Introducing OMA for eBA Solutions 43
Investigating an Event
Investigating an Event
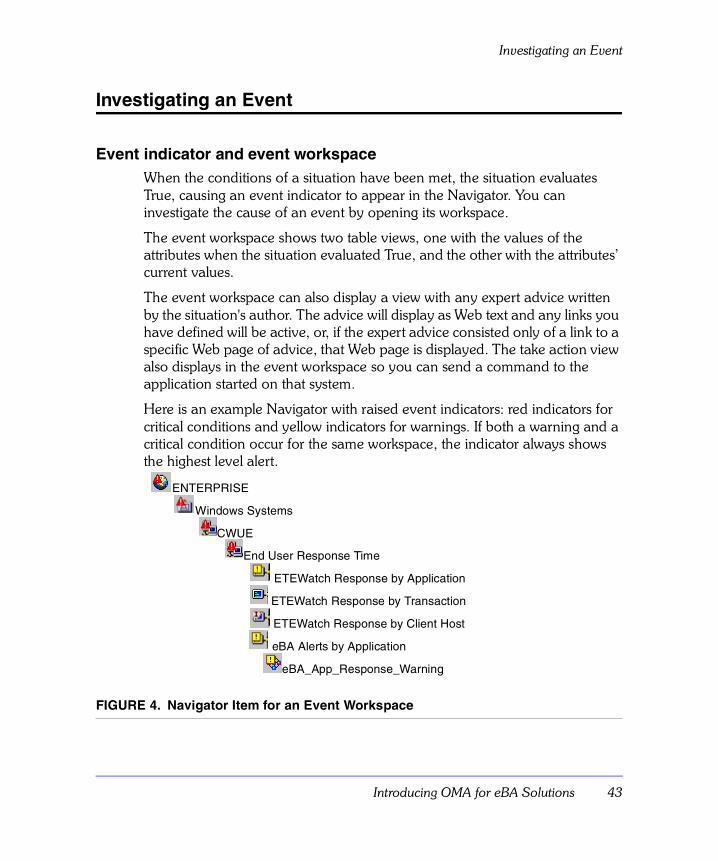
Event indicator and event workspaceWhen the conditions of a situation have been met, the situation evaluates True, causing an event indicator to appear in the Navigator. You can investigate the cause of an event by opening its workspace.
The event workspace shows two table views, one with the values of the attributes when the situation evaluated True, and the other with the attributes’ current values.
The event workspace can also display a view with any expert advice written by the situation's author. The advice will display as Web text and any links you have defined will be active, or, if the expert advice consisted only of a link to a specific Web page of advice, that Web page is displayed. The take action view also displays in the event workspace so you can send a command to the application started on that system.
Here is an example Navigator with raised event indicators: red indicators for critical conditions and yellow indicators for warnings. If both a warning and a critical condition occur for the same workspace, the indicator always shows the highest level alert.
FIGURE 4. Navigator Item for an Event Workspace
ENTERPRISE
Windows Systems
CWUE
End User Response Time
ETEWatch Response by Application
ETEWatch Response by Transaction
ETEWatch Response by Client Host
eBA Alerts by Application
eBA_App_Response_Warning
Investigating an Event
44 OMA for eBA Solutions User’s Guide, Version 251
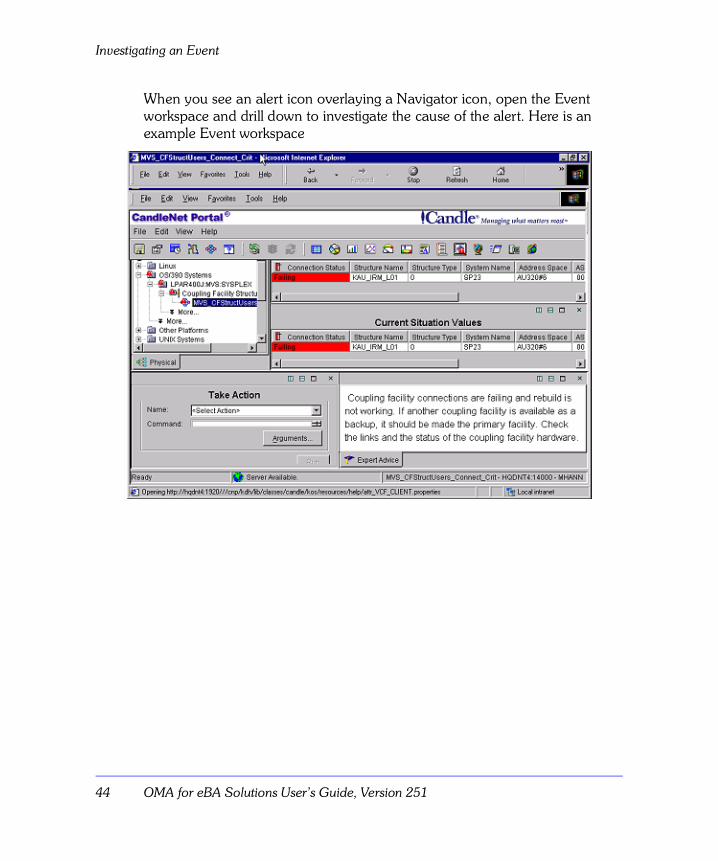
When you see an alert icon overlaying a Navigator icon, open the Event workspace and drill down to investigate the cause of the alert. Here is an example Event workspace
Introducing OMA for eBA Solutions 45
Applications Supported
Applications Supported
OverviewOMA for eBA Solutions provides two levels of applications support, depending upon the version of OMA for eBA Solutions that you are using, and upon the interface that you are using, either CandleNet Portal or CMW. You view reports using the CMW interface and you view workspaces using the CandleNet Portal interface.
Applications supported in Version 251OMA for eBA Solutions, Version 251, provides workspaces and other objects that display in the CandleNet Portal interface. Version 251 supports the following applications:
® Custom client applications running under Windows NT 4.0, Windows 95, Windows 98, or Windows 2000
® Lotus Notes client Versions 4.5x and 4.6x
® R/3™ Versions 3.1h through 4.6, for basic application response time data collection
® R/3™ Versions 4.5b and 4.6b, for basic application response time data collection as well as for the collection of R/3™transaction ID data
® PeopleSoft Versions 7.0 and 7.5
® IBM mainframe-based 3270 applications accessed via Windows terminal emulators using the TN3270 protocol
® Netscape Navigator 3.0x, 4.0x, or 6.0x, or Internet Explorer 3.0x, 4.0x,or 5.0x in one or more of the following languages:
– Brazilian Portuguese (PT)
– French (FR)
– German (DE)
– Italian (IT)
– Spanish (ES)
Applications Supported
46 OMA for eBA Solutions User’s Guide, Version 251
– U.S. English (EN)
® Roma™ custom GUI applications
® Application Response Measurement (ARM) compliant collectors that support ARM Version 1.0 or 2.0
Applications supported in Version 210OMA for eBA Solutions, Version 210, provides reports and other objects that display in the CMW interface. Version 210 supports these applications:
® Custom client applications running under Windows NT , Windows 95, or Windows 98
® Lotus Notes client Versions 4.5x and 4.6x
® R/3™ Versions 3.0x through 4.0b
® PeopleSoft Versions 7.0 and 7.5
® eBA*ServiceMonitor Version 1.0.0
® Netscape Navigator 3.0x or 4.x, or Internet Explorer 3.0x or 4.0x, in one or more of the following languages:
¬ÊBrazilian Portuguese (PT)¬ÊFrench (FR)¬ÊGerman (DE)¬ÊItalian (IT)¬ÊSpanish (ES)¬ÊU.S. English (EN)
– Roma™ custom GUI applications
– Application Response Measurement (ARM) compliant collectors that support ARM Version 1 or 2
To enable monitoring of specific applications, contact Candle Corporation.
In addition, each machine on which you want this user’s guide to be available must have Acrobat Reader 3.0 or above to display and print the user’s guide.
Acrobat Reader for Windows is included on the ETEWatch and on the eBA*ServiceMonitor CD. Acrobat Reader for Windows, AIX, HP-UX, and Solaris can be downloaded from the Web at www.adobe.com.
Configuring OMA for eBA Solutions 47
ConfiguringOMA for eBA Solutions
IntroductionThis chapter discusses the system requirements that must be met to ensure proper OMA operation.
Settings in the Candle products that affect data available to the OMA are also discussed. See the appropriate user’s guide for information about that product.
Chapter ContentsPrerequisites . . . . . . . . . . . . . . . . . . . . . . . . . . . . . . . . . . . . . . . . . . . . . . . 48Configuring the Manager Server for OMA Use . . . . . . . . . . . . . . . . . . . . . 55Usage Notes . . . . . . . . . . . . . . . . . . . . . . . . . . . . . . . . . . . . . . . . . . . . . . . 57
2
Prerequisites
48 OMA for eBA Solutions User’s Guide, Version 251
Prerequisites
OverviewDetailed instructions for installing OMA for eBA Solutions are in the Installing Candle Products on Windows and the Installing Candle Products on UNIX manuals.
This section lists requirements on your Manager Server machine to ensure proper operation of the OMA.
System requirementsOMA for eBA Solutions supports these Candle products:
® ETEWatch
® eBA*ServiceMonitor
® eBA*ServiceMonitor3
® SitePulse
The OMA installs on a server machine on which you have already installed and configured the Candle Manager Server.
Version compatibilityThe version of Manager Server must be the same as or higher than the version of any Manager Client configured to communicate with it.
To determine the version of Manager Server, select Help > About Manager Server from the Manager Server console.
To determine the version of Manager Client, select Help > About Manager Client from the Manager Client console.
Operating platformsThe Manager Server machine requires one of the following operating platforms to support OMA operation:
® Windows NT 4.0 or Windows 2000
Configuring OMA for eBA Solutions 49
Prerequisites
® AIX® 4.2 or 4.3
® Solaris™ 2.5, 2.6, or 7
® HP-UX™10.20 or 11.0
Note: ETEWatch Single User Edition does not support an OMA.
See the appropriate documentation for complete instructions on how to install, configure, and use that product.
Other system requirementsTo ensure proper OMA operation, these requirements must be met.
® Java Runtime Environment (JRE) or Java Development Kit (JDK)
(Windows) JRE 1.3.1 is installed automatically with the Manager Client and the Enterprise Reporter. JRE 1.2.2 is installed automatically with the Manager Server.
(UNIX except LINUX) JRE 1.1.8 is installed automatically during product installation. The bourne shell (/bin/sh/) must be available.
Tip: Under Solaris, X Windowy System Version 11 (X11) support is required for JRE to function. If X11 support has not been installed, you need to add these two modules to your configuration:
– LIBX11.SO.4
– LIBXEXT.SO.4
® The OMA needs either an ODBC database driver installed or a JDBC database driver installed (and ODBC or JDBC data storage configured). See “(Windows NT) Setting up an ODBC database driver” on page 50.
ODBC/JDBC database tables are not required for sending alerts to a Candle monitoring agent (an OMA or OMEGAMON XE). They are required for creating OMA reports or OMEGAMON XE views.
If your data include double byte character strings (DBCS), you must set up Manager Server to write data to flat log files only. DBCS strings cannot be written to ODBC tables.
Prerequisites
50 OMA for eBA Solutions User’s Guide, Version 251
If you use a JDBC driver, the path to the driver needs to be specified in the JDBC_Driver_Class environment variable. See “(UNIX) Setting up an Oracle JDBC database driver” on page 51.
® (Windows only) If you use an ODBC driver, the ODBC data source on the server machine running the OMA must be specified as a "system" data source (System DSN) so that the OMA can access the data.
® (UNIX only) During installation, you need to specify ETE_HOME as the directory for the OMA. See the Installing Candle Products on UNIX document.
(Windows NT) Setting up an ODBC database driverTo define an ODBC database and configure its driver under Windows NT:
1. Select:® (Windows NT) Start > Settings > Control Panel > ODBC
® (Windows 2000) Start > Settings > Control Panel > Administrative Tools > Data Sources (ODBC)
Result: The ODBC Data Source Administrator settings notebook appears.
2. Select the System DSN tab.
Note: Be sure to select the System DSN tab and not the User DSN tab. If there is no System DSN tab, your ODBC driver needs to be updated.
3. On the System DSN page, click Add to add a new data source.
4. Select an ODBC driver (which must already be installed), and click Finish.Result: The setup dialog for the selected driver appears.
5. Enter a Data Source Name (for example, ETEWatch_DB).
Note: The data source name (DSN) is a name used to identify the database. It is not the database filename. For Manager Server to connect to the database, the data source name specified here must be identical to the data source name specified on the Data page of the Manager Server Settings notebook. The DSN is case-sensitive.
6. Enter a Description (for example, ETEWatch ODBC Database).
7. Complete the rest of the dialog for the selected driver.
Configuring OMA for eBA Solutions 51
Prerequisites
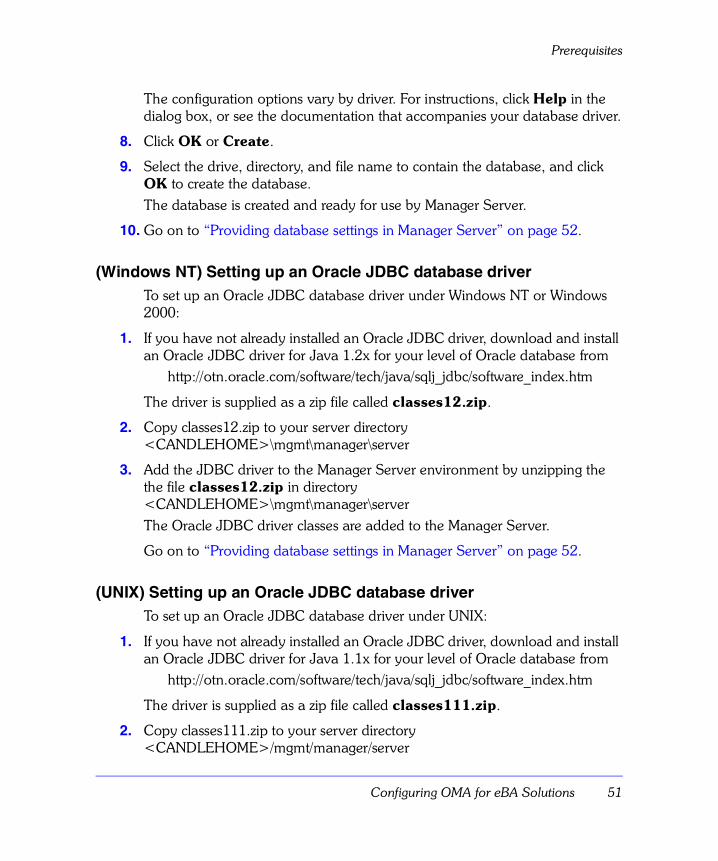
The configuration options vary by driver. For instructions, click Help in the dialog box, or see the documentation that accompanies your database driver.
8. Click OK or Create.
9. Select the drive, directory, and file name to contain the database, and click OK to create the database.The database is created and ready for use by Manager Server.
10. Go on to “Providing database settings in Manager Server” on page 52.
(Windows NT) Setting up an Oracle JDBC database driverTo set up an Oracle JDBC database driver under Windows NT or Windows 2000:
1. If you have not already installed an Oracle JDBC driver, download and install an Oracle JDBC driver for Java 1.2x for your level of Oracle database from
http://otn.oracle.com/software/tech/java/sqlj_jdbc/software_index.htm
The driver is supplied as a zip file called classes12.zip.
2. Copy classes12.zip to your server directory <CANDLEHOME>\mgmt\manager\server
3. Add the JDBC driver to the Manager Server environment by unzipping the the file classes12.zip in directory <CANDLEHOME>\mgmt\manager\serverThe Oracle JDBC driver classes are added to the Manager Server.
Go on to “Providing database settings in Manager Server” on page 52.
(UNIX) Setting up an Oracle JDBC database driverTo set up an Oracle JDBC database driver under UNIX:
1. If you have not already installed an Oracle JDBC driver, download and install an Oracle JDBC driver for Java 1.1x for your level of Oracle database from
http://otn.oracle.com/software/tech/java/sqlj_jdbc/software_index.htm
The driver is supplied as a zip file called classes111.zip.
2. Copy classes111.zip to your server directory <CANDLEHOME>/mgmt/manager/server
Prerequisites
52 OMA for eBA Solutions User’s Guide, Version 251
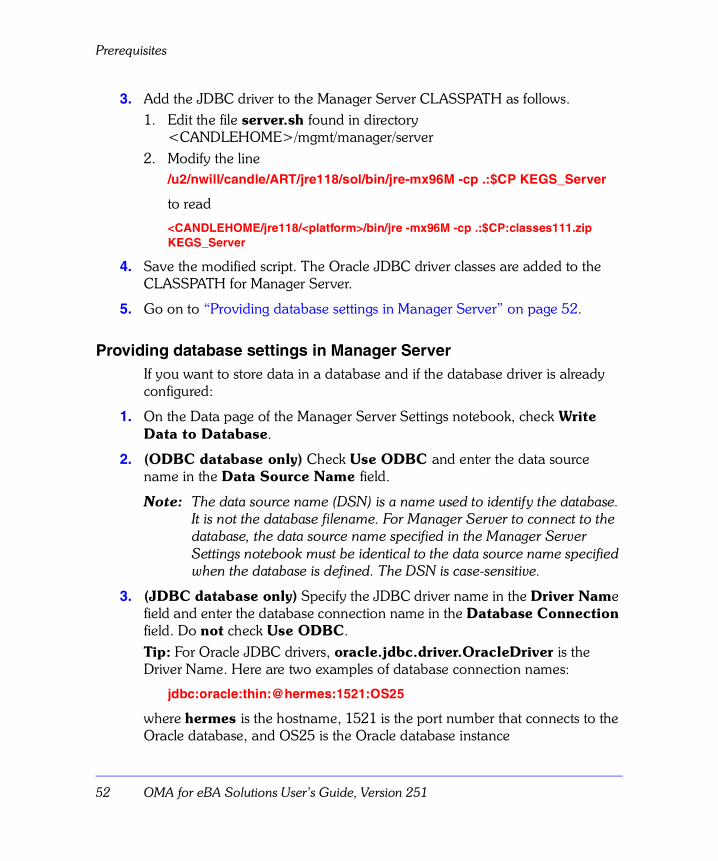
3. Add the JDBC driver to the Manager Server CLASSPATH as follows.1. Edit the file server.sh found in directory
<CANDLEHOME>/mgmt/manager/server2. Modify the line
/u2/nwill/candle/ART/jre118/sol/bin/jre-mx96M -cp .:$CP KEGS_Server
to read
<CANDLEHOME/jre118/<platform>/bin/jre -mx96M -cp .:$CP:classes111.zip KEGS_Server
4. Save the modified script. The Oracle JDBC driver classes are added to the CLASSPATH for Manager Server.
5. Go on to “Providing database settings in Manager Server” on page 52.
Providing database settings in Manager ServerIf you want to store data in a database and if the database driver is already configured:
1. On the Data page of the Manager Server Settings notebook, check Write Data to Database.
2. (ODBC database only) Check Use ODBC and enter the data source name in the Data Source Name field.
Note: The data source name (DSN) is a name used to identify the database. It is not the database filename. For Manager Server to connect to the database, the data source name specified in the Manager Server Settings notebook must be identical to the data source name specified when the database is defined. The DSN is case-sensitive.
3. (JDBC database only) Specify the JDBC driver name in the Driver Name field and enter the database connection name in the Database Connection field. Do not check Use ODBC.Tip: For Oracle JDBC drivers, oracle.jdbc.driver.OracleDriver is the Driver Name. Here are two examples of database connection names:
jdbc:oracle:thin:@hermes:1521:OS25
where hermes is the hostname, 1521 is the port number that connects to the Oracle database, and OS25 is the Oracle database instance
Configuring OMA for eBA Solutions 53
Prerequisites
jdbc:oracle:thin:@hermes:1521:OHE3
where hermes is the hostname, 1521 is the port number that connects to the Oracle database, and OHE3 is the Oracle database instance
4. If needed, specify the login name and password for the database.When you save your settings and exit the Manager Server Settings notebook, database settings are saved whether or not a connection to the database is successful.
If Manager Server cannot find the database or cannot insert data into the database, it
® logs an error message to the Manager Server console and to file msg.log® saves incoming data in a reserve file® attempts to find the database and insert the data every 5 minutes
If a database table experiences a failure conditionIf a database table experiences a failure condition, such as running out of space or being offline for maintenance, the data are reserved in a backup auxiliary file until the database table can accept data again. Manager Server tries to insert records every five minutes. When it successfully opens the database table, the rest of the reserve records are written.
If a database cannot be accessedIf Manager Server is running as a Windows service, it cannot connect to these two server databases:
® Remote Microsoft Access server database
When Manager Server is running as a service, it it runs under a system account and therefore cannot connect to a remote Microsoft Access server database. If you wish to store data in this type of database, shut down Manager Server, then restart Manager Server from a DOS prompt.
® Microsoft SQL server database
When Manager Server is running as a service, it cannot connect to a Microsoft SQL server database using domain name authentication. If you want to store data in this type of database, use a database account created in Microsoft SQL server.
Prerequisites
54 OMA for eBA Solutions User’s Guide, Version 251
If a database remains emptyIf you have defined an ODBC/JDBC database and provided database settings in the Manager Server, but the database remains empty even when you are running a Candle agent:
1. Make sure that the Collector, Manager Client, Manager Server, and monitored application are all running.
2. Make sure that you have deleted or moved to another directory the JDBC/ODBC tables created for an earlier version. ODBC/JDBC logging is turned off until the earlier tables are deleted.
3. Look at the Manager Client and Manager Server console messages. The messages should show evidence of successful communication and data transmission.
4. (Windows NT) Make sure that the ODBC database is defined on the System DSN tab and that there is no User DSN with the same name.
5. (Windows NT) Make sure that the data source name provided on the System DSN tab is identical to the data source name specified on the Data page of the Manager Server Settings notebook. The data source name is case-sensitive.
6. If the database is still empty, shut down and restart Manager Server.
7. If the database remains empty, reboot the computer(s) where the Manager Server and the ODBC database reside.
Configuring OMA for eBA Solutions 55
Configuring the Manager Server for OMA Use
Configuring the Manager Server for OMA Use
Manager Server configurationOMA for eBA Solutions and the Manager Server communicate with each other using TCP/IP.
To activate communication between Manager Server and the OMA:
1. Open the Manager Server settings notebook.
2. On the General page, find the CandleNet Command Center OMA section.
3. Check Enable Candle Command Center OMA and provide a valid OMA Port Number if:® your site has purchased a CandleNet Command Center or CandleNet
Portal with an OMA or OMEGAMON XE that accepts and reports on ETEWatch, eBA*ServiceMonitor, eBA*ServiceMonitor3, and/or SitePulse data.
® you want exceptions found by the Manager Client to trigger alerts on the CMW or on the CandleNet Portal workstation.
The OMA Port Number is used to establish communications between the Manager Server and the OMA or OMEGAMON XE. The default is 15000.
Transmission of exception data to each active OMA or OMEGAMON XE uses a different port number, which is assigned dynamically.
More about the OMA port numberThe OMA port number defines the start of a range of TCP/IP port numbers used by OMA for eBA Solutions. Up to five port numbers are used. Exactly which port number is used depends on whether or not the OMA has a problem using a port number in its assigned range.
If no conflicts are encountered, the OMA for eBA Solutions uses Start port number 15000 +21.
Configuring the Manager Server for OMA Use
56 OMA for eBA Solutions User’s Guide, Version 251
Resolving port conflictsPort number conflicts with other software products can occur. If the Manager Server indicates a problem binding with the OMA, look for other services running on the Manager Server machine that use the same range of TCP/IP port numbers as those used by the Manager Server to listen for OMAs.
To check which port numbers are used by services running on a Windows NT 4.0 machine, examine the file:
WINNT\system32\drivers\etc\services
Hint: Copy the file named services into a file named temp.txt, then open it using Notepad.
The range of port numbers used to listen for the OMA is the Start port number and the next 5 numbers. The Manager Server attempts to bind with the OMA at the Start port 15000 + 21 number. If the bind is not successful, it increments the number by 1 and tries again. It will automatically attempt to bind up to five times.
Changing an existing port number
If you need to change an existing port number, follow these steps:
1. Shut down the OMA.
2. Change the OMA Port Number setting on the General page of the Manager Server Settings notebook.
3. Shut down and restart the Manager Server.
4. Restart the OMA.
Configuring OMA for eBA Solutions 57
Usage Notes
Usage Notes
Data consolidation has already taken placeThe summarized data made available to you in the reports and charts provided for the eBA products through OMA for eBA Solutions has been pre-filtered. These reports and charts retrieve summarized data from defined tables in the database. The default configuration for reports shows the top 20 transactions. The default configuration for charts shows the top 5 transactions.
While you can change the number of transactions shown, you cannot change the type of information displayed or the reports themselves. The Manager Client (on the same machine as the Collector or the eCollector) captures detail data, response time alerts, and summarizes data as configured.
When consolidating alert data, the Manager Client transmits only information that meets the filtering criteria to the Manager Server. You specify the filtering criteria on the Exception and Average page of the Manager Client settings notebook so that meaningful alert data is sent to the Manager Server.
The Consolidating Data chapter of the appropriate Candle product user’s guide explains how the Manager Client and Manager Server can be configured to transmit only the data of interest.
Note: Summarization of data for reports is performed in tables in the database. Report data is product-provided and cannot be manipulated or customized. However, in CandleNet Portal, you can customize workspaces by working in the Properties editor to change the style and content of each view.
Examining the status of OMA for eBA SolutionsOMA for eBA Solutions runs as a service on Windows NT and is configured for automatic startup.
If you need to examine the status of OMA for eBA Solutions service, on the Manager Server machine where the OMA is installed:
1. Select the Services icon from the Control Panel.
2. In the list of services, look for the entry named:– Candle ETEWatch Monitoring Agent Primary

Usage Notes
58 OMA for eBA Solutions User’s Guide, Version 251
Workspaces Accessed from CandleNet Portal 59
WorkspacesAccessed from
CandleNet Portal
IntroductionThis chapter describes the response time and Web site usage workspaces that OMA for eBA Solutions provides. These workspaces are available from the CandleNet Portal user interface.
In addition, most workspaces have a Time Span tool for selecting a period of time to report. Currently, the default time span setting is four hours.
Chapter ContentsIntroducing OMA for eBA Solutions Workspaces . . . . . . . . . . . . . . . . . . . 61OMA for eBA Solutions Workspaces . . . . . . . . . . . . . . . . . . . . . . . . . . . . . 65eBA Alerts by Application. . . . . . . . . . . . . . . . . . . . . . . . . . . . . . . . . . . . . 73eBA Alerts by Client Host . . . . . . . . . . . . . . . . . . . . . . . . . . . . . . . . . . . . . 76eBA Alerts by Transaction. . . . . . . . . . . . . . . . . . . . . . . . . . . . . . . . . . . . . 78eBA*SM Detail Summary by Server . . . . . . . . . . . . . . . . . . . . . . . . . . . . . 81eBA*SM Detail Summary by Transaction . . . . . . . . . . . . . . . . . . . . . . . . . 84eBA*SM Detail Summary by Web Server Type. . . . . . . . . . . . . . . . . . . . . 87eBA*SM Object by Client Host . . . . . . . . . . . . . . . . . . . . . . . . . . . . . . . . . 90eBA*SM Object by Object Name . . . . . . . . . . . . . . . . . . . . . . . . . . . . . . . 93eBA*SM Object by Server Host . . . . . . . . . . . . . . . . . . . . . . . . . . . . . . . . 95eBA*SM Object by Web Server Name . . . . . . . . . . . . . . . . . . . . . . . . . . . 99eBA*SM Object by Web Server Type . . . . . . . . . . . . . . . . . . . . . . . . . . . 103eBA*SM3 Audio Summary by Object. . . . . . . . . . . . . . . . . . . . . . . . . . . 107
3
60 OMA for eBA Solutions User’s Guide, Version 251
eBA*SM3 Object Summary by Web Site . . . . . . . . . . . . . . . . . . . . . . . . 110eBA*SM3 Page Alert Summary by Web Site . . . . . . . . . . . . . . . . . . . . . 113eBA*SM3 Page Summary by Web Site . . . . . . . . . . . . . . . . . . . . . . . . . . 116eBA*SM3 Video Summary by Object . . . . . . . . . . . . . . . . . . . . . . . . . . . 119ETEWatch Response by Application . . . . . . . . . . . . . . . . . . . . . . . . . . . . 122ETEWatch Response by Client Host . . . . . . . . . . . . . . . . . . . . . . . . . . . . 125ETEWatch Response by Transaction. . . . . . . . . . . . . . . . . . . . . . . . . . . . 128SitePulse (eBA SP) Consensus Script Alert Summary . . . . . . . . . . . . . . . 131SitePulse (eBA SP) Consensus URL Alert Summary . . . . . . . . . . . . . . . . 133SitePulse (eBA SP) Location Alert Summary . . . . . . . . . . . . . . . . . . . . . 135SitePulse (eBA SP) Script Alert Summary. . . . . . . . . . . . . . . . . . . . . . . . 137SitePulse (eBA SP) Script Alert Summary by Location . . . . . . . . . . . . . . 139SitePulse (eBA SP) Script Availability Summary . . . . . . . . . . . . . . . . . . . 141SitePulse (eBA SP) Script Response Time Summary. . . . . . . . . . . . . . . . 143SitePulse (eBA SP) URL Alert Summary. . . . . . . . . . . . . . . . . . . . . . . . . 145SitePulse (eBA SP) URL Alert Summary by Location . . . . . . . . . . . . . . . 147SitePulse (eBA SP) URL Availability Summary . . . . . . . . . . . . . . . . . . . . 149SitePulse (eBA SP) URL Response Time Summary . . . . . . . . . . . . . . . . 151
Workspaces Accessed from CandleNet Portal 61
Introducing OMA for eBA Solutions Workspaces
Introducing OMA for eBA Solutions Workspaces
OverviewOMA for eBA Solutions provides data that allows you to examine trends in response times for specific applications. You can also use the workspaces to understand users’ experience of navigating your Web site: where they go, how long they spend on each page, and how long the system takes to load the pages. This information tells you whether your site is providing efficient service for your customers. Armed with this time and usage information, you can improve your site by making it more responsive and easier to use, thereby improving customer loyalty and retention.
Settings within the Manager Client and Manager Server control what type of data is collected (detail, alert, summary) and at what interval data is sent to the Manager Server and therefore available to the agent. Any combination of summary data can be consolidated at the Manager Server.
See the Consolidating Data chapter of the user’s guide for the Candle product you have purchased for details on the Manager Client and Manager Server settings notebooks. See the SitePulse online help for information about this product.
For a listing of the applications and Web browsers supported, see “Applications Supported” on page 45.
Note: Summarization of data for workspaces is performed in tables in the database. Workspace data are product-provided and cannot be manipulated or customized. However, in CandleNet Portal, you can customize a workspace by working in the Properties editor to change the style and content of each view. See the CandleNet Portal online help for details.
Using OMA for eBA Solutions dataOMA for eBA Solutions provides the ability to view data about each application or each Web browser that you are monitoring.
You can use this data to:
® obtain Web site usage data
Introducing OMA for eBA Solutions Workspaces
62 OMA for eBA Solutions User’s Guide, Version 251
® monitor the response time of business applications and of Web sites
® examine trends in response times for specific applications and Web sites
® select the most effective threshold values for situations you create
Data in the table views and chartsThe data in OMA for eBA Solutions table views and charts is obtained from a database. You can display data collected over a time period that you define. The Time Span tool lets you select a period of time to report. For this agent, the default time span setting is four hours.
A blank report may simply indicate that no data of the type requested is being collected during the specified interval. Another possibility is that the Time Span tool for selecting a period of time to report is not set at the proper interval. Try setting the interval to None.
There is a direct relationship between attribute groups in OMA for eBA Solutions and the table views and charts that display data in the workspaces for this agent. Individual attributes within a group correspond to report columns in table views and data items presented by a chart shown in a workspace.
For example, the ETEWatch Response by Application table view displays information collected by the ETEWatch Response by Application attribute group. This table view displays information for many attributes.
Alert dataAlert data displays in the Alert workspaces on a continuous basis, as alert data are received.
Monitoring for alerts requires you to create situations to detect response time exceptions that are meaningful to the transactions you are monitoring. You first specify the filtering criteria on the Exception and Average page of the Manager Client settings notebook so that meaningful alert data is sent to the Manager Server. Also, Send Exception Data must be checked on the General page.
Note: Keep in mind that whatever criteria you define for your situations must match the filtering criteria set in the Exception and Average page of the Manager Client settings notebook.
Workspaces Accessed from CandleNet Portal 63
Introducing OMA for eBA Solutions Workspaces
Two types of situations
Sample situations that you can use for your own environment are provided to make creating situations as easy as possible. See “Predefined Solutions” on page 165.
You can create two types of situations using Alert table attributes:
® Pure event situations
Pure events are unsolicited notifications. Examples of pure events are an out-of-paper condition on a printer and an occurrence that adds an entry to the Windows System Log. Some of the Alert attributes report pure events, such as the eBA SM3 Page Alert Detail attributes. A situation using one of these attributes can monitor for pure events. Because of the nature of pure events, they are not closed automatically like sampled events; you must close the event manually. Alternatively, you can author the situation with an UNTIL clause. See the CandleNet Portal online help for details on using the UNTIL clause.
® Sampled event situations
Sampled events happen when a situation becomes true. Situations sample data at regular intervals. When the situation is true, it causes an event, which gets closed automatically when the situation goes back to false (or you can close it manually).
When using attributes to create sampled event situations, the sampling interval should match the interval when Manager Client sends data to Manager Server. Manager Client sends alert data to Manager Server whenever an exception is detected, if Send Exception Data is checked. You can set the Checking Data Interval on the Exception and Average page for when Manager Client checks for alert data. For example, if you specify 30 minutes, data is checked for exceptions once every 30 minutes. Therefore, data will only be sent to the Manager Server every 30 minutes. In this case, set the sampling interval to 30 minutes for these types of situations.
Introducing OMA for eBA Solutions Workspaces
64 OMA for eBA Solutions User’s Guide, Version 251
Collecting historical dataYou can use CandleNet Portal’s historical data collection function to store and save the data being collected by OMA for eBA Solutions. The historical data collection function permits you to specify
® the attribute group or groups for which data is to be collected
® the interval at which data is to be collected
® the interval at which data is to be warehoused (if you choose to do so)
® the location (either at the agent or at the CMS) at which the collected data is to be stored
Information about using the Historical Data Collection function can be found in the CandleNet Portal Help and in the Historical Data Collection Guide for OMEGAMON XE and CandleNet Command Center.
Note: Historical data displays in the workspaces only when you select a workspace, and when the Time Span setting is None.
Workspaces Accessed from CandleNet Portal 65
OMA for eBA Solutions Workspaces
OMA for eBA Solutions Workspaces
OverviewThis unit provides a high-level overview of working with workspaces while using CandleNet Portal. For the most current in-depth information on workspaces, refer to the Using OMEGAMON Products:CandleNet Portal guide and the online Help for CandleNet Portal.
The workspace is the working area in which CandleNet Portal presents information. As you select items, the workspace presents views pertinent to your selection. Each workspace has at least one view. Every workspace has a set of properties associated with it. You can customize the workspace by working in the Properties editor to change the style and content of each view.
The columns in the predefined workspaces correspond to attributes you can use to to create your own workspace queries. You can also create situations to monitor for specific conditions, for most attribute groups associated with the predefined workspaces. See the CandleNet Portal help on creating queries and situations.
Accessing workspacesTo access the workspaces for OMA for eBA Solutions, start from the Navigator. From the Navigator, expand the End User Response Time agent. The Navigator now displays a list of workspaces provided for the selected server.
Note: The SitePulse product workspaces that are part of the OMA are prefaced with EBA SP.
Accessing a linked workspace
All of the predefined workspaces for the OMA for eBA Solutions contain other workspaces that you can access to obtain additional, more detailed information.
For example, if you right-click on a row in the eBA Alerts by Application workspace and select Link To, you can link to the Alerts by Transaction workspace.

OMA for eBA Solutions Workspaces
66 OMA for eBA Solutions User’s Guide, Version 251
Available workspacesThe following workspaces are available:
Table 1. Workspaces Provided by OMA for eBA Solutions
Workspace Related Attribute Group
eBA Alerts by Application® Alerts by Transaction® Alerts Details for Transactions® Alerts by Client Host® Alerts Details
Note: This workspace applies to either the eBA*ServiceMonitor product or to the ETEWatch product.
eBA Alerts by Application® eBA Alerts by Transaction® eBA Response Alerts® eBA Alerts by Client Host® eBA Response Alerts
eBA Alerts by Client Host® Alert Details
Note: This workspace applies to either the eBA*ServiceMonitor product or to the ETEWatch product.
eBA Alerts by Client Host® eBA Response Alerts
eBA Alerts by Transaction® Transaction Alerts by Client Host® Alert Details® Transaction Alert Details
Note: This workspace applies to either the eBA*ServiceMonitor product or to the ETEWatch product.
eBA Alerts by Transaction® eBA Alerts by Client Host® eBA Response Alerts® eBA Response Alerts
eBA*SM Detail Summary by Server® Transaction Summary on Server® Transaction Details® Transaction Details
eBA SM Detail Summary by Server® eBA SM Detail Summary by
Transaction® eBA ServiceMonitor Response
Detail® eBA ServiceMonitor Response
Detail
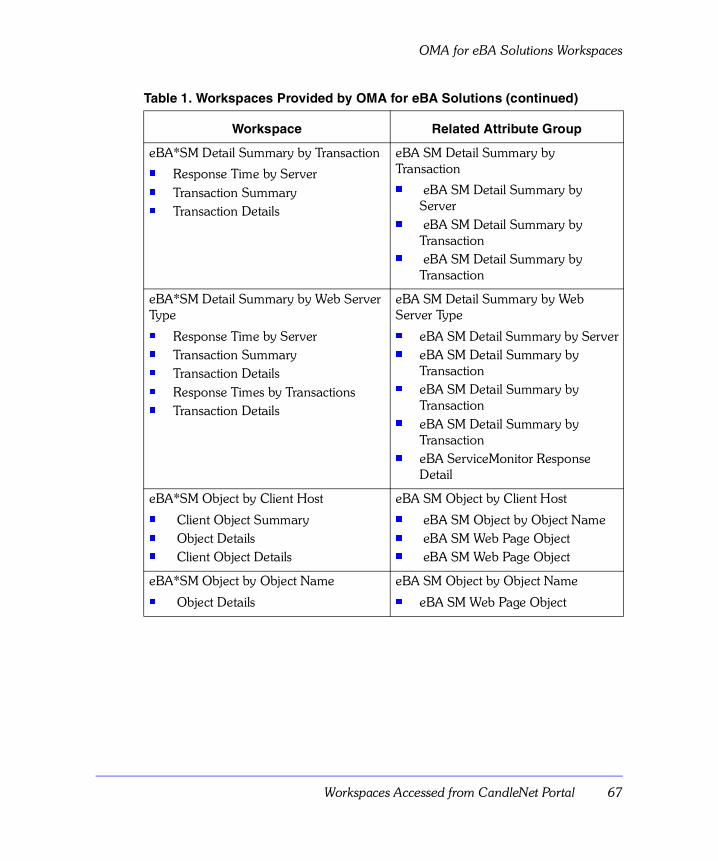
Workspaces Accessed from CandleNet Portal 67
OMA for eBA Solutions Workspaces
eBA*SM Detail Summary by Transaction® Response Time by Server® Transaction Summary® Transaction Details
eBA SM Detail Summary by Transaction® eBA SM Detail Summary by
Server® eBA SM Detail Summary by
Transaction® eBA SM Detail Summary by
Transaction
eBA*SM Detail Summary by Web Server Type® Response Time by Server® Transaction Summary® Transaction Details® Response Times by Transactions® Transaction Details
eBA SM Detail Summary by Web Server Type® eBA SM Detail Summary by Server® eBA SM Detail Summary by
Transaction® eBA SM Detail Summary by
Transaction® eBA SM Detail Summary by
Transaction® eBA ServiceMonitor Response
Detail
eBA*SM Object by Client Host® Client Object Summary® Object Details® Client Object Details
eBA SM Object by Client Host® eBA SM Object by Object Name® eBA SM Web Page Object® eBA SM Web Page Object
eBA*SM Object by Object Name® Object Details
eBA SM Object by Object Name® eBA SM Web Page Object
Table 1. Workspaces Provided by OMA for eBA Solutions (continued)
Workspace Related Attribute Group
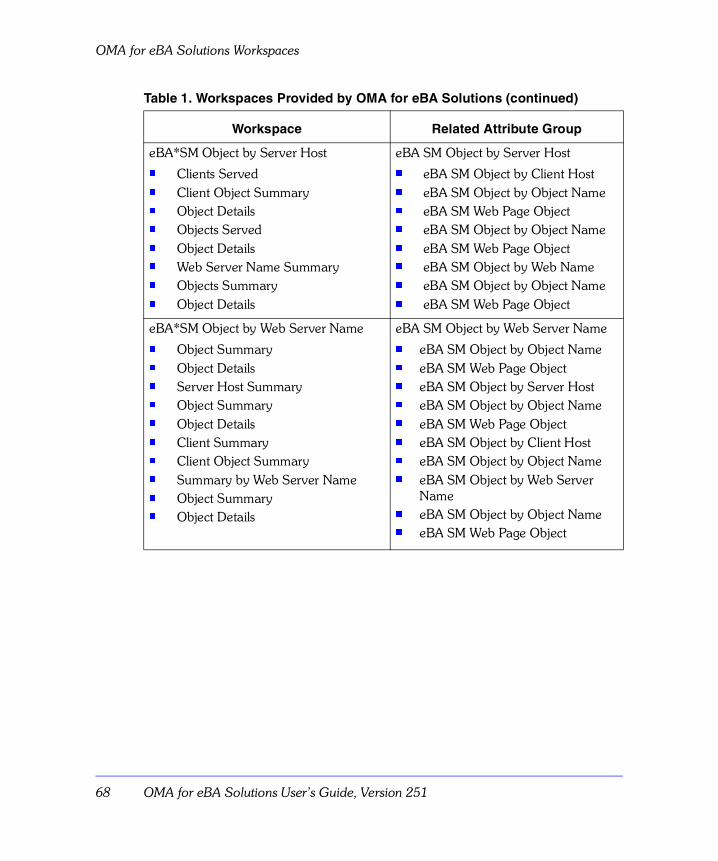
OMA for eBA Solutions Workspaces
68 OMA for eBA Solutions User’s Guide, Version 251
eBA*SM Object by Server Host® Clients Served® Client Object Summary® Object Details® Objects Served® Object Details® Web Server Name Summary® Objects Summary® Object Details
eBA SM Object by Server Host® eBA SM Object by Client Host® eBA SM Object by Object Name® eBA SM Web Page Object® eBA SM Object by Object Name® eBA SM Web Page Object® eBA SM Object by Web Name® eBA SM Object by Object Name® eBA SM Web Page Object
eBA*SM Object by Web Server Name® Object Summary® Object Details® Server Host Summary® Object Summary® Object Details® Client Summary® Client Object Summary® Summary by Web Server Name® Object Summary® Object Details
eBA SM Object by Web Server Name® eBA SM Object by Object Name® eBA SM Web Page Object® eBA SM Object by Server Host® eBA SM Object by Object Name® eBA SM Web Page Object® eBA SM Object by Client Host® eBA SM Object by Object Name® eBA SM Object by Web Server
Name® eBA SM Object by Object Name® eBA SM Web Page Object
Table 1. Workspaces Provided by OMA for eBA Solutions (continued)
Workspace Related Attribute Group
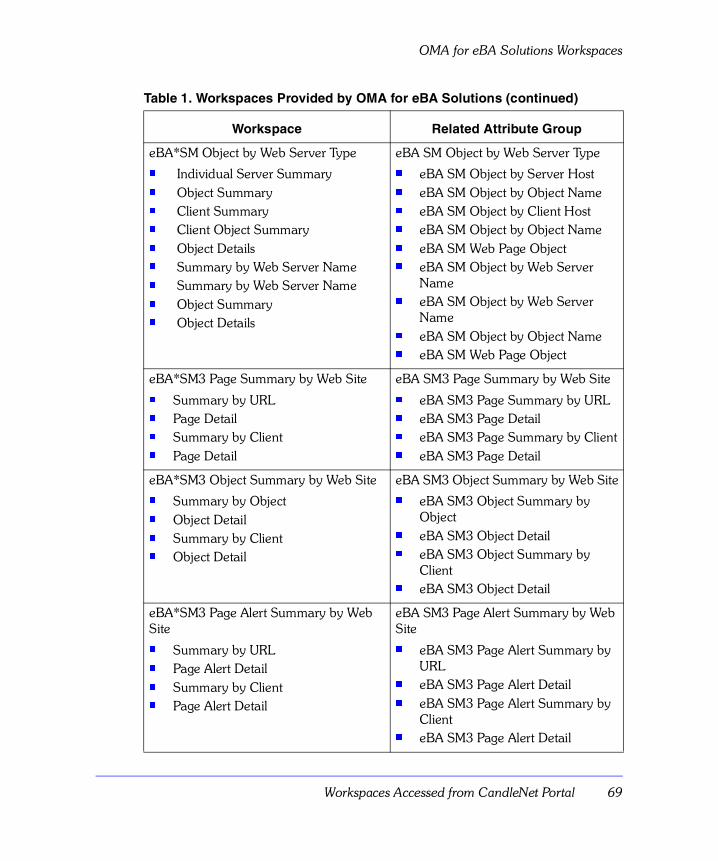
Workspaces Accessed from CandleNet Portal 69
OMA for eBA Solutions Workspaces
eBA*SM Object by Web Server Type® Individual Server Summary® Object Summary® Client Summary® Client Object Summary® Object Details® Summary by Web Server Name® Summary by Web Server Name® Object Summary® Object Details
eBA SM Object by Web Server Type® eBA SM Object by Server Host® eBA SM Object by Object Name® eBA SM Object by Client Host® eBA SM Object by Object Name® eBA SM Web Page Object® eBA SM Object by Web Server
Name® eBA SM Object by Web Server
Name® eBA SM Object by Object Name® eBA SM Web Page Object
eBA*SM3 Page Summary by Web Site® Summary by URL® Page Detail® Summary by Client® Page Detail
eBA SM3 Page Summary by Web Site® eBA SM3 Page Summary by URL® eBA SM3 Page Detail® eBA SM3 Page Summary by Client® eBA SM3 Page Detail
eBA*SM3 Object Summary by Web Site® Summary by Object® Object Detail® Summary by Client® Object Detail
eBA SM3 Object Summary by Web Site® eBA SM3 Object Summary by
Object® eBA SM3 Object Detail® eBA SM3 Object Summary by
Client® eBA SM3 Object Detail
eBA*SM3 Page Alert Summary by Web Site® Summary by URL® Page Alert Detail® Summary by Client® Page Alert Detail
eBA SM3 Page Alert Summary by Web Site® eBA SM3 Page Alert Summary by
URL® eBA SM3 Page Alert Detail® eBA SM3 Page Alert Summary by
Client® eBA SM3 Page Alert Detail
Table 1. Workspaces Provided by OMA for eBA Solutions (continued)
Workspace Related Attribute Group
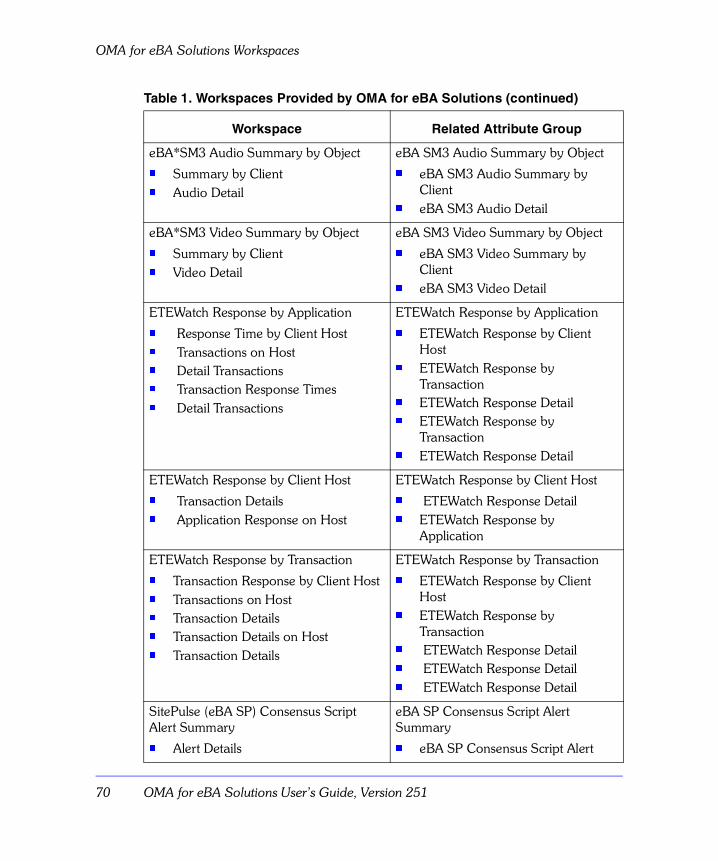
OMA for eBA Solutions Workspaces
70 OMA for eBA Solutions User’s Guide, Version 251
eBA*SM3 Audio Summary by Object® Summary by Client® Audio Detail
eBA SM3 Audio Summary by Object® eBA SM3 Audio Summary by
Client ® eBA SM3 Audio Detail
eBA*SM3 Video Summary by Object® Summary by Client® Video Detail
eBA SM3 Video Summary by Object® eBA SM3 Video Summary by
Client ® eBA SM3 Video Detail
ETEWatch Response by Application® Response Time by Client Host® Transactions on Host® Detail Transactions® Transaction Response Times® Detail Transactions
ETEWatch Response by Application® ETEWatch Response by Client
Host® ETEWatch Response by
Transaction® ETEWatch Response Detail® ETEWatch Response by
Transaction® ETEWatch Response Detail
ETEWatch Response by Client Host® Transaction Details® Application Response on Host
ETEWatch Response by Client Host® ETEWatch Response Detail® ETEWatch Response by
Application
ETEWatch Response by Transaction® Transaction Response by Client Host® Transactions on Host® Transaction Details® Transaction Details on Host® Transaction Details
ETEWatch Response by Transaction® ETEWatch Response by Client
Host® ETEWatch Response by
Transaction® ETEWatch Response Detail® ETEWatch Response Detail® ETEWatch Response Detail
SitePulse (eBA SP) Consensus Script Alert Summary® Alert Details
eBA SP Consensus Script Alert Summary® eBA SP Consensus Script Alert
Table 1. Workspaces Provided by OMA for eBA Solutions (continued)
Workspace Related Attribute Group
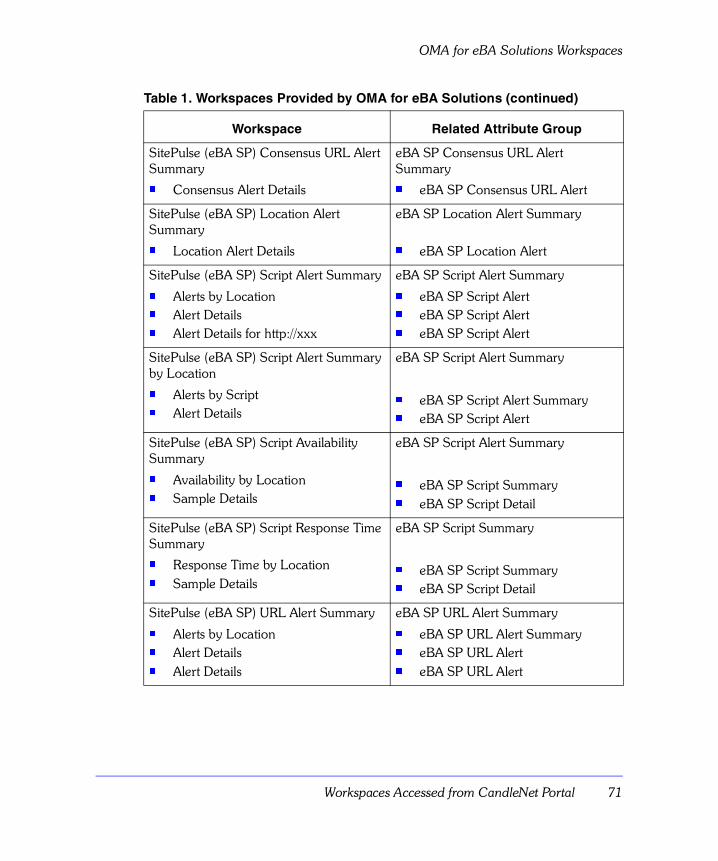
Workspaces Accessed from CandleNet Portal 71
OMA for eBA Solutions Workspaces
SitePulse (eBA SP) Consensus URL Alert Summary® Consensus Alert Details
eBA SP Consensus URL Alert Summary® eBA SP Consensus URL Alert
SitePulse (eBA SP) Location Alert Summary® Location Alert Details
eBA SP Location Alert Summary
® eBA SP Location Alert
SitePulse (eBA SP) Script Alert Summary® Alerts by Location® Alert Details® Alert Details for http://xxx
eBA SP Script Alert Summary® eBA SP Script Alert® eBA SP Script Alert® eBA SP Script Alert
SitePulse (eBA SP) Script Alert Summary by Location® Alerts by Script® Alert Details
eBA SP Script Alert Summary
® eBA SP Script Alert Summary® eBA SP Script Alert
SitePulse (eBA SP) Script Availability Summary® Availability by Location® Sample Details
eBA SP Script Alert Summary
® eBA SP Script Summary® eBA SP Script Detail
SitePulse (eBA SP) Script Response Time Summary® Response Time by Location® Sample Details
eBA SP Script Summary
® eBA SP Script Summary® eBA SP Script Detail
SitePulse (eBA SP) URL Alert Summary® Alerts by Location® Alert Details® Alert Details
eBA SP URL Alert Summary® eBA SP URL Alert Summary® eBA SP URL Alert ® eBA SP URL Alert
Table 1. Workspaces Provided by OMA for eBA Solutions (continued)
Workspace Related Attribute Group
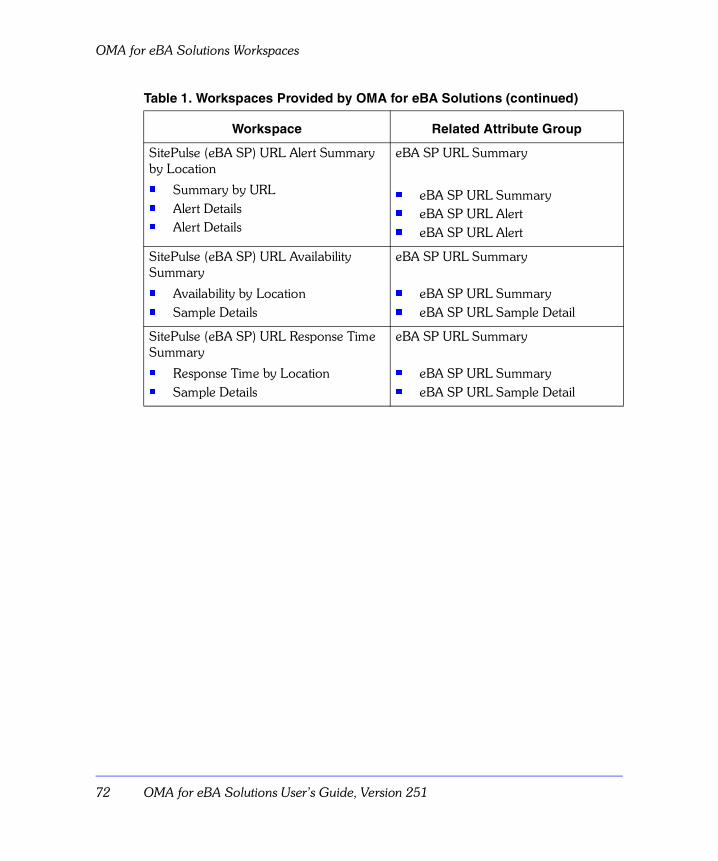
OMA for eBA Solutions Workspaces
72 OMA for eBA Solutions User’s Guide, Version 251
SitePulse (eBA SP) URL Alert Summary by Location® Summary by URL® Alert Details® Alert Details
eBA SP URL Summary
® eBA SP URL Summary® eBA SP URL Alert ® eBA SP URL Alert
SitePulse (eBA SP) URL Availability Summary ® Availability by Location® Sample Details
eBA SP URL Summary
® eBA SP URL Summary® eBA SP URL Sample Detail
SitePulse (eBA SP) URL Response Time Summary ® Response Time by Location® Sample Details
eBA SP URL Summary
® eBA SP URL Summary® eBA SP URL Sample Detail
Table 1. Workspaces Provided by OMA for eBA Solutions (continued)
Workspace Related Attribute Group
Workspaces Accessed from CandleNet Portal 73
eBA Alerts by Application
eBA Alerts by Application
OverviewThis workspace displays data that exceeded thresholds based on filter settings specified during configuration of the Manager Client and of the Manager Server. Use this workspace to determine which applications are experiencing response time problems. Alert data displays in this workspace on a continuous basis, as alert data is received from the Manager Server.
Additionally, if segmentation is enabled at the Manager Client workstation, you will see data for Average Client Time, for Average Network Time, and for Average Application Time.
The columns in this predefined workspace for each application correspond to attributes you can use to create situations that notify you when alerts occur. You can also use the attributes to create your own workspace queries in CandleNet Portal. See the CandleNet Portal help on creating situations and queries.
Note: This workspace displays for either the eBA*Service Monitor product or for the ETEWatch product.
Contents of the eBA Alerts by Application workspaceThe predefined eBA Alerts by Application workspace contains the following items:
® an eBA Alerts by Application table view that displays data that exceeded thresholds based on filter settings specified during configuration of the Manager Client and of the Manager Server
® a chart that shows the number of alerts, per application, for which alerts were previously defined whose thresholds were exceeded
® additional workspaces accessed from the Link To feature. These workspaces are described in the sections that follow the eBA Alerts by Application table view description.
eBA Alerts by Application
74 OMA for eBA Solutions User’s Guide, Version 251
Information presented in the eBA Alerts by Application table viewThe eBA Alerts by Application table view displays alert data for each application or Web browser being monitored. The information in this table view is reported by the eBA Alerts by Application attributes. The following is a list of these attributes.
® Application Name
® Interval Start Time
® Interval (Min)
® Avg Response Time (Sec)
® Num of Alerts
® Min Response Time (Sec)
® Max Response Time (Sec)
® Avg Connect Time (Sec)
® Avg Download Time (Sec)
® Avg Client Time (Sec)
® Avg Network Time (Sec)
For detailed descriptions of the eBA Alerts by Application attributes, refer to the CandleNet Portal online Help for OMA for eBA Solutions.
Alerts by TransactionUse this workspace to see data about the transactions for which alerts occurred.
This workspace also contains a chart that shows response time data for these columns:
® Average Response Time (Sec)
® Maximum Response Time (Sec)
® Minimum Response Time (Sec)
Alert Details for Transaction
Use this workspace to see alert data for individual transactions.
Workspaces Accessed from CandleNet Portal 75
eBA Alerts by Application
Alerts by Client HostUse this workspace to see data about the transactions on a specific Web browser, for which alerts occurred, summarized by client host.
This workspace also contains a chart that shows response time data for these columns:
® Average Response Time (Sec)
® Maximum Response Time (Sec)
® Minimum Response Time (Sec)
Alert Details
Use this workspace to see alert data, summarized by client host name.
eBA Alerts by Client Host
76 OMA for eBA Solutions User’s Guide, Version 251
eBA Alerts by Client Host
OverviewThis workspace displays alert data that exceeded thresholds based on filter settings specified during configuration of the Manager Client and of the Manager Server, summarized by client host name. You use this workspace to determine which clients are experiencing response time problems.
Additionally, if segmentation is enabled at the Manager Client workstation, you will see data for Average Client Time, for Average Network Time, and for Average Application Time.
The columns in this workspace correspond to attributes you can use to create situations that notify you when alerts occur. You can also use the attributes to create your own workspace queries in CandleNet Portal. See the CandleNet Portal help on creating situations and queries.
Note: This workspace displays for either the eBA*Service Monitor product or for the ETEWatch product.
Contents of the eBA Alerts by Client Host workspaceThe predefined eBA Alerts by Client Host workspace contains the following items:
® an eBA Alerts by Client Host table view that displays data that exceeded thresholds based on filter settings specified during configuration of the Manager Client and of the Manager Server, summarized by client host name
® a chart that shows the number of alerts that occurred for the five slowest transactions, and that shows data for these columns:
– Average Response Time (Sec)
– Maximum Response Time (Sec)
– Minimum Response Time (Sec)
® additional workspaces accessed from the Link To feature. These workspaces are described in the sections that follow the eBA Alerts by Client Host table view description.
Workspaces Accessed from CandleNet Portal 77
eBA Alerts by Client Host
Information presented in the eBA Alerts by Client Host table viewThe eBA Alerts by Client Host table view displays alert data for each application or Web browser being monitored, summarized by client host name. The information in this table view is reported by the eBA Alerts by Client Host attributes. The following is a list of the attributes that display in this workspace.
® Client Hostname
® Interval Start Time
® Interval (Min)
® Avg Response Time (Sec)
® Num of Alerts
® Min Response Time (Sec)
® Max Response Time (Sec)
® Avg Connect Time (Sec)
® Avg Download Time (Sec)
® Avg Client Time (Sec)
® Avg Network Time (Sec)
® Avg Application Time (Sec)
For detailed descriptions of the eBA Alerts by Client Host attributes, refer to the CandleNet Portal online Help for OMA for eBA Solutions.
Alert DetailsUse this workspace to see details about alert data, summarized by client host name.
eBA Alerts by Transaction
78 OMA for eBA Solutions User’s Guide, Version 251
eBA Alerts by Transaction
OverviewThis workspace displays alert data that exceeded thresholds based on filter settings specified during configuration of the Manager Client and of the Manager Server, summarized by transaction. You use this workspace to determine which transactions generated alerts.
Additionally, if segmentation is enabled at the Manager Client workstation, you will see data for Average Client Time, for Average Network Time, and for Average Application Time.
The columns in this workspace correspond to attributes you can use to create situations that notify you when alerts occur. You can also use the attributes to create your own workspace queries in CandleNet Portal. See the CandleNet Portal help on creating situations and queries.
Note: This workspace displays for either the eBA*Service Monitor product or for the ETEWatch product.
Contents of the eBA Alerts by Transaction workspaceThe predefined eBA Alerts by Transaction workspace contains the following items:
® an eBA Alerts by Transaction table view that displays data that exceeded thresholds based on filter settings specified during configuration of the Manager Client and of the Manager Server, summarized by transaction
® a chart that shows the response time data for the three slowest transactions, and that shows data for these columns:
– Average Response Time (Sec)
– Maximum Response Time (Sec)
– Minimum Response Time (Sec)
® additional workspaces accessed from the Link To feature. These workspaces are described in the sections that follow the eBA Alerts by Transaction table view description.
Workspaces Accessed from CandleNet Portal 79
eBA Alerts by Transaction
Information presented in the eBA Alerts by Transaction table viewThe eBA Alerts by Transaction table view displays alert data for each application or Web browser being monitored, summarized by transaction. The information in this table view is reported by the eBA Alerts by Transaction attributes. The following is a list of these attributes.
® Transaction
® Interval Start Time
® Interval (Min)
® Avg Response Time (Sec)
® Num of Alerts
® Min Response Time (Sec)
® Max Response Time (Sec)
® Avg Connect Time (Sec)
® Avg Download Time (Sec)
® Avg Client Time (Sec)
® Avg Network Time (Sec)
® Avg Application Time (Sec)
For detailed descriptions of the eBA Alerts by Transaction attributes, refer to the CandleNet Portal online Help for OMA for eBA Solutions.
eBA Alerts by Transaction
80 OMA for eBA Solutions User’s Guide, Version 251
Transaction Alerts by Client HostUse this workspace to see data about the transactions for which alerts occurred, summarized by client host.
This workspace also contains a chart that shows response time data for alerts that occurred for a specific URL for a client host, and the following data for those alerts:
® Average Response Time (Sec)
® Maximum Response Time (Sec)
® Minimum Response Time (Sec)
Alert Details
Use this workspace to see alert data about the URL transactions for which alerts occurred, summarized by client host name.
Transaction Alert DetailsUse this workspace to view alert data about the URL transactions for which alerts occurred, summarized by client host name.
Workspaces Accessed from CandleNet Portal 81
eBA*SM Detail Summary by Server
eBA*SM Detail Summary by Server
OverviewThis predefined workspace displays detail data received from the Manager Server for your Web browsers, summarized by server name. The data applies to the eBA*ServiceMonitor product running on a Web server.
You can find out such data as the number of transactions monitored during the specified interval for a particular Web browser. You can also find out the average time between the user’s request and the browser’s successful connection with the Web server, for all transactions.
The columns in this workspace correspond to attributes you can use to create situations to monitor for specific conditions. You can also use the attributes to create your own workspace queries. See the CandleNet Portal help on creating situations and queries.
Contents of the eBA*SM Detail Summary by Server workspaceThe predefined eBA*SM Detail Summary by Server workspace contains the following items:
® an eBA*SM Detail Summary by Server table view that displays detail data, summarized by server name
® a chart that shows the response time for the five servers with the slowest response times, and that shows data for:
– Average Response Time (Sec)
– Maximum Response Time (Sec)
– Minimum Response Time (Sec)
® additional workspaces accessed from the Link To feature. These workspaces are described in the sections that follow the eBA*SM Detail Summary by Server table view description.
eBA*SM Detail Summary by Server
82 OMA for eBA Solutions User’s Guide, Version 251
Information presented in the eBA*SM Detail Summary by Server table view
The eBA*SM Detail Summary by Server table view displays response time data for each Web server being used. The information in this table view is reported by the eBA*SM Detail Summary by Server attributes. The following is a list of these attributes.
® Server Hostname
® Interval Start Time
® Interval (Min)
® Avg Response Time (Sec)
® Num of Trans
® Min Response Time (Sec)
® Max Response Time (Sec)
® Avg Browse Time (Sec)
® Avg Load Time (Sec)
® Avg Resolve Time (Sec)
® Avg Verification Time (Sec)
® Avg Service Time (Sec)
® Avg Server Time (Sec)
® Min Server Time (Sec)
® Max Server Time (Sec)
For detailed descriptions of the eBA*SM Detail Summary by Server attributes, refer to the CandleNet Portal online Help for OMA for eBA Solutions.
Workspaces Accessed from CandleNet Portal 83
eBA*SM Detail Summary by Server
Transaction Summary on ServerUse this workspace to see data about the transaction response time, summarized by server name.
This workspace also contains a chart that shows the average response time for transactions served by a particular Web server, and that shows data for these columns:
® Average Response Time (Sec)
® Maximum Response Time (Sec)
® Minimum Response Time (Sec)
Transaction Details
Use this workspace to see detail data about transaction response times.
Transaction DetailsUse this workspace to see response times for individual transactions on a specific Web server.
eBA*SM Detail Summary by Transaction
84 OMA for eBA Solutions User’s Guide, Version 251
eBA*SM Detail Summary by Transaction
OverviewThis predefined workspace displays detail data received from the Manager Server for your Web browsers, summarized by transaction. The data applies to the eBA*ServiceMonitor product running on a Web server.
Using this workspace, you can find out such data as the average response time of each transaction monitored during the specified interval for a particular Web server. You can also find out the number of times each transaction was invoked.
The columns in this workspace correspond to attributes you can use to create situations to monitor for specific conditions. You can also use these attributes to create your own workspace queries. See the CandleNet Portal help on creating situations and queries.
Contents of the eBA*SM Detail Summary by Transaction workspaceThe predefined eBA*SM Detail Summary by Transaction workspace contains the following items:
® an eBA*SM Detail Summary by Transaction table view that displays detail data, summarized by transaction
® a chart that shows the average response time for the slowest transactions
® additional workspaces accessed from the Link To feature. These workspaces are described in the sections that follow the eBA*SM Detail Summary by Transaction table view description.
Workspaces Accessed from CandleNet Portal 85
eBA*SM Detail Summary by Transaction
Information presented in the eBA*SM Detail Summary by Transaction table view
The eBA*SM Detail Summary by Transaction table view displays response time data for each transaction being monitored. The information in this table view is reported by the eBA*SM Detail Summary by Transaction attributes. The following is a list of these attributes.
® URL Transaction
® Interval Start Time
® Interval (Min)
® Avg Response Time (Sec)
® Num of Trans
® Min Response Time (Sec)
® Max Response Time (Sec)
® Avg Browse Time (Sec)
® Avg Load Time (Sec)
® Avg Resolve Time (Sec)
® Avg Verification Time (Sec)
® Avg Service Time (Sec)
® Avg Server Time (Sec)
® Min Server Time (Sec)
® Max Server Time (Sec)
For detailed descriptions of the eBA*SM Detail Summary by Transaction attributes, refer to the CandleNet Portal online Help for OMA for eBA Solutions.
eBA*SM Detail Summary by Transaction
86 OMA for eBA Solutions User’s Guide, Version 251
Response Time by ServerUse this workspace to see data about the transaction response time, summarized by Web server.
Transaction Summary
Use this workspace to see response time data for transactions serviced by a specific Web server, summarized by URL transaction.
Transaction Details
Use this workspace to see detail data about an individual transaction.
Workspaces Accessed from CandleNet Portal 87
eBA*SM Detail Summary by Web Server Type
eBA*SM Detail Summary by Web Server Type
OverviewThis predefined workspace displays detail data received from the Manager Server for your Web browsers, summarized by Web server type. The data applies to the eBA*ServiceMonitor product running on a Web server.
You can find out such data as the average time taken by the Web server type to authenticate the request. You can also find out the number of requests processed during the specified interval by each type of Web server.
The columns in this workspace correspond to attributes you can use to create situations to monitor for specific conditions. You can also use the attributes to create your own workspace queries. See the CandleNet Portal help on creating situations and queries.
Contents of the eBA*SM Detail Summary by Web Server Type workspace
The predefined eBA*SM Detail Summary by Web Server Type workspace contains the following items:
® an eBA*SM Detail Summary by Web Server Type table view that displays detail data, summarized by Web server type
® one or more pie charts that display the number of transactions processed by the specific Web servers
® additional workspaces accessed from the Link To feature. These workspaces are described in the sections that follow the eBA*SM Detail Summary by Web Server Type table view description.
eBA*SM Detail Summary by Web Server Type
88 OMA for eBA Solutions User’s Guide, Version 251
Information presented in the eBA*SM Detail Summary by Web Server Type table view
The eBA*SM Detail Summary by Web Server Type table view displays response time data for the transactions being monitored, summarized by type of Web server. The information in this table view is reported by the eBA*SM Detail Summary by Web Server Type attributes. The following is a list of these attributes.
® Web Server Type
® Interval Start Time
® Interval (Min)
® Avg Response Time (Sec)
® Num of Trans
® Min Response Time (Sec)
® Max Response Time (Sec)
® Avg Browse Time (Sec)
® Avg Load Time (Sec)
® Avg Resolve Time (Sec)
® Avg Verification Time (Sec)
® Avg Service Time (Sec)
® Avg Server Time (Sec)
® Min Server Time (Sec)
® Max Server Time (Sec)
® Total Load Time (Sec)
For detailed descriptions of the eBA*SM Detail Summary by Web Server Type attributes, refer to the CandleNet Portal online Help for OMA for eBA Solutions.

Workspaces Accessed from CandleNet Portal 89
eBA*SM Detail Summary by Web Server Type
Response Times by ServerUse this workspace to see response time data for servers, using a specific Web server type.
This workspace also contains a chart that shows the response time on servers using a particular Web server type, and that shows data for these columns:
® Average Response Time (Sec)
® Maximum Response Time (Sec)
® Minimum Response Time (Sec)
Transaction Summary
Use this workspace to see transaction summary data for a particular Web server.
This workspace also contains a chart that shows data for these columns:
® Average Response Time (Sec)
® Maximum Response Time (Sec)
® Minimum Response Time (Sec)
Transaction Details. Use this workspace to see detail transaction data, summarized for a specific server.
Response Times by TransactionsUse this workspace to view transaction summary data for servers using a specific Web server type.
This workspace also contains a chart that shows data for these columns:
® Average Response Time (Sec)
® Maximum Response Time (Sec)
® Minimum Response Time (Sec)
Transaction Details
Use this workspace to see detail transaction data, summarized for a specific Web server type.
eBA*SM Object by Client Host
90 OMA for eBA Solutions User’s Guide, Version 251
eBA*SM Object by Client Host
OverviewThis predefined workspace displays object data, summarized by the client host identifier. The data applies to the eBA*ServiceMonitor product running on a Web server. Use this workspace to determine which objects used intensive server time.
You can find out such data as the average time taken by the Web server to authenticate the request. You can also find out the number of transactions each client host has requested from a monitored server.
The columns in this workspace correspond to attributes you can use to create situations to monitor for specific conditions. You can also use the attributes to create your own workspace queries. See the CandleNet Portal help on creating situations and queries.
Contents of the eBA*SM Object by Client Host workspaceThe predefined eBA*SM Object by Client Host workspace contains the following items:
® an eBA*SM Object by Client Host table view that displays object data, summarized by the client host identifier
® a chart that displays the client hosts with the longest average server time, and that shows data for these columns:
– Average Server Time (Sec)
– Average Verify Time (Sec)
– Average Service Time (Sec)
® additional workspaces accessed from the Link To feature. These workspaces are described in the sections that follow the eBA*SM Object by Client Host table view description.
Workspaces Accessed from CandleNet Portal 91
eBA*SM Object by Client Host
Information presented in the eBA*SM Object by Client Host table viewThe eBA*SM Object by Client Host table view displays object data, summarized by the client host identifier. The information in this table view is reported by the eBA*SM Object by Client Host attributes. The following is a list of these attributes.
® Client Name
® Interval Start Time
® Interval (Min)
® Num Requests
® Avg Verification Time (Sec)
® Avg Server Time (Sec)
® Avg Verify Time (Sec)
® Avg Service Time (Sec)
® Max Server Time (Sec)
® Min Server Time (Sec)
® Max Verify Time (Sec)
® Min Verify Time (Sec)
® Max Service Time (Sec)
® Min Service Time (Sec)
For detailed descriptions of the eBA*SM Object by Client Host attributes, refer to the CandleNet Portal online Help for OMA for eBA Solutions.
Client Object SummaryUse this workspace to see object summary data for a specific client host, summarized by object name.
Object Details
Use this workspace to see detail data for a specific object.
eBA*SM Object by Client Host
92 OMA for eBA Solutions User’s Guide, Version 251
Client Object DetailsUse this workspace to view detail records for a specific client host, summarized by client name.
Workspaces Accessed from CandleNet Portal 93
eBA*SM Object by Object Name
eBA*SM Object by Object Name
OverviewThis predefined workspace displays object data, summarized by the object name. The data applies to the eBA*ServiceMonitor product running on a Web server.
You can find out such data as the average time taken by the Web server to service the request. You can also find out the number of times each object was requested.
The columns in this workspace correspond to attributes you can use to create situations to monitor for specific conditions. You can also use these attributes to create your own workspace queries. See the CandleNet Portal help on creating situations and queries.
Contents of the eBA*SM Object by Object Name workspaceThe predefined eBA*SM Object by Object Name workspace contains the following items:
® an eBA*SM Object by Object Name table view that displays object data, summarized by the object name
® a chart that displays the objects requiring the longest average server time, and that shows data for these columns:
– Average Server Time (Sec)
– Average Verify Time (Sec)
– Average Service Time (Sec)
® additional workspaces accessed from the Link To feature. These workspaces are described in the sections that follow the eBA*SM Object by Object Name table view description.
eBA*SM Object by Object Name
94 OMA for eBA Solutions User’s Guide, Version 251
Information presented in the eBA*SM Object by Object Name table view
The eBA*SM Object by Object Name table view displays object data, summarized by the object name. The information in this table view is reported by the eBA*SM Object by Object Name attributes. The following is a list of these attributes.
® Object Name
® Interval Start Time
® Interval (Min)
® Num Requests
® Avg Server Time (Sec)
® Avg Verify Time (Sec)
® Avg Service Time (Sec)
® Max Server Time (Sec)
® Max Verify Time (Sec)
® Min Verify Time (Sec)
® Max Service Time (Sec)
® Min Service Time (Sec)
For detailed descriptions of the eBA*SM Object by Object Name attributes, refer to the CandleNet Portal online Help for OMA for eBA Solutions.
Object DetailsUse this workspace to see object detail data for a specific object, summarized by client host identifier.
Workspaces Accessed from CandleNet Portal 95
eBA*SM Object by Server Host
eBA*SM Object by Server Host
OverviewThis predefined workspace displays Web page object data, summarized by the server host name. The data applies to the eBA*ServiceMonitor product running on a Web server.
You can find out such data as the average time taken by the Web server to service the request. You can also find out the number of objects each server processed during the specified interval.
The columns in this workspace correspond to attributes you can use to create situations to monitor for specific conditions. You can also use these attributes to create your own workspace queries. See the CandleNet Portal help on creating situations and queries.
Contents of the eBA*SM Object by Server Host workspaceThe predefined eBA*SM Object by Server Host workspace contains the following items:
® an eBA*SM Object by Server Host table view that displays object data, summarized by the server host name
® a chart that provides data for the servers with the longest average service response times, and that shows data for these columns:
– Average Server Time (Sec)
– Average Verify Time (Sec)
– Average Service Time (Sec)
® additional workspaces accessed from the Link To feature. These workspaces are described in the sections that follow the eBA*SM Object by Server Host table view description.
eBA*SM Object by Server Host
96 OMA for eBA Solutions User’s Guide, Version 251
Information presented in the eBA*SM Object by Server Host table view
The eBA*SM Object by Server Host table view displays object data, summarized by the server host name. The information in this table view is reported by the eBA*SM Object by Server Host attributes. The following is a list of these attributes.
® Server Name
® Interval Start Time
® Interval (Min)
® Num Requests
® Avg Server Time (Sec)
® Avg Verify Time (Sec)
® Avg Service Time (Sec)
® Max Server Time (Sec)
® Min Server Time (Sec)
® Max Verify Time (Sec)
® Min Verify Time (Sec)
® Max Service Time (Sec)
® Min Service Time (Sec)
For detailed descriptions of the eBA*SM Object by Server Host attributes, refer to the CandleNet Portal online Help for OMA for eBA Solutions.
Workspaces Accessed from CandleNet Portal 97
eBA*SM Object by Server Host
Clients ServedUse this workspace to view detail data for the clients served by a specific Web server, summarized by client name
This workspace also contains a chart that provides data for the clients running specific Web server,and that shows data for these columns:
– Average Server Time (Sec)
– Average Verify Time (Sec)
– Average Service Time (Sec)
Client Object Summary
Use this workspace to view data for the objects served by a specific client host, summarized by object name.
Object Details
Use this workspace view detail data for a specific object.
Objects ServedUse this workspace view detail data for objects served by a particular Web server.
Object Details
Use this workspace view detail data for a specific object.
Web Server Name SummaryUse this workspace to view data for your Web servers, summarized by Web server name.
This workspace also contains a chart that provides response time data for the Web servers, and that shows data for these columns:
– Average Server Time (Sec)
– Average Verify Time (Sec)
– Average Service Time (Sec)
eBA*SM Object by Server Host
98 OMA for eBA Solutions User’s Guide, Version 251
Object Summary
Use this workspace to view object summary data for the objects served by a specific Web server, summarized by object name.
Object Details. Use this workspace view detail data for a specific object.
Workspaces Accessed from CandleNet Portal 99
eBA*SM Object by Web Server Name
eBA*SM Object by Web Server Name
OverviewThis predefined workspace displays Web page object data, summarized by the Web server name. The data applies to the eBA*ServiceMonitor product running on a Web server. Use this workspace to obtain a summary of requests across all Web servers hosting a specific Web site.
You can find out such data as the average server time taken by the Web site to process each request. You can also find out the number of requests serviced by the Web server during the specified interval.
The columns in this workspace correspond to attributes you can use to create situations to monitor for specific conditions. You can also use the attributes to create your own workspace queries. See the CandleNet Portal help on creating situations and queries.
Contents of the eBA*SM Object by Web Server Name workspaceThe predefined eBA*SM Object by Web Server Name workspace contains the following items:
® an eBA*SM Object by Web Server Name table view that displays object data, summarized by the Web server name
® a chart that provides data for the Web servers with the highest average server time, and that shows data for these columns:
– Average Server Time (Sec)
– Average Verify Time (Sec)
– Average Service Time (Sec)
® additional workspaces accessed from the Link To feature. These workspaces are described in the sections that follow the eBA*SM Object by Web Server Name table view description.
eBA*SM Object by Web Server Name
100 OMA for eBA Solutions User’s Guide, Version 251
Information presented in the eBA*SM Object by Web Server Name table view
The eBA*SM Object by Web Server Name table view displays object data, summarized by the Web server name. The information in this table view is reported by the eBA*SM Object by Web Server Name attributes. The following is a list of these attributes.
® Web Server Name
® Interval Start Time
® Interval (Min)
® Num Requests
® Avg Server Time (Sec)
® Avg Verify Time (Sec)
® Avg Service Time (Sec)
® Max Server Time (Sec)
® Min Server Time (Sec)
® Max Verify Time (Sec)
® Min Verify Time (Sec)
® Max Service Time (Sec)
® Min Service Time (Sec)
For detailed descriptions of the eBA*SM Object by Web Server Name attributes, refer to the CandleNet Portal online Help for OMA for eBA Solutions.
Object SummaryUse this workspace to see Web page object summary data, summarized by object name.
Object Details
Use this workspace to see detail data for a specific object.
Workspaces Accessed from CandleNet Portal 101
eBA*SM Object by Web Server Name
Server Host SummaryUse this workspace to view summary data for Web servers, summarized by Web server name.
This workspace also contains a chart that provides response time data for the hosts serving a specific Web server, and that shows data for these columns:
– Average Server Time (Sec)
– Average Verify Time (Sec)
– Average Service Time (Sec)
Object Summary
Use this workspace to view object summary data for the objects served by a specific Web server, summarized by object name.
Object Details. Use this workspace view detail data for a specific object.
Client Summary
Use this workspace view detail data for the clients served by a specific Web server, summarized by client name.
This workspace also contains a chart that provides response time data for the clients served by a specific Web server, and that shows data for these columns:
– Average Server Time (Sec)
– Average Verify Time (Sec)
– Average Service Time (Sec)
Client Object Summary. Use this workspace to view summary data for the objects served by a specific client host, summarized by object name.
eBA*SM Object by Web Server Name
102 OMA for eBA Solutions User’s Guide, Version 251
Summary by Web Server Name
Use this workspace to view summary data for the Web sites accessed from a specific Web server.
This workspace also contains a chart that provides response time data for the clients served by a specific Web server, and that shows data for these columns:
– Average Server Time (Sec)
– Average Verify Time (Sec)
– Average Service Time (Sec)
Object Summary. Use this workspace to view summary data for the objects serviced by a specific server.
Object Details. Use this workspace to view detail data for a specific object serviced by a specific server.
Workspaces Accessed from CandleNet Portal 103
eBA*SM Object by Web Server Type
eBA*SM Object by Web Server Type
OverviewThis predefined workspace displays object data, summarized by the Web server type. The data applies to the eBA*ServiceMonitor product running on a Web server.
You can find out such data as the average time taken by the Web server type to authenticate the request. You can also find out the number of requests processed during the specified interval by each type of Web server.
The columns in this workspace correspond to attributes you can use to create situations to monitor for specific conditions. You can also use these attributes to create your own workspace queries. See the CandleNet Portal help on creating situations and queries.
Contents of the eBA*SM Object by Web Server Type workspaceThe predefined eBA*SM Object by Web Server Type workspace contains the following items:
® an eBA*SM Object by Web Server Type table view that displays object data, summarized by the Web server type
® a chart that shows the number of requests processed by each type of Web server used
® additional workspaces accessed from the Link To feature. These workspaces are described in the sections that follow the eBA*SM Object by Web Server Type table view description.
eBA*SM Object by Web Server Type
104 OMA for eBA Solutions User’s Guide, Version 251
Information presented in the eBA*SM Object by Web Server Type table view
The eBA*SM Object by Web Server Type table view displays object data, summarized by the Web server type. The information in this table view is reported by the eBA*SM Object by Web Server Type attributes. The following is a list of these attributes.
® Web Server Type
® Interval Start Time
® Interval (Min)
® Num Requests
® Avg Server Time (Sec)
® Avg Verify Time (Sec)
® Avg Service Time (Sec)
® Max Server Time (Sec)
® Min Server Time (Sec)
® Max Verify Time (Sec)
® Min Verify Time (Sec)
® Max Service Time (Sec)
® Min Service Time (Sec)
For detailed descriptions of the eBA*SM Object by Web Server Type attributes, refer to the CandleNet Portal online Help for OMA for eBA Solutions.
Workspaces Accessed from CandleNet Portal 105
eBA*SM Object by Web Server Type
Individual Server SummaryUse this workspace to see summary data about a Web server running a specific type of Web server.
This workspace also contains a chart that provides data for the servers running specific types of Web servers,and that shows data for these columns:
– Average Server Time (Sec)
– Average Verify Time (Sec)
– Average Service Time (Sec)
Object Summary
Use this workspace to see summary data for objects served bya specific Web server.
Client Summary
Use this workspace to view detail data for the clients served by a specific Web server, summarized by client name.
This workspace also contains a chart that provides data for the clients running Web servers,and that shows data for these columns:
– Average Server Time (Sec)
– Average Verify Time (Sec)
– Average Service Time (Sec)
Client Object Summary. Use this workspace to view summary data for the objects served by a specific client host, summarized by object name.
Object Details. Use this workspace view detail data for a specific object.
eBA*SM Object by Web Server Type
106 OMA for eBA Solutions User’s Guide, Version 251
Summary by Web Server Name
Use this workspace to view summary data for the Web servers running a specific type of Web server.
This workspace also contains a chart that provides response time data for the Web sites served by those Web servers, and that shows data for these columns:
– Average Server Time (Sec)
– Average Verify Time (Sec)
– Average Service Time (Sec)
Summary by Web Server NameUse this workspace to view summary data for the Web servers running a specific type of Web server.
This workspace also contains a chart that provides response time data for these Web servers, and that shows data for these columns:
– Average Server Time (Sec)
– Average Verify Time (Sec)
– Average Service Time (Sec)
Object Summary
Use this workspace to view object summary data for the objects served by a specific Web server, summarized by object name.
Object Details. Use this workspace view detail data for a specific object.
Workspaces Accessed from CandleNet Portal 107
eBA*SM3 Audio Summary by Object
eBA*SM3 Audio Summary by Object
OverviewThis predefined workspace displays audio summary data, listed by the audio object name. The data apply to the eBA*ServiceMonitor3 product.
You can find out such data as the average length of play time. You can also find out the number of transactions that occurred for a particular audio object.
The columns in this workspace correspond to attributes you can use to create your own workspace queries. See the CandleNet Portal help on creating queries.
Contents of the eBA*SM3 Audio Summary by Object workspaceThe predefined eBA*SM3 Audio Summary by Object workspace contains the following items:
® an eBA*SM3 Audio Summary by Object table view that displays audio summary data, listed by the audio object name
® a chart that shows the highest average response time for the slowest audio object being used
® additional workspaces accessed from the Link To feature. These workspaces are described in the sections that follow the eBA*SM3 Audio Summary by Object table view description.

eBA*SM3 Audio Summary by Object
108 OMA for eBA Solutions User’s Guide, Version 251
Information presented in the eBA*SM3 Audio Summary by Object table view
The eBA*SM3 Audio Summary by Object table view displays audio summary data, listed by the audio object name. Each column in this table view represents an attribute associated with the eBA*SM3 Audio Summary by Object attribute table. The following is a list of the columns that display in this table.
® Audio Obj Name
® Interval Start Time
® Interval (Min)
® Avg Response Time (Sec)
® Num of Trans
® Min Response Time (Sec)
® Max Response Time (Sec)
® Avg Play Time (Sec)
® Avg Network Time (Sec)
® Avg Request Packet
® Avg Reply Packet
® Avg Request Byte
® Avg Reply Byte
® Row Limit
For detailed descriptions of the eBA*SM3 Audio Summary by Object attributes, refer to the CandleNet Portal online Help for OMA for eBA Solutions.
Workspaces Accessed from CandleNet Portal 109
eBA*SM3 Audio Summary by Object
Summary by ClientUse this workspace to see audio summary data for a particular audio object, listed by client IP address.
This workspace also contains a chart that shows the slowest client for a particular audio object,and that shows data for these columns:
– Avg Response Time (Sec)
– Avg Network Time (Sec)
Audio Detail
Use this workspace to see detail statistics for a specific audio object at a specific client IP address.
eBA*SM3 Object Summary by Web Site
110 OMA for eBA Solutions User’s Guide, Version 251
eBA*SM3 Object Summary by Web Site
OverviewThis predefined workspace displays object summary data, listed by the Web site. The data apply to the eBA*ServiceMonitor3 product.
You can find out such data as the number of transactions monitored during the specified interval for a particular Web site. You can also find out the average time the browser spent rendering the Web page.
The columns in this workspace correspond to attributes you can use to create situations to monitor for specific conditions. You can also use these attributes to create your own workspace queries. See the CandleNet Portal help on creating situations and queries.
Contents of the eBA*SM3 Object Summary by Web Site workspaceThe predefined eBA*SM3 Object Summary by Web Site workspace contains the following items:
® an eBA*SM3 Object Summary by Web Site table view that displays object summary data, listed by the Web site name
® a chart that shows the highest average response time for the slowest Web site being used
® additional workspaces accessed from the Link To feature. These workspaces are described in the sections that follow the eBA*SM3 Object Summary by Web Site table view description.
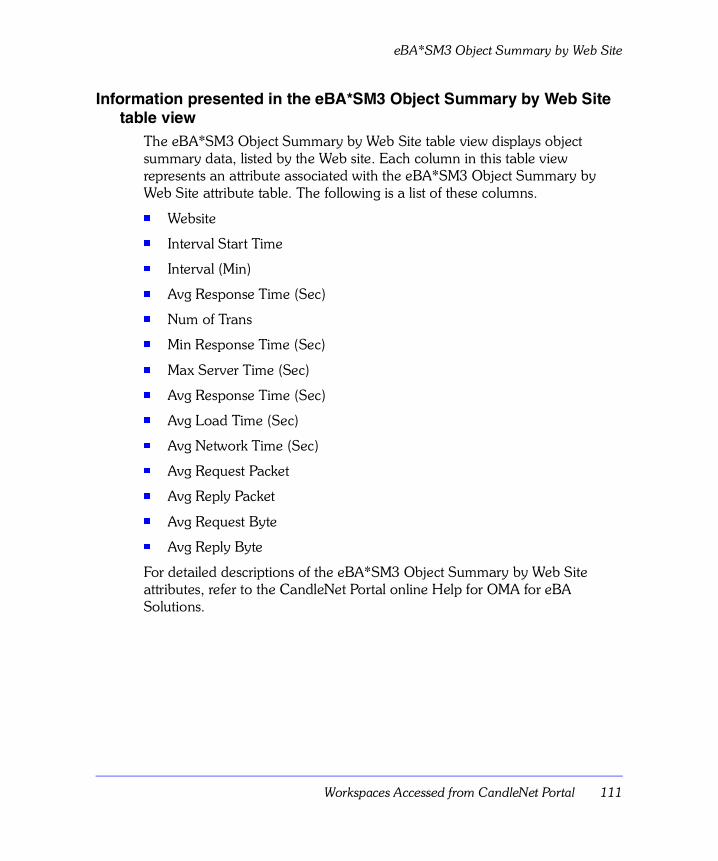
Workspaces Accessed from CandleNet Portal 111
eBA*SM3 Object Summary by Web Site
Information presented in the eBA*SM3 Object Summary by Web Site table view
The eBA*SM3 Object Summary by Web Site table view displays object summary data, listed by the Web site. Each column in this table view represents an attribute associated with the eBA*SM3 Object Summary by Web Site attribute table. The following is a list of these columns.
® Website
® Interval Start Time
® Interval (Min)
® Avg Response Time (Sec)
® Num of Trans
® Min Response Time (Sec)
® Max Server Time (Sec)
® Avg Response Time (Sec)
® Avg Load Time (Sec)
® Avg Network Time (Sec)
® Avg Request Packet
® Avg Reply Packet
® Avg Request Byte
® Avg Reply Byte
For detailed descriptions of the eBA*SM3 Object Summary by Web Site attributes, refer to the CandleNet Portal online Help for OMA for eBA Solutions.
eBA*SM3 Object Summary by Web Site
112 OMA for eBA Solutions User’s Guide, Version 251
Summary by ObjectUse this workspace to see HTTP Web page object summary data, listed by object name, for a particular Web site.
This workspace also contains a chart that shows the slowest object for a particular Web site,and that shows data for these columns:
– Avg Response Time (Sec)
– Avg Server Time (Sec)
– Avg Network Time (Sec)
Object Detail
Use this workspace to see detail statistics for a specific object at a specific Web site.
Summary by ClientUse this workspace to view object summary data for individual clients, listed by client IP address, for a particular Web site.
This workspace also contains a chart that provides data for the slowest client,and that shows data for these columns:
– Avg Response Time (Sec)
– Avg Server Time (Sec)
– Avg Network Time (Sec)
Object Detail
Use this workspace to see detail statistics for a specific client IP address, at a particular Web site.
Workspaces Accessed from CandleNet Portal 113
eBA*SM3 Page Alert Summary by Web Site
eBA*SM3 Page Alert Summary by Web Site
OverviewThis predefined workspace displays page alert summary data, listed by the Web site name. The data applies to the eBA*ServiceMonitor3 product.
You can find out such data as the average time taken by the Web server to process the request. You can also find out the number of alerts that occurred during the specified interval, and the average time elapsed between the user’s request and completion of the download.
The columns in this workspace correspond to attributes you can use to create situations to monitor for specific conditions. You can also use these attributes to create your own workspace queries. See the CandleNet Portal help on creating situations and queries.
Contents of the eBA*SM3 Page Alert Summary by Web Site workspace
The predefined eBA*SM3 Page Alert Summary by Web Site workspace contains the following items:
® an eBA*SM3 Page Alert Summary by Web Site table view that displays page alert summary data, listed by the Web site name
® a chart that shows the highest average response time for the slowest Web site being used
® additional workspaces accessed from the Link To feature. These workspaces are described in the sections that follow the eBA*SM3 Page Alert Summary by Web Site table view description.
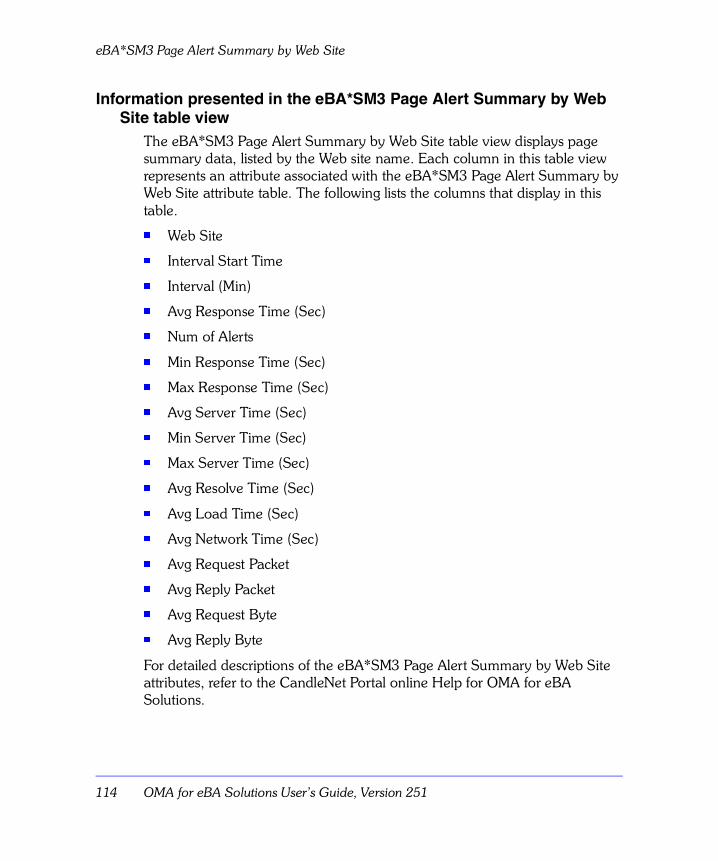
eBA*SM3 Page Alert Summary by Web Site
114 OMA for eBA Solutions User’s Guide, Version 251
Information presented in the eBA*SM3 Page Alert Summary by Web Site table view
The eBA*SM3 Page Alert Summary by Web Site table view displays page summary data, listed by the Web site name. Each column in this table view represents an attribute associated with the eBA*SM3 Page Alert Summary by Web Site attribute table. The following lists the columns that display in this table.
® Web Site
® Interval Start Time
® Interval (Min)
® Avg Response Time (Sec)
® Num of Alerts
® Min Response Time (Sec)
® Max Response Time (Sec)
® Avg Server Time (Sec)
® Min Server Time (Sec)
® Max Server Time (Sec)
® Avg Resolve Time (Sec)
® Avg Load Time (Sec)
® Avg Network Time (Sec)
® Avg Request Packet
® Avg Reply Packet
® Avg Request Byte
® Avg Reply Byte
For detailed descriptions of the eBA*SM3 Page Alert Summary by Web Site attributes, refer to the CandleNet Portal online Help for OMA for eBA Solutions.
Workspaces Accessed from CandleNet Portal 115
eBA*SM3 Page Alert Summary by Web Site
Summary by URLUse this workspace to see Web page alert summary data, listed by URL address, for a particular Web site.
This workspace also contains a chart that shows the slowest transaction,and that shows data for these columns:
– Avg Response Time (Sec)
– Avg Server Time (Sec)
– Avg Network Time (Sec)
Page Alert Detail
Use this workspace to see alert detail statistics, including IP address, for a specific URL at a specific Web site.
Summary by ClientUse this workspace to view summary data for individual clients, listed by client IP address, for a particular Web site.
This workspace also contains a chart that provides response time data for the slowest client,and that shows data for these columns:
– Avg Response Time (Sec)
– Avg Server Time (Sec)
– Avg Network Time (Sec)
Page Alert Detail
Use this workspace to see alert detail statistics for a specific client IP address, at a particular Web site.
eBA*SM3 Page Summary by Web Site
116 OMA for eBA Solutions User’s Guide, Version 251
eBA*SM3 Page Summary by Web Site
OverviewThis predefined workspace displays page summary data, summarized by the Web site. The data applies to the eBA*ServiceMonitor3 product.
You can find out such data as the number of transactions monitored during the specified interval for a particular Web site. You can also find out the average time elapsed between the user’s request and completion of the download.
The columns in this workspace correspond to attributes you can use to create situations to monitor for specific conditions. You can also use these attributes to create your own workspace queries. See the CandleNet Portal help on creating situations and queries.
Contents of the eBA*SM3 Page Summary by Web Site workspaceThe predefined eBA*SM3 Page Summary by Web Site workspace contains the following items:
® an eBA*SM3 Page Summary by Web Site table view that displays page summary data, summarized by the Web site
® a chart that shows the highest average response time for the slowest Web site being used
® additional workspaces accessed from the Link To feature. These workspaces are described in the sections that follow the eBA*SM3 Page Summary by Web Site table view description.
Workspaces Accessed from CandleNet Portal 117
eBA*SM3 Page Summary by Web Site
Information presented in the eBA*SM3 Page Summary by Web Site table view
The eBA*SM3 Page Summary by Web Site table view displays page summary data, summarized by the Web site. Each column in this table view represents an attribute associated with the eBA*SM3 Page Summary by Web Site attribute table. The following is a list of these columns.
® Website
® Interval Start Time
® Interval (Min)
® Avg Response Time (Sec)
® Num of Trans
® Min Response Time (Sec)
® Max Response Time (Sec)
® Avg Server Time (Sec)
® Min Server Time (Sec)
® Max Server Time (Sec)
® Avg Resolve Time (Sec)
® Avg Load Time (Sec)
® Avg Network Time (Sec)
® Avg Request Packet
® Avg Reply Packet
® Avg Request Byte
® Avg Reply Byte
For detailed descriptions of the eBA*SM3 Page Summary by Web Site attributes, refer to the CandleNet Portal online Help for OMA for eBA Solutions.
eBA*SM3 Page Summary by Web Site
118 OMA for eBA Solutions User’s Guide, Version 251
Summary by URLUse this workspace to see Web page summary data, listed by URL address, for a particular Web site.
This workspace also contains a chart that shows the slowest average transaction,and that shows data for these columns:
– Avg Response Time (Sec)
– Avg Server Time (Sec)
– Avg Network Time (Sec)
Page Detail
Use this workspace to see detail statistics for a specific URL at a specific Web site.
Summary by ClientUse this workspace to view summary data for individual clients, listed by client IP address, for a particular Web site.
This workspace also contains a chart that provides data for the slowest client,and that shows data for these columns:
– Avg Response Time (Sec)
– Avg Server Time (Sec)
– Avg Network Time (Sec)
Page Detail
Use this workspace to see detail statistics for a specific client IP address, at a particular Web site.
Workspaces Accessed from CandleNet Portal 119
eBA*SM3 Video Summary by Object
eBA*SM3 Video Summary by Object
OverviewThis predefined workspace displays video summary data, listed by the video object name. The data apply to the eBA*ServiceMonitor3 product.
You can find out such data as the average length of play time. You can also find out the number of transactions that occurred for a particular video object.
The columns in this workspace correspond to attributes you can use to create your own workspace queries. See the CandleNet Portal help on creating queries.
Contents of the eBA*SM3 Video Summary by Object workspaceThe predefined eBA*SM3 Video Summary by Object workspace contains the following items:
® an eBA*SM3 Video Summary by Object table view that displays video summary data, listed by the video object name
® a chart that shows the highest average response time for the slowest video object being used
® additional workspaces accessed from the Link To feature. These workspaces are described in the sections that follow the eBA*SM3 Video Summary by Object table view description.
eBA*SM3 Video Summary by Object
120 OMA for eBA Solutions User’s Guide, Version 251
Information presented in the eBA*SM3 Video Summary by Object table view
The eBA*SM3 Video Summary by Object table view displays video summary data, listed by the video object name. Each column in this table view represents an attribute associated with the eBA*SM3 Video Summary by Object attribute table. The following is a list of the columns that display in this table.
® Video Obj Name
® Interval Start Time
® Interval (Min)
® Avg Response Time (Sec)
® Num of Trans
® Min Response Time (Sec)
® Max Response Time (Sec)
® Avg Play Time (Sec)
® Avg Network Time (Sec)
® Avg Request Packet
® Avg Reply Packet
® Avg Request Byte
® Avg Reply Byte
® Row Limit
For detailed descriptions of the eBA*SM3 Video Summary by Object attributes, refer to the CandleNet Portal online Help for OMA for eBA Solutions.

Workspaces Accessed from CandleNet Portal 121
eBA*SM3 Video Summary by Object
Summary by ClientUse this workspace to see video summary data for a particular video object, listed by client IP address.
This workspace also contains a chart that shows the slowest client for a particular video object,and that shows data for these columns:
– Avg Response Time (Sec)
– Avg Play Time (Sec)
Video Detail
Use this workspace to see detail statistics for a specific video object at a specific client IP address.
ETEWatch Response by Application
122 OMA for eBA Solutions User’s Guide, Version 251
ETEWatch Response by Application
OverviewThis predefined workspace displays data on average response times over the interval you specify, for each application that you are monitoring. You can find out such data as the average response time of all transactions monitored during this interval for a particular application. You can also find out which transactions were the slowest.
Additionally, if segmentation is enabled at the Manager Client workstation, you will see data for Average Client Time, for Average Network Time, and for Average Application Time.
The columns in this workspace correspond to attributes you can use to create situations to monitor for specific conditions. You can also use the attributes to create your own workspace queries. See the CandleNet Portal help on creating situations and queries.
Contents of the ETEWatch Response by Application workspaceThe predefined ETEWatch Response by Application workspace contains the following items:
® an ETEWatch Response by Application table view that displays response time, summarized by application
® a chart that shows response time data for each application, for these columns:
– Average Response Time (Sec)
– Maximum Response Time (Sec)
– Minimum Response Time (Sec)
® additional workspaces accessed from the Link To feature. These workspaces are described in the sections that follow the ETEWatch Response by Application table view description.
Workspaces Accessed from CandleNet Portal 123
ETEWatch Response by Application
Information presented in the ETEWatch Response by Application table view
The ETEWatch Response by Application table view displays response time data for each application or Web browser being monitored, summarized by application name. The information in this table view is reported by the ETEWatch Response by Application attributes. The following is a list of these attributes.
® Application Name
® Interval Start Time
® Interval (Min)
® Avg Response Time (Sec)
® Number of Transactions
® Min Response Time (Sec)
® Max Response Time (Sec)
® Avg Connect Time (Sec)
® Avg Download Time (Sec)
® Avg Client Time (Sec)
® Avg Network Time (Sec)
® Avg Application Time (Sec)
For detailed descriptions of the ETEWatch Response by Application attributes, refer to the CandleNet Portal online Help for OMA for eBA Solutions.
ETEWatch Response by Application
124 OMA for eBA Solutions User’s Guide, Version 251
Response Time by Client HostsUse this workspace to see response time data, summarized by client host name.
This workspace also contains a chart that shows the response time data for each client host, and that shows data for these columns:
® Average Response Time (Sec)
® Maximum Response Time (Sec)
® Minimum Response Time (Sec)
Transactions on Host
Use this workspace to see response time data, summarized by transaction.
This workspace also contains a chart that shows the response time data for these columns:
® Average Response Time (Sec)
® Maximum Response Time (Sec)
® Minimum Response Time (Sec)
Detail Transactions
Use this workspace to see detail data relating to individual transactions.
Transaction Response TimesUse this workspace to see transaction detail data, summarized by host name.
Detail Transactions
Use this workspace to see detail data relating to individual transactions.
Workspaces Accessed from CandleNet Portal 125
ETEWatch Response by Client Host
ETEWatch Response by Client Host
OverviewThis predefined workspace displays response time data over the interval you specify for each application that you are monitoring, summarized by client host. You can find out such data as the number of transactions monitored during the specified interval for a particular application. You can also find out the average response time for all transactions across all applications for each client host.
Additionally, if segmentation is enabled at the Manager Client workstation, you will see data for Average Client Time, for Average Network Time, and for Average Application Time.
The columns in this workspace correspond to attributes you can use to create situations to monitor for specific conditions. You can also use the attributes to create your own workspace queries. See the CandleNet Portal help on creating situations and queries.
Contents of the ETEWatch Response by Client Host workspaceThe predefined ETEWatch Response by Client Host workspace contains the following items:
® an ETEWatch Response by Client Host table view that displays response time, summarized by client host name
® a chart that shows response time data that occurred for the five slowest transactions, for these columns:
– Average Response Time (Sec)
– Maximum Response Time (Sec)
– Minimum Response Time (Sec)
® additional workspaces accessed from the Link To feature. These workspaces are described in the sections that follow the ETEWatch Response by Client Host table view description.
ETEWatch Response by Client Host
126 OMA for eBA Solutions User’s Guide, Version 251
Information presented in the ETEWatch Response by Client Host table view
The ETEWatch Response by Client Host table view displays response time data for each application or Web browser being monitored, summarized by client host name. The information in this table view is reported by the ETEWatch Response by Client Host attributes. The following is a list of these attributes.
® Client Hostname
® Interval Start Time
® Interval (Min)
® Avg Response Time (Sec)
® Number of Transactions
® Min Response Time (Sec)
® Max Response Time (Sec)
® Avg Connect Time (Sec)
® Avg Download Time (Sec)
® Avg Client Time (Sec)
® Avg Network Time (Sec)
® Avg Application Time (Sec)
For detailed descriptions of the ETEWatch Response by Client Host attributes, refer to the CandleNet Portal online Help for OMA for eBA Solutions.
Transaction DetailsUse this workspace to view detail response time data for individual transactions.
Workspaces Accessed from CandleNet Portal 127
ETEWatch Response by Client Host
Application Response on HostUse this workspace to view response time data for individual applications on a specific host.
This workspace also contains a chart that shows data for a specific host for these columns:
® Average Response Time (Sec)
® Maximum Response Time (Sec)
® Minimum Response Time (Sec)
For detailed descriptions of these attributes, refer to the CandleNet Portal online Help for OMA for eBA Solutions.
ETEWatch Response by Transaction
128 OMA for eBA Solutions User’s Guide, Version 251
ETEWatch Response by Transaction
OverviewThis predefined workspace displays data on response time data over the interval you specify, for each transaction that you are monitoring. You can also find out the average time between the user’s request and the browser’s successful connection with the Web server, for all transactions.
Additionally, if segmentation is enabled at the Manager Client workstation, you will see data for Average Client Time, for Average Network Time, and for Average Application Time.
The columns in this workspace correspond to attributes you can use to create situations to monitor for specific conditions. You can also use these attributes to create your own workspace queries. See the CandleNet Portal help on creating situations and queries.
Contents of the ETEWatch Response by Transaction workspaceThe predefined ETEWatch Response by Transaction workspace contains the following items:
® an ETEWatch Response by Transaction table view that displays response time, summarized by transaction
® a chart that shows response time data for the five slowest transactions, with data for these columns:
– Average Response Time (Sec)
– Maximum Response Time (Sec)
– Minimum Response Time (Sec)
® additional workspaces accessed from the Link To feature. These workspaces are described in the sections that follow the ETEWatch ETEWatch Response by Transaction table view description.
Workspaces Accessed from CandleNet Portal 129
ETEWatch Response by Transaction
Information presented in the ETEWatch Response by Transaction table view
The ETEWatch Response by Transaction table view displays response time data for each transaction being monitored. The information in this table view is reported by the ETEWatch Response by Transaction attributes. The following is a list of these attributes.
® Transaction
® Interval Start Time
® Interval (Min)
® Avg Response Time (Sec)
® Number of Transactions
® Min Response Time (Sec)
® Max Response Time (Sec)
® Avg Connect Time (Sec)
® Avg Download Time (Sec)
® Avg Client Time (Sec)
® Avg Network Time (Sec)
® Avg Application Time (Sec)
For detailed descriptions of the ETEWatch Response by Transaction attributes, refer to the CandleNet Portal online Help for OMA for eBA Solutions.
Transaction Response by Client HostUse this workspace to view transaction response time data for client hosts.
This workspace also contains a chart that shows client host response time by URL transaction, and that shows data for:
® Average Response Time (Sec)
® Maximum Response Time (Sec)
® Minimum Response Time (Sec)
ETEWatch Response by Transaction
130 OMA for eBA Solutions User’s Guide, Version 251
Transactions on Host
Use this workspace to view response time data for individual transactions on a specific client host.
This workspace also contains a chart that shows response time data by URL transaction, and that shows data for:
® Average Response Time (Sec)
® Maximum Response Time (Sec)
® Minimum Response Time (Sec)
Transaction Details. Use this workspace to view response time data for individual transactions on a specific client host.
Transaction Details on Host
Use this workspace to view response time data for individual transactions on a specific client host, summarized by URL transaction.
Transaction DetailsUse this workspace to view response time data for individual transactions, summarized by URL transaction.
Workspaces Accessed from CandleNet Portal 131
SitePulse (eBA SP) Consensus Script Alert Summary
SitePulse (eBA SP) Consensus Script Alert Summary
OverviewThis predefined workspace displays consensus script alert summary data. A consensus alert occurs when the Web site testing agents at all monitoring locations detect a problem.The data applies to the SitePulse product.
You can find out such data as the script name, the number of alerts raised, and the total amount of time an alert has been raised. You can also find out the scripts with the most number of alerts raised.
The columns in this workspace correspond to attributes you can use to create situations to monitor for specific conditions. You can also use these attributes to create your own workspace queries. See the CandleNet Portal help on creating situations and queries.
Contents of the eBA SP Consensus Script Alert Summary workspaceThe predefined eBA SP Consensus Script Alert Summary workspace contains the following items:
® an eBA SP Consensus Script Alert Summary table view that displays consensus script alert summary data
® a chart that shows the scripts generating the most alerts, specifying the number of alerts raised for each script
® an additional workspace accessed from the Link To feature. This workspace is described in the section that follows the eBA SP Consensus Script Alert Summary table view description.
SitePulse (eBA SP) Consensus Script Alert Summary
132 OMA for eBA Solutions User’s Guide, Version 251
Information presented in the eBA SP Consensus Script Alert Summary table view
The eBA SP Consensus Script Alert Summary table view displays consensus script alert summary data. The information in this table view is reported by the eBA SP Consensus Script Alert Summary attributes. The following is a list of these attributes.
® Script Name
® Interval Start Time
® Interval (Min)
® Num Alerts
® Total Alert Time (Min)
For detailed descriptions of the eBA SP Consensus Script Alert Summary attributes, refer to the CandleNet Portal online Help for OMA for eBA Solutions.
Alert DetailsUse this workspace to see detail data about consensus alerts.
This workspace also contains a chart that provides data for the scripts with the most alerts, specified by the number of alerts raised.
Workspaces Accessed from CandleNet Portal 133
SitePulse (eBA SP) Consensus URL Alert Summary
SitePulse (eBA SP) Consensus URL Alert Summary
OverviewThis predefined workspace displays consensus URL alert summary data. A consensus alert occurs when the Web site testing agents at all monitoring locations detect a problem.The data applies to the SitePulse product.
You can find out such data as the URLs generating the most alerts. You can also find out the total amount of time an alert has been raised.
The columns in this workspace correspond to attributes you can use to create situations to monitor for specific conditions. You can also use these attributes to create your own workspace queries. See the CandleNet Portal help on creating situations and queries.
Contents of the eBA SP Consensus URL Alert Summary workspaceThe predefined eBA SP Consensus URL Alert Summary workspace contains the following items:
® an eBA SP Consensus URL Alert Summary table view that displays consensus URL alert summary data
® a chart that shows the URLs generating the most alerts, specifying the number of alerts raised for each URL
® an additional workspace accessed from the Link To feature. This workspace is described in the section that follows the eBA SP Consensus URL Alert Summary table view description.
SitePulse (eBA SP) Consensus URL Alert Summary
134 OMA for eBA Solutions User’s Guide, Version 251
Information presented in the eBA SP Consensus URL Alert Summary table view
The eBA SP Consensus URL Alert Summary table view displays consensus URL alert summary data. The information in this table view is reported by the eBA SP Consensus URL Alert Summary attributes. The following is a list of these attributes.
® URL
® Interval Start Time
® Interval (Min)
® Num Alerts
® Total Alert Time (Min)
For detailed descriptions of the eBA SP Consensus URL Alert Summary attributes, refer to the CandleNet Portal online Help for OMA for eBA Solutions.
Consensus Alert DetailsUse this workspace to see detail data about consensus alerts.
This workspace also contains a chart that provides data for the URLs with the most alerts, specified by the number of alerts raised.
Workspaces Accessed from CandleNet Portal 135
SitePulse (eBA SP) Location Alert Summary
SitePulse (eBA SP) Location Alert Summary
OverviewThis predefined workspace displays location alert summary data. A location alert occurs when a testing agent at any monitoring location detects a problem. The data applies to the SitePulse product.
You can find out such data as the location name, the number of alerts raised, and the total amount of time the location was not available during the specified interval. You can also find out the locations generating the most number of alerts.
The columns in this workspace correspond to attributes you can use to create situations to monitor for specific conditions. You can also use these attributes to create your own workspace queries. See the CandleNet Portal help on creating situations and queries.
Contents of the eBA SP Location Alert Summary workspaceThe predefined eBA SP Location Alert Summary workspace contains the following items:
® an eBA SP Location Alert Summary table view that displays location alert summary data
® a chart that shows the locations generating the most alerts, specifying the number of alerts raised for each location
® an additional workspace accessed from the Link To feature. This workspace is described in the section that follows the eBA SP Location Alert Summary table view description.
SitePulse (eBA SP) Location Alert Summary
136 OMA for eBA Solutions User’s Guide, Version 251
Information presented in the eBA SP Location Alert Summary table view
The eBA SP Location Alert Summary table view displays consensus script alert summary data. The information in this table view is reported by the eBA SP Location Alert Summary attributes. The following is a list of these attributes.
® Location
® Interval Start Time
® Interval (Min)
® Num Alerts
® Total Time Missed (Min)
For detailed descriptions of the eBA SP Location Alert Summary attributes, refer to the CandleNet Portal online Help for OMA for eBA Solutions.
Location Alert DetailsUse this workspace to see detail data about location alerts.
This workspace also contains a chart that provides data for the locations with the most alerts, specified by the number of alerts raised.
Workspaces Accessed from CandleNet Portal 137
SitePulse (eBA SP) Script Alert Summary
SitePulse (eBA SP) Script Alert Summary
OverviewThis predefined workspace displays script alert summary data. The data applies to the SitePulse product.
You can find out such data as the name of the script being monitored and the number of alerts raised. You can also find out the scripts generating the most number of alerts.
The columns in this workspace correspond to attributes you can use to create situations to monitor for specific conditions. You can also use these attributes to create your own workspace queries. See the CandleNet Portal help on creating situations and queries.
Contents of the eBA SP Script Alert Summary workspaceThe predefined eBA SP Script Alert Summary workspace contains the following items:
® an eBA SP Script Alert Summary table view that displays script alert summary data
® a chart that shows the scripts generating the most alerts
® additional workspaces accessed from the Link To feature. These workspaces are described in the sections that follow the eBA SP Script Alert Summary table view description.
SitePulse (eBA SP) Script Alert Summary
138 OMA for eBA Solutions User’s Guide, Version 251
Information presented in the eBA SP Script Alert Summary table viewThe eBA SP Script Alert Summary table view displays script alert summary data. The information in this table view is reported by the eBA SP Script Alert Summary attributes. The following is a list of these attributes.
® Script Name
® Interval Start Time
® Interval (Min)
® Num Alerts
For detailed descriptions of the eBA SP Script Alert Summary attributes, refer to the CandleNet Portal online Help for OMA for eBA Solutions.
Alerts by LocationUse this workspace to see detail data about location alerts.
This workspace also contains a chart that provides data for the alerts by location, specified by the name of the monitored URL.
Alert Details
Use this workspace to see detail data about script alerts.
Alert DetailsUse this workspace to see detail data about script alerts.
For detailed descriptions of these attributes, refer to the CandleNet Portal online Help for OMA for eBA Solutions.
Workspaces Accessed from CandleNet Portal 139
SitePulse (eBA SP) Script Alert Summary by Location
SitePulse (eBA SP) Script Alert Summary by Location
OverviewThis predefined workspace displays script alert summary by location data. The data applies to the SitePulse product.
You can find out such data as the name of the URL being monitored. You can also find out the number of alerts associated with each URL.
The columns in this workspace correspond to attributes you can use to create situations to monitor for specific conditions. You can also use these attributes to create your own workspace queries. See the CandleNet Portal help on creating situations and on creating queries.
Contents of the eBA SP Script Alert Summary by Location workspaceThe predefined eBA SP Script Alert Summary by Location workspace contains the following items:
® an eBA SP Script Alert Summary by Location table view that displays script alert summary by location data
® a chart that shows the scripts generating the most number of alerts
® additional workspaces accessed from the Link To feature. These workspaces are described in the sections that follow the eBA SP Script Alert Summary by Location table view description.
SitePulse (eBA SP) Script Alert Summary by Location
140 OMA for eBA Solutions User’s Guide, Version 251
Information presented in the eBA SP Script Alert Summary by Location table view
The eBA SP Script Alert Summary by Location table view displays consensus script alert summary data. The information in this table view is reported by the eBA SP Script Alert Summary attributes. The following is a list of these attributes.
® Location
® Interval Start Time
® Interval (Min)
® Num Alerts
For detailed descriptions of the eBA SP Script Alert Summary attributes, refer to the CandleNet Portal online Help for OMA for eBA Solutions.
Alerts by ScriptUse this workspace to see detail data about script alerts.
This workspace also contains a chart showing the number of alerts for a specific URL.
Alert Details
Use this workspace to see alert data for a specific URL, summarized by script name.

Workspaces Accessed from CandleNet Portal 141
SitePulse (eBA SP) Script Availability Summary
SitePulse (eBA SP) Script Availability Summary
OverviewThis predefined workspace displays script availability summary data. The data applies to the SitePulse product.
You can find out such data as the percentage of time the script being monitored was available. You can also find out response time statistics for individual scripts.
The columns in this workspace correspond to attributes you can use to create your own workspace queries. See the CandleNet Portal help on creating queries.
Contents of the eBA SP Script Availability Summary workspaceThe predefined eBA SP Script Availability Summary workspace contains the following items:
® an eBA SP Script Availability Summary table view that displays script availability summary data
® a chart that shows the percentage of time for the scripts with the poorest availability
® additional workspaces accessed from the Link To feature. These workspaces are described in the sections that follow the eBA SP Script Availability Summary table view description.
SitePulse (eBA SP) Script Availability Summary
142 OMA for eBA Solutions User’s Guide, Version 251
Information presented in the eBA SP Script Availability Summary table view
The eBA SP Script Availability Summary table view displays script availability summary data. The information in this table view is reported by the eBA SP Script Summary attributes. The following is a list of these attributes.
® Script Name
® Num Samples
® % Availability
® Average Response Time
® Maximum Response Time
® Minimum Response Time
® Interval Start Time
® Interval (Min)
For detailed descriptions of the eBA SP Script Summary attributes, refer to the CandleNet Portal online Help for OMA for eBA Solutions.
Availability by LocationUse this workspace to see summary data response time statistics on percentage of availability, for a specific location.
This workspace also contains a chart that shows the locations with the worst response time statistics.
Sample Details
Use this workspace to see sample detail data for a specific URL, summarized by script name.
Workspaces Accessed from CandleNet Portal 143
SitePulse (eBA SP) Script Response Time Summary
SitePulse (eBA SP) Script Response Time Summary
OverviewThis predefined workspace displays script response time statistics, summarized by script name. The data applies to the SitePulse product.
You can find out such data as the percentage of time the script being monitored was available. You can also find out response time statistics for individual scripts.
The columns in this workspace correspond to attributes you can use to create your own workspace queries. See the CandleNet Portal help on creating queries.
Contents of the eBA SP Script Response Time Summary workspaceThe predefined eBA SP Script Response Time Summary workspace contains the following items:
® an eBA SP Script Response Time Summary table view that displays script response time summary data
® a chart that shows the scripts with the worst average response times
® additional workspaces accessed from the Link To feature. These workspaces are described in the sections that follow the eBA SP Script Response Time Summary table view description.
SitePulse (eBA SP) Script Response Time Summary
144 OMA for eBA Solutions User’s Guide, Version 251
Information presented in the eBA SP Script Response Time Summary table view
The eBA SP Script Response Time Summary table view displays script availability summary data. The information in this table view is reported by the eBA SP Script Summary attributes. The following is a list of these attributes.
® Script Name
® Num Samples
® % Availability
® Average Response Time
® Maximum Response Time
® Minimum Response Time
® Interval Start Time
® Interval (Min)
For detailed descriptions of the eBA SP Script Summary attributes, refer to the CandleNet Portal online Help for OMA for eBA Solutions.
Response Time by LocationUse this workspace to see summary data response time statistics for specific URS, by location.
This workspace also contains a chart that shows the locations with the worst average response times.
Sample Details
Use this workspace to see sample detail data for a specific URL, summarized by script name.
Workspaces Accessed from CandleNet Portal 145
SitePulse (eBA SP) URL Alert Summary
SitePulse (eBA SP) URL Alert Summary
OverviewThis predefined workspace displays URL alert summary data. The data applies to the SitePulse product.
You can find out such data as the name of the URL being monitored. You can also find out the number of alerts associated with each URL, enabling you to focus on the URLs generating the most alerts.
The columns in this workspace correspond to attributes you can use to create situations to monitor for specific conditions. You can also use these attributes to create your own workspace queries. See the CandleNet Portal help on creating situations and queries.
Contents of the eBA SP URL Alert Summary workspaceThe predefined eBA SP URL Alert Summary workspace contains the following items:
® an eBA SP URL Alert Summary table view that displays URL alert summary data
® a chart that shows the URLs generating the most alerts, specifying the number of alerts raised for each URL
® additional workspaces accessed from the Link To feature. These workspaces are described in the sections that follow the eBA SP URL Alert Summary table view description.
SitePulse (eBA SP) URL Alert Summary
146 OMA for eBA Solutions User’s Guide, Version 251
Information presented in the eBA SP URL Alert Summary table viewThe eBA SP URL Alert Summary table view displays URL alert summary data. The information in this table view is reported by the eBA SP URL Alert Summary attributes. The following is a list of these attributes.
® URL
® Interval Start Time
® Interval (Min)
® Num Alerts
For detailed descriptions of the eBA SP URL Alert Summary attributes, refer to the CandleNet Portal online Help for OMA for eBA Solutions.
Alerts by LocationUse this workspace to view the availability and response time statistics of each monitored URL, as well as showing the number of alerts associated with each URL.
This workspace also contains a chart that shows the number of alerts associated with each URL.
Alert Details
Use this workspace to see alert detail data for a specific URL being monitored.
Alert DetailsUse this workspace to see alert detail data for a specific URL being monitored.
Workspaces Accessed from CandleNet Portal 147
SitePulse (eBA SP) URL Alert Summary by Location
SitePulse (eBA SP) URL Alert Summary by Location
OverviewThis predefined workspace displays URL alert summary by location data. The data applies to the SitePulse product.
You can find out such data as the name of the URL being monitored. You can also find out the locations with the most number of URL alerts.
The columns in this workspace correspond to attributes you can use to create your own workspace queries. See the CandleNet Portal help on creating queries.
Contents of the eBA SP URL Alert Summary by Location workspaceThe predefined eBA SP URL Alert Summary by Location workspace contains the following items:
® an eBA SP URL Alert Summary by Location table view that displays URL alert summary data
® a chart that lists the locations generating the most URL alerts
® additional workspaces accessed from the Link To feature. These workspace are described in the section that follows the eBA SP URL Alert Summary by Location table view description.
SitePulse (eBA SP) URL Alert Summary by Location
148 OMA for eBA Solutions User’s Guide, Version 251
Information presented in the eBA SP URL Alert Summary by Location table view
The eBA SP URL Alert Summary by Location table view displays URL alert summary by location data. The information in this table view is reported by the eBA SP URL Summary attributes. The following is a list of these attributes.
® Location
® Interval Start Time
® Interval (Min)
® Num Alerts
For detailed descriptions of these attributes, refer to the CandleNet Portal online Help for OMA for eBA Solutions.
Summary by URLUse this workspace to view the availability and response time statistics of each monitored URL, as well as showing the number of alerts associated with each URL.
This workspace also contains a chart that shows the number of alerts associated with each location.
Alert Details
Use this workspace to see alert detail data for a specific URL being monitored at a specific location.
Alert DetailsUse this workspace to see alert detail data for a specific URL being monitored at a specific location.
Workspaces Accessed from CandleNet Portal 149
SitePulse (eBA SP) URL Availability Summary
SitePulse (eBA SP) URL Availability Summary
OverviewThis predefined workspace displays URL availability summary data. The data applies to the SitePulse product.
You can find out such data as the percentage of time the URL being monitored was available. You can also find out the response time statistics for each URL.
The columns in this workspace correspond to attributes you can use to create your own workspace queries. See the CandleNet Portal help on creating queries.
Contents of the eBA SP URL Availability Summary workspaceThe predefined eBA SP URL Availability Summary workspace contains the following items:
® an eBA SP URL Availability Summary table view that displays URL alert summary data
® a chart that lists the URLs with the worst availability statistics, by percentage of availability
® additional workspaces accessed from the Link To feature. These workspaces are described in the sections that follow the eBA SP URL Availability Summary table view description.
SitePulse (eBA SP) URL Availability Summary
150 OMA for eBA Solutions User’s Guide, Version 251
Information presented in the eBA SP URL Availability Summary table view
The eBA SP URL Availability Summary table view displays URL availability summary data across all locations. The information in this table view is reported by the eBA SP URL Summary attributes. The following is a list of these attributes.
® URL
® % Availability
® Average Response Time
® Maximum Response Time
® Interval Start Time
® Interval (Min)
For detailed descriptions of these attributes, refer to the CandleNet Portal online Help for OMA for eBA Solutions.
Availability by LocationUse this workspace to view the availability and response time statistics of each monitored URL.
This workspace also contains a chart that shows average response time of a specific location.
Sample DetailsUse this workspace to see detail data for a specific URL being monitored at a specific location.
Workspaces Accessed from CandleNet Portal 151
SitePulse (eBA SP) URL Response Time Summary
SitePulse (eBA SP) URL Response Time Summary
OverviewThis predefined workspace displays URL response time summary data. The data applies to the SitePulse product.
You can find out such data as the percentage of time the URL being monitored was available. You can also find out the response time statistics for each monitored URL.
The columns in this workspace correspond to attributes you can use to create your own workspace queries. See the CandleNet Portal help on creating queries.
Contents of the eBA SP URL Response Time Summary workspaceThe predefined eBA SP URL Response Time Summary workspace contains the following items:
® an eBA SP URL Response Time Summary table view that displays URL response time summary data
® a chart that lists the monitored URLs with the worst average response times
® additional workspaces accessed from the Link To feature. These workspaces are described in the sections that follow the eBA SP URL Response Time Summary table view description.
SitePulse (eBA SP) URL Response Time Summary
152 OMA for eBA Solutions User’s Guide, Version 251
Information presented in the eBA SP URL Response Time Summary table view
The eBA SP URL Response Time Summary table view displays URL response time summary data. The information in this table view is reported by the eBA SP URL Summary attributes. The following is a list of these attributes.
® URL
® % Availability
® Average Response Time
® Maximum Response Time
® Minimum Response Time
® Interval Start Time
® Interval (Min)
For detailed descriptions of these attributes, refer to the CandleNet Portal online Help for OMA for eBA Solutions.
Response Time by LocationUse this workspace to view the response time statistics for each monitored URL, summarized by location.
This workspace also contains a chart that shows the average response times by location.
Sample Details
Use this workspace to see detail data for a specific URL being monitored.
Reports Accessed from CMW 153
Reports Accessed fromCMW
IntroductionThis chapter describes the four types of response time reports that OMA for eBA Solutions provides. These reports are available from the CMW and are accessed from the Reports folder.
Chapter ContentsIntroducing Response Time Reports . . . . . . . . . . . . . . . . . . . . . . . . . . . . 154General Information about Reports . . . . . . . . . . . . . . . . . . . . . . . . . . . . 156Response Time Detail Reports . . . . . . . . . . . . . . . . . . . . . . . . . . . . . . . . 157Response Time Alerts Report . . . . . . . . . . . . . . . . . . . . . . . . . . . . . . . . . 159Response Time Application Summary Reports . . . . . . . . . . . . . . . . . . . . 161Response Time Transaction Summary Reports . . . . . . . . . . . . . . . . . . . . 163
4
Introducing Response Time Reports
154 OMA for eBA Solutions User’s Guide, Version 251
Introducing Response Time Reports
OverviewOMA for eBA Solutions generates four types of response time reports:
® ETEWatch Response Time Detail Report
® ETEWatch Response Time Alerts Report
® ETEWatch Response Time Application Summary Report
® ETEWatch Response Time Transaction Summary Report
The information displayed in these reports is obtained from a database maintained by the Manager Server. Although it may have been obtained recently, the data in the reports is historical data.
Reports for applications supportedSeven reports are generated for each type of Response Time report, based on the applications and Web browsers that the OMA for eBA Solutions supports for the CMW interface.
These reports are:
® All Applications Report
® R/3 Clients Report
® Lotus Notes Clients Report
® PeopleSoft Clients Report
® Custom Clients Report
® Web Browsers Report
® eBA*ServiceMonitor Report (only available with Version 200)
See “Applications supported in Version 210” on page 46.
Reports Accessed from CMW 155
Introducing Response Time Reports
Accessing the ETEWatch Response Time reportsTo access one of the reports generated for each type of Response Time report, perform the steps that follow.
1. Double-click the a Response Time report icon, located in the CMW Reports folder.Result: The Managed System Selection window appears with a list of the active managed systems for which you can view data. Each row corresponds to a system on which you have installed a Manager Server.
2. Right-click on a managed system row and select one of the response time reports from the pop-up menu that displays.
Note: The default Response Time report is the All Applications Report, accessed when you double-click a managed system name in an open Response Time report.
Using response time reportsThe reports provided by OMA for eBA Solutions are useful for examining trends in response times for specific applications and for Web browsers. Suppose you have noticed the response time on a particular day is not as good as you would like. For example, say response time on Friday evening is not good. You can use the reports to further examine this trend. You can compare this Friday night’s response time with last Friday night’s response time or with the response time on Friday night of one year ago.
Available data in the reportsSettings within the Manager Client and Manager Server control what data is collected (detail, alert, summary) and at what interval data is sent to the Manager Server and therefore available to the OMA for eBA Solutions. Any combination of summary data can be consolidated at the Manager Server. A blank report may simply indicate that no data of the type requested is being collected at the Manager Server.
See the Consolidating Data chapter of either the CandleNet ETEWatch User’s Guide or the eBA*ServiceMonitor User’s Guide for details on the Manager Client and Manager Server Settings notebooks.
General Information about Reports
156 OMA for eBA Solutions User’s Guide, Version 251
General Information about Reports
Customizing reportsYou can customize a response time report in several ways:
® Use the Custom Report settings page to create reports for selected systems or reports with specific content.
® Use the Sort settings page to organize information based on the value of a specified parameter (for example, to display data ranked by response time).
® Use the Include settings page to include or exclude information in a particular range (for example, to display data only for response times greater than 1 minute).
® Use the Columns settings page to include or exclude columns in the report.
Click the Help button on each settings page for instructions on using that page.
Exporting report dataUse the Export feature to save the data as a flat file. You can then import the data into a database or spreadsheet for manipulation or formal reporting.
To access the exporting feature, select Export from the Report menu of an open response time report. To learn more about exporting data, click the Help button on the Export dialog box.
Reports Accessed from CMW 157
Response Time Detail Reports
Response Time Detail Reports
About the reportsThese reports present all detail data received by the Manager Server on the managed system you selected for a particular application. Each application report shows each response time measurement as a separate item.
Note: The default report is the Response Time Detail Report for All Applications, accessed when you double-click on a managed system name in an open Response Time Detail report.
Accessing reportsTo access a report:
1. Double-click the Response Time Detail report icon, located in the CMW Reports folder.
2. Right-click the Managed System you are interested in.
3. Select the report for the application for which you want to view data from the pop-up menu that displays.
4. Select the time interval for which you want to view data and press OK to display the Response Time Detail Report for that application.
Information presented in each reportFor each application, you can expect to see data for most or all of the columns that follow when you can examine a report:
® Transaction Start Time
® Response Time (Sec)
® Client Hostname
® Title
® Transaction Status
® Browse Time (Sec)
® Browse Interest
Response Time Detail Reports
158 OMA for eBA Solutions User’s Guide, Version 251
® Application Type
® Application EXE
® Application Name
® Client Nickname
® IP Hostname
® IP Network Name
® IP Address
® Time Zone
® TZ Offset (Min)
® URL Transaction
® Connect Time (Sec)
® Download Time (Sec)
For explanations of each column, see the CMW online help for OMA for eBA Solutions.
Reports Accessed from CMW 159
Response Time Alerts Report
Response Time Alerts Report
About the reportsEach report for each application displays exception data trapped according to filter settings specified on a Manager Server or on a Manager Client during the interval you selected.
Note: The default report is the Response Time Alerts Report for All Applications, accessed when you double-click on a managed system name in an open Response Time Alerts report.
Accessing reportsTo access a report:
1. Double-click the Response Time Alerts report icon, located in the CMW Reports folder.
2. Right-click the Managed System you are interested in.
3. Select the report for the application for which you want to view data from the pop-up menu that displays.
4. Select the time interval for which you want to view data and press OK to display the Response Time Alerts Report for that application.
Information presented in each reportFor each application, you can expect to see data for most or all of the columns that follow when you can examine a report:
® Transaction Start Time
® Response Time (Sec)
® Client Hostname
® Title
® Transaction Status
® Browse Time (Sec)
® Browse Interest

Response Time Alerts Report
160 OMA for eBA Solutions User’s Guide, Version 251
® Application Type
® Application EXE
® Application Name
® Client Nickname
® IP Hostname
® IP Network Name
® IP Address
® Time Zone
® TZ Offset (Min)
® URL Transaction
® Connect Time (Sec)
® Download Time (Sec)
For explanations of each column, see the CMW online help for OMA for eBA Solutions.
Reports Accessed from CMW 161
Response Time Application Summary Reports
Response Time Application Summary Reports
About the reportsThe Response Time Application Summary reports display summary data on average response times during the interval you specify. Each report displays response time data summarized by application.
Note: The default report is the Response Time Application Summary Report for All Applications, accessed when you double-click on a managed system name in an open Response Time Application Summary report.
Accessing reportsTo access a report:
1. Double-click the Response Time Application Summary report icon, located in the CMW Reports folder.
2. Right-click the Managed System you are interested in.
3. Select the report for the application for which you want to view data from the pop-up menu that displays.
4. Select the time interval for which you want to view data and press OK to display the Response Time Application Summary Report for that application.
Information presented in each reportFor each application, you can expect to see data for most or all of the columns that follow when you can examine a report:
® Client Hostname
® Application Type
® Application Name
® Total Response Time (Sec)
® Average Response Time (Sec)
® Min Response Time (Sec)
® Max Response Time (Sec)
Response Time Application Summary Reports
162 OMA for eBA Solutions User’s Guide, Version 251
® Num of Trans
® Interval Start Time
® Interval (Min)
® Client Nickname
® IP Hostname
® IP Network Name
® IP Address
® Application EXE
® Time Zone
® TZ Offset (Min)
® Connect Time (Sec)
® Download Time (Sec)
For explanations of each column, see the CMW online help for OMA for eBA Solutions.
Reports Accessed from CMW 163
Response Time Transaction Summary Reports
Response Time Transaction Summary Reports
About the reportsEach report displays response time data summarized by transaction, for each application.
Note: The default report is the Response Time Transaction Summary Report for All Applications, accessed when you double-click on a managed system name in an open Response Time Transaction Summary report.
Accessing reportsTo access a report:
1. Double-click the Response Time Transaction Summary report icon, located in the CMW Reports folder.
2. Right-click the Managed System you are interested in.
3. Select the report for the application for which you want to view data from the pop-up menu that displays.
4. Select the time interval for which you want to view data and press OK to display the Response Time Transaction Summary Report for that application.
Information presented in each reportFor each application, you can expect to see data for most or all of the columns that follow when you can examine a report:
® Client Hostname
® Title
® Total Response Time (Sec)
® Avg Response Time (Sec)
® Min Response Time (Sec)
® Max Response Time (Sec)
® Num of Trans
Response Time Transaction Summary Reports
164 OMA for eBA Solutions User’s Guide, Version 251
® Interval Start Time
® Interval (Min)
® URL Transaction
® Client Nickname
® IP Hostname
® IP Network Name
® IP Address
® Time Zone
® TZ Offset (Min)
® Application Type
® Application Name
® Application EXE
® Connect Time (Sec)
® Download Time (Sec)
For explanations of each column, see the CMW online help for OMA for eBA Solutions.

Predefined Solutions 165
Predefined Solutions
IntroductionThis chapter provides detailed information about the predefined situations and other objects that are included with OMA for eBA Solutions.
Chapter ContentsIntroducing Product-Provided Solutions . . . . . . . . . . . . . . . . . . . . . . . . . 166Product-provided Situations . . . . . . . . . . . . . . . . . . . . . . . . . . . . . . . . . . 169
5
Introducing Product-Provided Solutions
166 OMA for eBA Solutions User’s Guide, Version 251
Introducing Product-Provided Solutions
OverviewOMA for eBA Solutions contains two types of product-provided solutions:
® situations (available on both the CandleNet Portal interface and on the CMW interface)
® template (available with CMW)
Product-provided situationsProduct-provided situations enable you to quickly begin monitoring any OMA for eBA Solutions managed object. You can use these situations as models for customizing your own situations. You can also embed these situations within your own custom situations.
Viewing situations while using CMW
In the CMW, you can view the sample situations by opening the Situations folder, located in the Administration folder of the CMW. See the CMW help for instructions on modifying situations or embedding situations.
Viewing situations while using CandleNet Portal
In the CandleNet Portal interface, you can display predefined situations and create your own situations using the Situation editor. The left frame of the Situation editor initially lists the situations associated with the Navigator item you selected. For the most current in-depth information, refer to the Using OMEGAMON Products: CandleNet Portal guide or the online Help provided with CandleNet Portal.
Predefined Solutions 167
Introducing Product-Provided Solutions
Product-provided templates (CMW only)Product-provided templates are models that you can use to create the managed objects with which you monitor situations. OMA for eBA Solutions provides one template, called ETEWatch, located in the Templates folder of the CMW.
Product-provided situations are assigned to states in specific product-provided templates, depending on the type of situation. The assigned state is associated with an alert icon that displays when situations are being monitored. Refer to the CMW help for information on how to use templates to create managed objects.
About the OMA’s response time alert dataOMA response time alerts have been pre-filtered by these products:
® ETEWatch
® eBA*ServiceMonitor
® eBA*ServiceMonitor3
® SitePulse
Alert data displays in the Alert workspaces on a continuous basis, as alert data are received. For details about how the Manager Client and Manager Server are configured to transmit data, see the Consolidating Data chapter of the appropriate user’s guide.
Monitoring for alerts requires you to create situations to detect response time exceptions that are meaningful to the transactions you are monitoring. You first specify the filtering criteria on the Exception and Average page of the Manager Client settings notebook so that meaningful alert data are sent to the Manager Server. Also, Send Exception Data must be checked on the General page.
Note: Keep in mind that whatever criteria you define for your situations must match the filtering criteria set in the Exception and Average page of the Manager Client settings notebook.
Introducing Product-Provided Solutions
168 OMA for eBA Solutions User’s Guide, Version 251
Adjusting values for your systemThe response time values in the product-provided situations are only examples.
You can use the workspaces discussed in “Workspaces Accessed from CandleNet Portal” on page 59 and the reports discussed in “Reports Accessed from CMW” on page 153 to review the response times for the application or Web browser you are monitoring. You can then edit a particular situation to reflect a response time that you consider at a critical level or at a warning level on your managed systems.
Predefined Solutions 169
Product-provided Situations
Product-provided Situations
OverviewOMA for eBA Solutions provides predefined situations that let you begin monitoring events from your managed systems soon after you install the OMA for eBA Solutions. A situation is a logical expression involving one or more system conditions. Each product-provided situation is already assigned to a critical or a warning state. Use situations to begin monitoring any managed object quickly, or as models for creating your own custom situations.
Candle suggests that if you choose to modify the predefined situations shipped with your product, you first make a copy of the product-provided situation by using the Create Another Situation option to ensure fallback if necessary. You can then edit the copy to your own specifications. You may want to fine tune a situation so it fires when the condition is truly at a warning or at a critical level. Use the Situation editor to edit situations.
When you install the CMW and/or CandleNet Portal, product-provided situations are automatically installed for you. Some of these situations are started automatically. If you want to stop a situation that is running, see the sections that follow for the system that you are using.
Two types of situationsOMA for eBA Solutions provides two types of situations. You can use these situations as is or use them as a base for creating your own situations.
Pure event situations
Pure events are unsolicited notifications. Examples of pure events are an out-of-paper condition on a printer and an occurrence that adds an entry to the Windows System Log. Some of the Alert table attributes report pure events, such as the eBA SM3 Page Alert Detail attributes. A situation using one of these attributes can monitor for pure events. Because of the nature of pure events, they are not closed automatically like sampled events; you must close the event manually. Alternatively, you can author the situation with an UNTIL clause. See the CandleNet Portal online help for details on using the UNTIL clause.
Product-provided Situations
170 OMA for eBA Solutions User’s Guide, Version 251
Sampled event situations
Sampled events happen when a situation becomes true. Situations sample data at regular intervals. When the situation is true, it causes an event, which gets closed automatically when the situation goes back to false (or you can close it manually).
When using attributes to create sampled event situations, the sampling interval should match the interval when Manager Client sends data to Manager Server. Manager Client sends alert data to Manager Server whenever an exception is detected, if Send Exception Data is checked. You can set the Checking Data Interval on the Exception and Average page for when Manager Client checks for alert data. For example, if you specify 30 minutes, data is checked for exceptions once every 30 minutes. Therefore, data will only be sent to the Manager Server every 30 minutes. In this case, set the sampling interval to 30 minutes for these types of situations.
The table called “OMA for eBA Solutions Product-provided Situations” on page 172 defines which product-provided situations are sampled event and which situations are pure event. See the CandleNet Portal online help for instructions on how to edit, modify, imbed, or assign product-provided situations.
Stopping product-provided situations in the CMWIf you do not want to use one or more of the product-provided situations for monitoring, you can stop it by completing the following steps:
1. Open the Situations folder in the CMW.
2. Right-click the situation you want to stop.
3. Select Stop from the popup menu.
Predefined Solutions 171
Product-provided Situations
Preventing product-provided situations from starting in the CMWTo prevent the situation from starting the next time you start the CMW:
1. Open the Situations folder in the CMW.
2. Right-click a situation and select Settings.
3. Click the Properties tab, then uncheck Activate at startup.If you do not want to use one or more of the product-provided situations for monitoring, you can delete the managed object instead of stopping the situations manually. You can always begin monitoring again by dragging the ETEWatch template onto a managed object.
However, remember that you must also deselect the Activate at startup option for each situation, or the CMW will create the managed object again the next time you log on.
Starting, stopping, or deleting a situation while using CandleNet Portal
Whenever you create or edit a situation, it starts running as soon as you click Apply or OK to close the Situation editor. You can stop and restart a situation at any time. Use Delete to permanently remove a situation. See the online Help provided with CandleNet Portal for detailed instructions.
The table that follows lists the situations provided by OMA for eBA Solutions.
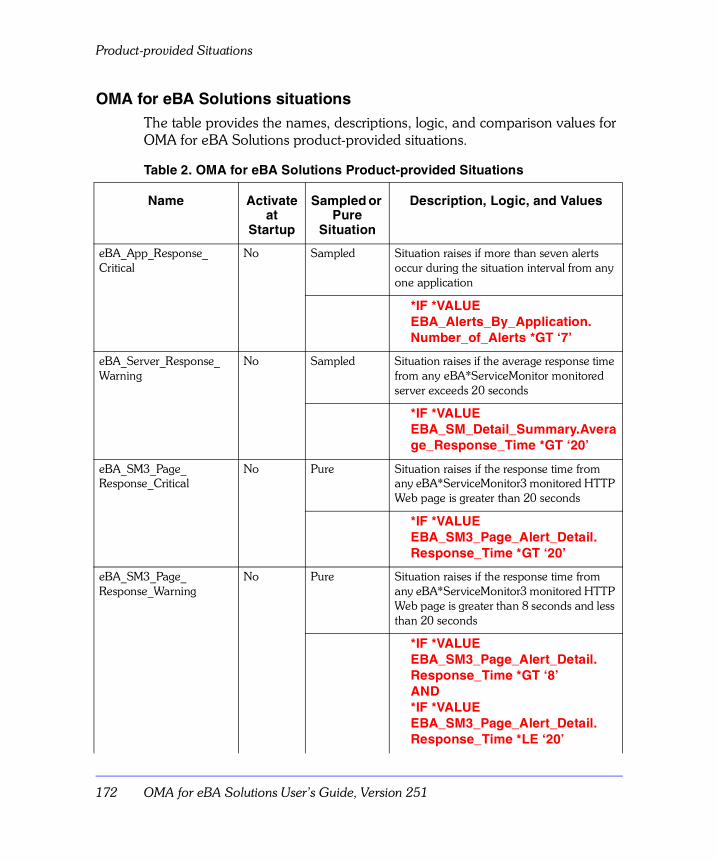
Product-provided Situations
172 OMA for eBA Solutions User’s Guide, Version 251
OMA for eBA Solutions situationsThe table provides the names, descriptions, logic, and comparison values for OMA for eBA Solutions product-provided situations.
Table 2. OMA for eBA Solutions Product-provided Situations
Name Activate at
Startup
Sampled or Pure
Situation
Description, Logic, and Values
eBA_App_Response_Critical
No Sampled Situation raises if more than seven alerts occur during the situation interval from any one application
*IF *VALUE EBA_Alerts_By_Application.Number_of_Alerts *GT ‘7’
eBA_Server_Response_ Warning
No Sampled Situation raises if the average response time from any eBA*ServiceMonitor monitored server exceeds 20 seconds
*IF *VALUE EBA_SM_Detail_Summary.Average_Response_Time *GT ‘20’
eBA_SM3_Page_Response_Critical
No Pure Situation raises if the response time from any eBA*ServiceMonitor3 monitored HTTP Web page is greater than 20 seconds
*IF *VALUE EBA_SM3_Page_Alert_Detail.Response_Time *GT ‘20’
eBA_SM3_Page_Response_Warning
No Pure Situation raises if the response time from any eBA*ServiceMonitor3 monitored HTTP Web page is greater than 8 seconds and less than 20 seconds
*IF *VALUE EBA_SM3_Page_Alert_Detail.Response_Time *GT ‘8’AND*IF *VALUE EBA_SM3_Page_Alert_Detail.Response_Time *LE ‘20’
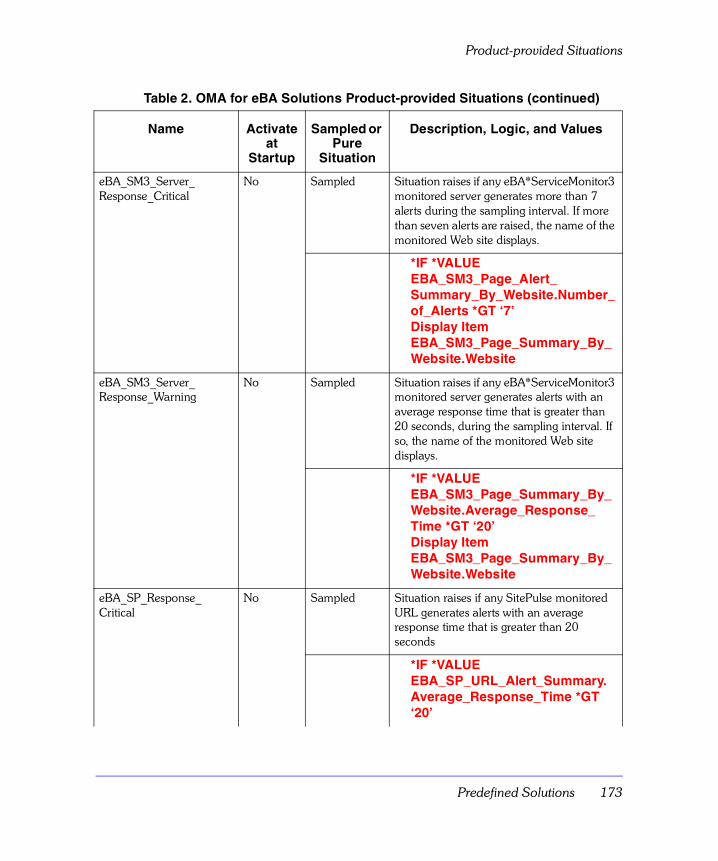
Predefined Solutions 173
Product-provided Situations
eBA_SM3_Server_Response_Critical
No Sampled Situation raises if any eBA*ServiceMonitor3 monitored server generates more than 7 alerts during the sampling interval. If more than seven alerts are raised, the name of the monitored Web site displays.
*IF *VALUE EBA_SM3_Page_Alert_Summary_By_Website.Number_of_Alerts *GT ‘7’Display ItemEBA_SM3_Page_Summary_By_Website.Website
eBA_SM3_Server_Response_Warning
No Sampled Situation raises if any eBA*ServiceMonitor3 monitored server generates alerts with an average response time that is greater than 20 seconds, during the sampling interval. If so, the name of the monitored Web site displays.
*IF *VALUE EBA_SM3_Page_Summary_By_Website.Average_Response_Time *GT ‘20’Display ItemEBA_SM3_Page_Summary_By_Website.Website
eBA_SP_Response_Critical
No Sampled Situation raises if any SitePulse monitored URL generates alerts with an average response time that is greater than 20 seconds
*IF *VALUE EBA_SP_URL_Alert_Summary.Average_Response_Time *GT ‘20’
Table 2. OMA for eBA Solutions Product-provided Situations (continued)
Name Activate at
Startup
Sampled or Pure
Situation
Description, Logic, and Values
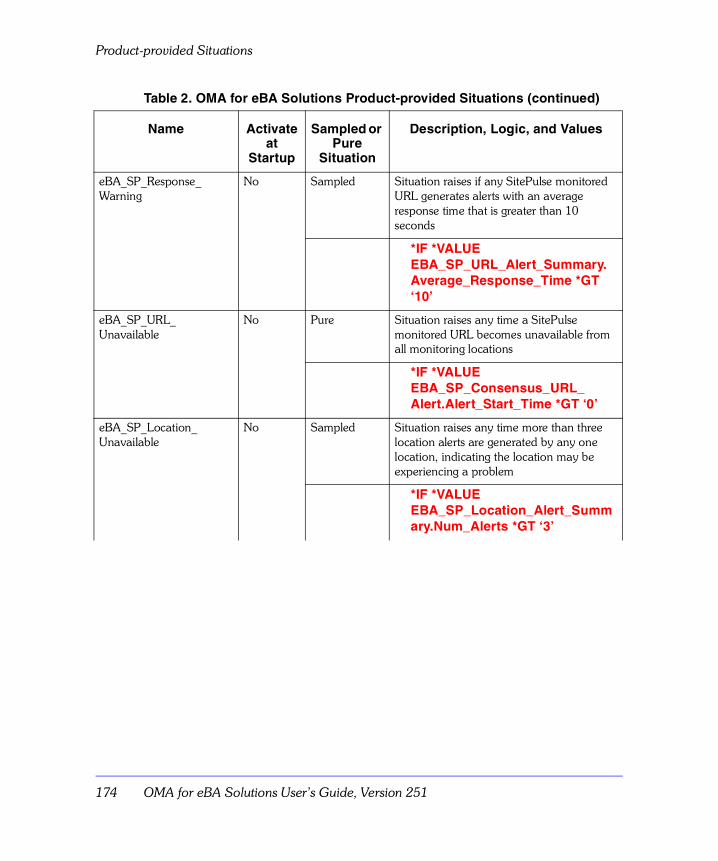
Product-provided Situations
174 OMA for eBA Solutions User’s Guide, Version 251
eBA_SP_Response_Warning
No Sampled Situation raises if any SitePulse monitored URL generates alerts with an average response time that is greater than 10 seconds
*IF *VALUE EBA_SP_URL_Alert_Summary.Average_Response_Time *GT ‘10’
eBA_SP_URL_Unavailable
No Pure Situation raises any time a SitePulse monitored URL becomes unavailable from all monitoring locations
*IF *VALUE EBA_SP_Consensus_URL_Alert.Alert_Start_Time *GT ‘0’
eBA_SP_Location_Unavailable
No Sampled Situation raises any time more than three location alerts are generated by any one location, indicating the location may be experiencing a problem
*IF *VALUE EBA_SP_Location_Alert_Summary.Num_Alerts *GT ‘3’
Table 2. OMA for eBA Solutions Product-provided Situations (continued)
Name Activate at
Startup
Sampled or Pure
Situation
Description, Logic, and Values
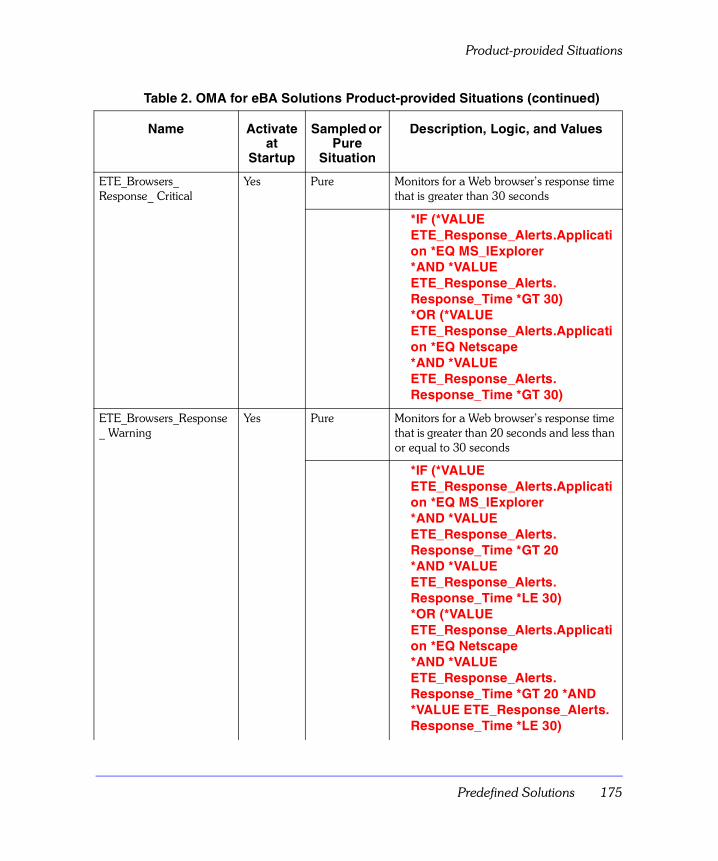
Predefined Solutions 175
Product-provided Situations
ETE_Browsers_Response_ Critical
Yes Pure Monitors for a Web browser’s response time that is greater than 30 seconds
*IF (*VALUE ETE_Response_Alerts.Application *EQ MS_IExplorer *AND *VALUE ETE_Response_Alerts.Response_Time *GT 30) *OR (*VALUE ETE_Response_Alerts.Application *EQ Netscape *AND *VALUE ETE_Response_Alerts.Response_Time *GT 30)
ETE_Browsers_Response_ Warning
Yes Pure Monitors for a Web browser’s response time that is greater than 20 seconds and less than or equal to 30 seconds
*IF (*VALUE ETE_Response_Alerts.Application *EQ MS_IExplorer *AND *VALUE ETE_Response_Alerts.Response_Time *GT 20 *AND *VALUE ETE_Response_Alerts.Response_Time *LE 30) *OR (*VALUE ETE_Response_Alerts.Application *EQ Netscape *AND *VALUE ETE_Response_Alerts.Response_Time *GT 20 *AND *VALUE ETE_Response_Alerts.Response_Time *LE 30)
Table 2. OMA for eBA Solutions Product-provided Situations (continued)
Name Activate at
Startup
Sampled or Pure
Situation
Description, Logic, and Values
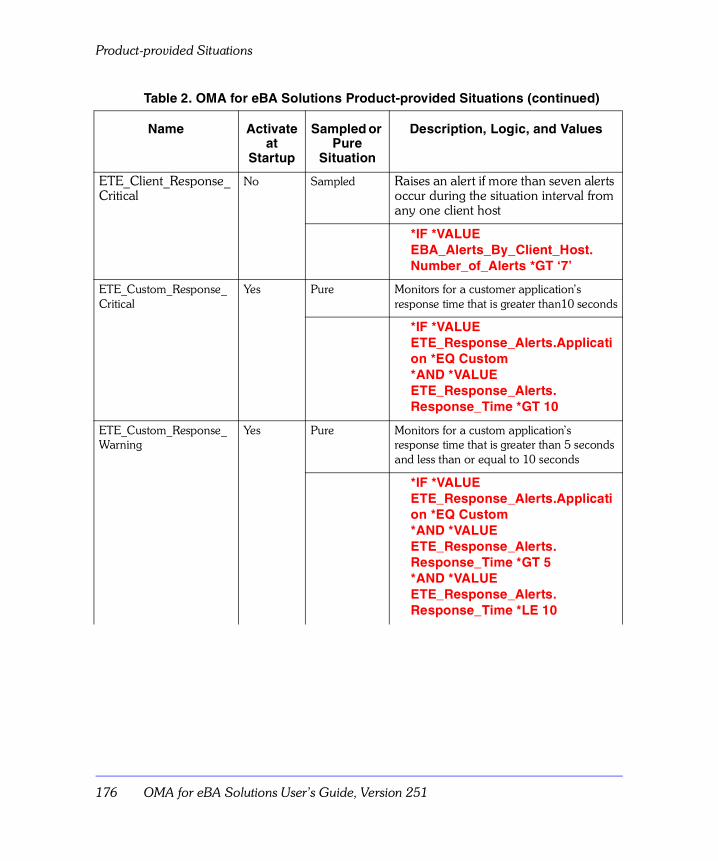
Product-provided Situations
176 OMA for eBA Solutions User’s Guide, Version 251
ETE_Client_Response_Critical
No Sampled Raises an alert if more than seven alerts occur during the situation interval from any one client host
*IF *VALUEEBA_Alerts_By_Client_Host.Number_of_Alerts *GT ‘7’
ETE_Custom_Response_ Critical
Yes Pure Monitors for a customer application’s response time that is greater than10 seconds
*IF *VALUE ETE_Response_Alerts.Application *EQ Custom *AND *VALUE ETE_Response_Alerts.Response_Time *GT 10
ETE_Custom_Response_ Warning
Yes Pure Monitors for a custom application’s response time that is greater than 5 seconds and less than or equal to 10 seconds
*IF *VALUE ETE_Response_Alerts.Application *EQ Custom *AND *VALUE ETE_Response_Alerts.Response_Time *GT 5 *AND *VALUE ETE_Response_Alerts.Response_Time *LE 10
Table 2. OMA for eBA Solutions Product-provided Situations (continued)
Name Activate at
Startup
Sampled or Pure
Situation
Description, Logic, and Values
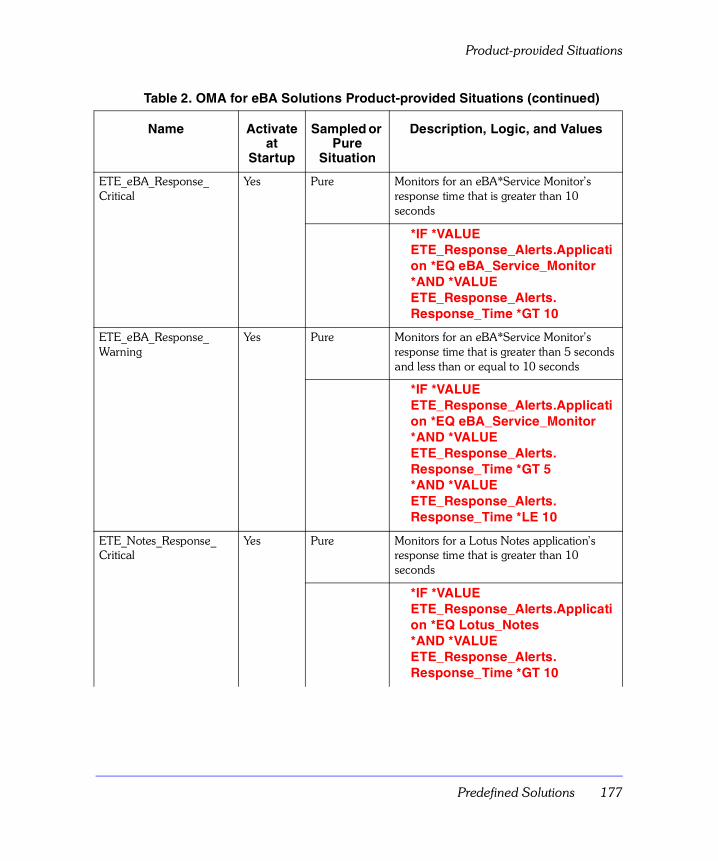
Predefined Solutions 177
Product-provided Situations
ETE_eBA_Response_ Critical
Yes Pure Monitors for an eBA*Service Monitor’s response time that is greater than 10 seconds
*IF *VALUE ETE_Response_Alerts.Application *EQ eBA_Service_Monitor *AND *VALUE ETE_Response_Alerts.Response_Time *GT 10
ETE_eBA_Response_ Warning
Yes Pure Monitors for an eBA*Service Monitor’s response time that is greater than 5 seconds and less than or equal to 10 seconds
*IF *VALUE ETE_Response_Alerts.Application *EQ eBA_Service_Monitor *AND *VALUE ETE_Response_Alerts.Response_Time *GT 5 *AND *VALUE ETE_Response_Alerts.Response_Time *LE 10
ETE_Notes_Response_ Critical
Yes Pure Monitors for a Lotus Notes application’s response time that is greater than 10 seconds
*IF *VALUE ETE_Response_Alerts.Application *EQ Lotus_Notes *AND *VALUE ETE_Response_Alerts.Response_Time *GT 10
Table 2. OMA for eBA Solutions Product-provided Situations (continued)
Name Activate at
Startup
Sampled or Pure
Situation
Description, Logic, and Values
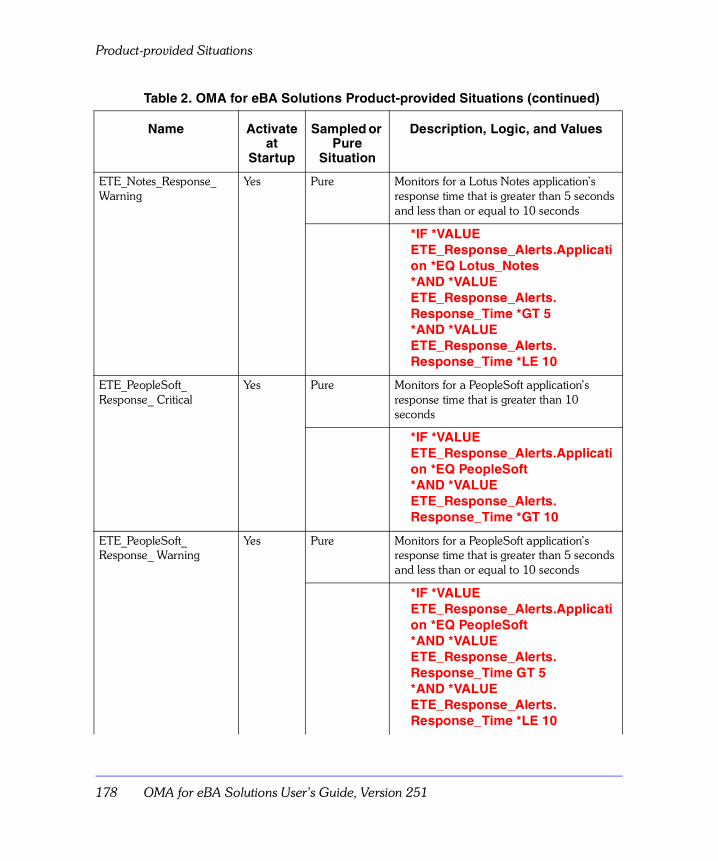
Product-provided Situations
178 OMA for eBA Solutions User’s Guide, Version 251
ETE_Notes_Response_ Warning
Yes Pure Monitors for a Lotus Notes application’s response time that is greater than 5 seconds and less than or equal to 10 seconds
*IF *VALUE ETE_Response_Alerts.Application *EQ Lotus_Notes *AND *VALUE ETE_Response_Alerts.Response_Time *GT 5 *AND *VALUE ETE_Response_Alerts.Response_Time *LE 10
ETE_PeopleSoft_Response_ Critical
Yes Pure Monitors for a PeopleSoft application’s response time that is greater than 10 seconds
*IF *VALUE ETE_Response_Alerts.Application *EQ PeopleSoft *AND *VALUE ETE_Response_Alerts.Response_Time *GT 10
ETE_PeopleSoft_Response_ Warning
Yes Pure Monitors for a PeopleSoft application’s response time that is greater than 5 seconds and less than or equal to 10 seconds
*IF *VALUE ETE_Response_Alerts.Application *EQ PeopleSoft *AND *VALUE ETE_Response_Alerts.Response_Time GT 5 *AND *VALUE ETE_Response_Alerts.Response_Time *LE 10
Table 2. OMA for eBA Solutions Product-provided Situations (continued)
Name Activate at
Startup
Sampled or Pure
Situation
Description, Logic, and Values
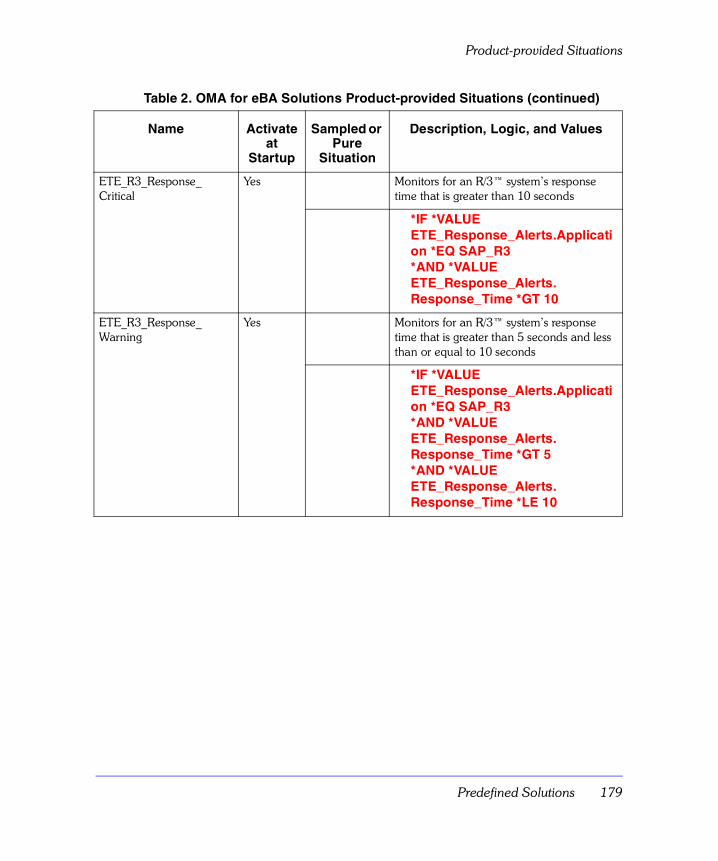
Predefined Solutions 179
Product-provided Situations
ETE_R3_Response_ Critical
Yes Monitors for an R/3™ system’s response time that is greater than 10 seconds
*IF *VALUE ETE_Response_Alerts.Application *EQ SAP_R3*AND *VALUE ETE_Response_Alerts.Response_Time *GT 10
ETE_R3_Response_ Warning
Yes Monitors for an R/3™ system’s response time that is greater than 5 seconds and less than or equal to 10 seconds
*IF *VALUE ETE_Response_Alerts.Application *EQ SAP_R3 *AND *VALUE ETE_Response_Alerts.Response_Time *GT 5*AND *VALUE ETE_Response_Alerts.Response_Time *LE 10
Table 2. OMA for eBA Solutions Product-provided Situations (continued)
Name Activate at
Startup
Sampled or Pure
Situation
Description, Logic, and Values

Product-provided Situations
180 OMA for eBA Solutions User’s Guide, Version 251
Index 181
Index
Numerics3270 applications 45
Aaccessing the ETEWatch Response Time
reports 155Adobe portable document format 10agents 26alerts, OMA response alerts events 167attributes
definition 38groups 38items 38structure 38
automation 34
Bbrowser mode 27browser, web
version required 45business view 32
CCandle Management Server 25Candle web site 8CandleNet Portal
browser mode 27definition 27desktop mode 27server 25
commandsTake Action 42
configurationdatabase 50
Ddata consolidation 57, 167data source name 50, 52database
configuration 50problems 54settings 53
Database Connection field 52desktop mode 27documentation set information 8Driver Name field 52driver, database 50DSN 52
Eenhancements 15ETEWatch
configuring the Manager Server for OMA use 55
data in the reports 155more about the OMA port number 55resolving port conflicts 56
ETEWatch components described 22Event Console view 33events 43
console 33definition 39indicator 43OMA response alerts 167resetting 169workspaces 43
Ffeatures, new 15filtering data 57, 167
H
182 OMA for eBA Solutions User’s Guide, Version 251
Hhistorical data collection 21
Iimprovements 15installation
Java 49installation instructions, where to find 48Internet Explorer, version required 45introducing OMA for eBA Solutions 47
JJava
version required 49JRE
version required 49
LLotus Notes, version required 45
MManager Client
compatibility with Manager Server 48version 48
Manager Servercompatibility with Manager Client 48database settings 53version 48
modesbrowser 27desktop 27
monitoring agents 26
NNavigator
business view 32physical view 32, 36
Netscape Navigator, version required 45
OODBC 54
OMAaccessing workspaces 65applications supported by this OMA 45examining the status of 57functions performed by this OMA 18how the OMAs assist you 18other system requirements 49port number, all about 55reports 153requirements 49resolving port conflicts 56settings on the Manager Server 55system requirements 48usage notes 57workspaces 59workspaces provided 66
OMA for eBA Solutionsworkspaces 61
OMA for eBA Solutions reports 153OMEGAMON DE
definition 26Event Console view 33
OMEGAMON XEcomponents 25definition 25
PPDF files, adding annotations 11physical view 32, 36Policy Management 34port number conflicts, resolving 56predefined situations 40prerequisites 48printing problems 10product
enhancements 15product-provided situations
overview 169preventing autostart situations from
starting 171resetting an event 169stopping autostart situations 170
Index 183
Q
product-provided solutions 165introducing 166situations 166, 169templates 167
Properties editor 37
Qqueries 30, 39
RR/3tm, version required 45reports 156
accessing 155applications supported 154customizing 156ETEWatch data 155exporting report data 156introducing response time reports 154overview 154Response Time Alerts 159Response Time Application
Summary 161Response Time Detail 157Response Time Transaction
Summary 163using 155
reports for applications supported 154requirements 48resetting an event 169
Ssetting up an Oracle JDBC database driver
(UNIX) 51setting up an Oracle JDBC database driver
(Windows) 51settings
database 53SitePulse 24Situation editor 40situations
definition 40
predefined 40system requirements 48
TTake Action feature 42thin client 27
UUniversal Agent 33using OMA for eBA Solutions data 61
Vversion requirements
Internet Explorer 45Java 49Lotus Notes 45Manager Client and Manager Server 48Netscape Navigator 45PeopleSoft 45R/3tm 45
viewsbusiness 32chart 29definition 37Event Console 33physical 32, 36table 29
Wweb browser
version required 45what is eBA*ServiceMonitor 23what is SitePulse 24what’s new in Version 300 15Workflow editor 34workspaces
accessing 65adding to favorites 27associating table views and charts with
attributes 62data in the table views and charts 62
W
184 OMA for eBA Solutions User’s Guide, Version 251
definition 37event 43overview 61product-provided 66working area 65
workspaces accessed from CandleNet Portal 59