OMA 300 TESIS
15
[1] A window into your process since 1994. Process Analyzers Series Through continuous optical analysis, the OMA system translates the UV-Vis / SW-NIR absorbance of a fluid to real-time chemical concentrations as well as any other parameters (e.g. color) that can be correlated from the measured absorbance spectrum. Common OMA measurements: CONTINUOUS LIQUID & GAS ANALYSIS FROM APPLIED ANALYTICS™ See all available OMA measurements @ www.a-a-inc.com/measurements » UV-Vis / SW-NIR full-spectrum Spectrophotometer » Solid state with no moving parts » Analyzes liquid or gas stream directly (hot, wet sample) » Ultra-safe fiber optic design for toxic process fluid » Xenon light source with average 5 yrs lifespan » Measures up to 5 species synchronously A 250’ (H2S + SO2) = e 250’ H2S bc H2S + e 250’ SO2 bc SO2 A 247’ (H2S + SO2) = e 247’ H2S bc H2S + e 247’ SO2 bc SO2 A 248’ (H2S + SO2) = e 248’ H2S bc H2S + e 248’ SO2 bc SO2 A 249’ (H2S + SO2) = e 249’ H2S bc H2S + e 249’ SO2 bc SO2
Transcript of OMA 300 TESIS
[1]
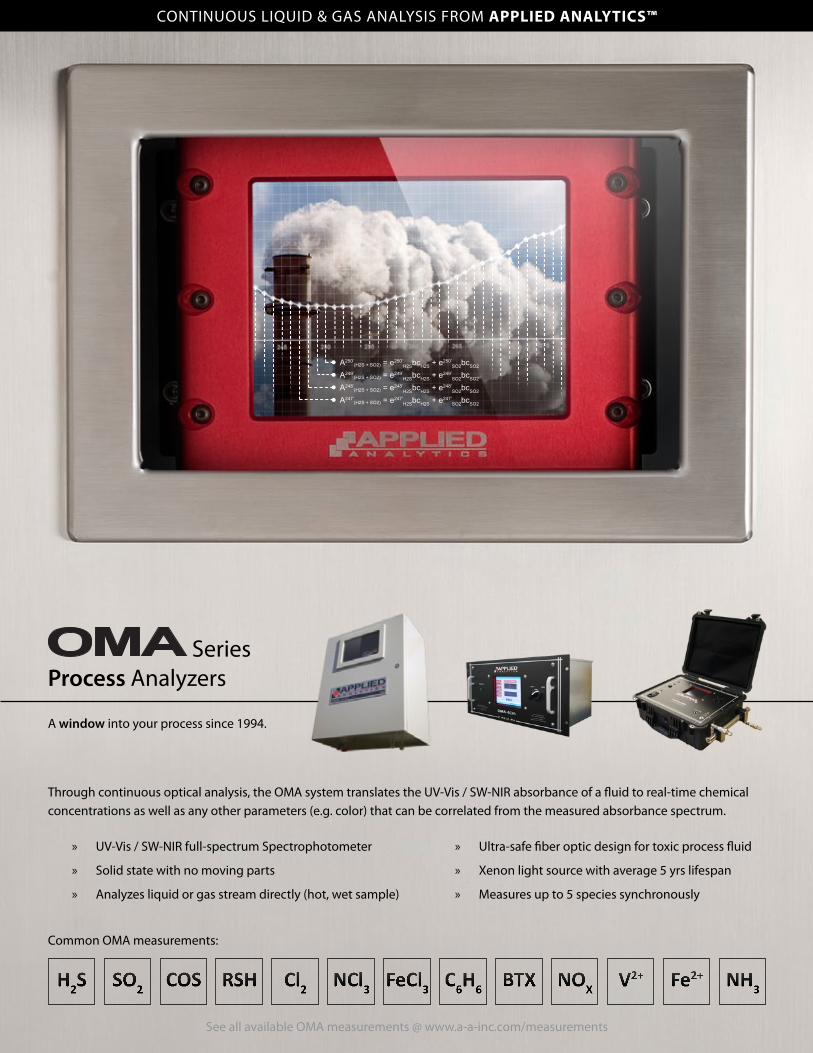
A window into your process since 1994.
Process AnalyzersSeries
Through continuous optical analysis, the OMA system translates the UV-Vis / SW-NIR absorbance of a fluid to real-time chemical concentrations as well as any other parameters (e.g. color) that can be correlated from the measured absorbance spectrum.
Common OMA measurements:
H2S SO2 NH3Cl2RSH C6H6 BTX NOXNCl3 FeCl3 Fe2+V2+COS
CONTINUOUS LIQUID & GAS ANALYSIS FROM APPLIED ANALYTICS™
See all available OMA measurements @ www.a-a-inc.com/measurements
» UV-Vis / SW-NIR full-spectrum Spectrophotometer
» Solid state with no moving parts
» Analyzes liquid or gas stream directly (hot, wet sample)
» Ultra-safe fiber optic design for toxic process fluid
» Xenon light source with average 5 yrs lifespan
» Measures up to 5 species synchronously
A250’(H2S + SO2) = e250’
H2SbcH2S + e250’SO2bcSO2
A247’(H2S + SO2) = e247’
H2SbcH2S + e247’SO2bcSO2
A248’(H2S + SO2) = e248’
H2SbcH2S + e248’SO2bcSO2
A249’(H2S + SO2) = e249’
H2SbcH2S + e249’SO2bcSO2

[2]
What is Absorbance Spectroscopy? .............................................3What Does OMA Measure? ..............................................................3The OMA System Overview .............................................................4Optical Assembly & Principle of Operation ................................5The Safety of OMA ..............................................................................6
Wetted Parts ..............................................................................6Safety Benefits ..........................................................................6
Normal Photometer vs. nova II Spectrophotometer ...........7nova II Overview ......................................................................7
The Advantages of Full-Spectrum Analysis ..............................8Collateral Data ..........................................................................8Huge Dynamic Range ............................................................9Unlocked Multi-Component Measurement ................ 10
Custom Sample Conditioning ..................................................... 13User Experience ................................................................................ 14
Auto Zero ................................................................................. 14Integrating Other Measurements .............................................. 14Standard OMA-300 Specifications ............................................. 15
Applied Analytics™ [AAI] is a global manufacturer of industrial process analysis instruments.
Our systems are used primarily to measure real-time chemical concentrations in liquid or gas process streams, as well as physical parameters like color, calorific value, and purity.
AAI’s mission is to provide a true window into your process via an elegant and automated solution.
Applied Analytics was incorporated in 1994. All of our systems are manufactured in the USA.
Global Support & Installation Services
AAI’s specialized role as a manufacturer of process analysis instruments means that 100% of our focus and resources are permanently dedicated to the long-term performance of our solutions. Our certified field engineers proudly en-sure that your AAI systems deliver decades of reliable process monitoring.
We maintain a comprehensive global support network. Our service commitment spans from rigorous pre-build application research to expedient start-up, followed by fast support for the lifetime of your AAI systems.
» On-site installation assistance, commissioning, and system service by certified, experienced field engineers
» Technical support by phone and email for the lifetime of your Applied Analytics systems
» Equipment training at our facility or your site
[3]
Chemicalsacetone — C3H6Oacrylonitrile — C3H3Nammonia — NH3
ammonium — NH4+
aromatic hydrocarbons (total)benzene — C6H6
bromine — Br2
1,3-butadeine — C4H6
caffeine — C6H10N4O2
carbon disulfide — CS2
carbonyl sulfide — COS — OCSchlorine — Cl2
chlorine dioxide — ClO2
chromium ions — Cr6+
cobalt ions — Co2+
copper ions — Cu2+
dimethyl sulfide — DMS — (CH3)2Sethanol — C2H6Oethylene glycol — MEG — C2H6O2
ethyl mercaptan — EtSH — CH3CH2SHferric chloride — FeCl3
ferrous sulfate — FeSO4
fluorine — F2
formaldehyde — CH2Ohydrogen peroxide — H2O2
hydrogen sulfide — H2Shypochlorite — ClO-
iron ions — Fe2+
MeHQ — hydroquinone monomethyl ethermercury — Hgmethanol — CH3OHmethyl mercaptan — MeSH — CH3SHnitrogen dioxide — NO2
The OMA is commonly used to measure:
Note: see complete list of offered measurements at www.a-a-inc.com/measurements
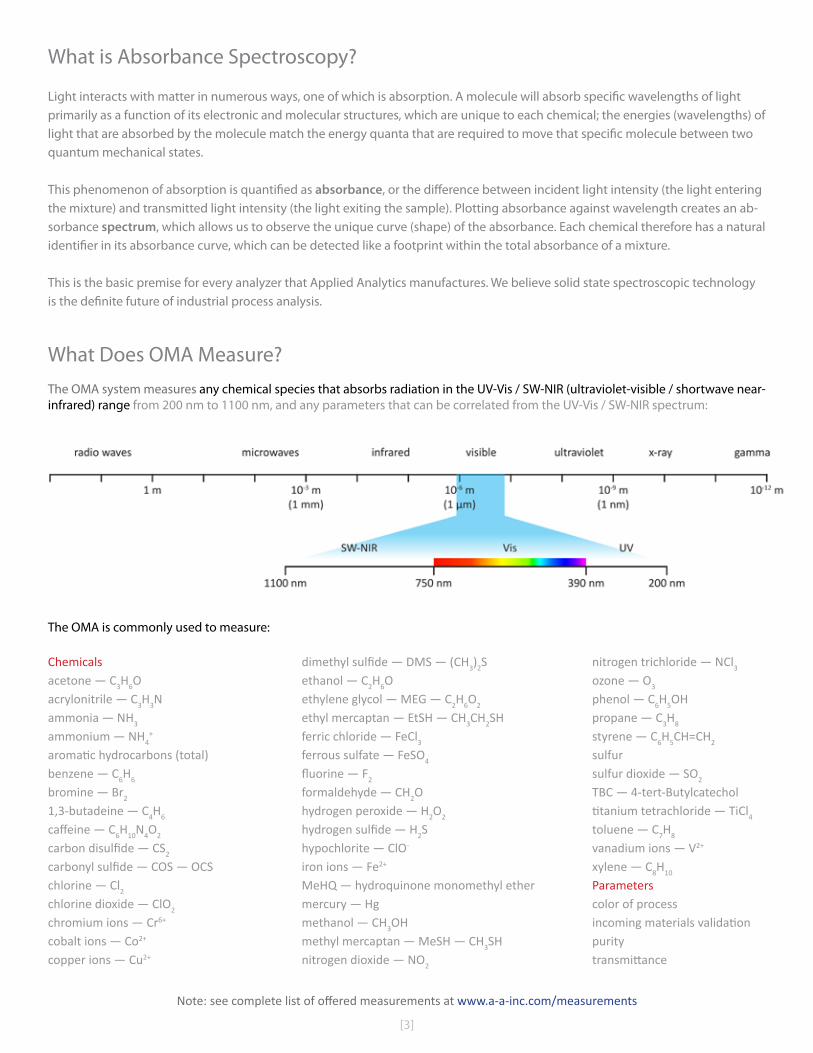
What is Absorbance Spectroscopy?
Light interacts with matter in numerous ways, one of which is absorption. A molecule will absorb specific wavelengths of light primarily as a function of its electronic and molecular structures, which are unique to each chemical; the energies (wavelengths) of light that are absorbed by the molecule match the energy quanta that are required to move that specific molecule between two quantum mechanical states.
This phenomenon of absorption is quantified as absorbance, or the difference between incident light intensity (the light entering the mixture) and transmitted light intensity (the light exiting the sample). Plotting absorbance against wavelength creates an ab-sorbance spectrum, which allows us to observe the unique curve (shape) of the absorbance. Each chemical therefore has a natural identifier in its absorbance curve, which can be detected like a footprint within the total absorbance of a mixture.
This is the basic premise for every analyzer that Applied Analytics manufactures. We believe solid state spectroscopic technology is the definite future of industrial process analysis.
What Does OMA Measure?The OMA system measures any chemical species that absorbs radiation in the UV-Vis / SW-NIR (ultraviolet-visible / shortwave near-infrared) range from 200 nm to 1100 nm, and any parameters that can be correlated from the UV-Vis / SW-NIR spectrum:
nitrogen trichloride — NCl3
ozone — O3
phenol — C6H5OHpropane — C3H8
styrene — C6H5CH=CH2
sulfursulfur dioxide — SO2
TBC — 4-tert-Butylcatecholtitanium tetrachloride — TiCl4
toluene — C7H8
vanadium ions — V2+
xylene — C8H10
Parameterscolor of processincoming materials validationpuritytransmittance
[4]
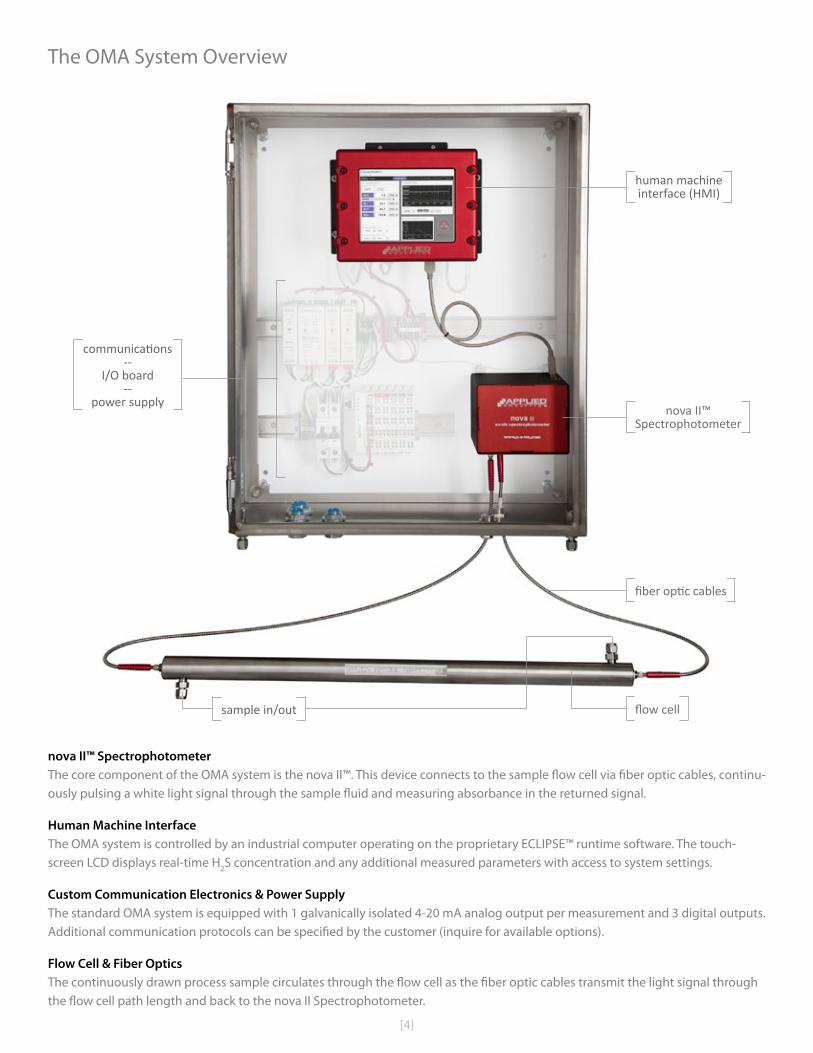
The OMA System Overview
human machine interface (HMI)
nova II™ Spectrophotometer
flow cellsample in/out
fiber optic cables
nova II™ SpectrophotometerThe core component of the OMA system is the nova II™. This device connects to the sample flow cell via fiber optic cables, continu-ously pulsing a white light signal through the sample fluid and measuring absorbance in the returned signal.
Human Machine InterfaceThe OMA system is controlled by an industrial computer operating on the proprietary ECLIPSE™ runtime software. The touch-screen LCD displays real-time H2S concentration and any additional measured parameters with access to system settings.
Custom Communication Electronics & Power SupplyThe standard OMA system is equipped with 1 galvanically isolated 4-20 mA analog output per measurement and 3 digital outputs. Additional communication protocols can be specified by the customer (inquire for available options).
Flow Cell & Fiber OpticsThe continuously drawn process sample circulates through the flow cell as the fiber optic cables transmit the light signal through the flow cell path length and back to the nova II Spectrophotometer.
communications--
I/O board--
power supply
[5]
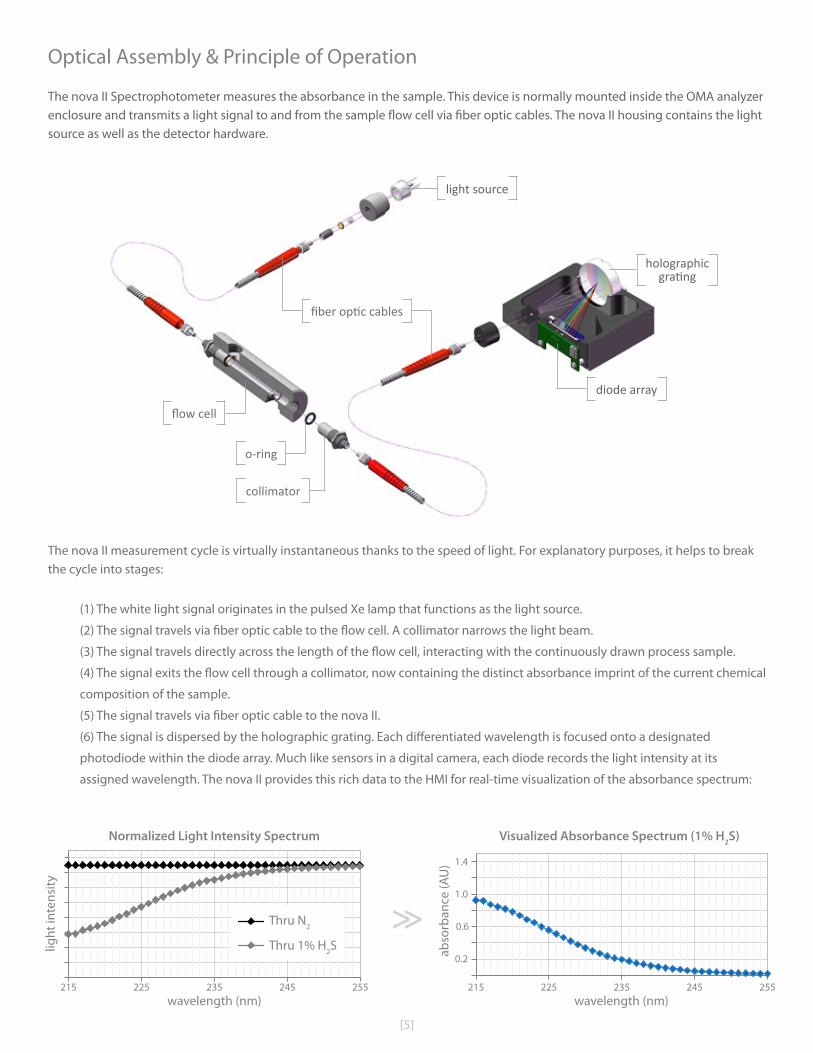
Optical Assembly & Principle of Operation
The nova II Spectrophotometer measures the absorbance in the sample. This device is normally mounted inside the OMA analyzer enclosure and transmits a light signal to and from the sample flow cell via fiber optic cables. The nova II housing contains the light source as well as the detector hardware.
light source
holographicgrating
diode array
fiber optic cables
flow cell
o-ring
collimator
The nova II measurement cycle is virtually instantaneous thanks to the speed of light. For explanatory purposes, it helps to break the cycle into stages:
(1) The white light signal originates in the pulsed Xe lamp that functions as the light source.
(2) The signal travels via fiber optic cable to the flow cell. A collimator narrows the light beam.
(3) The signal travels directly across the length of the flow cell, interacting with the continuously drawn process sample.
(4) The signal exits the flow cell through a collimator, now containing the distinct absorbance imprint of the current chemical
composition of the sample.
(5) The signal travels via fiber optic cable to the nova II.
(6) The signal is dispersed by the holographic grating. Each differentiated wavelength is focused onto a designated
photodiode within the diode array. Much like sensors in a digital camera, each diode records the light intensity at its
assigned wavelength. The nova II provides this rich data to the HMI for real-time visualization of the absorbance spectrum:
0.50.70.91.11.31.51.71.92.1
215 225 235 245 255
Wavelength (nm)
light intensity
00.20.40.60.8
11.21.4
215 225 235 245 255
Wavelength (nm)
H2S 1%
Thru N2
Thru 1% H2S
0.50.70.91.11.31.51.71.92.1
215 225 235 245 255
Wavelength (nm)
light intensity
sample light intensity
Normalized Light Intensity Spectrum
1.4
1.0
0.2
0.6
abso
rban
ce (A
U)
light
inte
nsity
Visualized Absorbance Spectrum (1% H2S)
225215wavelength (nm)
245235 255225215wavelength (nm)
245235 255
>>
[6]
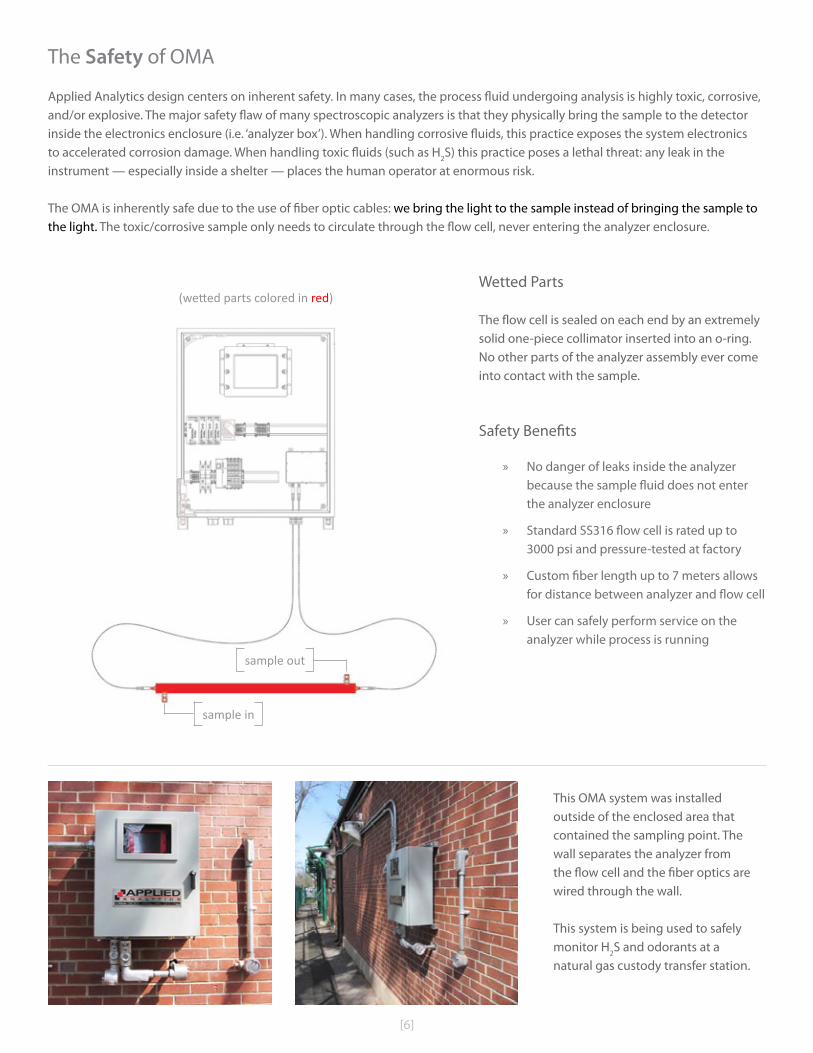
The Safety of OMA
Applied Analytics design centers on inherent safety. In many cases, the process fluid undergoing analysis is highly toxic, corrosive, and/or explosive. The major safety flaw of many spectroscopic analyzers is that they physically bring the sample to the detector inside the electronics enclosure (i.e. ‘analyzer box’). When handling corrosive fluids, this practice exposes the system electronics to accelerated corrosion damage. When handling toxic fluids (such as H2S) this practice poses a lethal threat: any leak in the instrument — especially inside a shelter — places the human operator at enormous risk.
The OMA is inherently safe due to the use of fiber optic cables: we bring the light to the sample instead of bringing the sample to the light. The toxic/corrosive sample only needs to circulate through the flow cell, never entering the analyzer enclosure.
Wetted Parts
The flow cell is sealed on each end by an extremely solid one-piece collimator inserted into an o-ring. No other parts of the analyzer assembly ever come into contact with the sample.
Safety Benefits
sample in
sample out
» No danger of leaks inside the analyzer because the sample fluid does not enter the analyzer enclosure
» Standard SS316 flow cell is rated up to 3000 psi and pressure-tested at factory
» Custom fiber length up to 7 meters allows for distance between analyzer and flow cell
» User can safely perform service on the analyzer while process is running
(wetted parts colored in red)
This OMA system was installed outside of the enclosed area that contained the sampling point. The wall separates the analyzer from the flow cell and the fiber optics are wired through the wall.
This system is being used to safely monitor H2S and odorants at a natural gas custody transfer station.
[7]
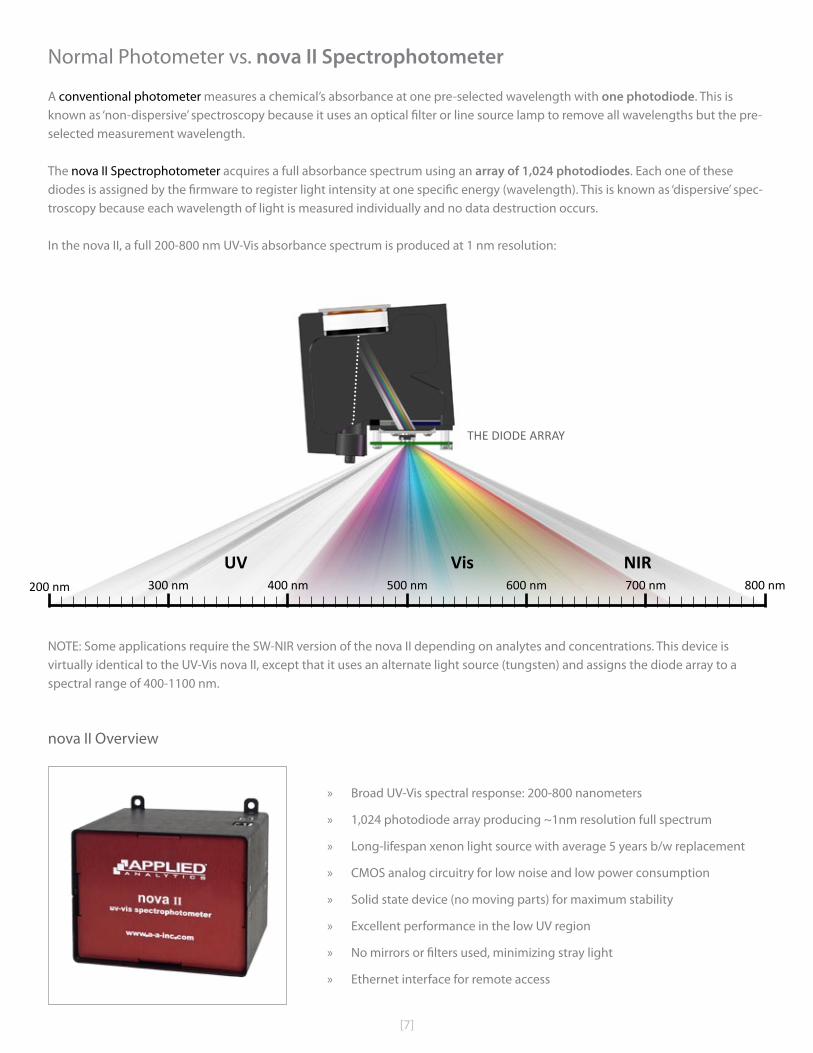
Normal Photometer vs. nova II Spectrophotometer
A conventional photometer measures a chemical’s absorbance at one pre-selected wavelength with one photodiode. This is known as ‘non-dispersive’ spectroscopy because it uses an optical filter or line source lamp to remove all wavelengths but the pre-selected measurement wavelength.
The nova II Spectrophotometer acquires a full absorbance spectrum using an array of 1,024 photodiodes. Each one of these diodes is assigned by the firmware to register light intensity at one specific energy (wavelength). This is known as ‘dispersive’ spec-troscopy because each wavelength of light is measured individually and no data destruction occurs.
In the nova II, a full 200-800 nm UV-Vis absorbance spectrum is produced at 1 nm resolution:
200 nm 300 nm 400 nm 500 nm 600 nm 700 nm 800 nmUV Vis NIR
THE DIODE ARRAY
NOTE: Some applications require the SW-NIR version of the nova II depending on analytes and concentrations. This device is virtually identical to the UV-Vis nova II, except that it uses an alternate light source (tungsten) and assigns the diode array to a spectral range of 400-1100 nm.
nova II Overview
» Broad UV-Vis spectral response: 200-800 nanometers
» 1,024 photodiode array producing ~1nm resolution full spectrum
» Long-lifespan xenon light source with average 5 years b/w replacement
» CMOS analog circuitry for low noise and low power consumption
» Solid state device (no moving parts) for maximum stability
» Excellent performance in the low UV region
» No mirrors or filters used, minimizing stray light
» Ethernet interface for remote access
[8]
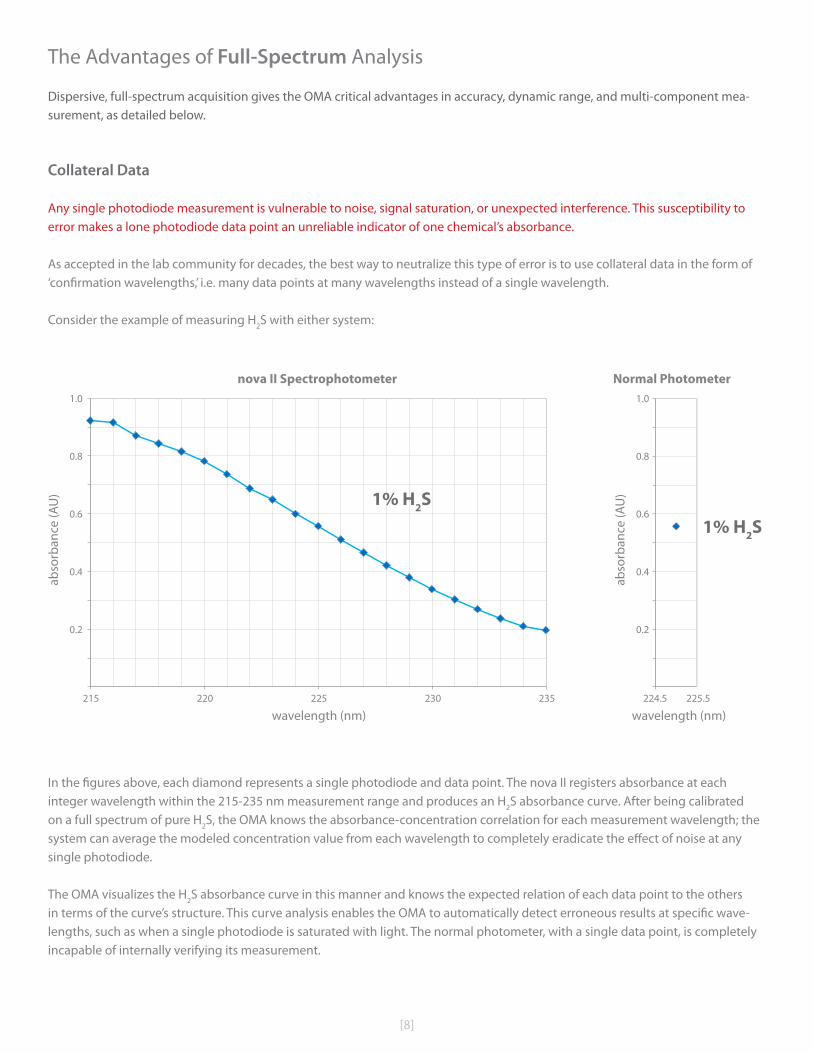
The Advantages of Full-Spectrum Analysis
Dispersive, full-spectrum acquisition gives the OMA critical advantages in accuracy, dynamic range, and multi-component mea-surement, as detailed below.
Collateral Data
Any single photodiode measurement is vulnerable to noise, signal saturation, or unexpected interference. This susceptibility to error makes a lone photodiode data point an unreliable indicator of one chemical’s absorbance.
As accepted in the lab community for decades, the best way to neutralize this type of error is to use collateral data in the form of ‘confirmation wavelengths,’ i.e. many data points at many wavelengths instead of a single wavelength.
Consider the example of measuring H2S with either system:
In the figures above, each diamond represents a single photodiode and data point. The nova II registers absorbance at each integer wavelength within the 215-235 nm measurement range and produces an H2S absorbance curve. After being calibrated on a full spectrum of pure H2S, the OMA knows the absorbance-concentration correlation for each measurement wavelength; the system can average the modeled concentration value from each wavelength to completely eradicate the effect of noise at any single photodiode.
The OMA visualizes the H2S absorbance curve in this manner and knows the expected relation of each data point to the others in terms of the curve’s structure. This curve analysis enables the OMA to automatically detect erroneous results at specific wave-lengths, such as when a single photodiode is saturated with light. The normal photometer, with a single data point, is completely incapable of internally verifying its measurement.
1.0
0.8
0.6
0.2
0.4
215 2352302252200
0.1
0.2
0.3
0.4
0.5
0.6
0.7
0.8
0.9
1
215 220 225 230 235
wavelength (nm)
abso
rban
ce (A
U)
0
0.1
0.2
0.3
0.4
0.5
0.6
0.7
0.8
0.9
1
224.5224.5 225.5
wavelength (nm)
1.0
0.8
0.6
0.2
0.4
abso
rban
ce (A
U)
nova II Spectrophotometer Normal Photometer
1% H2S1% H2S
[9]
Huge Dynamic Range[In spectroscopy, ‘dynamic range’ refers to how well the measuring instrument sustains accuracy in the event of large, rapid changes in concentration.]
Dynamic range is extremely limited for the typical photometer: » If analyte concentration rises above the calibrated range, the absorbance at the measurement wavelength will be so
strong that the photodiode will detect no light; the system has zero accuracy above this threshold. » If analyte concentration becomes lower than expected, there will be no absorbance at the measurement wavelength and
the photodiode may experience light saturation (just like an overexposed camera sensor) and lose sensitivity.Photometers are not designed to remain accurate during unexpected process conditions, e.g. upset or overload — their perfor-mance is limited to ideal conditions.
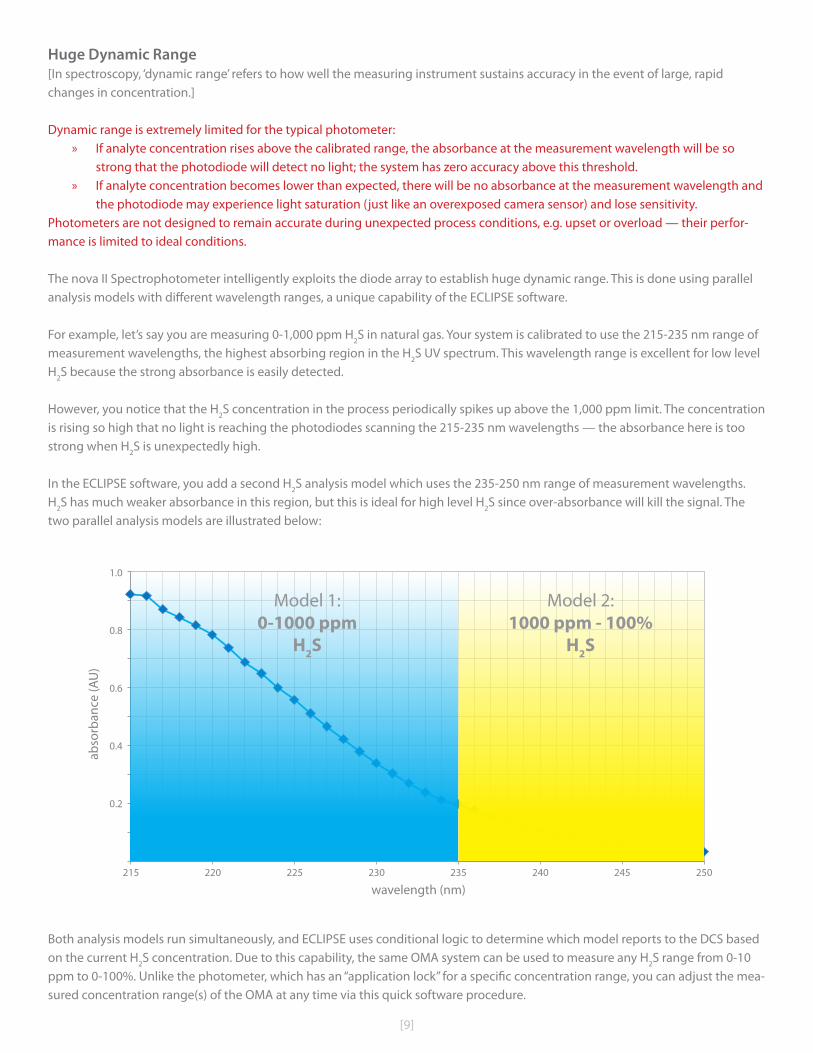
The nova II Spectrophotometer intelligently exploits the diode array to establish huge dynamic range. This is done using parallel analysis models with different wavelength ranges, a unique capability of the ECLIPSE software.
For example, let’s say you are measuring 0-1,000 ppm H2S in natural gas. Your system is calibrated to use the 215-235 nm range of measurement wavelengths, the highest absorbing region in the H2S UV spectrum. This wavelength range is excellent for low level H2S because the strong absorbance is easily detected.
However, you notice that the H2S concentration in the process periodically spikes up above the 1,000 ppm limit. The concentration is rising so high that no light is reaching the photodiodes scanning the 215-235 nm wavelengths — the absorbance here is too strong when H2S is unexpectedly high.
In the ECLIPSE software, you add a second H2S analysis model which uses the 235-250 nm range of measurement wavelengths. H2S has much weaker absorbance in this region, but this is ideal for high level H2S since over-absorbance will kill the signal. The two parallel analysis models are illustrated below:
1.0
0.8
0.6
0.2
0.4
215 250225220
wavelength (nm)
abso
rban
ce (A
U)
0
0.1
0.2
0.3
0.4
0.5
0.6
0.7
0.8
0.9
1
215 220 225 230 235 240 245 250235230 240 245
Model 1:0-1000 ppm
H2S
Model 2:1000 ppm - 100%
H2S
Both analysis models run simultaneously, and ECLIPSE uses conditional logic to determine which model reports to the DCS based on the current H2S concentration. Due to this capability, the same OMA system can be used to measure any H2S range from 0-10 ppm to 0-100%. Unlike the photometer, which has an “application lock” for a specific concentration range, you can adjust the mea-sured concentration range(s) of the OMA at any time via this quick software procedure.
[10]
Unlocked Multi-Component Measurement
Conventional ‘multiwave’ photometers can be set up to measure multiple species. These systems are problematic because they require either (A) multiple, expensive line source lamps that emit the specific measurement wavelength for each species of analysis or (B) a rotating filter wheel which alternates the measurement wavelength by cycling between special component filters.
Neither of these solutions is ideal because of the added cost of replacing multiple lamps or maintaining a high-RPM filter wheel. Additionally, these systems require extra hardware to add each measured chemical and have an “application lock” due to the chemical-specific filters/lamps.
The nova II Spectrophotometer does not depend on physical wavelength isolation or any other data-destructive method; as dem-onstrated in the previous section, filters are applied virtually by telling the software which measurement wavelengths to utilize. This allows the user to add up to 4 measured chemicals (assuming measurable absorbance in the 200-800nm range) to the OMA analyzer at any time via additional software benches without any change to existing hardware. There is no “application lock” due to specialized filters/lamps, so the OMA can be repurposed easily as your process evolves.
All multi-component spectroscopy depends on the principle of additivity: according to Beer’s law, the absorbance at any wavelength of a mixture is equal to the sum of the absorbance of each chemical in the mixture at that wavelength. A multiwave photometer measuring 2 chemicals will perform a rudimentary “2 equations, 2 unknowns” calculation using 2 measurement wavelengths to output the separate absorbance/concentration of each chemical.
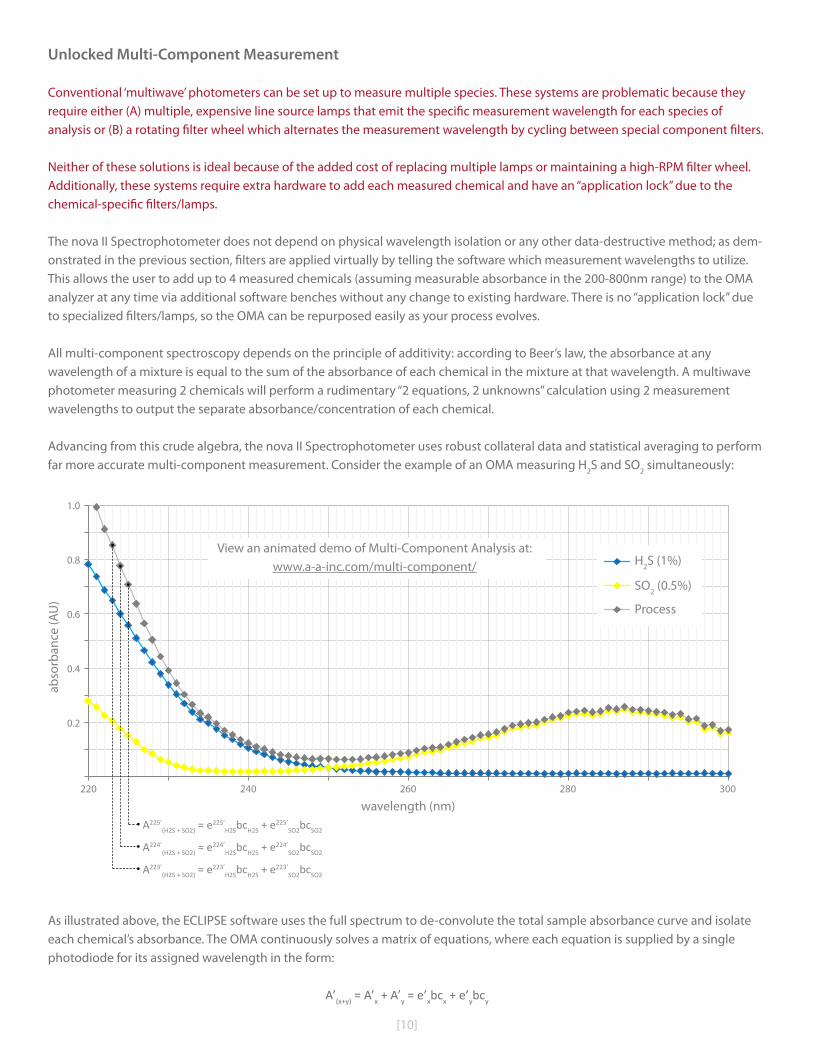
Advancing from this crude algebra, the nova II Spectrophotometer uses robust collateral data and statistical averaging to perform far more accurate multi-component measurement. Consider the example of an OMA measuring H2S and SO2 simultaneously:
As illustrated above, the ECLIPSE software uses the full spectrum to de-convolute the total sample absorbance curve and isolate each chemical’s absorbance. The OMA continuously solves a matrix of equations, where each equation is supplied by a single photodiode for its assigned wavelength in the form:
A’(x+y) = A’x + A’y = e’xbcx + e’ybcy
A225’(H2S + SO2) = e225’
H2SbcH2S + e225’SO2bcSO2
0
0.1
0.2
0.3
0.4
0.5
0.6
0.7
0.8
0.9
1
220 230 240 250 260 270 280 290 300
Abso
rban
ce (A
U)
Wavelength (nm)
H2S 1%
SO2 0.5%
Process
1.0
0.8
0.6
0.2
0.4
abso
rban
ce (A
U)
220 300240
wavelength (nm)260 280
A224’(H2S + SO2) = e224’
H2SbcH2S + e224’SO2bcSO2
A223’(H2S + SO2) = e223’
H2SbcH2S + e223’SO2bcSO2
0
0.1
0.2
0.3
0.4
0.5
0.6
0.7
0.8
0.9
1
220 230 240 250 260 270 280 290 300
Abso
rban
ce (A
U)
Wavelength (nm)
H2S 1%
SO2 0.5%
Process
H2S (1%)
SO2 (0.5%)
Process
View an animated demo of Multi-Component Analysis at:www.a-a-inc.com/multi-component/
[11]
0.00E+00
5.00E-03
1.00E-02
1.50E-02
2.00E-02
2.50E-02
3.00E-02
3.50E-02
4.00E-02
4.50E-02
210 215 220 225 230 235 240 245 250
Abso
rban
ce (A
U)
Wavelength (nm)
NO 20.4 PPM
NO2 61.2 PPM
SO2 125 PPM
where A’ is the absorbance at wavelength ‘, e’ is the molar absorptivity coefficient at wavelength ‘, c is concentration, and b is the path length of the flow cell. In the image above, three such equations (for 223nm, 224nm, and 225nm) are shown. In reality, the matrix includes one equation from every single integer wavelength in the measurement wavelength range.
This robust calculation, performed with each reading, uses the power of confirmation wavelengths and statistical averaging to achieve much higher accuracy in multi-component measurement.
Measuring More than Two Components
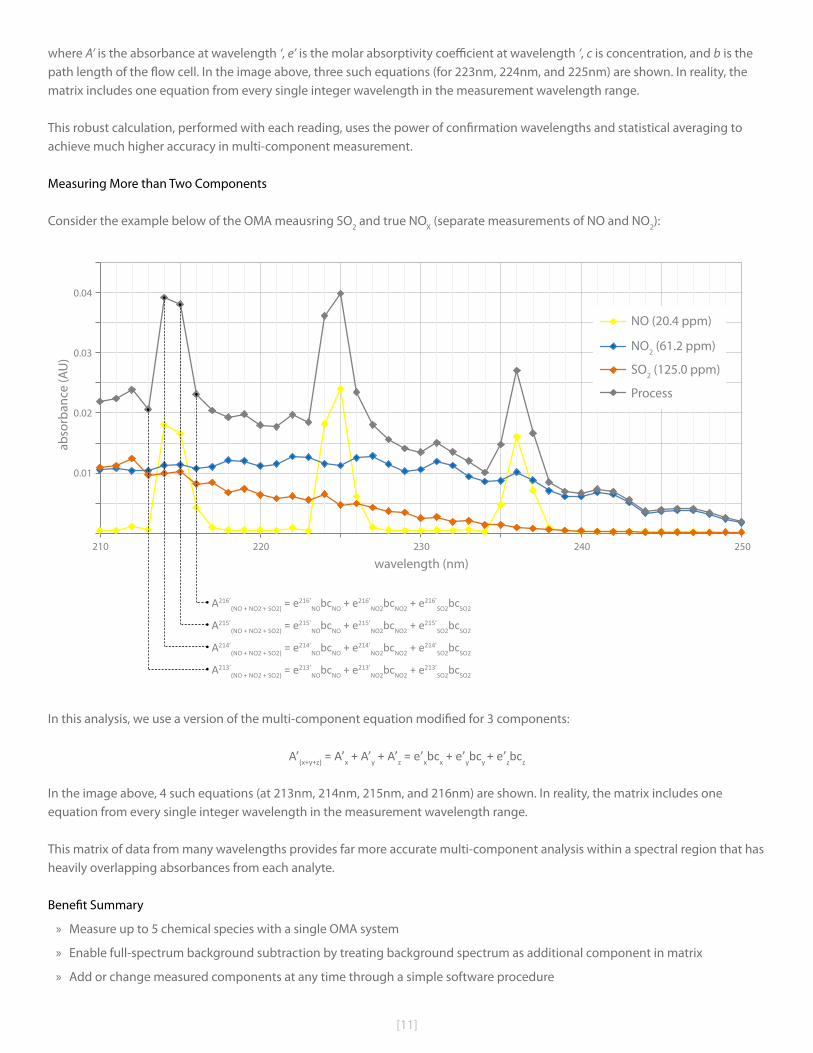
Consider the example below of the OMA meausring SO2 and true NOX (separate measurements of NO and NO2):
A216’(NO + NO2 + SO2) = e216’
NObcNO + e216’NO2bcNO2 + e216’
SO2bcSO2
0.04
0.03
0.01
0.02
abso
rban
ce (A
U)
210 250220
wavelength (nm)230 240
A215’(NO + NO2 + SO2) = e215’
NObcNO + e215’NO2bcNO2 + e215’
SO2bcSO2
A214’(NO + NO2 + SO2) = e214’
NObcNO + e214’NO2bcNO2 + e214’
SO2bcSO2
A213’(NO + NO2 + SO2) = e213’
NObcNO + e213’NO2bcNO2 + e213’
SO2bcSO2
NO (20.4 ppm)
NO2 (61.2 ppm)
SO2 (125.0 ppm)0.00E+00
5.00E-03
1.00E-02
1.50E-02
2.00E-02
2.50E-02
3.00E-02
3.50E-02
4.00E-02
4.50E-02
210 215 220 225 230 235 240 245 250
Abso
rban
ce (A
U)
Wavelength (nm)
NO 20.4 PPM
NO2 61.2 PPM
SO2 125 PPM
0.00E+00
5.00E-03
1.00E-02
1.50E-02
2.00E-02
2.50E-02
3.00E-02
3.50E-02
4.00E-02
4.50E-02
210 215 220 225 230 235 240 245 250
Abso
rban
ce (A
U)
Wavelength (nm)
NO 20.4 PPM
NO2 61.2 PPM
SO2 125 PPM
0.00E+00
5.00E-03
1.00E-02
1.50E-02
2.00E-02
2.50E-02
3.00E-02
3.50E-02
4.00E-02
4.50E-02
210 215 220 225 230 235 240 245 250
Abso
rban
ce (A
U)
Wavelength (nm)
NO 20.4 PPM
NO2 61.2 PPM
SO2 125 PPM
Process0.00E+00
5.00E-03
1.00E-02
1.50E-02
2.00E-02
2.50E-02
3.00E-02
3.50E-02
4.00E-02
4.50E-02
210 215 220 225 230 235 240 245 250
Abso
rban
ce (A
U)
Wavelength (nm)
NO 20.4 PPM
NO2 61.2 PPM
SO2 125 PPM
In this analysis, we use a version of the multi-component equation modified for 3 components:
A’(x+y+z) = A’x + A’y + A’z = e’xbcx + e’ybcy + e’zbcz
In the image above, 4 such equations (at 213nm, 214nm, 215nm, and 216nm) are shown. In reality, the matrix includes one equation from every single integer wavelength in the measurement wavelength range.
This matrix of data from many wavelengths provides far more accurate multi-component analysis within a spectral region that has heavily overlapping absorbances from each analyte.
Benefit Summary
» Measure up to 5 chemical species with a single OMA system
» Enable full-spectrum background subtraction by treating background spectrum as additional component in matrix
» Add or change measured components at any time through a simple software procedure
[12]
The OMA Series
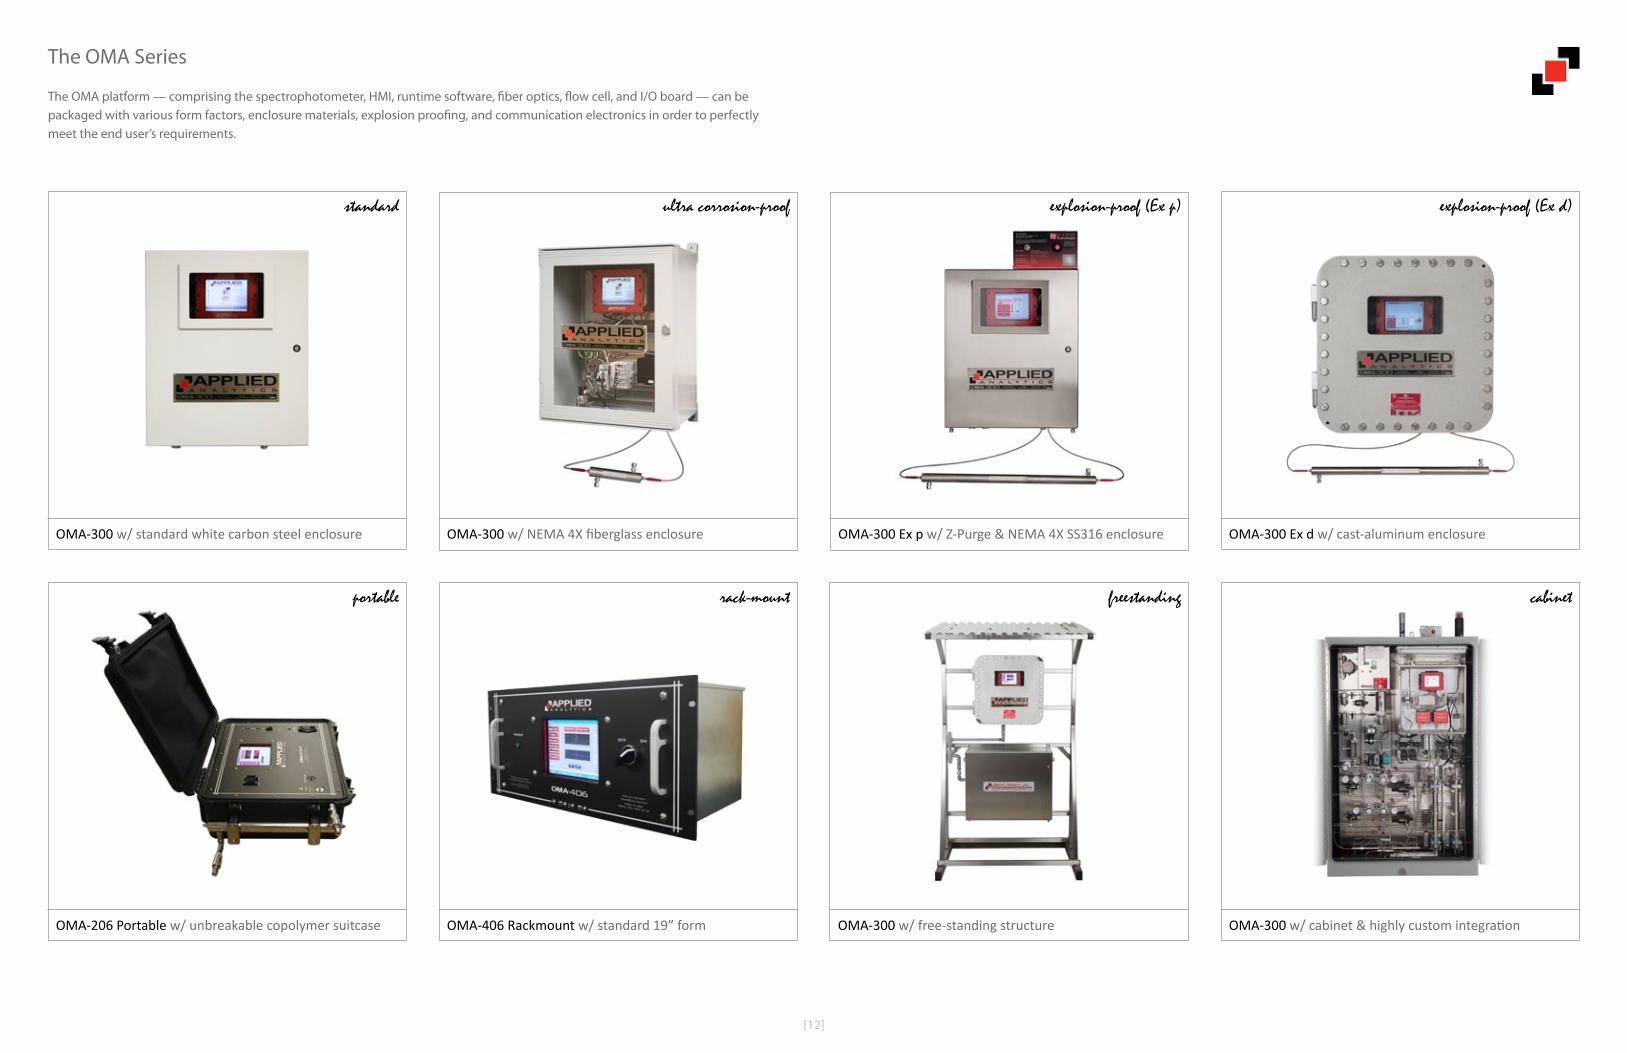
The OMA platform — comprising the spectrophotometer, HMI, runtime software, fiber optics, flow cell, and I/O board — can be packaged with various form factors, enclosure materials, explosion proofing, and communication electronics in order to perfectly meet the end user’s requirements.
OMA-300 w/ standard white carbon steel enclosure OMA-300 w/ NEMA 4X fiberglass enclosure OMA-300 Ex p w/ Z-Purge & NEMA 4X SS316 enclosure OMA-300 Ex d w/ cast-aluminum enclosure
OMA-206 Portable w/ unbreakable copolymer suitcase OMA-406 Rackmount w/ standard 19” form OMA-300 w/ free-standing structure OMA-300 w/ cabinet & highly custom integration
standard ultra corrosion-proof explosion-proof (Ex p) explosion-proof (Ex d)
portable rack-mount freestanding cabinet
[13]
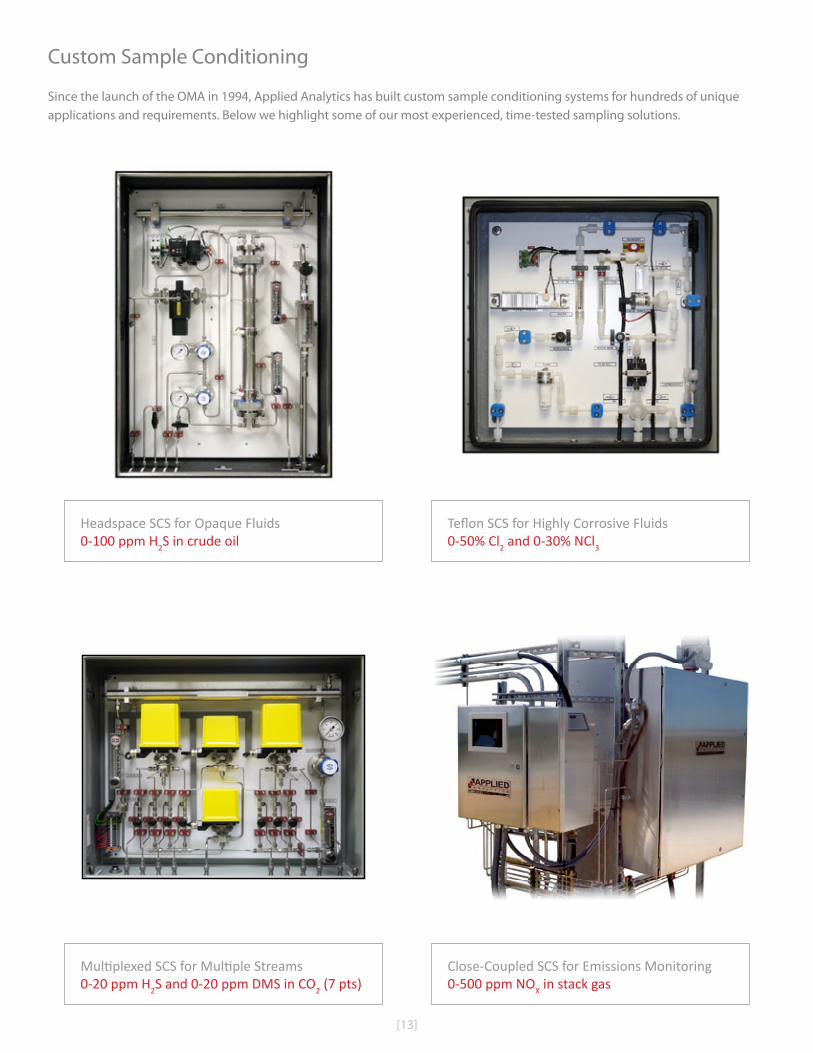
Custom Sample Conditioning
Since the launch of the OMA in 1994, Applied Analytics has built custom sample conditioning systems for hundreds of unique applications and requirements. Below we highlight some of our most experienced, time-tested sampling solutions.
Headspace SCS for Opaque Fluids0-100 ppm H2S in crude oil
Teflon SCS for Highly Corrosive Fluids0-50% Cl2 and 0-30% NCl3
Multiplexed SCS for Multiple Streams0-20 ppm H2S and 0-20 ppm DMS in CO2 (7 pts)
Close-Coupled SCS for Emissions Monitoring0-500 ppm NOX in stack gas
[14]
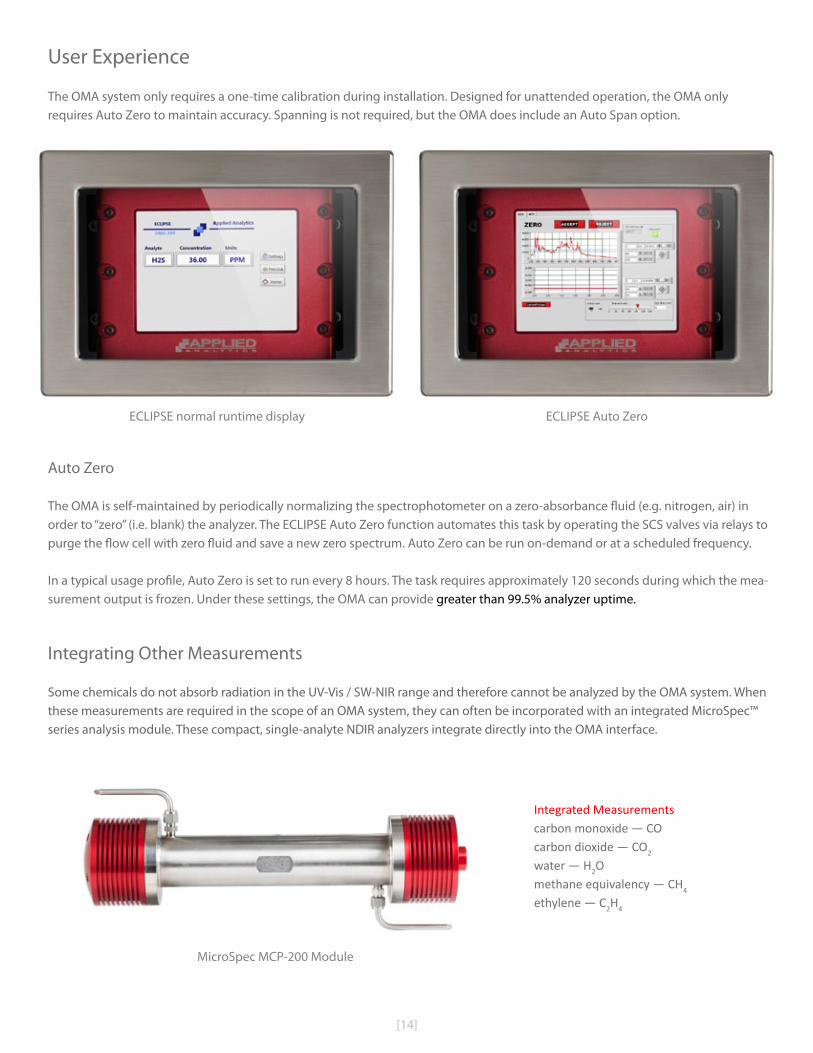
User Experience
The OMA system only requires a one-time calibration during installation. Designed for unattended operation, the OMA only requires Auto Zero to maintain accuracy. Spanning is not required, but the OMA does include an Auto Span option.
ECLIPSE normal runtime display ECLIPSE Auto Zero
Auto Zero
The OMA is self-maintained by periodically normalizing the spectrophotometer on a zero-absorbance fluid (e.g. nitrogen, air) in order to “zero” (i.e. blank) the analyzer. The ECLIPSE Auto Zero function automates this task by operating the SCS valves via relays to purge the flow cell with zero fluid and save a new zero spectrum. Auto Zero can be run on-demand or at a scheduled frequency.
In a typical usage profile, Auto Zero is set to run every 8 hours. The task requires approximately 120 seconds during which the mea-surement output is frozen. Under these settings, the OMA can provide greater than 99.5% analyzer uptime.
Integrating Other Measurements
Some chemicals do not absorb radiation in the UV-Vis / SW-NIR range and therefore cannot be analyzed by the OMA system. When these measurements are required in the scope of an OMA system, they can often be incorporated with an integrated MicroSpec™ series analysis module. These compact, single-analyte NDIR analyzers integrate directly into the OMA interface.
MicroSpec MCP-200 Module
Integrated Measurementscarbon monoxide — COcarbon dioxide — CO2
water — H2Omethane equivalency — CH4
ethylene — C2H4
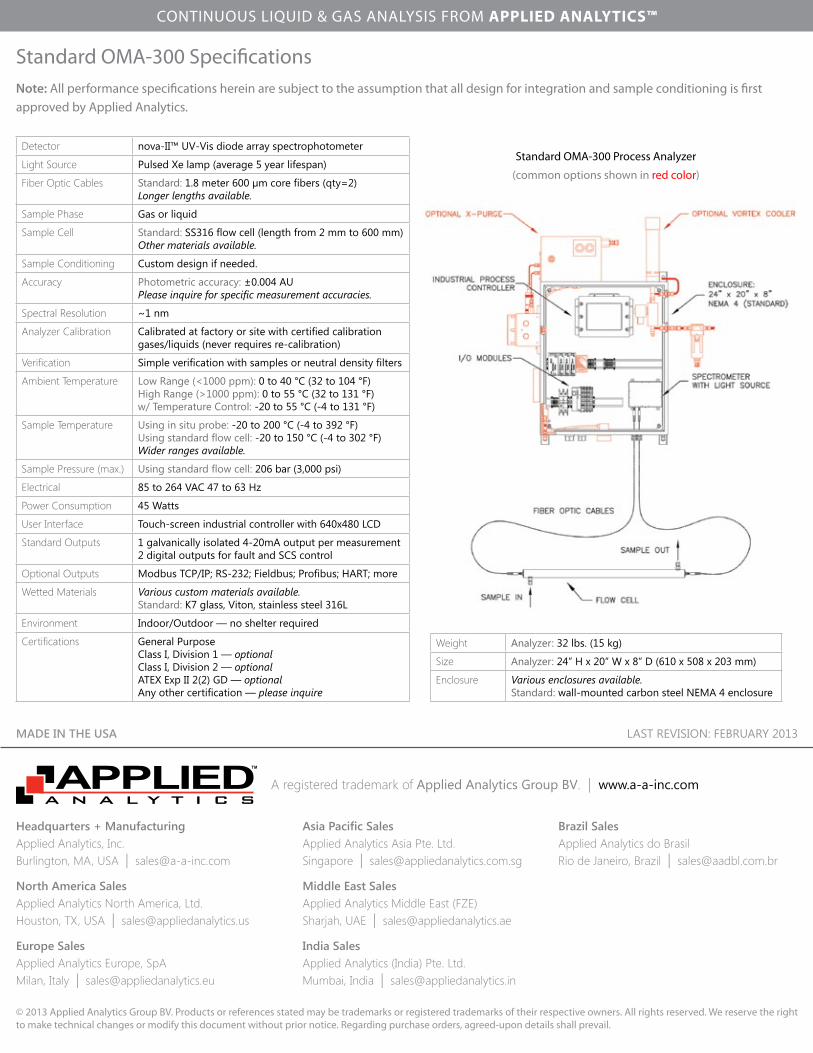
Standard OMA-300 SpecificationsNote: All performance specifications herein are subject to the assumption that all design for integration and sample conditioning is first approved by Applied Analytics.
A registered trademark of Applied Analytics Group BV. | www.a-a-inc.com
© 2013 Applied Analytics Group BV. Products or references stated may be trademarks or registered trademarks of their respective owners. All rights reserved. We reserve the right to make technical changes or modify this document without prior notice. Regarding purchase orders, agreed-upon details shall prevail.
LAST REVISION: FEBRUARY 2013MADE IN THE USA
Europe SalesApplied Analytics Europe, SpAMilan, Italy | [email protected]
Headquarters + ManufacturingApplied Analytics, Inc.Burlington, MA, USA | [email protected]
North America SalesApplied Analytics North America, Ltd.Houston, TX, USA | [email protected]
Middle East SalesApplied Analytics Middle East (FZE)Sharjah, UAE | [email protected]
Asia Pacific SalesApplied Analytics Asia Pte. Ltd.Singapore | [email protected]
India SalesApplied Analytics (India) Pte. Ltd.Mumbai, India | [email protected]
Brazil SalesApplied Analytics do BrasilRio de Janeiro, Brazil | [email protected]
Standard OMA-300 Process Analyzer
(common options shown in red color)
Detector nova-II™ UV-Vis diode array spectrophotometer
Light Source Pulsed Xe lamp (average 5 year lifespan)
Fiber Optic Cables Standard: 1.8 meter 600 µm core fibers (qty=2)Longer lengths available.
Sample Phase Gas or liquid
Sample Cell Standard: SS316 flow cell (length from 2 mm to 600 mm)Other materials available.
Sample Conditioning Custom design if needed.
Accuracy Photometric accuracy: ±0.004 AUPlease inquire for specific measurement accuracies.
Spectral Resolution ~1 nm
Analyzer Calibration Calibrated at factory or site with certified calibration gases/liquids (never requires re-calibration)
Verification Simple verification with samples or neutral density filters
Ambient Temperature Low Range (<1000 ppm): 0 to 40 °C (32 to 104 °F)High Range (>1000 ppm): 0 to 55 °C (32 to 131 °F)w/ Temperature Control: -20 to 55 °C (-4 to 131 °F)
Sample Temperature Using in situ probe: -20 to 200 °C (-4 to 392 °F)Using standard flow cell: -20 to 150 °C (-4 to 302 °F)Wider ranges available.
Sample Pressure (max.) Using standard flow cell: 206 bar (3,000 psi)
Electrical 85 to 264 VAC 47 to 63 Hz
Power Consumption 45 Watts
User Interface Touch-screen industrial controller with 640x480 LCD
Standard Outputs 1 galvanically isolated 4-20mA output per measurement 2 digital outputs for fault and SCS control
Optional Outputs Modbus TCP/IP; RS-232; Fieldbus; Profibus; HART; more
Wetted Materials Various custom materials available.Standard: K7 glass, Viton, stainless steel 316L
Environment Indoor/Outdoor — no shelter required
Certifications General PurposeClass I, Division 1 — optionalClass I, Division 2 — optionalATEX Exp II 2(2) GD — optionalAny other certification — please inquire
Weight Analyzer: 32 lbs. (15 kg)
Size Analyzer: 24” H x 20” W x 8” D (610 x 508 x 203 mm)
Enclosure Various enclosures available.Standard: wall-mounted carbon steel NEMA 4 enclosure
CONTINUOUS LIQUID & GAS ANALYSIS FROM APPLIED ANALYTICS™